experimental investigation concerning the effect of mass
TRANSCRIPT

RSC Advances
PAPER
Ope
n A
cces
s A
rtic
le. P
ublis
hed
on 3
0 Ja
nuar
y 20
17. D
ownl
oade
d on
12/
5/20
21 1
0:24
:57
AM
. T
his
artic
le is
lice
nsed
und
er a
Cre
ativ
e C
omm
ons
Attr
ibut
ion
3.0
Unp
orte
d L
icen
ce.
View Article OnlineView Journal | View Issue
Experimental inv
aNuclear Fuel Cycle Research School, Nu
Institute, P. O. Box: 11365-8486, Tehran,
+98-21-88220473bSchool of Chemical Engineering, College of
Box: 11155-4563, Tehran, Iran
Cite this: RSC Adv., 2017, 7, 8908
Received 3rd December 2016Accepted 23rd January 2017
DOI: 10.1039/c6ra27723c
rsc.li/rsc-advances
8908 | RSC Adv., 2017, 7, 8908–8921
estigation concerning the effect ofmass transfer direction on mean drop size andholdup in a horizontal pulsed plate extractioncolumn
Farhad Panahinia,a Mohammad Ghannadi-Maragheh,a Jaber Safdari,*a Pouria Amanib
and Mohammad-Hassan Mallaha
Vertical extraction columns meet the needs of industrial applications, but when height limitation (especially
in indoor applications) is a concern it is required to use horizontal columns. Considering the significant role
of mass transfer in the sizing and scale-up of horizontal extraction columns, no analytical and experimental
investigations have been conducted in this regard. In the present research, the effect of operating
parameters including pulsation intensity and phase flow rates on the mean drop size and the dispersed
phase holdup values was investigated in a horizontal pulsed sieve-plate column under both mass transfer
directions for the toluene–acetone–water, n-butyl acetate–acetone–water and butanol–acetone–water
systems. The results show that holdup decreases first and then increases with an increase of pulsation
intensity. Increasing dispersed phase velocity also increases holdup. The mean drop size decreases with
an increment of pulsation intensity, whereas flow rates of both phases have little impact. Moreover, it is
observed that the presence of mass transfer significantly affects the mean drop size and holdup. Finally,
new correlations were proposed for the prediction of mean drop size and holdup based on operating
variables and physical properties of the systems with and without mass transfer. Average Absolute
Relative Error (AARE) of the correlations was between about 6.83–15.38% for their optimized constants.
1. Introduction
Solvent extraction is a classical method encountered in manyindustrial applications such as chemical, pharmaceutical envi-ronmental, oil, food, nuclear, and hydrometallurgical sectorsfor product purication and raw material recovery.1,2 Thisprocess is used typically when working with other separationmethods such as distillation, evaporation and crystallization isnot possible.3 To enhance the performance of extraction, manyinvestigations have been implemented which have led to theintroduction and development of a class of liquid–liquid con-tactors in which mechanical agitation is provided to increasethe interfacial area between the two liquid phases. One type ofthese contactors is the pulsed sieve-plate extraction column,which requires external energy input in the form of pulsingmotion usually sinusoidal superimposed on counter-currentow of the liquid phases. This pulsation provides high turbu-lence which assists in drop breakage. Consequently, the largeinterfacial area is obtained to get high mass transfer
clear Science and Technology Research
Iran. E-mail: [email protected]; Tel:
Engineering, University of Tehran, P. O.
coefficient.4 Generally, pulsed columns compared to mixer-settlers, which commonly employ in the mining industry, aredesirable from both safety and economic perspective, inparticular their higher throughput, less space consumption, nointernal moving parts, minimum leakage, and simplicity ofdesign. The advantages are more benecial especially whileprocessing corrosive or radioactive solutions since the pulsingunit can be remote from the column. Pulsed sieve-platecolumns can be divided into the vertical and horizontal con-tactors, and each has advantages and disadvantages that it isimportant to look for the specic process. Some investigationshave focused on the main features of the horizontal and verticaltypes of extraction columns in identical conditions5–9 whichshow that the merits of vertical pulsed columns are more thanhorizontal ones. However, for some reasons horizontal pulsedcolumns are more desirable such as their higher performancein limited area.5,8,10
One of the key parameters in the design and optimization ofpulsed columns is the mean drop diameter.11 Because it isinclusive with the interfacial area between the two phases forthe mass transfer and it eases of modeling and calculation ofcolumn throughput ensues. Moreover, drop size highly affectsthe residence time of the dispersed phase, the velocity of therising drops, holdup, consequently the maximum throughput
This journal is © The Royal Society of Chemistry 2017

Paper RSC Advances
Ope
n A
cces
s A
rtic
le. P
ublis
hed
on 3
0 Ja
nuar
y 20
17. D
ownl
oade
d on
12/
5/20
21 1
0:24
:57
AM
. T
his
artic
le is
lice
nsed
und
er a
Cre
ativ
e C
omm
ons
Attr
ibut
ion
3.0
Unp
orte
d L
icen
ce.
View Article Online
of the column and together with the holdup, it determines theinterfacial area available for mass transfer.12–15
Similar to drop size, dispersed phase holdup is an importantdesign parameter affecting the column dimension, and also theoverall mass transfer coefficient. The dispersed-phase holdup(4) can be dened as the volume fraction of the extractioncolumn which is occupied by the dispersed phase:
4 ¼ vd
ðvd þ vc Þ (1)
where vd is the dispersed phase volume and vc is the continuousphase volume. Values of holdup can be used for the determi-nation of the ooding velocity16,17 and it is completely related tothe overall mass transfer coefficients in the following manner:
KEa ¼ KE
�64
d32
�(2)
KRa ¼ KR
�64
d32
�(3)
where KE and KR are the overall mass transfer coefficients basedon the extract and raffinate phases, respectively, a is the inter-facial specic surface area (m2 m�3), d32 is Sauter mean diam-eter (m) and 4 is the dispersed phase holdup. Therefore, it canbe concluded from the literature, drop size and holdup are twokey parameters to understand the hydrodynamic of the extrac-tion column.
Numerous investigations have been carried out on theimpact of the column geometry in pulsed extractioncolumns.18–20 It was achieved that the column diameter isalmost ineffective on the mean drop size and the variation ofdrop sizes are more intense in initial internal plates. Due to theimportance of mean drop size, many researches were imple-mented on the impact of operating variables including thepulsation intensity (Af) and ow rates of the dispersed and thecontinuous phases on drop size as well as introducing correla-tions for prediction of mean drop size in pulsedcolumns.10,12,13,21–31 Moreover, the evaluation of the dispersedphase holdup in different conditions is also studied by manyinvestigators.5,16,26,29,32–38
In the absence of pulsation, interfacial tension and buoyancyare the cause of the drop breakage,13,20 while in the presence ofpulsation, a smaller drop is formed as a consequence of anintensied collision between the drops and the internal platesand the internal wall, which causes a higher breakagerate.10,30,39,40 Also it is achieved that increasing the ow rate ofboth phases lead to a slight increase in mean drop diameterwhich was in accordance with other studies.18,25,29,30,41
According to literature, an increase in the fractional free areaor plate spacing reduces the shear forces on drops resulting inan increase in drop size which leads to reduction in holdup.Holdup is a strong function of the dispersed phase velocity (Vd)and an increase in Vd increases holdup.4,42However, the effect ofcontinuous phase velocities (Vc) on holdup has been found benegligible.43,44 Yadav and Patwardhan20 presented a well reviewon the design aspects of pulsed sieve-plate columns, consid-ering investigations on ow regimes in pulsed plate columns,
This journal is © The Royal Society of Chemistry 2017
ooding characterization, drop size, holdup and mass transferas well as comparing proposed correlations for these variables.However, in spite of extensive work and various correlationswhich are available in the literature related to these hydrody-namic parameters in the vertical pulsed sieve-plate columns,the investigations on the horizontal pulsed sieve-plate columnsare scarce. In particular, Khajenoori et al.,10 have studied theeffect of operating parameters on the drop size as well as dropsize distribution in a horizontal pulsed sieve-plate column andproposed a correlation for prediction of mean drop size anddrop size distribution as a function of physical properties andoperating parameters in the absence of mass transfer. More-over, slip and characteristic velocities of both phases have beenstudied by the same author.45
Considering the signicant role of mass transfer in thesizing of extraction columns, no analytical and experimentalinvestigations have been conducted into the impact of masstransfer direction on the mean drop size and dispersed phaseholdup for the horizontal sieve-plate columns. Therefore, pre-senting a reliable estimation of the mean drop size as well asholdup for this type of column in different operating conditionsis needed. In this work, the Sauter-mean diameter and holdupvalue with the mass transfer in both directions have beeninvestigated in a horizontal pulsed plate column. The effects ofoperating parameters including pulsation intensity and owrates of the continuous and dispersed phases on drop size andthe dispersed phase holdup have been studied. In addition,a theoretical–experimental correlation for Sauter drop size aswell as holdup in terms of the operating conditions and thephysical properties of chemical systems is proposed.
2. Experimental2.1. Description of equipment
Experiments were carried out in a semi-industrial pulsed sieve-plate column. A glass pulsed column in horizontal position withan internal diameter of 6.2 cm and length of the active area of146 cm was used in these experiments. The active part ofcolumn was a pipe housing an internal plate cartridge con-sisting of 25 pairs of sieve plates constructed from stainlesssteel 304. The plates are half-perforated and the holes laid ontriangular pitch of 4 mm. The pulsation applied to the liquid bythe pressure of air compressor and controlled by two solenoidvalves. Due to counter-current ow of two liquid phases, each ofthem in the opposite direction of another side columns areimported so that the light phase interred in direction ofapplying pulsation. To control the liquid level in the columnand regulate the discharge of heavy phase, an optical sensor inthe collecting tank, in the output of the light phase, isembedded. Two settlers at both ends of the column wereemployed to separate the two liquid phases. The inlet and outletstreams of the column were connected to four tanks, each of 25liters capacity. The ow rates of the two phases were measuredby two rotameters. For more information, the column charac-teristics are listed in Table 1. Also, a schematic diagram ofexperimental apparatus is shown in Fig. 1.
RSC Adv., 2017, 7, 8908–8921 | 8909

Table 1 Geometrical characteristics of the column used
Characteristics Values
Column length (m) 1.46Column diameter (cm) 6.2Material of construction the column GlassUpper and lower settler diameter (cm) 9Lower settler length (cm) 30Upper settler length (cm) 60Material used for plates, spacers and rod Stainless steelHoles pitch (mm) 4Holes diameter (mm) 2Plates thickness (mm) 1Plate spacing (cm) 1a, 5b
Average free area of the plates (%) 0.11
a Spacing between two individual plates in a cell. b Spacing between twoadjacent cells.
RSC Advances Paper
Ope
n A
cces
s A
rtic
le. P
ublis
hed
on 3
0 Ja
nuar
y 20
17. D
ownl
oade
d on
12/
5/20
21 1
0:24
:57
AM
. T
his
artic
le is
lice
nsed
und
er a
Cre
ativ
e C
omm
ons
Attr
ibut
ion
3.0
Unp
orte
d L
icen
ce.
View Article Online
2.2. Chemical system
Three liquid–liquid systems were chosen to cover a wide range ofvalues of interfacial tension (1.5–30 mN m�1). The chemicalsystem used for testing were toluene, n-butyl acetate and butanolas the light phase (dispersed phase) and distillated water as theheavy phase (continuous phase) with 3% volume fraction ofacetone dissolved in each of the phases regarding the considereddirection ofmass transfer. Technical grade solvents of at least 99.5wt% purity were used as the dispersed phase and all experimentswere carried out at the temperature 20 �C. The physical propertiesof these systems are listed in Table 2. The viscosities of bothphases are measured by a laboratory LAUDA viscometer. Thedensities are determined by use of a scale in order of 0.0001 g. Itshould be noted that, under mass transfer conditions, a degree ofuncertainty surrounds the estimation of physical properties(particularly interfacial tension), since these vary not only with theinlet solute concentrations, but also along the column. In the
Fig. 1 A schematic diagram of the horizontal pulsed sieve plate column
8910 | RSC Adv., 2017, 7, 8908–8921
present research, the values of physical properties have beenassumed to correspond to the mean values of acetone concen-tration in the continuous and dispersed phases. The mean valueof acetone concentration was obtained by averaging the valuesobtained at the inlet and outlet of the column.
2.3. Analytic procedure
Initially, both phases were mutually saturated each other beforeadding acetone in order to avoid the excessive dissolution of thedispersed phase into the continuous phase. This is a very essentialstep in the experiments since the volume fraction of acetone is 3%and the excessive dissolution of each phase to the other liquidmight signicantly affect the hydrodynamic and mass transferperformance of the column. Aer complete separation, they weretransferred to the feed tanks. At the beginning of each run, thecolumn was lled completely with distillated water. Dispersedphase was then entered to the column. Aer adjusting the owrate of each phase based on the operating conditions, the pulsa-tion intensity with specied amplitude and frequency was appliedto the setup. All experiments were carried out under oodingconditions and sufficient time, 60–120 min depending on thephase ow rates and the particular liquid–liquid system used wasprovided for reaching the steady state conditions.
Drop size was measured by taking digital images of thecontents of the column using a Nikon D3100 camera. Drop sizeswere measured on the 5 stages of the column which were equi-distant from each other. To calculate the size of drops, imageswere analyzed by AutoCAD soware. Indeed, the diameter of thecolumn and the distance between two plates were set on theirknown values to provide a coordinate grid formeasuring the dropsizes. 300 drops were analyzed in each experimental condition. Apicture of drops, for instance, is shown in Fig. 2.
The most commonly-used representative diameter whichused to study the mean drop size in the solvent extraction
.
This journal is © The Royal Society of Chemistry 2017

Table 2 Physical properties of chemical systems used at 20 �C
Physical property
3% volume fraction of acetone as mass transfer agent
Toluene–acetone–water Butyl acetate–acetone–water n-Butanol–acetone–water
rc (kg m�3) 988.3–996.8 989.3–997.6 987.6–997.1rd (kg m�3) 861.2–865.2 876.9–882.3 837.9–848.3mc (mPa s) 1.03–1.2 1.07–1.16 1.12–1.31md (mPa s) 0.56–0.58 0.7–0.74 3.26–3.34s (mN m�1) 20.5–33.2 10.9–13.2 1.5–1.9
Fig. 2 Picture of drop size in the horizontal pulsed sieve plate column(c / d).
Fig. 3 Effect of pulsation intensity on the mean drop size at constantdispersed and continuous phase flow rates of 2.1 and 5 l h�1.
Paper RSC Advances
Ope
n A
cces
s A
rtic
le. P
ublis
hed
on 3
0 Ja
nuar
y 20
17. D
ownl
oade
d on
12/
5/20
21 1
0:24
:57
AM
. T
his
artic
le is
lice
nsed
und
er a
Cre
ativ
e C
omm
ons
Attr
ibut
ion
3.0
Unp
orte
d L
icen
ce.
View Article Online
columns is Sauter mean diameter. The Sauter mean diameter(d32) was calculated at the experimental conditions by using thefollowing relation:
d32 ¼
Xni¼1
nidi3
Xni¼1
nidi2
0BBB@
1CCCA (4)
where ni is the number of drops with diameter di. The observeddrops havemainly spherical shapes, but in some cases ellipsoidalshapes were observed which characterized through measuringtheir major axis (dH), and their minor axis (dL), representing thelargest distance between two points on a drop and the largestlength of a line, at an angle of 90� to the major axis. Accordingly,in order to measure the drop distortion, the drop diameter withan equivalent sphere was determined by eqn (5) as follows:
di ¼ffiffiffiffiffiffiffiffiffiffiffiffiffiffiffiffidH;i
2dL;i3
q(5)
During measurements of drop sizes, each measurement wasrepeated three times and the average value was considered toguarantee the statistical signicance of the determined variables.
Furthermore, the dispersed phase holdup was measured usinga shutdown method. Based on this technique, the column wasallowed to operate at the desired conditions until steady state wasreached, aer which the ow rates and pulsation were simulta-neously stopped. Since the ow resistance through the plates waslarger than the driving buoyancy forces, the liquid presented ineach cell was effectively trapped. Therefore, aer complete settle-ment of phases, the volume fraction occupied by each phase wasdetermined by measuring the arc length of the part of thecircumference wetted by the phases. The cord length at theinterface (Li) was calculated from this measurement:
This journal is © The Royal Society of Chemistry 2017
Li ¼ 2ri cos
�1
2
�p� S
ri
��(6)
where ri is the radius and S is the circumference. The holdup ofthe dispersed phase can then be determined from the cordlength as follows:
40 ¼A0
pri2(7)
where
A0 ¼ 1
2pri
2 � ri2 cos�1
�Li
2ri
�� Li
2
�ri2 � x2
�12
The Average Absolute Relative Error (AARE) was used as anobjective function to calculate the tted parameters:
AARE ¼ 1
n
Xni¼1
jXiðexp:Þ � Xiðtheo:ÞjXiðexp:Þ (8)
where n is the number of data points, and Xi (exp.) and Xi (theo.)represent the experimental and theoretical data, respectively.
3. Results and discussion3.1. Study of Sauter mean diameter
It is clear that drop diameter depends upon the rate of dropbreakage and coalescence. Due to the turbulence produced by
RSC Adv., 2017, 7, 8908–8921 | 8911

RSC Advances Paper
Ope
n A
cces
s A
rtic
le. P
ublis
hed
on 3
0 Ja
nuar
y 20
17. D
ownl
oade
d on
12/
5/20
21 1
0:24
:57
AM
. T
his
artic
le is
lice
nsed
und
er a
Cre
ativ
e C
omm
ons
Attr
ibut
ion
3.0
Unp
orte
d L
icen
ce.
View Article Online
the pulsation, the drops will be driven through the plateperforations along with hitting of drops with the wall and plateholes which leads to smaller drops. On the other hand, thecoalescence will induce rectication of liquid drops into largerones. The main operating parameters found to inuence meandrop are the phase ow rates and pulsation intensity. The effectof pulsation intensity on Sauter-mean drop diameter at bothmass transfer directions is shown in Fig. 3. It is clear that dropsproduced from the high interfacial tension system (toluene–acetone–water) is larger than those produced from the mediumand lower interfacial tension systems. It can also be observedthat the effect of pulsation intensity on the mean drop size ofhigh interfacial tension system is larger than that of othersystems. Drops become smaller with the increase of pulsationintensity due to intense collision of the organic phase with traysand column wall and breaking into the smaller drops.Regarding to the mass transfer direction, it is clear that largerdrops will be produced in the direction from the dispersedphase to the continuous phase, which are achieved in allsystems. Also, the effects of pulsation intensity on the meandrop size are similar in both directions which means that theimpact of pulsation intensity is effectless of the direction ofmass transfer.
Furthermore, in another investigation by Khajenoori et al.,10
the effect of operating parameters on the mean drop size wasstudied which their results are compared with the experimentaldata from this work due to the same column used in bothstudies. For instance, the variation of mean drop size versuspulsation intensity obtained from this work and Khajenooriet al.,10 for constant dispersed and continuous phase ow ratesof 2.1 and 5 l h�1 is illustrated in Fig. 4. The results show thatthe presence of mass transfer highly affects the mean drop sizein following manner:
� The presence of solute (3% volume fraction of acetonedissolved in each of the phases is considered in this study) isalong with the evolution of the interfacial tension. According toMısek et al.,46 the interfacial tension declines with increasing
Fig. 4 Variation of mean drop size versus pulsation intensity underdifferent mass transfer conditions obtained from this work and Kha-jenoori et al.,10 at constant dispersed and continuous phase flow ratesof 2.1 and 5 l h�1.
8912 | RSC Adv., 2017, 7, 8908–8921
the solute concentration. Therefore, it is almost impossible todetermine the drop breakage via the constant interfacialtension in the presence of mass transfer, whereas the gradientof interfacial tension is of most importance.
� When there is mass transfer from the continuous phase tothe dispersed phase, smaller drops are produced in comparisonto the same condition without mass transfer. In fact, because ofthe consequent interfacial tension gradient, the interfacemovement of the drop and the inner circulation generated intothe drop gain the same direction. Therefore, this mass transferdirection leads to an increase in the interface deformations,consequent deformation of drops and higher drop breakage.
� When mass transfer occurs from the dispersed phase intothe continuous phase, larger drops are observed in comparisonto the same condition without mass transfer and with thereverse direction of the mass transfer. It is expected due to theopposite interfacial tension gradient compared to the reversedirection of the mass transfer. Therefore, in this case, the dropsare consequently more stable than the former case. The effect ofmass transfer direction on the mean drop size with increasingthe pulsation intensity for the toluene–acetone–water system isshown in Fig. 4.
The effect of dispersed phase ow rate on the mean drop sizein both directions of mass transfer is shown in Fig. 5. Increasingthe ow rate of the dispersed phase leads to an increase in thedrop size. With respect to Fig. 3, the impact of dispersed phaseow rate is found to be weaker than the inuence of pulsationintensity on the mean drop size. The increase of drop size maybe attributed to an increase in the coalescence rate due to thelarger values of the dispersed phase holdup that are observed asthe dispersed phase ow rate increases. From Fig. 5 also can befound that the drop size with mass transfer direction from thedispersed phase to the continuous phase is larger than that withthe one determined in the inverse mass transfer direction.
The effect of continuous phase ow rate on Sauter-meandrop size with both mass transfer directions is illustrated inFig. 6. It is observed that the mean drop diameter slightly
Fig. 5 Effect of the dispersed phase flow rate on themean drop size atconstant pulsation intensity of 0.8 cm s�1 and the continuous phaseflow rate of 5 l h�1 for different liquid–liquid systems in the presence ofmass transfer in both directions.
This journal is © The Royal Society of Chemistry 2017

Fig. 6 Effect of the continuous phase flow rate on the mean drop sizeat constant pulsation intensity of 0.8 cm s�1 and the dispersed phaseflow rate of 2.1 l h�1 for different liquid–liquid systems in the presenceof mass transfer in both directions.
Fig. 7 Effect of pulsation intensity on the dispersed holdup at constantdispersed and continuous flow rates of 2.1 and 5 l h�1 for differentchemical systems in the presence of mass transfer in both directions.
Fig. 8 Effect of the dispersed phase flow rate on the dispersed holdupat constant pulsation intensity of 0.8 cm s�1 and the continuous phaseflow rate of 5 l h�1 for different chemical systems in the presence ofmass transfer in both directions.
Paper RSC Advances
Ope
n A
cces
s A
rtic
le. P
ublis
hed
on 3
0 Ja
nuar
y 20
17. D
ownl
oade
d on
12/
5/20
21 1
0:24
:57
AM
. T
his
artic
le is
lice
nsed
und
er a
Cre
ativ
e C
omm
ons
Attr
ibut
ion
3.0
Unp
orte
d L
icen
ce.
View Article Online
increases with an increase in the continuous phase ow rate. Itis because of the fact that higher ow rate provides longerresidence time due to the reduction of slip velocity between thedrops and the continuous phase, which leads to higher proba-bility for drop coalescence, and consequently producing largerdrops.
Fig. 9 Effect of the continuous phase flow rate on the dispersed phaseholdup at constant pulsation intensity of 0.8 cm s�1 and the dispersedphase flow rate of 2.1 l h�1 for different chemical systems in thepresence of mass transfer in both directions.
3.2. Study of holdup
Dispersed phase holdup is necessary for calculating the inter-facial area and the slip velocity of phases. It also indicates theonset of ooding. Dispersed phase holdup is a function ofoperating parameters such as pulsation intensity and ow ratesof both phases which is investigated in the following.
The inuence of pulsation intensity on the dispersed phaseholdup with both mass transfer directions is illustrated inFig. 7. It is found that holdup in the high interfacial tensionsystem (toluene–acetone–water) is larger than that in the othersystems. This phenomenon is in an opposite manner to theresults obtained in a the vertical pulsed plate column inprevious investigations.29 As can be seen from the graph, the
This journal is © The Royal Society of Chemistry 2017
dispersed phase holdup exhibited two different behaviors withincreasing the pulsation intensity, which can be referred to theoperating regimes of the column. More information on thegoverning regimes in the horizontal pulsed sieve-plate columncan be observed in Melnyk et al.,5 Khajenoori et al.,45 and Akh-gar et al.,17 in which three regimes including fully separated,pseudo dispersion and emulsion regimes were characterized.Accordingly, at lower pulsation intensities which the columnoperates in the mixer-settler regime (fully separated owregime), drops accumulate above of the column and the holdupvalues are high. With further increase of the pulsation intensity,holdup declines reaching to a minimum value within thedispersed regime. Therefore, holdup decreases with an increasein pulsation intensity in this regime. As the upper ooding limitis approached, holdup strongly increases and smallest dropfractions are washed out by the continuous phase. It can be alsoobserved that the dispersed phase holdup with mass transferdirection from the continuous phase to the dispersed phase haslarger values than that with the opposite direction. In fact,holdup values are higher with the mass transfer direction from
RSC Adv., 2017, 7, 8908–8921 | 8913

RSC Advances Paper
Ope
n A
cces
s A
rtic
le. P
ublis
hed
on 3
0 Ja
nuar
y 20
17. D
ownl
oade
d on
12/
5/20
21 1
0:24
:57
AM
. T
his
artic
le is
lice
nsed
und
er a
Cre
ativ
e C
omm
ons
Attr
ibut
ion
3.0
Unp
orte
d L
icen
ce.
View Article Online
the continuous phase to the dispersed phase than thosemeasured with no mass transfer, and even higher than thosemeasured when acetone transferred in reverse direction. Asdiscussed in Section 3.1, this is due to the evolution of inter-facial tension with the direction of mass transfer. Thisphenomenon is called Marangoni effect.47 Generally, higherholdup values can be found with mass transfer direction fromthe continuous phase to the dispersed phase, leading to higherperformances but earlier ooding points.
The effect of the dispersed phase ow rate on holdup withboth two directions of mass transfer is shown in Fig. 8. It is
Table 3 Some of correlations proposed for drop size in pulsed column
ReferencePulsed columntype Correlation
21 VPSPCd32
d¼ 0:439
22 VPSPCd32 ¼ 0:92
48 VPSPCd32 ¼ 2:03�
49 VPSPCd32 ¼ C
�s
rc
25 VPSPCd32 ¼ 0:57
�
50 VPSPCd32ffiffiffiffiffiffiffiffiffiffiffiffiffiffis=Drg
p ¼
51 VPSPCd32ffiffiffiffiffiffiffiffiffiffiffiffiffiffis=Drg
p ¼
13 VPSPC d32
h¼
1
1:55
52 VPSPCd32 ¼ C
�s
rc
30 VPPCd32 ¼ 8:26�
d32 ¼ 7:1�
41 VPPCd32 ¼ 75:6�
10 HPSPC
d32 ¼ 2:8�
8914 | RSC Adv., 2017, 7, 8908–8921
observed that increasing the ow rate of the dispersed phaseleads to an increase in the dispersed phase holdup. Withrespect to Fig. 7 and 8, the impact of pulsation intensity onholdup is found to be stronger than the effect of the dispersedphase ow rate as similar trends are observed for the mean dropdiameter. Regarding to the presence of mass transfer, the owrate of the dispersed phase shows similar impact on the holdupvalues in both directions of mass transfer.
The variation of the dispersed phase holdup versus thecontinuous phase ow rate is illustrated in Fig. 9. It is revealedthat the holdup slightly increases with an increase in the
s
"sa0:5
dðpAf þ VcÞ2rc
#0:6
ðAfÞ�0:3s0:5mc0:1
rc0:6g0:4
!
10�5�Afh1:3
��1:2
�0:6
ðAfÞ�1:2
s
rc
�0:6a0:8d0:4
ð2AfÞ1:2
1:35a0:4
hffiffiffiffiffiffiffiffiffiffiffiffiffiffi
s*=r*gp
!0:180@ mdg
14
r*14s*
34
1A0:14�
s
s*
�0:06
0:23þ exp��29:66
Af2
ga
�� �
Ca0:74
�h
h*
�0:10
exp
�3:00
AfDr14
g14s
14
!þ exp �28:56AfDr
14
g14s
14
0@
1A
Ca0:32�s
Dpgh2
�1:2
þ 1
0:42
3
g
�Dr
gs
�1:4!�0:35"
h
�Drg
s
�1:2#�1:15
�0:4
ðAfÞ�0:8a0:48d0:26h0:34
10�5�Af4rcsg
��0:2304�mc
4g
Drs3
��0:0514�1þ Qc
Qd
��0:0321
10�5 ðAfÞ4rcsg
!�0:239�mc
4g
Drs3
��0:0473�h
H0
��0:1645
10�3�s
rc
�0:3945"150
ð1� 3Þ234
mAf2
rcde2þ 1:75
ð1� 3Þ34
Af3
de
#�0:263
10�4�1þ Qc
Qd
��0:203�md
mc
�0:025s
rd
ffiffiffiffiffiffiffiffiffiffiffiffiffiAf3Qd
q0B@
1CA
0:444
This journal is © The Royal Society of Chemistry 2017

Paper RSC Advances
Ope
n A
cces
s A
rtic
le. P
ublis
hed
on 3
0 Ja
nuar
y 20
17. D
ownl
oade
d on
12/
5/20
21 1
0:24
:57
AM
. T
his
artic
le is
lice
nsed
und
er a
Cre
ativ
e C
omm
ons
Attr
ibut
ion
3.0
Unp
orte
d L
icen
ce.
View Article Online
continuous phase ow rate, due to the higher drag forces. Also,it should be noted that the inuence of the dispersed phase owrate is found to be stronger than that of the continuous phase.
By considering Fig. 3–9, it is clear that in spite of the fact thatthe presence of mass transfer along with its direction highlyinuence the mean drop size and the dispersed phase holdup,operating parameters show similar impact on the hydrody-namic behavior of the column with and without mass transfer.However, the range of operating regimes are changed andconsequently holdup shows oscillatory behavior with increasingthe pulsation intensity.
Fig. 11 Comparison of experimentally-measured mean drop size withthe calculated values by eqn (10) for different chemical systems.
Table 4 Regressed constant C for eqn (10) based on experimentalHPC data
Data source Mass transfer C AARE (%)
Khajenoori10 None 1.342 16.24This study c / d 1.323 7.89This study d / c 1.381 7.83
3.3. Predictive correlation for mean drop size
Numerous correlations have been proposed for prediction ofmean drop size in various pulsed extraction columns such aspacked, sieve-plate and disc and doughnut columns.20 However,most of these correlations are related to vertical pulsed columnsand cannot be used in other types of extraction columnsincluding horizontal ones since the impact of operatingparameters on the hydrodynamic behaviour of a horizontalextraction column is distinctive from that in the verticalcolumns. Table 3 exhibits a number of available correlationsproposed to predict the mean drop size in pulsed columns.
Furthermore, Yadav and Patwardhan20 have presenteda review on the proposed correlations on the mean drop size invertical pulsed sieve-plate columns. They compared experi-mental data of 6 different investigations with the availablecorrelations and it was concluded that the correlation of Sree-nivasulu et al.,52 is much better than other correlations and it isrecommended to be used for prediction of mean drop size invertical pulsed sieve-plate columns. Sreenivasulu et al.,52
proposed the following correlation:
d32 ¼ C
�s
rc
�0:4
ðAfÞ�0:8a0:48d0:26h0:34 (9)
Fig. 10 Comparison of experimentally-measuredmean drop size withthe calculated values by eqn (9) for different chemical systems.
This journal is © The Royal Society of Chemistry 2017
Fig. 10 compares the experimental data obtained with thepresence of mass transfer (d/ c) in the horizontal pulsed platecolumn with the prediction using eqn (9). Although eqn (9) isapproximately able to estimate the mean drop size, it is inac-curate in some experiments and also it is not able to cover alleffective parameters. Therefore, another correlation is needed.
In another study, Khajenoori et al.,10 have developed a semiempirical correlation for prediction of the mean drop size ina horizontal pulsed column for three different systems without
Fig. 12 Comparison of experimentally-measured mean drop size withthe calculated values by eqn (11) for different chemical systems in thepresence of mass transfer in both directions.
RSC Adv., 2017, 7, 8908–8921 | 8915
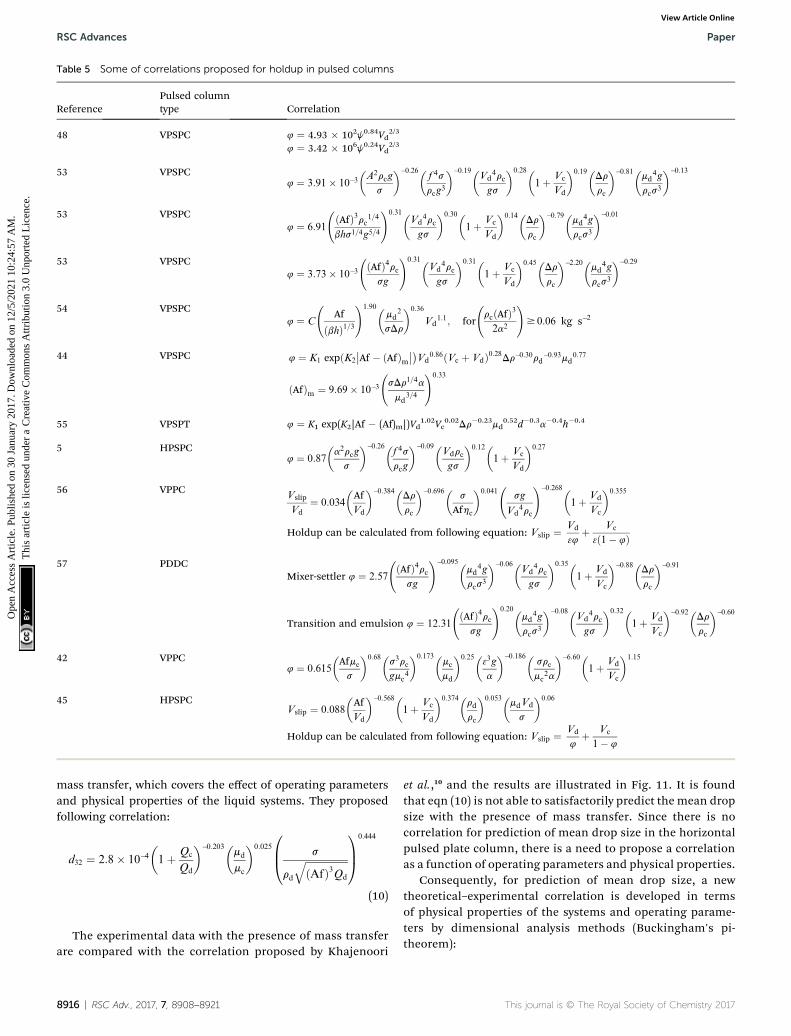
Table 5 Some of correlations proposed for holdup in pulsed columns
ReferencePulsed columntype Correlation
48 VPSPC 4 ¼ 4.93 � 102j0.84Vd2/3
4 ¼ 3.42 � 106j0.24Vd2/3
53 VPSPC4 ¼ 3:91� 10�3
�A2rcg
s
��0:26�f 4s
rcg3
��0:19�Vd
4rc
gs
�0:28�1þ Vc
Vd
�0:19�Drrc
��0:81�md
4g
rcs3
��0:13
53 VPSPC4 ¼ 6:91
ðAfÞ3rc1=4bhs1=4g5=4
!0:31�Vd
4rc
gs
�0:30�1þ Vc
Vd
�0:14�Drrc
��0:79�md
4g
rcs3
��0:01
53 VPSPC4 ¼ 3:73� 10�3
ðAfÞ4rcsg
!0:31�Vd
4rc
gs
�0:31�1þ Vc
Vd
�0:45�Drrc
��2:20�md
4g
rcs3
��0:29
54 VPSPC4 ¼ C
Af
ðbhÞ1=3!1:90�
md2
sDr
�0:36
Vd1:1; for
rcðAfÞ32a2
!$ 0:06 kg s�2
44 VPSPC 4 ¼ K1 expðK2
Af � ðAfÞm�Vd
0:86ðVc þ VdÞ0:28Dr�0:30rd�0:93md0:77
ðAfÞm ¼ 9:69� 10�3 sDr1=4a
md3=4
!0:33
55 VPSPT 4 ¼ K1 exp(K2|Af � (Af)m|)Vd1.02Vc
0.02Dr�0.23md0.52d�0.3a�0.4h�0.4
5 HPSPC4 ¼ 0:87
�a2rcg
s
��0:26�f 4s
rcg
��0:09�Vdrc
gs
�0:12�1þ Vc
Vd
�0:27
56 VPPCVslip
Vd¼ 0:034
�AfVd
��0:384�Drrc
��0:696�s
Afhc
�0:041
sg
Vd4rc
!�0:268�1þ Vd
Vc
�0:355
Holdup can be calculated from following equation: Vslip ¼ Vd
34þ Vc
3ð1� 4Þ
57 PDDCMixer-settler 4 ¼ 2:57
ðAfÞ4rcsg
!�0:095�md
4g
rcs3
��0:06�Vd
4rc
gs
�0:35�1þ Vd
Vc
��0:88�Drrc
��0:91
Transition and emulsion 4 ¼ 12:31
ðAfÞ4rcsg
!0:20�md
4g
rcs3
��0:08�Vd
4rc
gs
�0:32�1þ Vd
Vc
��0:92�Drrc
��0:60
42 VPPC4 ¼ 0:615
�Afmc
s
�0:68�s3rc
gmc4
�0:173�mc
md
�0:25�33g
a
��0:186�src
mc2a
��6:60�1þ Vd
Vc
�1:15
45 HPSPCVslip ¼ 0:088
�AfVd
��0:568�1þ Vc
Vd
�0:374�rd
rc
�0:053�mdVd
s
�0:06
Holdup can be calculated from following equation: Vslip ¼ Vd
4þ Vc
1� 4
RSC Advances Paper
Ope
n A
cces
s A
rtic
le. P
ublis
hed
on 3
0 Ja
nuar
y 20
17. D
ownl
oade
d on
12/
5/20
21 1
0:24
:57
AM
. T
his
artic
le is
lice
nsed
und
er a
Cre
ativ
e C
omm
ons
Attr
ibut
ion
3.0
Unp
orte
d L
icen
ce.
View Article Online
mass transfer, which covers the effect of operating parametersand physical properties of the liquid systems. They proposedfollowing correlation:
d32 ¼ 2:8� 10�4�1þ Qc
Qd
��0:203�md
mc
�0:025
0B@ s
rd
ffiffiffiffiffiffiffiffiffiffiffiffiffiffiffiffiffiðAfÞ3Qd
q1CA
0:444
(10)
The experimental data with the presence of mass transferare compared with the correlation proposed by Khajenoori
8916 | RSC Adv., 2017, 7, 8908–8921
et al.,10 and the results are illustrated in Fig. 11. It is foundthat eqn (10) is not able to satisfactorily predict the mean dropsize with the presence of mass transfer. Since there is nocorrelation for prediction of mean drop size in the horizontalpulsed plate column, there is a need to propose a correlationas a function of operating parameters and physical properties.
Consequently, for prediction of mean drop size, a newtheoretical–experimental correlation is developed in termsof physical properties of the systems and operating parame-ters by dimensional analysis methods (Buckingham's pi-theorem):
This journal is © The Royal Society of Chemistry 2017

Fig. 13 Comparison of experimental holdup with the calculatedvalues by eqn (13) for different chemical systems.
Paper RSC Advances
Ope
n A
cces
s A
rtic
le. P
ublis
hed
on 3
0 Ja
nuar
y 20
17. D
ownl
oade
d on
12/
5/20
21 1
0:24
:57
AM
. T
his
artic
le is
lice
nsed
und
er a
Cre
ativ
e C
omm
ons
Attr
ibut
ion
3.0
Unp
orte
d L
icen
ce.
View Article Online
d32ffiffiffiffiffiffiffiffiffiffiffiffircQd
2
s
3
r ¼ C
�1þ Qc
Qd
�0:279�md
mc
��0:329 ðAfÞ3Qdrc2
s2
!�0:258�rc
Dr
��1:571
(11)
where C ¼ 1.381 for mass transfer direction from continuous todispersed phase and C ¼ 1.323 for mass transfer in the reversedirection. The constants and exponents are derived usingnonlinear regression algorithms in SPSS Soware. This corre-lation also compared with the experimental data from Khaje-noori et al.,10 and the results show good agreement between theexperimental and calculated data. Therefore, three differentconstants are obtained for three different conditions, which arelisted in Table 4.
The comparison of the experimental data with those calcu-lated by eqn (11) is illustrated in Fig. 12. This gure shows theaccuracy of the derived equation to predict the mean drop sizewith and without mass transfer.
Fig. 14 Comparison of experimental holdup with the calculatedvalues by eqn (15) for different chemical systems.
3.4. Predictive correlation for holdup
As shown in Fig. 7–9, the dispersed phase holdup is a functionof operating parameters including the pulsation intensity andow rates of both phases as well as physical properties of thesystems as follows:
4 ¼ f(Qc,Qd,Af,md,mc,s,rc,rd) (12)
Many holdup correlations have been proposed but most ofthem are related to the vertical pulsed column.20 Some ofavailable correlations for prediction of holdup are listed inTable 5.
Melnyk et al.,5 presented following correlation for predictionof overall average holdup as a function of operating parametersby using several available experiments on the ooding results ofthe horizontal pulsed plate column:
4 ¼ 0:87
�A2rcg
s
��0:26�f 4s
rcg
��0:09�Vdrc
gs
�0:12�1þ Vc
Vd
�0:27
(13)
in which the pulse amplitude and frequency were treatedseparately instead of combining the two terms together asa product of pulse and velocity. They considered that the hori-zontal pulsed plate column mostly operates in mixer-settlerregime and power dissipation is not the controlling factor incharacterizing holdup in this regime. Fig. 13 shows comparisonbetween the experimental data with those calculated by eqn(13). It is observed that eqn (13) is not able to accurately esti-mate holdup values for these systems with the AARE of 142%.
In another study, Khajenoori et al.,45 studied the effect ofoperating parameters on slip and characteristic velocities ina same horizontal pulsed sieve-plate column for the fourchemical systems without mass transfer. They proposed thefollowing semi-empirical correlation for prediction of the slipvelocity:
Vslip ¼ 0:088
�Af
Vd
��0:568�1þ Vc
Vd
�0:374�rd
rc
�0:053�mdVd
s
�0:06
(14)
This journal is © The Royal Society of Chemistry 2017
When two immiscible phases ow counter-currently throughan extraction column without packing, the following relation-ship between the slip and supercial velocities and holdupvalues can be dened:58
Vslip ¼ Vd
4þ Vc
1� 4(15)
Therefore, combining eqn (14) with (15) results ina correlation which can estimate the holdup of the column.Fig. 14 compares experimental results with data calculated bythe correlation proposed by Khajenoori et al.45 It is observedthat it is not able to cover the experimental data very
RSC Adv., 2017, 7, 8908–8921 | 8917

Table 6 Regressed constant C for eqn (15) based on experimentalHPC data
Data source Mass transfer C AARE (%)
Khajenoori45 None 0.97 15.47This study c / d 0.101 8.02This study d / c 0.089 6.36
Fig. 15 Comparison of experimental holdup with the calculatedvalues by eqn (16) for different chemical systems.
RSC Advances Paper
Ope
n A
cces
s A
rtic
le. P
ublis
hed
on 3
0 Ja
nuar
y 20
17. D
ownl
oade
d on
12/
5/20
21 1
0:24
:57
AM
. T
his
artic
le is
lice
nsed
und
er a
Cre
ativ
e C
omm
ons
Attr
ibut
ion
3.0
Unp
orte
d L
icen
ce.
View Article Online
accurately. However, it should be noted that the correlationproposed by Melnyk et al.,5 and Khajenoori et al.,45 are pre-sented for different chemical systems without mass transferand they did not consider the remarkable inuence of thepresence of mass transfer on the dispersed phase holdup ofthe column.
Therefore, according to eqn (12), a new theoretical–experi-mental correlation is proposed for prediction of the dispersedphase holdup in terms of physical properties of the liquidsystems and operating parameters by dimensional analysismethods:
Table 7 Experimental studies on vertical pulsed sieve plate columns: de
Descriptions Parameters
Investig
Kagan
Column dimension D � 103 (m) 56H (m) 5.4
Plate details d � 103 (m) 2a 8.2h � 103 (m) 50Material SS
Pulse details f (Hz) 0.8–1.6A � 103 (m) 5–15Af (m s�1) 4–25
Phase velocities Vc � 103 (m s�1) 6.2–6.7Vd � 103 (m s�1) 0.6–1.2
8918 | RSC Adv., 2017, 7, 8908–8921
4 ¼ C
�1þ Qc
Qd
�0:124 ðAfÞ4rc
gs
!�0:286�rc
Dr
��0:783
��md
4g
s3rc
��0:071 ðAfÞ3Qdrd2
s2
!0:282
(16)
where C¼ 0.089 for mass transfer from the continuous phase tothe dispersed phase and C ¼ 0.101 for mass transfer with theopposite direction. Moreover, the experimental data from thework of Khajenoori et al.,45 (because of the same column used inboth studies) are also considered for developing eqn (16) inorder to generalize the applicability of the proposed equation inthe case with no mass transfer. Eqn (16) is able to acceptablycover their experimental data by modifying the constant value.Table 6 shows regressed constant (C) for eqn (16) based onexperimental HPC data of this study and Khajenoori et al.,45 andFig. 15 exhibits experimental results with data calculated byeqn (16).
3.5. Comparison between the hydrodynamic of differentextraction columns
One of the objectives of this research was to evaluate thebenets of the application of the horizontal extraction columnsin industrial applications. Kagan et al.,22 Miyauchi and Oya,48
and Kleczek et al.,59 are among the researches who have con-ducted some experiments on mean drop size in standardvertical pulsed columns with almost similar operating condi-tions and column dimensions to the horizontal column used inthis study. Tables 7 and 8 presents the operating and geomet-rical conditions for these investigations and physical propertiesof the systems used, respectively. By comparing the values of themean drop size in different operating conditions reported inthese studies with the experimental data of this work, one canobserved that smaller droplets can form in a horizontal pulsedsieve-plate extraction column compared to the standard verticalpulsed plate columns in almost identical conditions. For betterdemonstration between the values of mean drop size in verticaland horizontal columns, Fig. 16 exhibits the mean drop size inthe current study and those obtained from the correlationsproposed by Kagan et al.22 Miyauchi and Oya48 and Kleczek
tails of operating conditions and column dimensions
ators
et al.22 Miyauchi and Oya48 Kleczek et al.59
54 670.37–0.86 0.73 30.19 0.067–0.13430–70 50SS —
7 3 —1.7–15 —5.1–45.0 8–212.7 4.250.43 4.25
This journal is © The Royal Society of Chemistry 2017

Table 8 Experimental studies on vertical pulsed sieve plate columns: details of chemical systems investigated and physical properties
Experimental details
Investigators
Kagan et al.22 Miyauchi and Oya48 Kleczek et al.59
Continuous phase (c) Water Water Water, glycerineDispersed phase (d) Kerosene MIBK Benzene, toluene, xylene, butyl acetate, carbon tetrachloride and chloroformSolute — — Acetic, propionic, butyric and benzoic acids, acetone, phenol and iodineMass transfer direction — — c / d, d / crc (kg m�3) 1000 996.38 1000–1054rd (kg m�3) 788.69 796.13 860–1600mc � 103 (Pa s) 1 0.842 1–1.7md � 103 (Pa s) 1.7584 0.554 0.6–0.97s � 103 (N m�1) 39.0 10.3 11.1–41.2
Fig. 16 Mean drop size versus pulsation intensity at dispersed andcontinuous phase flow rates of 2.1 and 3.6 l h�1 for toluene–acetone–water.
Paper RSC Advances
Ope
n A
cces
s A
rtic
le. P
ublis
hed
on 3
0 Ja
nuar
y 20
17. D
ownl
oade
d on
12/
5/20
21 1
0:24
:57
AM
. T
his
artic
le is
lice
nsed
und
er a
Cre
ativ
e C
omm
ons
Attr
ibut
ion
3.0
Unp
orte
d L
icen
ce.
View Article Online
et al.59 versus pulsation intensity. It can be observed that exert-ing pulsation into a horizontal plate extraction column formssmaller droplets compared to vertical plate extraction column.
4. Conclusions
In industrial applications with space constraints, using hori-zontal columns is much benecial compared to the standardvertical columns due to higher interfacial area available formass transfer and consequently lower required area. Consid-ering the signicant role of mass transfer in the sizing andscale-up of horizontal extraction columns, no analytical andexperimental investigations have been conducted in this regard.In this work, the effect of operating parameters includingpulsation intensity as well as ow rates of the continuous anddispersed phases on mean drop size and holdup are investi-gated in a horizontal pulsed sieve-plate column under thepresence of mass transfer in both directions. The results areillustrated and compared with the previous studies. Theachievements of this work are summarized as follows:
� An increase in the ow rate of the dispersed and thecontinuous phases results in an increase in the holdup alongwith producing larger drops. The direction of mass transfer do
This journal is © The Royal Society of Chemistry 2017
not alter affect the impact of operating parameters on meandrop size and holdup. However, it is observed that the variationin mean drop size and holdup with respect to the presence ofmass transfer and its direction versus operating conditions isgreater in higher values of mean drop size and holdup.
� With mass transfer from the continuous phase to thedispersed phase, smaller drops are produced in comparisonwith no mass transfer condition and even with mass transfer inthe reverse direction due to the Marangoni effect.
� An increase in the pulsation intensity within the mixersettler regime leads to the reduction of holdup of the column,reaching to the minimum point which indicates the maximumthroughput of the column. With further increase in pulsationintensity, it begins to increase.
� Holdup for the toluene–acetone–water system is found tobe more than that for the butyl acetate–acetone–water and thebutanol–acetone–water systems under the same operatingconditions. This phenomenon is in an opposite manner to theresults obtained in a standard vertical pulsed plate column inprevious investigations.
� The comparison between the results of the current researchand those in similar vertical extraction columns reveals that thehorizontal pulsed extraction columns provide a larger masstransfer area and hence better mass transfer efficiency.
� Two new correlations in terms of the operating variablesand physical properties of the liquid systems are developed forprediction of the mean drop size and holdup in a horizontalpulsed plate column in the absence and presence of masstransfer coefficient. The AARE values of the proposed correla-tions are between 6.36 and 16.24% for their optimizedconstants, which shows the good accuracy of presentedcorrelations.
Nomenclature
a
Specic interfacial area, m2 m�3A
Amplitude of pulsation, m Af Pulsation intensity, m s�1d32
Sauter mean diameter, m f Frequency of pulsation, Hz HPSPC Horizontal pulsed sieve-plate columnRSC Adv., 2017, 7, 8908–8921 | 8919

RSC Advances Paper
Ope
n A
cces
s A
rtic
le. P
ublis
hed
on 3
0 Ja
nuar
y 20
17. D
ownl
oade
d on
12/
5/20
21 1
0:24
:57
AM
. T
his
artic
le is
lice
nsed
und
er a
Cre
ativ
e C
omm
ons
Attr
ibut
ion
3.0
Unp
orte
d L
icen
ce.
View Article Online
PDDC
8920 | RSC Ad
Pulsed disc and doughnut column 14 N.
Q
Volumetric ow rate, m3 s�1 JouV
Velocity, m s�1 15 G.Vc
Supercial velocity of continuous phase, m s�1 207 Vd Supercial velocity of dispersed phase, m s�1 16 W. Vslip Slip velocity, m s�1 86. VPPC Vertical pulsed packed column 17 S. A VPSPC Vertical pulsed sieve-plate column RS v Kinematic viscosity, m2 s�1 18 N.Greek symbols
a
Fractional free area20 R.3
Power dissipated per unit mass of uid, W kg�1 3894
Holdup 21 T.m
Viscosity, N s m�2 176r
Density, kg m�3 22 S. K�r
Density of mixture of phases, kg m�3 196s
Interfacial tension between two phases, N m�1 23 A.Subscripts
c
Continuous phase26 H.164
d Dispersed phase 27 H. f Flooding SolReferences
1 A. Warade, R. Gaikwad, R. Sapkal and V. Sapkal, Leonardo J.Sci., 2011, 79–94.
2 P. Amani, J. Safdari, H. Abolghasemi, M. H. Mallah andA. Davari, Int. J. Heat Fluid Flow, 2017, DOI: 10.1016/j.ijheatuidow.2017.01.003.
3 L. S. Tung and R. H. Luecke, Ind. Eng. Chem. Process Des. Dev.,1986, 25, 664–673.
4 N. Somkuwar, N. Kolhe and V. Rathod, Indian Chem. Eng.,2014, 56, 235–257.
5 A. J. Melnyk, S. Vijayan and D. R. Woods, Can. J. Chem. Eng.,1992, 70, 417–425.
6 A. A. A. Hussain, T.-B. T. Liang and M. M. J. Slater, Chem.Eng. Res. Des., 1988, 66, 541–554.
7 J. Prochazka and M. M. Hafez, Collect. Czech. Chem.Commun., 1972, 37, 3725–3734.
8 D. Logsdail and J. Thornton, React. Technol., 1959, 1, 15–24.9 V. Vdovenko and S. Kulikov, Radiokhimiya, 1966, 8, 525–533.10 M. Khajenoori, A. Haghighi-Asl, J. Safdari and M. H. Mallah,
Chem. Eng. Process., 2015, 92, 25–32.11 S. Maaß, S. Wollny, A. Voigt and M. Kraume, Exp. Fluids,
2011, 50, 259–269.12 W. Pietzsch and T. H. Pilhofer, Chem. Eng. Sci., 1984, 39,
961–965.13 A. Kumar and S. Hartland, Ind. Eng. Chem. Res., 1996, 35,
2682–2695.
v., 2017, 7, 8908–8921
A. Moraes, J. B. A. Paulo and G. S. Medeiros, Brazilianrnal of Petroleum and Gas, 2011, 5, 75–85.Zhou and S. M. Kresta, Chem. Eng. Sci., 1998, 53, 2063–9.Pietzsch and E. Blass, Chem. Eng. Technol., 1987, 10, 73–
khgar, J. Safdari, J. Towghi, P. Amani and M. H. Mallah,C Adv., 2017, 7, 2288–2300.M. Spaay, A. J. F. Simons and G. P. Ten Brink, in Proc.
Internal. Solvent Extraction Conf., ISEC, 1971, vol. 71, pp.19–23.
19 M. Lorenz, H. Haverland and A. Vogelpohl, Chem. Eng.Technol., 1990, 13, 411–422.
L. Yadav and A. W. Patwardhan, Chem. Eng. J., 2008, 138,–415.Mısek, Collect. Czech. Chem. Commun., 1964, 29, 1755–6.agan, M. Aerov, V. Lonik and T. Volkova, Int. Chem. Eng.,5, 5, 656.Assenov and I. Penchev, Dokl. Bolg. Akad. Nauk, 1971, 24,
1381–1387.24 J. Kubica and D. Zdunkiewicz, Inz. Chem., 1977, 7, 903–907.25 L. Boyadzhiev andM. Spassov, Chem. Eng. Sci., 1982, 37, 337–
340.Schmidt, Chem. Eng., McGraw-Hill, Pub., Co, 1983, pp.–165.Vassallo, G. Thornton and J. D. Dworschak, Proc. Int.vent Extr. Conf., 1983, 1, 168–169.
28 R. Yaparpalvi, P. K. Das, A. K. Mukherjee and R. Kumar,Chem. Eng. Sci., 1986, 41, 2547–2553.
29 A. Prabhakar, G. Sriniketan and Y. B. G. Varma, Can. J. Chem.Eng., 1988, 66, 232–240.
30 M. Gholam Samani, A. Haghighi Asl, J. Safdari andM. Torab-Mostaedi, Chem. Eng. Res. Des., 2012, 90, 2148–2154.
31 Y. Wang, K. H. Smith, K. A. Mumford, H. Yi, L. Wang andG. W. Stevens, Chem. Eng. Res. Des., 2016, 109, 667–674.
32 D. Venkatanarasaiah and Y. B. G. Varma, Bioprocess Eng.,1998, 18, 119–126.
33 G. U. Din, I. R. Chughtai, M. H. Inayat and I. H. Khan, Appl.Radiat. Isot., 2008, 66, 1818–1824.
34 G. A. Sehmel and A. L. Babb, Ind. Eng. Chem. Process Des.Dev., 1963, 2, 38–42.
35 W. Batey, T. Arthur, P. Thompson and J. Thornton, Proc. Int.Solvent Extr. Conf., 1983, 1, 166–167.
36 V. G. Lade, V. K. Rathod, S. Bhattacharyya, S. Manohar andP. K. Wattal, Chem. Eng. Res. Des., 2013, 91, 1133–1144.
37 M. H. I. Baird and S. J. Lane, Chem. Eng. Sci., 1977, 28, 947–957.
38 R. L. Bell and A. L. Babb, Ind. Eng. Chem. Process Des. Dev.,1969, 8, 392–400.
39 M. R. Usman, H. Sattar, S. N. Hussain, H. Muhammad,A. Asghar and W. Afzal, Braz. J. Chem. Eng., 2009, 26, 677–683.
40 S. Ousmane, M. Isabelle, M. S. Mario, T. Mamadou andA. Jacques, Chem. Eng. Res. Des., 2011, 89, 60–68.
41 M. G. Samani, J. Safdari, A. H. Asl and M. Torab-Mostaedi,Chem. Eng. Technol., 2014, 37, 1155–1162.
This journal is © The Royal Society of Chemistry 2017

Paper RSC Advances
Ope
n A
cces
s A
rtic
le. P
ublis
hed
on 3
0 Ja
nuar
y 20
17. D
ownl
oade
d on
12/
5/20
21 1
0:24
:57
AM
. T
his
artic
le is
lice
nsed
und
er a
Cre
ativ
e C
omm
ons
Attr
ibut
ion
3.0
Unp
orte
d L
icen
ce.
View Article Online
42 M. Asadollahzadeh, J. Safdari, A. Haghighi-Asl andM. Torab-Mostaedi, Chem. Ind. Chem. Eng. Q., 2012, 18, 255–262.
43 Y. Wang, K. A. Mumford, K. H. Smith, Z. Li andG. W. Stevens, Ind. Eng. Chem. Res., 2016, 55, 714–721.
44 A. Kumar and S. Hartland, Chem. Eng. Process., 1988, 23, 41–59.
45 M. Khajenoori, J. Safdari, A. H. Asl and M. H. Mallah, Chem.Eng. Technol., 2015, 38, 1783–1792.
46 T. Mısek, R. Berger and J. Schroter, EFCE Publ. Ser., 1985, 46,1.
47 C. Gourdon and G. Casamatta, Chem. Eng. Sci., 1991, 46,2799–2808.
48 T. Miyauchi and H. Oya, AIChE J., 1965, 11, 395–402.49 H. Angelino, C. Alran, L. Boyadzhi and S. P. Mukherje, Br.
Chem. Eng., 1967, 12, 1893.50 A. Kumar and S. Hartland, Chem. Eng. Commun., 1986, 44,
163–182.
This journal is © The Royal Society of Chemistry 2017
51 A. Kumar and S. Hartland, Liq.-Liq. Extr. Equip., 1994, 625–735.
52 K. Sreenivasulu, D. Venkatanarasaiah and Y. B. G. Varma,Bioprocess Eng., 1997, 17, 189–195.
53 A. Kumar and S. Hartland, Chem. Eng. Res. Des., 1983, 61,248–252.
54 L. Tung and R. Luecke, Ind. Eng. Chem., 1986, 664–673.55 S. Dimitrova Al Khani, C. Gourdon and G. Casamatta, Ind.
Eng. Chem. Res., 1988, 27, 329–333.56 F. T. Hokmabadi, H. Bahmanyar, M. Amanabadi and
J. Safdari, Can. J. Chem. Eng., 2009, 87, 855–861.57 M. Torab-Mostaedi, H. Jalilvand and M. Outokesh, Braz. J.
Chem. Eng., 2011, 28, 313–323.58 J. D. Thornton, Chem. Eng. Sci., 1956, 5, 201–208.59 F. Kleczek, V. Cauwenberg and P. Van Rompay, Chem. Eng.
Technol., 1989, 12, 395–399.
RSC Adv., 2017, 7, 8908–8921 | 8921