experimental feasibility study of estimation of the...
TRANSCRIPT

Journal of Healthcare Engineering · Vol. 6 · No. 1 · 2015 Page 121–144 121
Experimental Feasibility Study of Estimation ofthe Normalized Central Blood Pressure Waveform
from Radial PhotoplethysmogramEdmond Zahedi1,2*, Vahid Sohani1, M. A. Mohd. Ali1, Kalaivani Chellappan1
and Gan Kok Beng1
1 Department of Electrical, Electronic and Systems Engineering, Faculty ofEngineering and Built Environment, Universiti Kebangsaan Malaysia (UKM)
2 School of Electrical Engineering, Sharif University of Technology, Iran
Submitted June 2014. Accepted for publication November 2014.
ABSTRACTThe feasibility of a novel system to reliably estimate the normalized central blood pressure (CBPN)from the radial photoplethysmogram (PPG) is investigated. Right-wrist radial blood pressure andleft-wrist PPG were simultaneously recorded in five different days. An industry-standardapplanation tonometer was employed for recording radial blood pressure. The CBP waveform wasamplitude-normalized to determine CBPN. A total of fifteen second-order autoregressive modelswith exogenous input were investigated using system identification techniques. Among these 15models, the model producing the lowest coefficient of variation (CV) of the fitness during the fivedays was selected as the reference model. Results show that the proposed model is able tofaithfully reproduce CBPN (mean fitness = 85.2% ± 2.5%) from the radial PPG for all 15 segmentsduring the five recording days. The low CV value of 3.35% suggests a stable model valid fordifferent recording days.
Keywords: central blood pressure, radial photoplethsymography, dynamic linear model, systemidentification
1. INTRODUCTIONCardiovascular diseases (CVD’s) continue to remain one of the biggest health issuesdespite progress in medicine and development of new diagnostic tools. Besideshereditary factors, sedentary life-style and work-related stress contribute to the risk ofCVD’s in aging populations. Among health conditions, hypertension has probably themost dramatic outlook, especially when occurring with other diseases such as diabetes.The net result is a heavy financial burden, estimated to be USD 2.3 trillion in the USAalone in 2008, with similar trends in other parts of the world [1]. Another unenviableimpact is the increase in the dependency ratio, defined as the number of individuals whoare retired or too young to work divided by the number of individuals who are in theworking age range. This dependency ratio is poised to jump from its current value of
*Corresponding Author: Edmond Zahedi, PhD, Department of Electrical, Electronic and SystemsEngineering, Faculty of Engineering and Built Environment, National University of Malaysia, Bangi 43600,Malaysia, Phone: +60-89217099 E-mail: [email protected]. Other authors: [email protected];[email protected]; [email protected]; [email protected].

just above 20% to more than 35% in 2030 [1]. In this context, any step towardsprevention of CVD’s may lighten the amount of healthcare efforts necessary to maintainan adequate quality of life for the population in general and the elderly in particular. Asone of the main indicators of cardiovascular health is blood pressure (BP), a myriad ofdevices are commercially available for the indirect measurement of systolic bloodpressure (SBP) and diastolic blood pressure (DBP). Although the two majorcharacteristics of the BP are the peak (SBP) and valley (DBP) leading to their weightedmean arterial pressure (MAP = (1/3) × SBP + (2/3) × DBP), the time-varying waveformof the BP (BP(t)) has received considerable interest due to the rich amount ofcardiovascular-related information [2]. Furthermore, the central BP (CBP(t)) waveformhas proven to be very relevant to the diagnostic of CVD [3]. The measurement ofCBP(t), done by inserting a catheter through a femoral, carotid or radial artery, is bothtechnically and clinically challenging, especially when long-term measurements aresought [4]. Being invasive, this direct way of blood pressure measurement is strictlylimited to the operating theater.
Fortunately, other devices have been made commercially available based on theprinciple of arterial tonometry and generalized transfer function (GTF) [5]. Theprinciple of operation of these devices is based on a pressure sensitive applanationtonometer which is placed over an artery (generally the radial artery). Upon applicationof an external pressure equal to the mean arterial pressure, the arterial wall becomesflattened, eliminating radial forces due to the artery wall distension [6]. Under suchconditions, the pressure exerted to the tonometer is equal to the blood pressure value inthe ‘unloaded’ artery beneath. In order to get the CBP, an empirically derived GTF isemployed [5]. The most established of such devices is the SphygmoCor [7], althoughother devices using the same principle are also commercially available [8]. Our groupinvestigated the advantages and limitations of these devices. After consideration of allparameters, finally the SphygmoCor was identified as having a stronger validation poolof academic publications [8].
Despite being non-invasive, proper positioning and steadfastly keeping theapplanation tonometer over the radial artery proves to be difficult and requires a skilledoperator. Another limitation in deployment of continuous blood pressure waveformrecording systems using tonometers is their relatively high cost, in the range of dozensof USD. The tonometer is generally made of a very sensitive Mylar pressure transducer,and this expensive transducer is easily prone to malfunction by mishandling especiallyin developing countries, making the adoption of such devices even more limited in abudget-constrained clinical environment.
To remedy these problems, attempts have been made to non-invasively estimateBP(t) using alternative transduction mechanisms. One such approach is based on thephotoplethysmogram (PPG), which is the signal corresponding to the amount of lightafter it has been attenuated by the vascular bed and surrounding tissues [9]. One of theearliest works in this field has been reported by Millasseau et al. [10] where BP(t) ismeasured using a finger pressure monitoring device (Finapres) and the PPG is recordedfrom another finger of the same hand. A limitation of the approach in [10] is the use ofthe empirical Fourier transform estimate (EFTE), which is known to be sensitive to
122 Experimental Feasibility Study of Estimation of the Normalized Central Blood Pressure Waveform from Radial Photoplethysmogram

Journal of Healthcare Engineering · Vol. 6 · No. 1 · 2015 123
measurement noise [11]. To minimize the effect of noise and error in the EFTEtechnique, in a previous study, all heart cycles’ duration are normalized to exactly onesecond. As a result, useful information related to the frequency components of BP(t)may have been lost. A more recent work [12] has adopted a similar approach but undera different condition where subjects were asked to do a predefined set of exercises sothat their BP varies considerably.
In this work, we propose to investigate the possibility of using the radial PPG toderive CBPN(t), the amplitude-normalized CBP(t), using a linear dynamic model(transfer function). Being a conduit artery, the radial artery offers the advantage of notbeing affected by any local auto-regulation mechanism. In order to ascertain thereproducibility of our technique, the estimated CBP is evaluated in the course of 5 different days for the same subject. The rest of this paper is organized as follows:Section 1.1 will introduce a brief theoretical background. In Section 2, the dataacquisition setup and methods employed to estimate the models are described. Resultsare presented in Section 3, followed by an interpretation of these results andconclusions in Sections 4 and 5, respectively.
1.1. Theoretical Background1.1.1. Arterial Diameter Variations with Blood PressureThe arterial wall is essentially composed of viscoelastic tissues consisting mainly ofelastin and collagen [13], exhibiting a non-linear behavior in response to the arterialpressure Part [14]. Each left ventricle contraction generates a pulse pressure wave whichpropagates from the aorta and reaches the extremities through the arterial tree. Theincidence of the front-end of this pulse pressure causes the arterial diameter to increaseand the thickness of the strained arterial wall to decrease accordingly [13]. Eventually,the arterial wall will induce enough force to balance the internal pressure (Figure 1) anda dynamic equilibrium is rapidly reached. A pressure cuff will apply an externalpressure Pext, whereas the relationship between the artery diameter d and the transmuralpressure (Ptr = Part – Pext) is given in eqn. 1 [14], where dn is the diameter differencefrom a fully collapsed state to the inflection point, dp is the diameter difference from theinflection point to a fully expanded size, and Cmax is the slope of the pressure-diametercurve at the inflection point.
(1)
for Ptr < 0
for Ptr ≥ 0
A typical static response of the arterial diameter under the effect of Ptr (eqn. 1) isillustrated in Figure 2, with the following physiologically meaningful parameters’values [15]: Cmax = 0.15 mm/(mmHg); dmax = 3.22 mm; dn = 2.00 mm; dp = dmax – dn =1.22 mm. When Pext = Pmean, i.e. Ptr = 0, the artery is at its maximum compliance(change in vessel volume per unit change of blood pressure).
ππ
ππ
=
+×
×⎛
⎝⎜⎞
⎠⎟
+×
×⎛
⎝⎜
⎞
⎠⎟
⎧
⎨
⎪⎪
⎩
⎪⎪
−
−
d
dd C
dP
dd C
dP
2tan
2
2tan
2
nn
ntr
np
ptr
1 max
1 max

124 Experimental Feasibility Study of Estimation of the Normalized Central Blood Pressure Waveform from Radial Photoplethysmogram
Time
Par
t
Part
Pa
Figure 1. Conceptual cross-section of the arterial wall subjected to the arterialpressure (Part) counter-balanced by the pressure emanating from thedistension of the arterial wall (arrows). Large diameter artery with thin wallat systole (left). Small diameter artery with thick wall at diastole (right).
0−10−20−30−40−500
0.51
1.52
2.5
Art
eria
l Dia
met
er (
mm
)
Transmural pressure (mmHg)
Art
eria
l Com
plia
nce
(mm
)
33.5
10 20 30 40 50
0−10−20−30−40−500
0.05
0.1
0.15
0.2
Transmural pressure (mmHg)
10 20 30 40 50
Figure 2. Typical behavior of the arterial diameter (top) and compliance (bottom)versus transmural pressure Ptr. See text for parameter values.

It is clear that the dynamic response of the artery diameter depends on the operatingpoint set by the transmural pressure (Ptr). Setting Pext equal to the mean arterial pressurewill place the operating point at the maximum arterial wall compliance. Under such acondition, Ptr will oscillate around zero and maximum amplitude oscillations areobtained. During applanation tonometry, the operator strives to reach this point byadjusting the exerted force on the probe so that amplitude variations become maximal,an indication that Pext = Part.
1.1.2. Genesis of the PhotoplethysmogramWhen a beam of monochromatic light of intensity I0 at wave length λ passes through adistance d of tissues consisting of muscle, fat, venous and arterial blood, and ifreflection and scattering can be neglected, the resulting amount of light intensity knownas PPG(t) can be roughly approximated by the Beer-Lambert’s law (2):
(2)
where {αm, αf, αv, αa} are the wavelength-dependent optical extinction coefficients,and {dm(t), df(t), dv(t), da(t)} are the time (t) varying path lengths for muscle, fat, venousand arterial blood, respectively. For the rest of this paper, we will refer to PPG(t) asPPG.
As biological tissues are far from being homogenous, in reality, the light beam willalso undergo reflections caused by various layers of tissue, arterial and venous blood,bone and arterial wall(s) [9]. The net result of this combination is a pulsatile (alternate)component (AC) superposed to a constant amplitude intensity (DC). The source of theAC signal is the arterial blood; therefore, it is synchronized with the heart pumpingcycle. Under normal perfusion circumstances, the peak-to-peak amplitude of the ACcomponent of the finger PPG is approximately 10% of the DC. At the systolic instant,the arterial diameter is maximum (Figure 1); therefore, the amount of collected lightafter the light beam has traveled through the tissue layers is minimum (eqn. 2).Similarly, the amount of collected light will be at its maximum at the diastolic instant.It is common practice to negate the AC part of the PPG so that the systolic instantcorresponds to a peak and the diastolic to a valley (Figure 3).
1.1.3. Linear, Dynamic Relationship ApproximationA simple consideration of eqns. 1 and 2 indicates clearly that the relationship betweenBP(t) and PPG is highly non-linear. However, when operation around Ptr = 0 isconsidered, a linear approximation may be assumed. Therefore, it may be plausible topropose a linear, dynamic (due to arterial elasticity) relationship between BP(t) andPPG as long as the pulse pressure (SBP - DBP) does remain within the linear range ofvariation of the arterial diameter d versus Ptr. For example, under the conditions for thegraph in Figure 2 and an operating point defined by Ptr = 0, a pulse-pressure of less than15 mmHg would satisfy this condition. In practice, however, the pulse pressure isgenerally more than 15 mmHg and such a deviation from the 15 mmHg zone willreduce the fitness of the model output.
= × × × ×α α α α− − − −PPG t I e e e e( ) d t d t d t d t0
( ) ( ) ( ) ( )m m f f v v a a
Journal of Healthcare Engineering · Vol. 6 · No. 1 · 2015 125

The main hypothesis of our work is the existence of a linear, dynamic relationshipbetween the normalized-amplitude radial CBP (CBPN) and the radial PPG. Theverification of the existence of such a relationship will therefore be our objective in thispaper. Furthermore, we will investigate the stability of such a relationship over differentdays for the same subject.
2. METHODS2.1. Data Acquisition ProtocolThis study conforms to the Declaration of Helsinki [16] was approved by the ethicalcommittee of the university hospital (Hospital Universiti Kebangsaan Malaysia) withreference number: UKM 1.5.3.5/244/FF-2013-409. Data were acquired from a healthy,non-smoking male (25 years) who did not have any cardiovascular risk factor. Thesubject was briefed by introducing him to the setup one week prior to the experiment.
The subject gave informed consent, fasted overnight and refrained from any heavyphysical activity. The subject was placed in a temperature controlled, noise-free roomwith constant illumination for 15 minutes. Then he was made to lie in the supineposition on a low-rise bed for two minutes. To avoid any motion artifact, the subjectwas instructed to refrain from talking or moving during data acquisition. The subjectwas called for a total of five different days spread over 2 weeks. On each day, the sameprotocol (as described above) was strictly followed, and a set consisting of five recordswere obtained. The setup was operated by a person trained by the manufacturer (AtCorMedical, Australia).
2.2. Recording SetupFigure 4 shows the setup where a reflective-type PPG sensor (g.PULSEsensor, g.TecMedical Engineering, Austria) was attached to the left wrist of the subject. The output
126 Experimental Feasibility Study of Estimation of the Normalized Central Blood Pressure Waveform from Radial Photoplethysmogram
Time (sec)
Raw PPG Processed PPG
Arb
itrar
y U
nits
0−6
−4
−2
0
2
4
6x 10 −4
1 2 3 4 5
Time (sec)
Arb
itrar
y U
nits
0−0.6
−0.4
−0.2
0
0.2
0.4
1
0.6
0.8
1 2 3 4 5
Figure 3. Sample of a radial PPG from sensor output. Left panel: raw data. Rightpanel: after low-pass filtering (15 Hz), detrending and peak amplitudenormalization to unity by dividing the signal by its maximum value.

of this sensor and associated amplifier circuit is the AC component of the PPG. Atonometer (AtCor Medical, Australia) was attached to the right wrist. Two arm restswere specially fabricated to reach the bed’s height where the subject laid on thesupine position. This ensured that the subject’s arms remained comfortably extendedduring data acquisition. The wrist tonometer output was connected to a SphygmoCorunit (AtCor Medical, Australia), measuring the radial BP. The CBP is internallycomputed by the SphygmoCor using the manufacturer’s proprietary algorithm;therefore, it is a derived CBP. Care was taken to attach each sensor as close to thebone prominence as possible over the respective left and right radial arteries. BothPPG and tonometer positions were manually adjusted with great care so as to receivethe maximum amplitude signal, resulting in the best quality in terms of signal-to-noise ratio. The SphygmoCor device has two analog outputs: the measured radialpressure and reconstructed CBP. These signals as well as the wrist PPG sensor outputwere digitized by a 24-bit analog-to-digital data acquisition module (NI 9239,National Instruments, USA). A LabView program (National Instruments, USA) wasutilized to record 180 s (three minutes) of data at a sampling rate of 1613 Hz (defaultsetting). All data were saved under ASCII format on a personal computer hard diskfor off-line processing.
2.3. Signal ProcessingIn order to prepare the data for identifying the model structure and parameters, thefollowing steps were implemented using MATLAB (The Mathworks, Inc.,Massachusetts, USA) according to the standard guidelines [11].
Journal of Healthcare Engineering · Vol. 6 · No. 1 · 2015 127
Pulse sensor(PPG)
SphygmoCor(Radial
pressure)
Data acquisitionunit (Nl 9239)
Figure 4. Schematic of the data acquisition setup.

2.3.1. Low-Pass FilteringUsing an in-house developed code, a linear phase finite impulse response (FIR) low-pass filter (LPF) was implemented with a cut-off frequency of 15 Hz. The choice of thecut-off frequency is based on the useful frequency components of the CBP and PPG [9].All recorded signals were low-pass filtered using the same LPF. The code of this LPFis presented in Appendix A.
2.3.2. Time AlignmentTo be able to record the signals of interest on a long term basis, the SphygmoCor devicewas put in the pulse wave analysis (PWA) mode. According to the manufacturer, thereconstructed CBP output signal available from the SphygmoCor device has beenaligned in time, making the absolute value of time arbitrary. Therefore, we performed atime alignment of the PPG with the CBP. This approach allowed us to simplify delayestimation during model identification by simply setting the value of the delayparameter nk to zero. Details of the model identification procedures are explained insection 2.4.
2.3.3. ResamplingThe high sampling rate of 1613 Hz clearly oversamples the data as the useful signalfrequency is only up to 15 Hz. Oversampling produces an unnecessarily large size ofthe data records, requires more computation time, and results in the compaction of thepoles and zeros [11]. To avoid these problems, all signals were resampled at 100 Hz.
2.3.4. Data Segment SelectionFor model identification purposes, two types of data are required: estimation andvalidation [11]. In our study, these input data were selected through careful visualinspection, the criteria being to avoid any occurrence of motion artifact or extraneousmeasurement noise. For each recording session, three non-overlapping segments wereselected. The duration of all selected segments (estimation and validation) was fiveseconds, corresponding approximately to five heartbeats. Given that the signals wererecorded during five different days, the above segment selection exercise resulted in atotal of 15 (3 segments × 5 days) data segments. We observed that there was nosignificant difference in the model parameters if a much larger segment was selected,as long as the mentioned segment remained noise-free. The major advantage ofchoosing smaller segments is shorter computation time and more uniform (5-secsegments) approach towards all data records.
2.3.5. Detrending ProcedureAs any existing trend in the signal will affect the performance of the systemidentification procedure [11], the linear trend was independently eliminated from eachof the data segments.
2.3.6. Amplitude NormalizationAs a final preprocessing step, the recorded data sample values of the signals weredivided by their own segment maximum. This ensured that for both CBP and PPG, the
128 Experimental Feasibility Study of Estimation of the Normalized Central Blood Pressure Waveform from Radial Photoplethysmogram

peak value during each segment was one. The most negative value of each of the signalsdepends on the particular waveform. Figure 5 shows a typical 5-second segment of thePPG and CBPN after preprocessing.
2.4. Model DeterminationThe procedure for signal processing is shown in Figure 6. The preprocessing steps havebeen explained in Section 2.3 and the remaining parts will be discussed in detail here.The System Identification Toolbox in MATLAB was utilized to perform the necessaryprocessing in this section. Our aim is to determine the best linear, parametric model(Figure 7) giving the closest output y(t) to the observed signal defined by:
(3)
where t is the discrete time, h(k) is the impulse response of the model, x(t) is the inputand ε(t) is an additive noise term which reflects the inaccuracies of the model.
2.4.1. Model StructureThe first step in the model determination is to find the adequate model structure.Considering a linear, parametric relationship between the input (CBPN) and the output(PPG), the auto-regressive with exogenous (ARX) input was naturally our first choice.Although the auto-regressive moving-average with exogenous (ARMAX) input modelwas also investigated, our preliminary tests showed that ARX outperformed ARMAX
∑ ε= − +=
∞
y t h k x t k t( ) ( ) ( ) ( )k 1
Journal of Healthcare Engineering · Vol. 6 · No. 1 · 2015 129
Time (sec)
0−1
−0.5
0
0.5
1
1 2 3 4
PPG
5
0−1
−0.5
0
0.5
1
1 2 3 4 5
CBPArb
itrar
y U
nits
Figure 5. Typical measured PPG (top panel) and CBPN (lower panel) traces afterpreprocessing.

130 Experimental Feasibility Study of Estimation of the Normalized Central Blood Pressure Waveform from Radial Photoplethysmogram
Raw CBP Raw PPG
PPG(as output)
ARX Models
TFRef
ITFRef
CBPN(as input)
Preprocessing
Systemidentification
Choose model(lowest coeff. variation)
Inverse TF
Predict CBPN
from PPG
Evaluate fitness
(CBPN, PPG)
(PPG, CBPN)
Swap Input/Output
Figure 6. Steps involved in the course of the model identification and evaluation.
Model
ε(t): Disturbance
y(t): PPGx(t): CBPN
+
Figure 7. General representation of the modeling approach. The normalized centralblood pressure (CBPN) is the input and radial photoplethysmogram(PPG) the output.

in terms of goodness of fit and residual noise density. Furthermore, the ARX model isknown to have good numerical stability properties and less bias during estimation of themodel’s parameters [11]. In the ARX model, the input x(t) and output y(t) at the discretesample time t are related by the following equation:
(4)
where na is the order of the denominator (number of poles) in the ARX transferfunction, nb is the order of the numerator (number of zeros plus one), nk is the input-output delay, a(k) and b(k) are the numerator and denominator coefficients of thetransfer function, respectively, and ε(t) is the residual noise. By convention, we willrefer to the above model as ARX [na nb nk].
2.4.2. Model OrderOrders from 1 to 4 have been investigated using the following goodness of fit indices:
a) Fitness valueThe Fitness value is defined as [11]:
(5)
wherey(t) is the measured signal at instant t,ŷ(t) is the estimated model output at instant t,ӯ is the mean of the measured signal, andN is the number of data samples.
b) Final prediction error (FPE)An alternative way to assess the goodness of fit is to use the Akaike’s Final PredictionError (FPE) [11] given by:
(6)
where p is the number of estimated parameters and the loss function V is defined as:
(7)
= ×+
−
⎛
⎝
⎜⎜⎜
⎞
⎠
⎟⎟⎟
V
p
Np
N
FPE1
1
∑
∑
( )
( )= × −
−
−
⎛
⎝
⎜⎜⎜⎜
⎞
⎠
⎟⎟⎟⎟
=
=
y t y t
y t y
Fitness 100 1
( ) ˆ( )
( )
t
N
t
N
2
1
2
1
∑ ∑ ε= × − − + × − += =
y t a k x t k n b k y t k t( ) ( ) ( ) ( ) ( ) ( )kk
n
k
n
0 1
a b
∑= ε θ ε θ⎛
⎝⎜⎞
⎠⎟=
VN
k kdet1
( , )( ( , ))N NT
k
N
1
Journal of Healthcare Engineering · Vol. 6 · No. 1 · 2015 131
where θN represents the vector of estimated parameters from the N data samples, ε is theresidual error and det() is the matrix determinant operator [7]. In brief, eqn. 6 shows thatas long as the number of the model’s parameters is very small compared to the numberof samples (p/N << 1), the FPE is close to the loss function. Adding more parameterswill penalize the FPE so that different model orders can be fairly compared, avoiding amodel with numerous parameters to apparently outperform another model with a lessernumber of parameters.
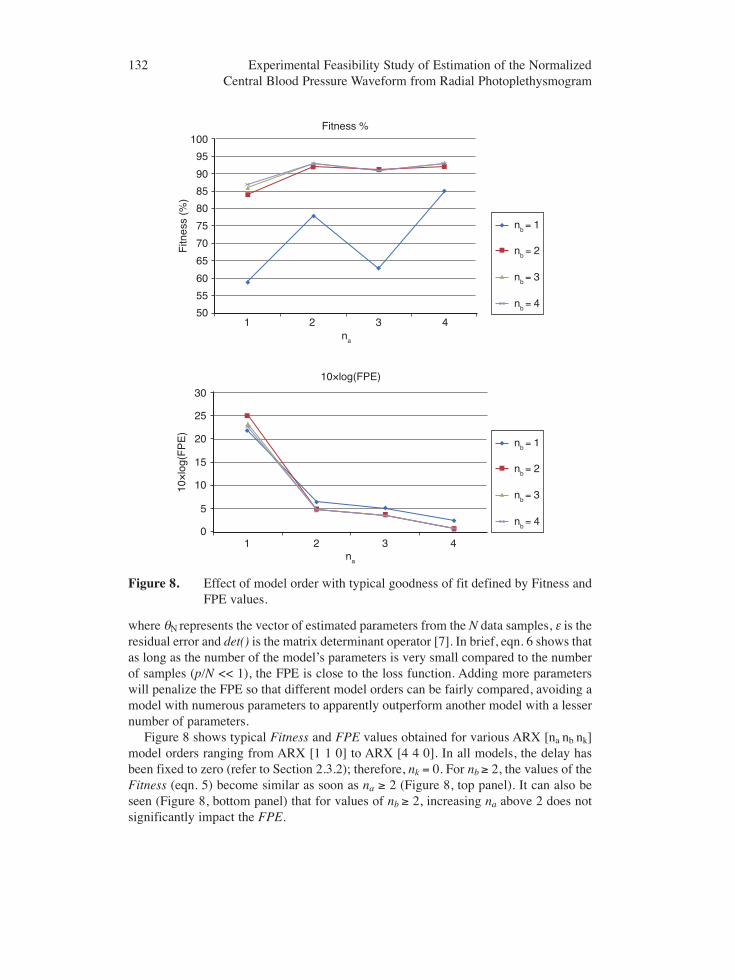
Figure 8 shows typical Fitness and FPE values obtained for various ARX [na nb nk]model orders ranging from ARX [1 1 0] to ARX [4 4 0]. In all models, the delay hasbeen fixed to zero (refer to Section 2.3.2); therefore, nk = 0. For nb ≥ 2, the values of theFitness (eqn. 5) become similar as soon as na ≥ 2 (Figure 8, top panel). It can also beseen (Figure 8, bottom panel) that for values of nb ≥ 2, increasing na above 2 does notsignificantly impact the FPE.
132 Experimental Feasibility Study of Estimation of the Normalized Central Blood Pressure Waveform from Radial Photoplethysmogram
1 2 3 450
0
5
10
15
20
25
30
55
60
65
70
75
80
85
90
95
Fitness %
Fitn
ess
(%)
10×
log(
FP
E)
10×log(FPE)
na
na
100
nb = 1
nb = 2
nb = 3
nb = 4
1 2 3 4
nb = 1
nb = 2
nb = 3
nb = 4
Figure 8. Effect of model order with typical goodness of fit defined by Fitness andFPE values.

As choosing a high order for a particular model would only make the model betterfit the noise instead of the signal of interest [11], the 95% confidence interval of thepoles-zero plots was investigated for orders above two (e.g., ARX [3 3 0]). SeeAppendix B for details of computation of the confidence interval.
It was observed that for higher orders, a clear pole-zero cancellation occurredirrespective of the selected data segment (Figure 9). Therefore, the ARX [2 2 0] modelwas selected as having the optimum numbers of poles and zeros.
2.4.3. Goodness of Fit MatrixEach one of the 15 CBPN/PPG data segments was utilized to estimate the parameters ofa separate ARX [2 2 0] model. For each of these 15 models, the Fitness (eqn. 5) valueswere computed on all 15 data segments, resulting in a 15×15 goodness of fit matrix.Each row in this Fitness matrix corresponds to a segment and each column to a differentARX [2 2 0] model.
2.4.4. Reproducibility of the ModelsUsing the goodness of fit matrix as defined in the previous section, the average, medianand coefficient of variation (CV) of the Fitness were computed on each column for eachof the 15 models:
(8)
where σ and μ are the standard deviation and mean of the Fitness values for a particularmodel, respectively.
= σμ
CV
Journal of Healthcare Engineering · Vol. 6 · No. 1 · 2015 133
Poles (×) and zeros (0)1
0
−1−1 0 1
Figure 9. Poles and zeroes of a typical [PPG → CBPN] model (ARX [3 3 0]structure). The contours (horizontal on the real axis) represent the 95%confidence interval. The pole-zero cancellation is caused by orderoverestimation. Blue (x): poles, Red (o): zeros.

2.4.5. CBPN Estimation from Radial PPGOnce model parameters were determined using the 15 data segments, the modelgiving the lowest CV value was selected as the reference model (TFRef). This choicehas been preferred over selecting the model with the highest average Fitness. Indeed,our preliminary results indicated that the values of the Fitness obtained for all 15models were close; thus we gave more weight to the reproducibility of the modelsrather than the absolute value of their Fitness in the selection of TFRef. As all zerosof TFRef were located within the unit circle, the inverse of the TFRef (ITFRef) waseasily obtained by interchanging the numerator with the denominator of the transferfunction. Finally, by using ITFRef, CBPN was estimated from the radial PPG for all15 segments.
3. RESULTS3.1. Model Determination for a Single Day: [CBPN → PPG]In order to ascertain the validity of our approach, an ARX [2 2 0] model was obtainedfor the records obtained on the first day. The estimation segment was used to determinethe model parameters. The input of this model consisted of the CBPN and the output wasthe PPG. Figure 10 shows the predicted PPG and the measured PPG for the twovalidation data segments. The respective values for Fitness are 88% and 90% (mean of89%). The frequency response and 95% confidence interval for this particular modelare shown in Figure 11.
134 Experimental Feasibility Study of Estimation of the Normalized Central Blood Pressure Waveform from Radial Photoplethysmogram
0−1
0
Arb
itrar
y U
nits
1
1 2 3 4 5
0−1
0
Arb
itrar
y U
nits
1
1 2 3
Fitness = 90%
Time (sec)
Fitness = 88%
4 5
Figure 10. Output of the [CBPN → PPG] model: predicted PPG (dotted red)computed using an ARX [2 2 0] model and CBPN as input and recordedPPG (solid blue). Top panel: validation segment 1. Bottom panel:validation segment 2.

3.1.1. [CBPN → PPG] Models Obtained for all Five DaysThe procedure explained in Section 3.1 was implemented and the parameters of the 15models were obtained (3 segments for each of the 5 days). Figure 12 shows themagnitude and phase of the frequency response of these 15 models.
Journal of Healthcare Engineering · Vol. 6 · No. 1 · 2015 135
20
0.5
1
1.5
4
Frequency response
Pha
se (
deg)
Am
plitu
de
Frequency (Hz)
6 8 10 12 14
2−80−60−40−20
020
4 6 8 10 12 14
Figure 11. Single [CBPN → PPG] model: magnitude (top) and phase (bottom) of thefrequency response of the same ARX [2 2 0] model for the data Figure10. The dotted lines represent the 95% confidence interval of thefrequency response.
5
0
-5
-10-15
-20 0 5 10
Frequency (Hz)
Mag
nitu
de (
dB)
15
0
-20-40
-60-80
-100 0 5 10
Frequency (Hz)
Pha
se (
degr
ess)
15
Figure 12. Frequency responses of fifteen [CBPN → PPG] models: magnitude (top)and phase (bottom) of the frequency response of the fifteen ARX [2 2 0]models.

3.1.2. Determination of the Reference [CBPN →PPG] ModelResults shown in Figure 12 suggests a relatively reproducible model as the magnitudesand phases of all 15 models estimated over five days seem consistent. However, thequestion of variability of the extracted model can only be answered when the Fitnessvalue of each particular model is obtained for all segments recorded throughout the fivedays.
The CV of the Fitness value for all 15 models are exhibited in Figure 13. Modelsestimated using the 7th, 8th, 13th, 14th and 15th segments (marked by “*” in Figure 13)have all their CV’s less than or equal to 4%. The lowest CV (3.1%) was observed forthe last model (Model 3 Day 5) with a Fitness value of 84.7%. Therefore, this particularmodel was selected as our reference model (TFRef). The Fitness of TFRef (84.7%) isvery close to the mean value of the Fitness for all 15 models (84.8 %). The values ofthe parameters for TFRef are given in Table 1.
3.1.3. [PPG → CBPN] ModelUsing the reference model TFRef as determined in the previous section, the inversetransfer function ITFRef was obtained by exchanging the numerator and thedenominator. The pole-zero plot of this reference model (Figure 14) shows that thepoles are within the unit circle ensuring a stable model. A sample of the reconstructedCBPN when the radial PPG is the input is shown in Figure 15. The values of the Fitness
136 Experimental Feasibility Study of Estimation of the Normalized Central Blood Pressure Waveform from Radial Photoplethysmogram
7.0
6.0
5.0
4.0
3.0
2.0
1.0
Mean = 4.6%M
odel
1 Day
1M
odel
2 Day
1M
odel
3 Day
1M
odel
1 Day
2M
odel
2 Day
2M
odel
3 Day
2M
odel
1 Day
3M
odel
3 Day
3
Mod
el 2
Day 3
Mod
el 1
Day 4
Mod
el 2
Day 4
Mod
el 3
Day 4
Mod
el 1
Day 5
Mod
el 2
Day 5
Mod
el 3
Day 5
CV
(%)
Figure 13. [CBPN → PPG] models: coefficient of variation (CV) of the Fitnessvalues computed over 5 different days. *CV ≤ 4%.

Journal of Healthcare Engineering · Vol. 6 · No. 1 · 2015 137
Table 1. Coefficients of the selected reference model TFRef among all 15 models.TFRef corresponds to the last model (Model 3 Day 5) in Figure 13.
Model [a0 a1 a2] [b0 b1]
ARX[2 2 0] [1 -1.597 0.6702] [0.3571 0.2931]
1
0.5
0
−0.5
−1−1 −0.5 0 0.5 1
Figure 14. Locus of the poles (×) and zeros (•) of the inverse reference model ITFRef
for [PPG → CBPN] model
CBPN Prediction from radial PPG
1.1
0
0 1 2 3 Time (sec)
4
PredictedCBPN
MeasuredCBP afterNormalization
5 1.1
Arb
itrar
y U
nits
Figure 15. Output of the [PPG → CBPN] model. Solid red: typical predicted CBPN
using ITFRef and radial PPG as input. Dotted blue: CBPN obtainedthrough amplitude-normalization of the SphygmoCor output. Note thatthe considered data segment is different from the one on which thereference model has been obtained.

of the predicted output CBPN using ITFRef with the radial PPG as input are shown inFigure 16. The mean ± 1 SD of Fitness is 85.2% ± 2.5% (CV of 3.35%). The averageand standard deviation differences between the model output and the maximums(peaks) of the CBPN signal are 0.10 and 0.03, respectively (normalized arbitrary units).The average and standard deviation differences between the model output and theminimums (valleys) of the CBPN signal are 0.08 and 0.03, respectively.
4. DISCUSSION4.1. Main ContributionsReliable estimation of the central blood pressure (CBP) has proven to be a key elementin the diagnosis of cardiovascular diseases (CVD) [2]. Unfortunately, limitations inbudget and skilled man-power often impede access to this vital information. However,valuable vascular indices can still be determined from the shape of the CBP waveformwithout knowledge of the absolute amplitude.
The proposed approach in this work can be considered a positive step towardsproviding the physician with relevant clinical indices, allowing for a more confident
138 Experimental Feasibility Study of Estimation of the Normalized Central Blood Pressure Waveform from Radial Photoplethysmogram
83
100
90
80
70
60
50
40
30
20
10
0
88 88 88 86 8884 85 86
Mean = 85.2%
84 83
77
86 85 86El
emen
t 1 D
ay 1
Elem
ent 2
Day
1
Elem
ent 3
Day
1
Elem
ent 1
Day
2
Elem
ent 2
Day
2
Elem
ent 3
Day
2
Elem
ent 1
Day
3El
emen
t 3 D
ay 3
Elem
ent 2
Day
3El
emen
t 1 D
ay 4
Elem
ent 2
Day
4
Elem
ent 3
Day
4
Elem
ent 1
Day
5
Elem
ent 2
Day
5
Elem
ent 3
Day
5
Fitn
ess
%
Figure 16. Fitness values of [PPG → CBPN] models obtained using ITFRef on all 15segments. Horizontal dotted green line: mean Fitness value.

diagnosis. Compared to an applanation tonometer, the proposed technique is low-costas it requires only a reflective photoplethysmography probe. Not requiring a skilledoperator, it is also relatively easy to operate. Once the proper location with maximumPPG amplitude is identified, the probe remains secured in position via its wrist strap.Given the high degree of similarity of the shape of the reconstructed waveform to theestimated CBP by the de-facto standard device (SphygmoCor), one possible applicationcould be to determine vascular indices [2] which do not require the absolute values ofthe waveform. A comparison of these indices using these two signals (CBP fromSphygmoCor and CBPN as estimated via radial PPG) constitutes one of the futuredirections of our work.
4.2. Study LimitationsIn the present paper we have only considered one subject, thus an important question tobe addressed is the degree of similarity of the ARX models for different subjects. Ourliterature review shows the possibility of using either generalized (GTF) [17, 18] orindividualized (ITF) [19] transfer functions to assess CBPN based on the non-invasiveradial pressure. Using a GTF, there will be no need for individual calibration. However,these two techniques have been recently compared by Hahn et al. [20] showing that theITF yields more accurate results. Regarding the sources of variation in the model’sparameters, these can be categorized into three main groups: the inherent variationsduring numerical estimation of the model parameters due to the presence ofmeasurement noise, the effects of the probe position/contact pressure on the PPGwaveform and physiological factors. The effect of measurement noise on the ARXmodeling has been mitigated by carefully limiting the frequency bandwidth to 15 Hz andkeeping the data acquisition conditions relatively stable (subject at rest, fasting and in acontrolled environment). It was demonstrated that compliance with these conditionsproduced satisfactory results (mean Fitness of 85.2 %).
In order to reduce the effect of the position of PPG probe over the respective radialarteries, an automatic system should be designed allowing for the determination andselection of the optimum probe position by switching an array of LED photodetectors.It is also well known that the probe contact pressure plays an important role in thegenesis of the PPG [21]. At zero transmural pressure, the radial forces are eliminatedand compliance is maximum (Figure 2), producing maximum amplitude PPG. Inpractice, this position is found with trial and error. Our experience is that if the operatoris patient enough, the position of the probes (either tonometer or PPG) can be close tothe optimum location. This is a routine practice with the clinical standard SphygmoCorSystem [22]. However, there is room for improvement as the time spent to find thisoptimum position is not negligible. Another factor affecting the quality of the signal isthe battery voltage supplied to the PPG sensor. In our experience, the amplitude of therecorded PPG decreases whenever the battery approaches depletion. Since it is difficultto use a DC power supply due to extra power-line noise, the battery voltage must befrequently checked by the operator to ensure that the nominal voltage is suppliedthroughout the entire recording session.
Finally, physiological factors need to be considered in a realistic clinical settingwhere subjects would be selected from healthy as well as populations with risk
Journal of Healthcare Engineering · Vol. 6 · No. 1 · 2015 139

factor(s). An interesting question would be to evaluate the effect of health conditionsknown to affect the vascular system on the models. To this end, it is necessary to extendthis study with a pool of subjects chosen, for example, from the healthy, hypertensive,and diabetic subjects. Furthermore, the effects of age and gender on model variabilityneed to be investigated.
4.3. Future DirectionsIn order to better evaluate the real potential of this method in clinical applications, thesubject sample size can be increased. We are currently focusing on developing thismodel with more candidates among different age groups, gender and health conditions.Our primary results prove the possibility of introducing besides an individualizedtransfer function (ITF), and a generalized one (GTF). The question to be addressed isthe amount of loss of accuracy when switching from an ITF to a GTF.
In order to better differentiate between various vascular conditions, it is also possibleto elucidate a response from the radial artery by using a non-invasive stimulus such astemporary occlusion of the artery (such as flow-mediated dilation-FMD [23, 24]. Thisstimulus can be used to create a characteristic response from the endothelium layer, andit is logical to expect that this response will affect the transfer function (TF) betweenCBPN and PPG. An interesting area would be to investigate the possibility of evaluatingthe endothelial function using the changes of the parameters of this TF caused by FMD.
Millasseau et al. [10] proposed a similar approach for modeling the relationshipbetween finger PPG and BP. However, the tip of the finger may inherently be affectedby the natural auto-regulation mechanism. An interesting topic would be to compare themodels obtained by the two methods with the objective of inferring a more exact auto-regulation mechanism in the finger. Indeed, the finger contains a microvascular bed,and it is well known that blood circulation in arterioles is prone to the effects of auto-regulation [25]. The role of this auto-regulation control loop is to maintain the perfusionof the tissues independent from the blood pressure. Therefore, any time-invariantdynamic model (or transfer function if the system is considered linear) aiming atestablishing a relationship between the PPG and BP(t) at an anatomical location whichis under the effect of auto-regulation can only remain accurate for a short period of time.As the output becomes quasi-independent from the input, it is clear that auto-regulationeffects on the finger blood micro-circulation are difficult to account for by the TF,contributing to errors in the estimated BP(t). The above statement may also explain whythe recommended position for the tonometer is a conduit vascular structure such as theradial artery for a faithful measurement of BP(t). Moreover, higher order of ARXmodels may provide better results in some of the subjects; therefore, this fact should beinvestigated to find the optimum order reflecting best model fitness for all subjects.Exploiting these features could minimize the FPE and consequently enhance the overallmodel fitness for a sizeable population of subjects.
Finally, it is interesting to note the difference in the frequency bands reported byvarious researchers. Whereas our results point to a resonance around 4 Hz (Figure 11and Figure 12), Segers et al. [26] reported a frequency response with a low-impedancephenomena occurring at around 5 Hz. Millasseau [10] reported a higher resonance at
140 Experimental Feasibility Study of Estimation of the Normalized Central Blood Pressure Waveform from Radial Photoplethysmogram

above 6 Hz. Despite acknowledging the fact that the modeling and experimentalconditions were different in these studies, proper interpretation of these differences willcertainly shine more light on vascular dynamics.
5. CONCLUSIONReliable estimation of the amplitude-normalized waveform of the central bloodpressure by radial PPG has been proven to be possible using an autoregressive withexogenous input (ARX) model. It was shown that the parameters of the obtained modelover five different days remain stable and the mean value of the Fitness was greaterthan 85% for the same subject. This technique is considerably more cost effectivecompared to the tonometer-based systems, and may be rendered independent from theoperator’s skills level in the near future with an array sensor. Our group will focus onstudying the effects of age, gender as well as health conditions and the possibility ofdefining a single model for different subjects. Clearly, as an immediate future step, it isalso possible to convert, through an appropriate calibration equation, the availableestimated signal into mmHg dimension, to improve the practical clinical applicationand value of the proposed system.
ACKNOWLEDGMENTThis research was supported in part by the Ministry of Science, Technology, andInnovation (MOSTI) of Malaysia under Science Fund Grant 03-01-02-SF0703 andINDUSTRI-2013-006, PRGS/1/13/TK02/UKM/02/1.
CONFLICT OF INTERESTThe authors declare that they have no conflict of interest.
NOMENCLATUREAC Alternating CurrentARMAX Autoregressive moving-average with exogenous inputARX Autoregressive with exogenous inputBP Blood Pressure CBP Central Blood PressureCBPN Normalized Central Blood Pressure CV Coefficient of VariationCVD Cardiovascular DiseaseDBP Diastolic Blood Pressure DC Direct CurrentECG ElectrocardiogramEFTE Empirical Fourier Transform EstimateFPE Final Prediction ErrorFIR Finite Impulse Response FMD Flow Mediated DilationGTF General Transfer FunctionITF Individualized Transfer Function
Journal of Healthcare Engineering · Vol. 6 · No. 1 · 2015 141

LPF Low Pass FilterMAP Mean Arterial Pressure NI National InstrumentsPart Arterial PressurePext External Pressure PPG PhotoplethysmogrmPtr Transmural Pressure PWA Pulse Wave AnalysisSBP Systolic Blood Pressure SD Standard DeviationTF Transfer FunctionTFRef Reference Transfer Function UKM Universiti Kebangsaan MalaysiaUS Ultrasound
REFERENCES[1] M. Pavel, H. B. Jimison, H. D. Wactlar, T. L. Hayes, W. Barkis, J. Skapik, et al., “The Role of
Technology and Engineering Models in Transforming Healthcare,” Biomedical Engineering, IEEEReviews in, vol. 6, pp. 156–177, 2013.
[2] A. P. Avolio, M. Butlin, and A. Walsh, “Arterial blood pressure measurement and pulse waveanalysis—their role in enhancing cardiovascular assessment,” Physiological measurement, vol. 31, p.R1, 2010.
[3] C. Vlachopoulos, K. Aznaouridis, M. F. O’Rourke, M. E. Safar, K. Baou, and C. Stefanadis,“Prediction of cardiovascular events and all-cause mortality with central haemodynamics: a systematicreview and meta-analysis,” European heart journal, vol. 31, pp. 1865–1871, 2010.
[4] R. W. Troughton, J. Ritzema, N. L. Eigler, I. C. Melton, H. Krum, P. B. Adamson, et al., “Direct leftatrial pressure monitoring in severe heart failure: long-term sensor performance,” Journal ofcardiovascular translational research, vol. 4, pp. 3–13, 2011.
[5] B. Fetics, E. Nevo, C. Chen, and D. A. Kass, “Parametric model derivation of transfer function fornoninvasive estimation of aortic pressure by radial tonometry,” Biomedical Engineering, IEEETransactions on, vol. 46, pp. 698–706, 1999.
[6] J. Penaz, A. Voigt, and W. Teichmann, “Contribution to the continuous indirect blood pressuremeasurement,” Zeitschrift fur die gesamte innere Medizin und ihre Grenzgebiete, vol. 31, pp.1030–1033, 1976.
[7] Available: www.atcormedical.com/sphygmocor.html, Accessed July 2014
[8] V. Sohani, E. Zahedi, K. Chellappan, and M. A. M. Ali, “A review of commercially available non-invasive vascular screening technologies for clinical applications,” in Biomedical Engineering andSciences (IECBES), 2012 IEEE EMBS Conference on, 2012, pp. 568–573.
[9] J. G. Webster, Design of pulse oximeters: CRC Press, 2002.
[10] S. C. Millasseau, F. G. Guigui, R. P. Kelly, K. Prasad, J. R. Cockcroft, J. M. Ritter, et al., “Noninvasiveassessment of the digital volume pulse comparison with the peripheral pressure pulse,” Hypertension,vol. 36, pp. 952–956, 2000.
[11] L. Ljung, System Identification: theory for the user. Upper Saddle River, New Jersey 07458: PrenticeHall,, 1999.
[12] L. Wang, E. Pickwell-MacPherson, and Y. Zhang, “Blood Pressure Contour Analysis after Exercise bythe Photoplethysmogram Using a Transfer Function Method,” Medical Devices and Biosensors, vol.ISSS-MDBS, pp. 82–85, 2008.
142 Experimental Feasibility Study of Estimation of the Normalized Central Blood Pressure Waveform from Radial Photoplethysmogram

[13] P. Segers, Vascular biomechanics and hemodynamics, 2010.
[14] J. Talts, R. Raamat, and K. Jagomägi, “Asymmetric time-dependent model for the dynamic fingerarterial pressure–volume relationship,” Medical and Biological Engineering and Computing, vol. 44,pp. 829–834, 2006.
[15] J. Sidhu, V. Newey, D. Nassiri, and J. Kaski, “A rapid and reproducible on line automated techniqueto determine endothelial function,” Heart, vol. 88, pp. 289–292, 2002.
[16] Available: http://www.wma.net/en/30publications/10policies/b3/. Accessed December 2014.
[17] J. E. Sharman, R. Lim, A. M. Qasem, J. S. Coombes, M. I. Burgess, J. Franco, et al., “Validation of ageneralized transfer function to noninvasively derive central blood pressure during exercise,”Hypertension, vol. 47, pp. 1203–1208, 2006.
[18] M. F. O’Rourke and A. Adji, “Noninvasive Generation of Aortic Pressure From Radial PressureWaveform By Applanation Tonometry, Brachial Cuff Calibration, and Generalized Transfer Function,”American journal of hypertension, vol. 27, pp. 143–145, 2014.
[19] J. O. Hahn, A. T. Reisner, F. A. Jaffer, and H. H. Asada, “Subject-specific estimation of central aorticblood pressure using an individualized transfer function: A preliminary feasibility study,” InformationTechnology in Biomedicine, IEEE Transactions on, vol. 16, pp. 212–220, 2012.
[20] J.-O. Hahn, “Individualized Estimation of the Central Aortic Blood Pressure Waveform: AComparative Study,” Biomedical and Health Informatics, IEEE Journal of, vol. 18, pp. 215-221, 2014.
[21] A. Grabovskis, Z. Marcinkevics, U. Rubins, and E. Kviesis-Kipge, “Effect of probe contact pressureon the photoplethysmographic assessment of conduit artery stiffness,” Journal of biomedical optics,vol. 18, pp. 027004–027004, 2013.
[22] C. Geoffrey, C. Rajkumar, J. Kooner, J. Cooke, and C. J. Bulpitt, “Estimation of central aortic pressureby SphygmoCor® requires intra-arterial peripheral pressures,” Clinical Science, vol. 105, pp.219–225, 2003.
[23] E. Zahedi, R. Jaafar, M. M. Ali, A. Mohamed, and O. Maskon, “Finger photoplethysmogram pulseamplitude changes induced by flow-mediated dilation,” Physiological measurement, vol. 29, p. 625,2008.
[24] M. Zaheditochai, R. Jaafar, and E. Zahedi, “Non-invasive techniques for assessing the endothelialdysfunction: ultrasound versus photoplethysmography,” in 13th International Conference onBiomedical Engineering, 2009, pp. 65–68.
[25] P. A. S. A. Reisner, D. McCombie and H. Asada, “Utility of the photoplethysmogram in circulatorymonitoring,” Anesthesiology, vol. 108, pp. 950–958, 2008.
[26] P. Segers, N. Stergiopulos, P. Verdonck, and R. Verhoeven, “Assessment of distributed arterial networkmodels,” Medical and Biological Engineering and Computing, vol. 35, pp. 729–736, 1997.
APPENDIX A. LOW-PASS FILTER CODE IN MATLABFs = 1613; % Sampling FrequencyFpass = 10; % Passband FrequencyFstop = 40; % Stopband FrequencyDpass = 0.057501127785; % Passband RippleDstop = 0.0001; % Stopband Attenuationdens = 20; % Density Factor% Calculate the order from the parameters using FIRPMORD.[N, Fo, Ao, W] = firpmord ([Fpass, Fstop]/(Fs/2), [1 0], [Dpass, Dstop]);% Calculate the coefficients using the FIRPM function.b = firpm(N, Fo, Ao, W, {dens});Hd = dfilt.dffir(b);
Journal of Healthcare Engineering · Vol. 6 · No. 1 · 2015 143

APPENDIX B. COMPUTATION OF THE CONFIDENCE INTERVALGiven the general weighted least square error and the covariance matrix of
, the confidence interval is defined as [11]:
where N (0, pN) is the zero mean normal distribution with variance pN. For the ith
component of ,
where pNii indicates the ith diagonal element of PN. In fact the last equation defines an
ellipsoidal shape with a width determined by pN.
θ θ−
∈p
N(0,1)Ni i
Nii
0
θ̂N
θ̂N
θ = pˆN N
θ θ− ∈N pˆ (0, )N N0
144 Experimental Feasibility Study of Estimation of the Normalized Central Blood Pressure Waveform from Radial Photoplethysmogram

International Journal of
AerospaceEngineeringHindawi Publishing Corporationhttp://www.hindawi.com Volume 2014
RoboticsJournal of
Hindawi Publishing Corporationhttp://www.hindawi.com Volume 2014
Hindawi Publishing Corporationhttp://www.hindawi.com Volume 2014
Active and Passive Electronic Components
Control Scienceand Engineering
Journal of
Hindawi Publishing Corporationhttp://www.hindawi.com Volume 2014
International Journal of
RotatingMachinery
Hindawi Publishing Corporationhttp://www.hindawi.com Volume 2014
Hindawi Publishing Corporation http://www.hindawi.com
Journal ofEngineeringVolume 2014
Submit your manuscripts athttp://www.hindawi.com
VLSI Design
Hindawi Publishing Corporationhttp://www.hindawi.com Volume 2014
Hindawi Publishing Corporationhttp://www.hindawi.com Volume 2014
Shock and Vibration
Hindawi Publishing Corporationhttp://www.hindawi.com Volume 2014
Civil EngineeringAdvances in
Acoustics and VibrationAdvances in
Hindawi Publishing Corporationhttp://www.hindawi.com Volume 2014
Hindawi Publishing Corporationhttp://www.hindawi.com Volume 2014
Electrical and Computer Engineering
Journal of
Advances inOptoElectronics
Hindawi Publishing Corporation http://www.hindawi.com
Volume 2014
The Scientific World JournalHindawi Publishing Corporation http://www.hindawi.com Volume 2014
SensorsJournal of
Hindawi Publishing Corporationhttp://www.hindawi.com Volume 2014
Modelling & Simulation in EngineeringHindawi Publishing Corporation http://www.hindawi.com Volume 2014
Hindawi Publishing Corporationhttp://www.hindawi.com Volume 2014
Chemical EngineeringInternational Journal of Antennas and
Propagation
International Journal of
Hindawi Publishing Corporationhttp://www.hindawi.com Volume 2014
Hindawi Publishing Corporationhttp://www.hindawi.com Volume 2014
Navigation and Observation
International Journal of
Hindawi Publishing Corporationhttp://www.hindawi.com Volume 2014
DistributedSensor Networks
International Journal of