experimental characterization of masonry and … · experimental characterization of masonry and...
TRANSCRIPT

Experimental Characterization of Masonry and Masonry Components at High Strain
Rates
João M. Pereira a*, Paulo B. Lourenço b
a Postdoctoral Researcher, ISISE, Department of Civil Engineering, University of Minho,
Guimarães, Portugal
b Full Professor, ISISE, Department of Civil Engineering, University of Minho, Guimarães,
Portugal
* Corresponding author: Department of Civil Engineering, University of Minho, Campus de
Azurém, Guimarães, 4800-058, Portugal; email: [email protected]
Abstract: The strain rate effect influences the mechanical properties on most construction
materials and its investigation is critical for structural engineering. Current materials such as
steel or concrete have been intensively investigated. However, similar studies on the dynamic
properties of masonry or masonry components such as clay brick or mortar are scares. This
work intends to study the behavior of masonry and its usual components (clay brick and
mortar) when subjected to high strain rates. A Drop Weight Impact Machine is used at
different heights and weights introducing different levels of strain rate. Empirical relations of
Dynamic Increase Factors (DIF) are derived from the experimental results and the strain rate
effect on compressive strength, compressive fracture energy, strain at peak strength and
Young’s modulus are determined and presented.
Keywords: Masonry, Compression, Impact, Drop Weight, Strain rate, DIF

Introduction
When modelling or designing structures under impulsive loading (high velocity impacts or
blast loads) it is important to understand the effect that the high strain rates have on the
mechanical properties of materials. When subjected to dynamic loading conditions, materials
can have a much different behavior when compared with their static behavior (Meyers 1994;
Hiermaier 2008; Ngo et al. 2004; Stavrogin and Tarasov 2001). However, most research
work on structural response and damage under impact and blast loading assumes typically
quasi-static material properties (Baylot et al. 2005; Moreland et al. 2005), which could lead to
inaccurate structural assessment.
Strain rate effect is a phenomenon already introduced into some standards (CEB-FIP 2010;
UFC 3-340-02 2008) for construction materials such as concrete or reinforcement steel
(Grote et al. 2001; Malvar and Ross 1998). However, in the case of masonry materials, such
as bricks or mortar, this is not the case, and the available studies in the literature are very
limited. Recent studies showed that this effect on masonry materials is considerable. Burnett
et al. 2007 used a specially designed Split-Hopkinson pressure bar to study the tensile
behavior of a mortar joint under dynamic loading. These authors (Burnett et al. 2007)
concluded that the tensile strength had an enhancement of 3 times its quasi-static reference
for a strain rate of 1 s-1. Asprone et al. 2009 studied the tensile behavior of Italian stone under
high strain rates and also obtained an increase of the tensile strength 3 times its static
reference under impulsive loading. On the other hand, Hao and Tarasov 2008 studied the
compressive behavior of high compressive strength clay brick using a Triaxial Static-
Dynamic Testing Machine and showed that the mechanical properties are influenced by the
strain rate. For strain rate of 150 s-1, these authors (Hao and Tarasov 2008), reported dynamic
increase factors of 2.3, 1.12 and 1.95 for the compressive strength, strain at peak strength and
Young’s modulus, respectively.

This paper presents an extensive experimental campaign on the influence of the strain rate on
the compressive behavior of masonry and its usual components (clay brick and mortar).
These tests were performed using a Drop-Weight tower available at University of Minho.
Similar equipment has previously been used to study the strain rate effect on different
materials (Islam and Bindiganavile 2011; Zhang et al. 2010; Banthia et al. 1998). This work
intends to quantify the influence of the strain rate on the mechanical properties (compressive
strength, Young’s modulus, strain at peak strength and compressive fracture energy) of
masonry and its components by developing empirical relations in the form of Dynamic
Increase Factors, based on these experimental campaigns.
Testing equipment
The available Drop-Weight tower (Figure 1a) allows hammer weight up to 150 kg and drop
heights up to 9 meters (Figure 1b). A load cell was used at the base of the specimen
(Figure 1c) to measure the load profile. This was a VETEK c2s model load cell and it was
connected to an acquisition system composed of a SCXI-1000DC chassis, a generic input
module SCXI-1520 with a SCXI-1314 mount, and a SCXI-1600 data acquisition and control
card for PC connection. This control card limits the sampling speed to 200 samples per
millisecond. This sampling speed was found to be enough even when multiple channels were
used simultaneously.
Two different methodologies were used to capture the deformation behavior of the
specimens: a) high speed video equipment; b) strain gauges. A PHOTRON FastCam APX –
RS (Figure 1d) allowed measuring the strain in only one face of the specimen using targets
and performing tracking sweep of the result videos (using TEMA Tracking Software v: 3.1-
005). This high speed video equipment also allowed capturing the overall behavior of the
specimens in slow-motion. The strain gauges used in these tests were PFL-30-11-3L from
TML and were connected to the same acquisition system. When strain gauges were used, one

strain gauge was placed in each face of the specimen. Due to cost-efficiency reasons, the
quasi-static tests (fewer tests) were performed using strain gauges and the impulsive tests
were performed using the high speed video equipment. However, some impulsive tests were
also performed using strain gauges to compare and validate the results obtained from the high
speed video equipment.
Specimens description
In order to avoid resonances and inertial effects, when testing at high strain rates, the
dimensions of the specimens must be a compromise between: a) maximizing the size of the
specimen to have a complete representation of the materials; b) proper height to base cross
section ratio to reduce the friction effects at both ends of the specimen; c) minimizing the size
of the specimen to reduce the inertia effect and the non-uniform stress and strain distribution
(Harding 1989; Dioh et al. 1995). This often leads to small specimens where the assumption
of stress equilibrium is retained within the specimen.
The objective of this study was to reproduce old Portuguese masonry construction. The bricks
used were handmade clay bricks from Galveias (a village located in Central Portugal). The
solid clay brick from Galveias (Figure 2a) was used to prepare the brick specimens. The brick
specimen measured 70×30×30 mm (Figure 2b) and five specimens were cut (Figure 2c) from
the original solid brick (measuring 200×100×50 mm). The procedure to prepare the brick
specimen followed the recommendations of the European standard for testing masonry units
in compression EN 772-1 2011 and was as follows:
a) Specimens with 70×30×30 mm were cut from the original brick using a disc cutting
machine;
b) The edges were confirmed to be intact and the top and bottom (loadbearing) surfaces
were ensure to be flat and parallel to each other using a grinding machine;
c) The specimens were left to dry in a ventilated oven at 105ºC until constant mass;

d) The specimens were kept in a non-ventilated oven at 40ºC until 1 hour before testing.
The mortar specimens were prepared from a commercial ready-mix mortar (MAPEI MAPE-
ANTIQUE MC). In order to take advantage from the already prepared testing rig, the
dimensions of the mortar specimens were kept the same as the brick specimens
(70×30×30mm). The ratio for the ready-mix mortar was 25 kg of product for 3.9 liters of
water, which resulted in 16 cm flow (good workability). The procedure to prepare the mortar
specimens was as follows:
a) Prepare the mixture at the presented ratio and place the mixture in the molds
(Figure 2e);
b) The molds were placed in a climatic chamber at 25ºC and 65% humidity for five days;
c) The specimens were taken from their molds after five days and tested in that same
day.
The reason for testing the mortar specimens after five days was due to its compressive
strength. It was intended to test mortars with compressive strength as similar as possible to
old mortars and this was achieved at five days of curing when the compressive strength of
these mortar specimens averaged 3 MPa.
Finally, the masonry specimens were built using four cut clay bricks and three mortar joints
(10 mm joint) in a stacked pattern. The masonry specimens’ dimensions derived from the test
setup limitations and were 230×80×80 mm. From each solid brick, two cut clay bricks were
prepared to match these dimensions (Figure 2d). It should be noted that because of the cutting
schemes available to make the required dimensions, the testing direction for the brick and
masonry specimens wasn’t the same. This could have some influence in the reported results,
as this material is orthotropic. The masonry specimens were prepared on top of an aluminium
plate which connects to the load cell. In order to have full contact between the first brick and
the aluminium plate a thin layer of mortar was placed before the first brick (Figure 2f).

although the masonry specimens were prepared in a flat surface, due to their own
irregularities, a layer of self-leveling mortar was used on top of the specimens to guarantee
that the top and bottom surfaces (loadbearing) were flat and parallel to each other. The
procedure to prepare and store the masonry specimens was similar to the procedures for the
brick and mortar specimens.
Quasi-static regime
Some specimens were tested under quasi-static uniaxial compression in order to compare the
results from the impulsive testing and determine the quasi-static reference for the studied
mechanical properties. For the quasi-static compression tests, the test setup consisted of a
steel frame which supported a servo-controlled actuator, with a 25 kN (50 kN for the masonry
specimens) load capacity. The strain in the test specimen was obtained with three LVDTs at a
120º degree angle in a plan view, and four strain gauges, i.e. one in each face (Figure 3a).
These tests were performed according to the EN 772-1 2011 standard.
The typical relations for stress-strain and stress-displacement can be seen in Figure 3b and
Figure 3c, respectively. As can be seen in Figure 3b, the compressive strength (σmax) is the
maximum value of the stress-strain curve (Figure 3b); the corresponding strain is the strain at
peak strength (εu); the Young’s modulus (E) was taken as the slope of the stress-strain
diagram between 0.3 and 0.8 of the maximum stress (Figure 3b); the procedure to calculate
the compressive fracture energy (Gc) was used previously by Vasconcelos et al. 2009 and is
similar to the procedure presented by Jansen and Shah 1997, consisting in calculating the
marked area in Figure 3c.
Five clay brick specimens, nine mortar specimens and four masonry specimens were tested
and Table 1 shows the average results obtained for the quasi-static tests. The highest
compressive strength was obtained for the brick specimens with 13.59 MPa. The maximum
Young’s modulus was also obtained for the brick specimens with 2.32 GPa. The compressive

fracture energy obtained for the masonry specimens is much larger than the fracture energy
obtained for both the brick and mortar specimens. This was due to the interaction between the
masonry individual components (brick and mortar) resulting in a higher deformation capacity
showed in the masonry specimens. Due to the fact that these brick were handmade the
coefficient of variation (CoV) obtained for the brick specimens is higher than the values
obtained for mortar (Table 1). The compressive strength of these hand-made bricks is also
low when compared with commercial solid clay bricks, and previous studies on the high
strain rate effect of clay bricks were performed on higher compressive strength bricks (Hao
and Tarasov 2008). This should be kept in mind later when comparing the obtained results
with similar studies. The values presented in Table 1 were established as the static properties
for these materials and were taken as the static reference when determining the dynamic
increase factors.
Dynamic regime
For the dynamic regime testing, the Drop Weight (DW) impact machine was used. Several
impact tests under uniaxial compression were performed. Figure 4 shows example of stress-
strain curves obtained from these experimental tests for brick specimens. These curves were
simplified in order to facilitate the treatment of the obtained data. The strain profile was
approximated to a linear function while the stress profile was approximated to a second
degree polynomial, resulting in second degree polynomials for the stress-strain curves.
The mechanical properties were determined from the stress-strain or stress-displacement for
each test and compared with the quasi-static reference by means of Dynamic Increase Factors
(DIF) which can be calculated using the following equation:
��� =�������� (�������)
�������� (������), �( �) (1)
The influence of the strain rates in the mechanical properties is usually described and
presented as bi-log-linear relations. One log-linear relation for the quasi-static regime with
low slope and one log-linear relation for the dynamic regime with higher slope. One common
simplification is to consider the first relation (quasi-static) as constant and set as DIF equals
to 1 (one). The point where the regime changes to dynamic was determined as the
intersection of the log-linear relation obtained experimentally for the dynamic regime and the
function DIF = 1, considered for the quasi-static regime.
Brick dynamic properties
A total of 58 clay brick specimens were tested under impulsive loading, with strain rate
ranging from 4 s-1 to 199 s-1. For these tests the acquisition frequency for the strain-time
curve was set at 20 kHz and the acquisition frequency for the stress-time curve was set at 40
kHz. The acquisition frequency on the video equipment was greatly dependent on the lighting
conditions and was set as the maximum possible at the time of the tests. The typical image
sequence of the performed tests can be seen in Figure 5.
Table 2 shows partial results obtained on the impact tests for clay brick specimens. Only
some of the results are shown here, however, to establish the DIF relations all 58 tests were
used. Five additional tests using strain gauges were performed in order to cross-check the
results obtained with the targets and video equipment. These five tests represent 20
measurements with strain gauges, being one strain gauge in each of the four faces of the
specimen and taken the average from each test. As mentioned previously, with the video
equipment only one face of the specimen can be measured and the possible rotation of the
specimen cannot be captured, meaning that single strain value has to be considered carefully.
As expected, the strain rate influences the compressive strength of clay brick specimens
(Figure 6). For a strain rate of 200 s-1 the obtained dynamic increase factor for compressive
strength was 2.5, meaning that for that value of strain rate the compressive strength of this
type of brick is two and a half time its quasi-static reference. The obtained log-linear trend-
line for the impulsive tests (Eq. 2) has a coefficient of determination R2 higher than 70%,

being considered good taking into account the handmade nature of this material. It should
also be noticed that the results obtained with the strain gauges have a good agreement with
the results obtained with the video equipment. Hao and Tarasov 2008, who also tested solid
clay brick with different equipment, found similar conclusions. Those authors (Hao and
Tarasov 2008) obtained a compressive strength DIF of 2.31 at a strain rate of 150 s-1, and
with the proposed relations a DIF of 2.44 is obtained for the same strain rate.
Figure 7 presents the influence of the strain rate on the dynamic increase factor for the
mechanical properties of clay brick: a) compressive strength; b) Young’s modulus; c) strain
at peak strength; and d) compressive fracture energy. The strain rate influences the Young’s
modulus of this material and the Young’s modulus for a strain rate of 200 s-1 is 2.4 times
greater than the static reference. The influence of the strain rate in the Young’s modulus has a
similar behavior to the compressive strength. Hao and Tarasov 2008 reported a DIF of 1.95
for a strain rate of 150 s-1 which compares with a DIF of 2.21 obtained with the proposed
relation. Regarding the strain at peak strength, the results show that this property is less
influenced by the strain rate, when compared with the other mechanical properties. This was
also reported by Hao and Tarasov 2008. These authors reported a DIF for the strain at peak
strength of 1.12 for a strain rate of 150 s-1, and with the proposed relations a DIF of 1.29 is
obtained for the same strain rate. At a strain rate of 200 s-1 the strain at peak strength is only
1.31 times greater than its static reference. As the results show, the fracture energy is greatly
influenced by the strain rate. For strain rates of 200 s-1 the fracture energy is 5.95 times
greater than the static reference. Although it was not possible to find results in the literature
for comparison, similar results were obtained using two different methods (strain gauges and
fast video equipment).
Figure 7 summarizes the results obtained for clay brick under impulsive loading. Both the
compressive strength and the Young’s modulus showed similar behavior under high strain
rates, which is consistent with the fact that the strain at peak strength is the least influenced
mechanical properties. The fact that the increase of the compressive fracture energy is more
than twice the increase of the compressive energy suggests that the post-peak behavior of this
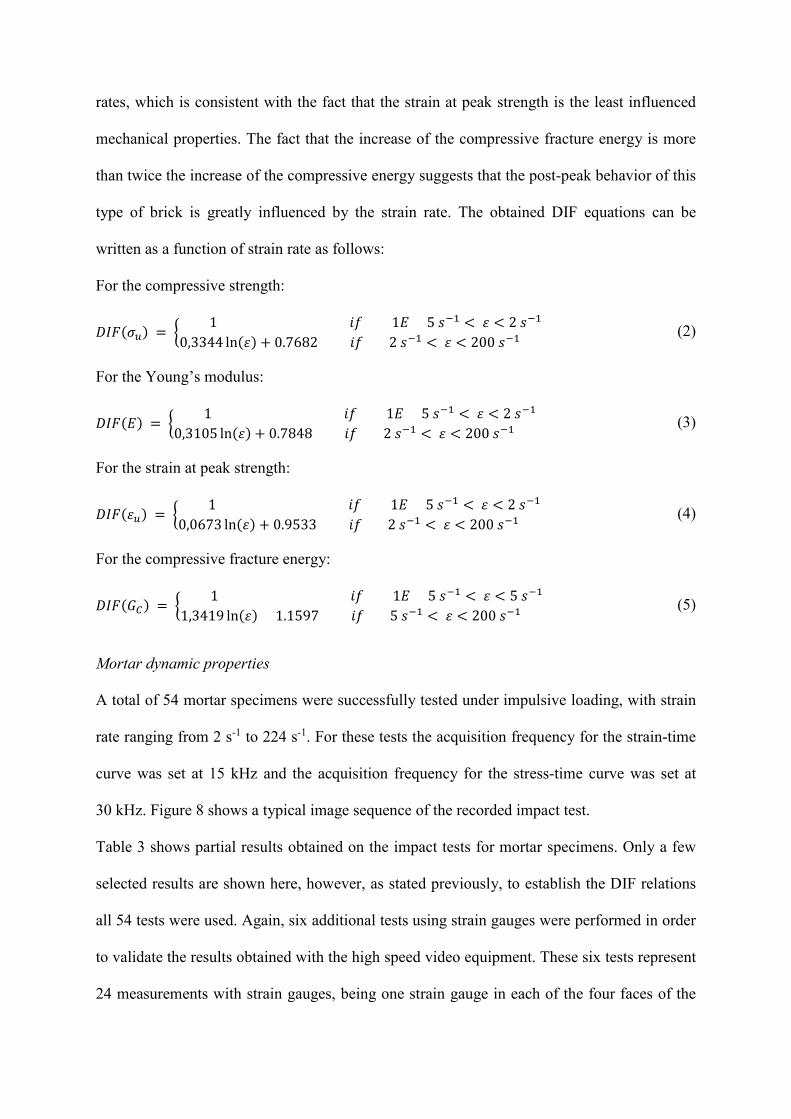
type of brick is greatly influenced by the strain rate. The obtained DIF equations can be
written as a function of strain rate as follows:
For the compressive strength:
���(��) = �1 �� 1� 5 ��� < � < 2 ���
0,3344 ln(�) + 0.7682 �� 2 ��� < � < 200 ��� (2)
For the Young’s modulus:
���(�) = �1 �� 1� 5 ��� < � < 2 ���
0,3105 ln(�) + 0.7848 �� 2 ��� < � < 200 ��� (3)
For the strain at peak strength:
���(��) = �1 �� 1� 5 ��� < � < 2 ���
0,0673 ln(�) + 0.9533 �� 2 ��� < � < 200 ��� (4)
For the compressive fracture energy:
���(��) = �1 �� 1� 5 ��� < � < 5 ���
1,3419 ln(�) 1.1597 �� 5 ��� < � < 200 ��� (5)
Mortar dynamic properties
A total of 54 mortar specimens were successfully tested under impulsive loading, with strain
rate ranging from 2 s-1 to 224 s-1. For these tests the acquisition frequency for the strain-time
curve was set at 15 kHz and the acquisition frequency for the stress-time curve was set at
30 kHz. Figure 8 shows a typical image sequence of the recorded impact test.
Table 3 shows partial results obtained on the impact tests for mortar specimens. Only a few
selected results are shown here, however, as stated previously, to establish the DIF relations
all 54 tests were used. Again, six additional tests using strain gauges were performed in order
to validate the results obtained with the high speed video equipment. These six tests represent
24 measurements with strain gauges, being one strain gauge in each of the four faces of the

specimen and taken the average from each test. As mentioned previously, with the video
equipment only one face of the specimen can be measured and the possible rotation of the
specimen cannot be captured, meaning that single strain value has to be considered carefully.
As expected, the strain rate influences the compressive strength of mortar specimens (Figure
9a). For a strain rate of 200 s-1 the obtained dynamic increase factor for compressive strength
was 4.13, meaning that for that value of strain rate the compressive strength of this type of
mortar is four times its quasi-static reference. The obtained log-linear trend-line for the
impulsive tests (Eq. 6) has a coefficient of determination R2 of 85%. It should also be noticed
that the results obtained with the strain gauges have a good agreement with the results
obtained with the video equipment. Figure 9b presents the influence of the strain rate on the
dynamic increase factor for the mechanical properties of mortar: a) compressive strength; b)
Young’s modulus; c) strain at peak strength; and d) compressive fracture energy. Regarding
the Young’s modulus these results show that for a strain rate of 200 s-1 the Young’s modulus
should be 3 times greater than its static reference. The Young’s modulus appears to be less
sensitive to the strain rate when compared with the compressive strength. Like previously, for
the brick specimens, the strain at peak strength is the least affected property by the strain rate.
For a strain rate of 200 s-1 the strain at peak strength has a dynamic increase factor of 1.11.
Unlike the results obtained for clay brick, the strain rate has a smaller influence on the
fracture energy of this kind of mortar. The results show that for strain rates of 200 s-1 the
dynamic increase factor, for the fracture energy, is 2.73. Although it was not possible to find
similar results in the open literature for comparison the relation here presented shows similar
results for both the strain gauges and the video equipment.
As it can be seen from Figure 9b, there is a more pronounced difference between the dynamic
increase factor of the compressive strength and the Young’s modulus. The results obtained
for the fracture energy show that the influence of the strain rate in the post-peak behavior is
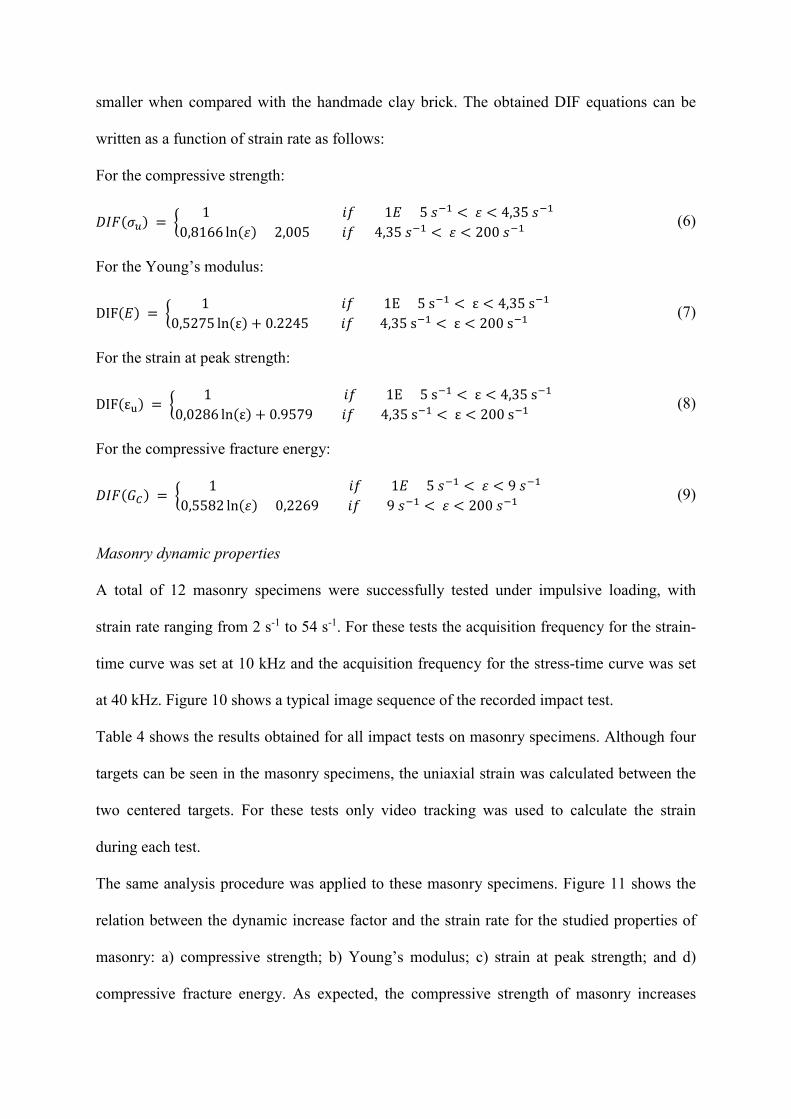
smaller when compared with the handmade clay brick. The obtained DIF equations can be
written as a function of strain rate as follows:
For the compressive strength:
���(��) = �1 �� 1� 5 ��� < � < 4,35 ���
0,8166 ln(�) 2,005 �� 4,35 ��� < � < 200 ��� (6)
For the Young’s modulus:
DIF(�) = �1 �� 1E 5 s�� < ε < 4,35 s��
0,5275 ln(ε) + 0.2245 �� 4,35 s�� < ε < 200 s�� (7)
For the strain at peak strength:
DIF(ε�) = �1 �� 1E 5 s�� < ε < 4,35 s��
0,0286 ln(ε) + 0.9579 �� 4,35 s�� < ε < 200 s�� (8)
For the compressive fracture energy:
���(��) = �1 �� 1� 5 ��� < � < 9 ���
0,5582 ln(�) 0,2269 �� 9 ��� < � < 200 ��� (9)
Masonry dynamic properties
A total of 12 masonry specimens were successfully tested under impulsive loading, with
strain rate ranging from 2 s-1 to 54 s-1. For these tests the acquisition frequency for the strain-
time curve was set at 10 kHz and the acquisition frequency for the stress-time curve was set
at 40 kHz. Figure 10 shows a typical image sequence of the recorded impact test.
Table 4 shows the results obtained for all impact tests on masonry specimens. Although four
targets can be seen in the masonry specimens, the uniaxial strain was calculated between the
two centered targets. For these tests only video tracking was used to calculate the strain
during each test.
The same analysis procedure was applied to these masonry specimens. Figure 11 shows the
relation between the dynamic increase factor and the strain rate for the studied properties of
masonry: a) compressive strength; b) Young’s modulus; c) strain at peak strength; and d)
compressive fracture energy. As expected, the compressive strength of masonry increases

with the increase of strain rate. According to these results and for a strain rate of 200 s-1, the
compressive strength of these masonry specimens is more than two times greater than its
static reference. This log-linear relation has a R2 of 80 %. Comparing the results with the
results obtained for its components (brick and mortar), it can be seen that these are closer to
the results presented for the handmade clay brick. The Young’s modulus is also influenced by
the increase in strain rate. For a strain rate of 200 s-1 the Young’s modulus should be two
times greater than its static reference. Comparing these results with the results obtained for its
components, it can be seen that these are closer to the results presented for the handmade clay
brick, similar to the observation made for the compressive strength. Similar to what was
observed for its components, the strain at peak strength is the least influenced by the strain
rate. For a strain rate of 200 s-1 the strain at peak strength is 1.26 times its static reference.
The observations regarding these properties are similar to the ones already presented for the
other materials (brick and mortar). Again, similar to the components of these masonry
specimens, the compressive fracture energy has a considerable increase with the increase of
strain rates. For a strain rate of 200 s-1 the fracture energy should be three times greater than
its static reference, similar to what was observed for the mortar specimens. In order to easily
compare these results with the obtained results for clay brick and mortar, these values were
extrapolated for strain rates of 200 s-1, as the tests were only performed until 54s-1.
Figure 11 summarizes the results obtained for masonry prims under impulsive loading. Both
the compressive strength and the Young’s modulus showed similar behavior under high strain
rates, which is consistent with the fact that the strain at peak strength is the least influenced
mechanical properties. The fact that the increase of the compressive fracture energy is greater
than the increase of the compressive energy suggests, similarly to what has been observer for
the brick specimens, that the post-peak behavior of this type of brick is greatly influenced by

the strain rate. The obtained DIF equations can be written as a function of strain rate as
follows:
For the compressive strength:
���(��) = �1 �� 1� 5 ��� < � < 3 ���
0,2798 ln(�) + 0,6863 �� 3 ��� < � < 200 ��� (10)
For the Young’s modulus:
���(�) = �1 �� 1� 5 ��� < � < 1.7 ���
0,2409 ln(�) + 0,8701 �� 1.7 ��� < � < 200 ��� (11)
For the strain at peak strength:
���(εu) = �1 �� 1� 5 ��� < � < 4 ���
0,0678 ln(�) + 0,9036 �� 4 ��� < � < 200 ��� (12)
For the compressive fracture energy:
���(��) = �1 �� 1� 5 ��� < � < 2 ���
0,4716 ln(�) + 0,5968 �� 2 ��� < � < 200 ��� (13)
Comparison and discussion
The obtained results showed that the strain rate influences the compressive strength of the
studied materials, being derived dynamic increase factors (strain rate of 200 s-1) of 2.54, 4.13
and 2.17 for clay brick, mortar and masonry prims, respectively. The increase in the
compressive strength for mortar is almost twice the increase for clay brick and masonry
prims. The presence of synthetic fibers in the composition of this ready-mix mortar can
explain this difference. Previous studies suggest that the presence of fibers in the composition
of cementitious composites have a direct influence on the high strain rate behavior of these
materials (Zhou et al. 2013; Tran and Kim 2014).
The behavior of the Young’s modulus under high strain rates is similar to the compressive
strength, being derived dynamic increase factors (strain rate of 200 s-1) of 2.54, 4.13 and 2.17
for clay brick, mortar and masonry prims, respectively. In the case of the strain at peak
strength, the influence of the strain rate in this property is almost negligible, which is

consistent with the behavior observed for other geo-materials, such as rock and concrete (Hao
and Tarasov 2008; Zhao et al. 1999).
The obtained results showed that the strain rate influences the compressive fracture energy of
the studied materials, being derived dynamic increase factors (strain rate of 200 s-1) of 5.95,
2.73 and 3.10 for clay brick, mortar and masonry prims, respectively. The high value
obtained for clay brick suggests that the post-peak behavior is more influenced for clay brick
than mortar. One of the reasons that could explain this difference is the porosity of the
materials, being 23% for clay brick and 9% for mortar (Dias 2005). In fact, Vasconcelos et al.
2009 suggested that the porosity of materials could be one of the physical properties with
direct influence on its post-peak behavior. The fact that the brick was studied in two different
directions for the brick specimens and masonry specimens (Figure 2) could also have
influenced these results, as this is an orthotropic material.
Conclusions
When modelling or designing structures under impulsive loading (high velocity impacts or
blast loads) it is important to understand the effect that the high strain rates have on the
mechanical properties of materials. This work showed that the strain rate influences the
mechanical properties of masonry and its components. A large experimental campaign was
performed on different materials under different loading conditions. The strain rate of the
performed tests ranged from 10-5 (quasi-static) up to 200 s-1 (impulsive). It was found that
most of the studied mechanical properties increased with the strain rate and dynamic increase
factors up to 6 were derived for strain rates of 200 s-1. Eq. 2 to Eq. 13 present the obtained
empirical relations able to translate the influence of the strain rate in the mechanical
properties of masonry and its components. There relations can be used to estimate the
behavior of these materials under different strain rates.

Acknowledgement
This work was performed under Project CH-SECURE funded by the Portuguese Foundation
of Science and Technology – FCT. The authors acknowledge the support. The first author
also acknowledges the support from his PhD FCT grant with the reference
SFRH/BD/45436/2008.
References
Asprone D, Cadoni E, Prota A, Manfredi G. Dynamic behaviour of a Mediterranean natural
stone under tensile loading. International Journal of Rock Mechanics and Mining Sciences
2009; 46(3):514-520.
Banthia N, Yan C, Sakai K. Impact resistance of fiber reinforced concrete at subnormal
temperatures. Cement and Concrete Composites 1998; 20(5): 393-404.
Baylot J, Bullock B, Slawson T, Woodson S. Blast response of lightly attached concrete
masonry unit walls. Journal of Structural Engineering 2005; 131(8): 1186-1193.
Burnett S, Gilbert M, Molyneaux T, Tyas A, Hobbs B, Beattie G. The response of masonry
joints to dynamic tensile loading. Materials and Structures 2007; 40(1): 517-527.
CEB-FIP. Comité euro-international du betón – model code 2010 – final draft. Thomas
Thelford Publications, Switzerland 2010.
Dias, A., Characterization of masonry subjected to impact, MSc Thesis, Department of Civil
Engineering, University of Minho, Portugal, 2005 (in Portuguese).
Dioh NN, Ivankovic A, Leevers PS, Williams JG. Stress wave propagation effects in split
Hopkinson pressure bar tests. Proceedings of the Royal Society of London A: Mathematical
and Physical Sciences 1995; 449(1936): 187-204.
EN 772-1, Methods of test for masonry units: Determination of compressive strength.
European standard, 2011.

Grote D, Park S, Zhou M. Dynamic behaviour of concrete at high strain rates and pressures.
Journal of Impact Engineering 2001; 25(9): 869-886.
Hao H, Tarasov BG. Experimental study of dynamic material properties of clay brick and
mortar at different strain rates. Australian Journal of Structural Engineering 2008; 8(2):117-
132.
Harding J. Mechanical properties at high rates of strain. In Proc. of the 4th International
Conference on Mechanical Properties of Materials at High Rates of Strain. UK 1989.
Islam MT, Bindiganavile V. The impact resistance of masonry units bound with fibre
reinforced mortars. Construction and Building Materials 2011; 25(6): 2851-2859.
Jansen DC, Shah S. Effect of length on compressive strain softening of concrete. Journal of
Engineering Mechanics 1997; 123(1): 25-35.
Malvar LJ, Ross CA. Review of static and dynamic properties of steel reinforcement bars.
ACI Material Journal 1998; 95(5): 609-616.
Meyers MA. Dynamic behaviour of materials. John Wiley & Sons Publications, USA 1994.
Hiermaier SJ. Structures under crash and impact – continuum mechanics, discretization and
experimental characterization. Springer Publications, Germany 2008.
Moreland C, Hao H, Wu CQ. Response of retrofitted masonry walls to blast loading. In Proc.
of the 6th Asia-Pacific Conference on Shock and Impact Loads on Structures, Australia 2005.
Ngo T, Mendis P, Hongwei M, Mak S. High strain rate behaviour of concrete cylinders
subjected to uniaxial compressive impact loading. In Proc. of the 18th Australasian
Conference on the Mechanics of Structures and Materials, Australia, 2004.
Stavrogin AN, Tarasov BG. Experimental physics and rock mechanics. Balkema
Publications, India 2001.

Tran TK, Kim DJ. High strain rate effects on direct tensile behavior of high performance
fiber reinforced cementitious composites. Cement and Concrete Composites 2014; 45(1):
186-200.
UFC 3-340-02. Structures to resist the effects of accidental explosions. Department of
Defence, USA 2008.
Vasconcelos G, Lourenço PB, Alves CAS, Pamplona J. Compressive behavior of granite:
Experimental approach. Journal of Materials in Civil Engineering 2009; 21(9): 502-511.
Zhang XX, Ruiz G, Yu RC. A new drop-weight impact machine for studying fracture
processes in structural concrete. International Journal for Experimental Mechanics 2010;
46(3): 252-257.
Zhao J, Li HB, Wu MB, Li TJ. Dynamic uniaxial compression tests on granite. International
Journal of Rock Mechanics and Mining Sciences 1999; 36(1): 273-277.
Zhou X, Ghaffar SH, Dong W, Oladiran O, Fan M. Fracture and impact properties of short
discrete jute fibre-reinforced cementitious composites. Materials & Design 2013; 49(1): 35-
47.

Table captions:
Table 1 – Average quasi-static mechanical properties of clay brick, mortar and masonry.
Table 2 – Examples of impact test results on clay brick.
Table 3 – Examples of impact tests results on mortar.
Table 4 – Impact tests results on masonry.

Figure captions:
Figure 1 – Drop Weight tower: a) schematic of the test setup b) testing site; c) brick specimen
just before testing; d) PHOTRON FastCam APX-RS.
Figure 2 – Materials: a) Galveias brick; b) brick specimen; c) brick cutting scheme for brick
specimens; d) brick cutting scheme for masonry specimens; e) mortar specimens’ molding; f)
masonry specimens aluminium base.
Figure 3 – Quasi-static testing: a) quasi-static testing apparatus; b) typical relation for stress –
strain; c) typical relation stress – displacement.
Figure 4 – Examples of stress-strain curves at different strain rates for clay brick.
Figure 5 – Typical test sequence for clay brick.
Figure 6 – DIF (Compressive strength) for clay brick.
Figure 7 – DIFs for clay brick mechanical properties.
Figure 8 – Typical test sequence on mortar.
Figure 9 – DIFs for mortar mechanical properties: a) compressive strength; b) summary of
studied properties.
Figure 10 – Typical test sequence on masonry.
Figure 11 – DIFs for masonry mechanical properties.

Table 1 – Average quasi-static mechanical properties of clay brick, mortar and masonry.
Mechanical property Brick (CoV) Mortar (CoV) Masonry (CoV)
Compressive strength, σmax [MPa] 13.59 (14%) 4.46 (10%) 7.94 (9%)
Strain at peak strength, εu [mm/m] 6.95 (12%) 6.36 (6%) 10.93 (15%)
Young’s modulus, E [GPa] 2.32 (20%) 1.06 (11%) 0.80 (14%)
Compressive fracture energy, Gc [N/mm] 1.56 (31%) 1.43 (9%) 7.64 (3%)

Table 2 – Examples of impact test results on clay brick. A
cqu
isit
ion
Strain rate (s-1)
Compressive Strength
Young’s Modulus
Strain at Peak Strength
Fracture Energy
σu (MPa) DIF
E (GPa) DIF
εu (mm/m) DIF
Gc (N/mm) DIF
Static 13.31 -- 2.32 -- 6.95 -- 1.56 --
Tar
get
s
4 14.45 1.09 2.69 1.16 7.27 1.05 2.98 1.91 6 19.85 1.49 3.23 1.39 8.39 1.21 4.48 2.87 10 21.28 1.60 3.83 1.65 7.76 1.12 4.96 3.18 21 21.92 1.65 4.86 2.09 5.55 0.80 3.70 2.37 23 22.02 1.65 3.22 1.39 8.85 1.27 5.57 3.57 29 22.80 1.71 3.82 1.65 7.76 1.12 4.72 3.03 33 26.07 1.96 6.27 2.70 4.29 0.62 2.89 1.85 34 27.13 2.04 4.07 1.75 8.78 1.26 6.65 4.26 40 27.62 2.08 6.22 2.68 5.83 0.84 4.86 3.12 46 27.81 2.09 6.30 2.72 5.85 0.84 5.00 3.21 73 28.86 2.17 5.87 2.53 7.25 1.04 6.76 4.33
176 30.59 2.30 5.04 2.17 8.34 1.20 9.10 5.83
Str
ain
G
au
ges
5 15.60 1.17 2.85 1.23 6.45 0.93 2.54 1.63 10 21.70 1.63 3.47 1.50 7.30 1.05 5.18 3.32 11 18.71 1.41 3.06 1.32 8.25 1.19 3.92 2.51 20 24.08 1.81 3.28 1.41 9.46 1.36 5.73 3.67 29 25.51 1.92 4.66 2.01 7.46 1.07 4.90 3.14

Table 3 – Examples of impact tests results on mortar.
Acq
uis
itio
n
Strain rate (s-1)
Compressive Strength
Young’s Modulus
Strain at Peak Strength
Fracture Energy
σu (MPa) DIF
E (GPa) DIF
εu (mm/m) DIF
Gc (N/mm) DIF
Static 4.46 -- 1.10 -- 6.36 -- 1.44 --
Tar
get
s
7 4.90 1.10 1.00 0.91 5.67 0.89 1.80 1.25 17 7.68 1.72 1.32 1.20 7.20 1.13 1.72 1.19 22 9.34 2.09 1.63 1.48 7.20 1.13 2.05 1.42 27 11.61 2.60 2.24 2.04 5.17 0.81 2.43 1.69 30 12.33 2.76 2.81 2.55 7.10 1.12 2.24 1.56 38 12.72 2.85 2.49 2.26 6.30 0.99 2.50 1.74 40 12.98 2.91 2.16 1.96 4.00 0.63 3.14 2.18 61 13.70 3.07 2.69 2.45 5.10 0.80 2.91 2.02
113 14.45 3.24 2.69 2.45 7.00 1.10 3.52 2.44 141 16.15 3.62 3.57 3.25 7.50 1.18 3.89 2.70 177 16.99 3.81 3.21 2.92 7.80 1.23 3.64 2.53 193 19.53 4.38 3.25 2.95 6.00 0.94 5.20 3.61
Str
ain
Ga
uge
s 6 6.22 1.39 1.31 1.19 6.72 1.06 1.66 1.15 10 8.01 1.80 1.66 1.51 5.82 0.92 1.58 1.10 23 9.54 2.14 1.93 1.75 6.61 1.04 2.03 1.41 31 11.10 2.49 1.98 1.80 6.74 1.06 2.35 1.63 37 13.52 3.03 2.53 2.30 5.48 0.86 2.87 1.99 74 14.01 3.14 2.88 2.62 5.52 0.87 2.75 1.91

Table 4 – Impact tests results on masonry.
Acq
uis
itio
n
Strain rate (s-1)
Compressive Strength
Young’s Modulus
Strain at Peak Strength
Fracture Energy
σu (MPa) DIF
E (GPa) DIF
εu (mm/m) DIF
Gc (N/mm) DIF
Static 7.94 -- 0.80 -- 10.93 -- 7.64 --
Tar
get
s
2.1 7.37 0.93 0.88 1.10 10.73 0.98 6.29 0.82 2.3 8.77 1.10 1.26 1.58 10.80 0.99 9.46 1.24 3.0 7.94 1.00 0.92 1.15 10.64 0.97 9.41 1.23 4.4 7.75 0.98 0.95 1.19 10.64 0.97 8.96 1.17 5.0 8.89 1.12 1.44 1.80 10.80 0.99 7.89 1.03 9.0 10.99 1.38 1.07 1.34 10.60 0.97 13.53 1.77
10.6 9.44 1.19 0.88 1.10 13.95 1.28 13.53 1.77 17.5 11.55 1.45 1.49 1.86 12.96 1.19 14.21 1.86 22.0 11.32 1.43 1.00 1.25 9.71 0.89 16.46 2.15 25.6 12.46 1.57 1.47 1.84 10.66 0.98 18.77 2.46 26.0 11.76 1.48 1.15 1.44 12.05 1.10 13.89 1.82 54.0 16.61 2.09 1.01 1.26 14.80 1.35 18.75 2.45

a)
b) c) d)
Figure 1 – Drop Weight tower: a) schematic of the test setup b) testing site; c) brick specimen
just before testing; d) PHOTRON FastCam APX-RS.

a) b)
c) d)
e) f)
Figure 2 – Materials: a) Galveias brick; b) brick specimen; c) brick cutting scheme for brick
specimens; d) brick cutting scheme for masonry specimens; e) mortar specimens’ molding; f)
masonry specimens aluminium base.

a)
b) c)
Figure 3 – Quasi-static testing: a) quasi-static testing apparatus; b) typical relation for stress –
strain; c) typical relation stress – displacement.

Figure 4 – Examples of stress-strain curves at different strain rates for clay brick.

Figure 5 – Typical test sequence for clay brick.

Figure 6 – DIF (Compressive strength) for clay brick.

Figure 7 – DIFs for clay brick mechanical properties.

Figure 8 – Typical test sequence on mortar.

a)
b)
Figure 9 – DIFs for mortar mechanical properties: a) compressive strength; b) summary of
studied properties.

Figure 10 – Typical test sequence on masonry.

Figure 11 – DIFs for masonry mechanical properties.