experience with developing process safety kpis within scottishpower
DESCRIPTION
Process safety management for power and steam generation Energy Institute, LondonTRANSCRIPT

Experience with developing Process Safety KPIs within ScottishPowerProcess safety management for power and steam generation Energy Institute, London
8th July 2010
Martin Sedgwick – Head of Asset ManagementSteven Stewart – Process Safety Design Authority

AgendaOverview of ScottishPower’s journey implementing PSPIs...
Brief introduction to ScottishPower
Approach To Developing Process Safety Leading and Lagging Indicators
Current Status Of Indicators
Enduring Process Safety Solution
Management / Board Reporting
Process Safety Key Learning Points
8th July 2010 2© ScottishPower 2010 – Energy Institute Seminar

Company Overview
8th July 2010 3© ScottishPower 2010 – Energy Institute Seminar

Iberdrola GroupScottishPower part of Iberdrola Group, a worldwide leader in energy…
8th July 2010 4© ScottishPower 2010 – Energy Institute Seminar
Presence in 40 countries worldwide
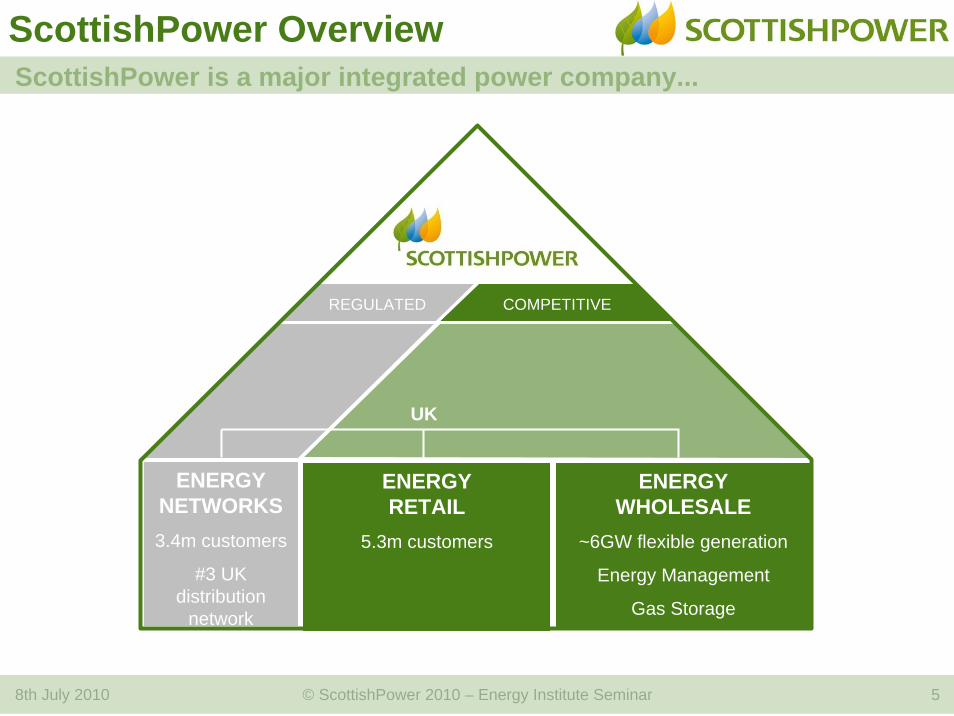
ScottishPower OverviewScottishPower is a major integrated power company...
8th July 2010 5© ScottishPower 2010 – Energy Institute Seminar
ENERGY RETAIL
5.3m customers
ENERGYNETWORKS3.4m customers
#3 UK distribution
network operator
ENERGYWHOLESALE
~6GW flexible generation
Energy Management
Gas Storage
COMPETITIVEREGULATED
UK

© ScottishPower 2010 – Energy Institute Seminar
Approach To Developing Process Safety Leading and Lagging Indicators
8th July 2010
Longannet Power StationCarbon Capture Pilot Plant
6

Overview Of Approach
Based on HSG254 – recognised as best practice
Tested through benchmarking - HSE and Oil & Gas sector
Common KPIs for all sites, but different targets applied
Incremental approach – trials using prototype dashboard
Buy in and sign off from the top
KPI Lifecycle developed:
8th July 2010 © ScottishPower 2010 – Energy Institute Seminar 7

Application Of HSG254...
© ScottishPower 2010 – Energy Institute Seminar
Step 1 - Hazards…
People
Process
Plant
90 GENSIPHazards
8th July 2010 8

Application Of HSG254...
© ScottishPower 2010 – Energy Institute Seminar
Step 2 – Risk Control Systems…
People
Process
Plant
90 GENSIP Hazards
42 Risk Control Systems
8th July 2010 9

Risk Control Areas
© ScottishPower 2010 – Energy Institute Seminar
Risk Control Systems Grouped Into 8 “Risk Control Areas”...
Operation & Compliance Audit
8th July 2010 10

Application Of HSG254...Step 2 – Risk Control Systems…
8th July 2010 11© ScottishPower 2010 – Energy Institute Seminar
People
Process
Plant
90 GENSIP Hazards
42 Risk Control Systems

Application Of HSG254...
© ScottishPower 2010 – Energy Institute Seminar
Step 3 – Define Leading Indicators
People
Process
Plant
90 GENSIP Hazards
42 Risk Control Systems
8th July 2010
100 Leading Indicators
12

© ScottishPower 2010 – Energy Institute Seminar
KPI Definition Documents
Provides definition of KPI:
ObjectiveDefinitionData SourceData Aggregation / CalculationTargets
Data Recording Guidelines
Formal sign off by senior managers
Crib sheets used to specify each KPI in detail…
8th July 2010 13

Application Of HSG254...
© ScottishPower 2010 – Energy Institute Seminar
Step 3 – Define Leading Indicators
People
Process
Plant
90 GENSIP Hazards
42 Risk Control Systems
8th July 2010
100 Leading Indicators
14
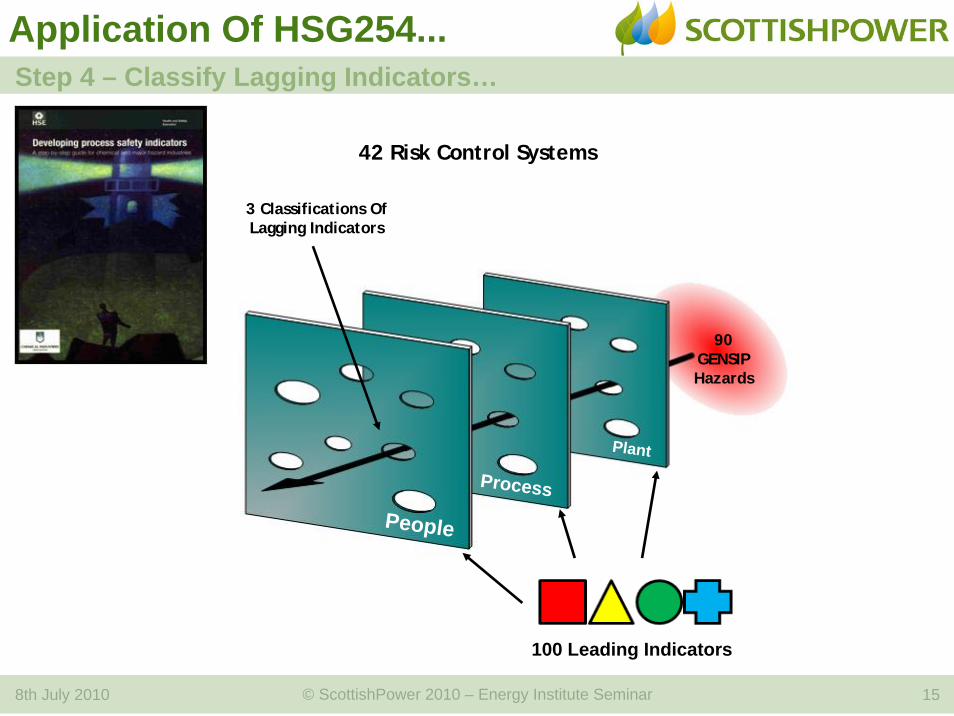
Application Of HSG254...
© ScottishPower 2010 – Energy Institute Seminar
Step 4 – Classify Lagging Indicators…
People
Process
Plant
3 Classifications Of Lagging Indicators
90 GENSIP Hazards
42 Risk Control Systems
8th July 2010
100 Leading Indicators
15

© ScottishPower 2010 – Energy Institute Seminar
Application Of Latest Thinking
Classification of Process Safety Incidents based on benchmarking with HSE and API guidance:
Major Process Safety Incident:• Equipment damage > £100k • Loss of Production > 24 hours• Injuries / fatalities (RIDDOR)• Major environmental impact
Significant Process Safety Incident: • Equipment damage > £20k but <£100k• Significant release of energy or
hazardous matter• Fire and explosions
Minor Process Safety Incident:• Demand on safety system• Process upset – control loops out of
control, equipment in manual• Breaches of plant limiting conditions
Approach to classification of lagging indicators...
8th July 2010 16

Application Of HSG254...Step 4 – Classify Lagging Indicators…
8th July 2010 17© ScottishPower 2010 – Energy Institute Seminar
People
Process
Plant
3 Classifications Of Lagging Indicators
90 GENSIP Hazards
42 Risk Control Systems
100 Leading Indicators

Application Of HSG254...
© ScottishPower 2010 – Energy Institute Seminar
Incident Management key to understanding lagging indicators...
People
Process
Plant
3 Classifications Of Lagging Indicators
90 GENSIP Hazards
New Incident
ReportingProcess
42 Risk Control Systems
8th July 2010
100 Leading Indicators
18
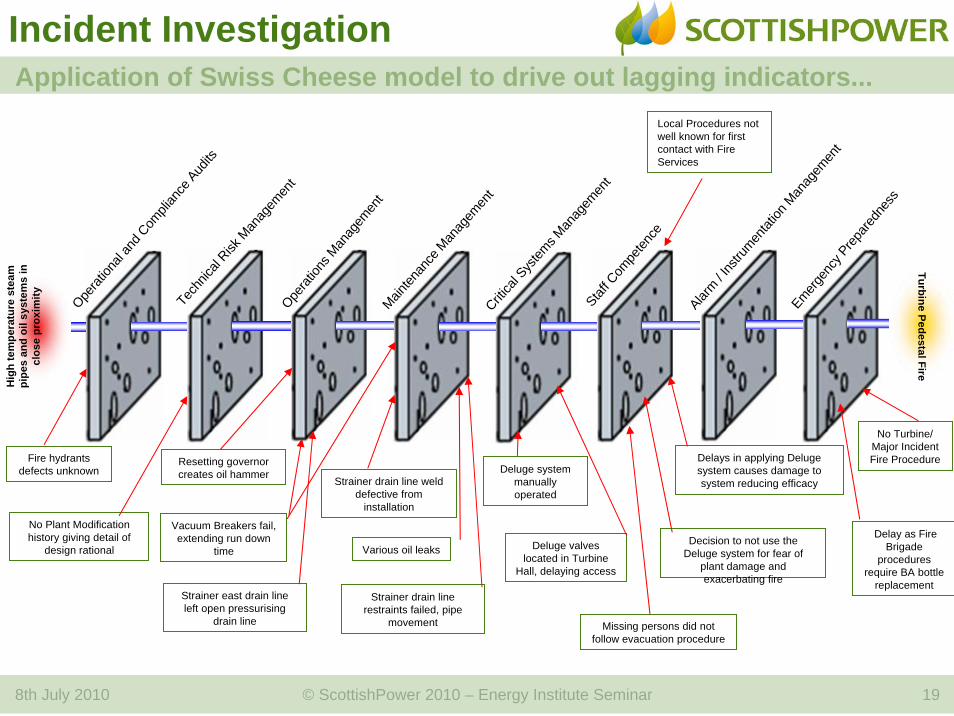
Incident InvestigationApplication of Swiss Cheese model to drive out lagging indicators...
8th July 2010 19© ScottishPower 2010 – Energy Institute Seminar
Emergen
cy P
repare
dnes
s
Alarm / I
nstru
mentat
ion M
anag
emen
t
Critica
l Sys
tems M
anag
emen
tStaf
f Com
peten
ce
Mainten
ance
Man
agem
ent
Operat
ions M
anag
emen
t
Tech
nical
Risk M
anag
emen
t
Operat
ional
and C
ompli
ance
Aud
its
Hig
h te
mpe
ratu
re s
team
pi
pes
and
oil s
yste
ms
in
clos
e pr
oxim
ityTurbine Pedestal Fire
Strainer drain line restraints failed, pipe
movement
Fire hydrants defects unknown
Resetting governor creates oil hammer Deluge system
manually operated
Deluge valves located in Turbine
Hall, delaying access
Strainer drain line weld defective from
installation
Vacuum Breakers fail, extending run down
time Various oil leaks
Delays in applying Deluge system causes damage to system reducing efficacy
No Turbine/ Major Incident Fire Procedure
No Plant Modification history giving detail of
design rationalDelay as Fire
Brigade procedures
require BA bottle replacement
Strainer east drain line left open pressurising
drain line
Decision to not use the Deluge system for fear of
plant damage and exacerbating fire
Missing persons did not follow evacuation procedure
Local Procedures not well known for first contact with Fire Services
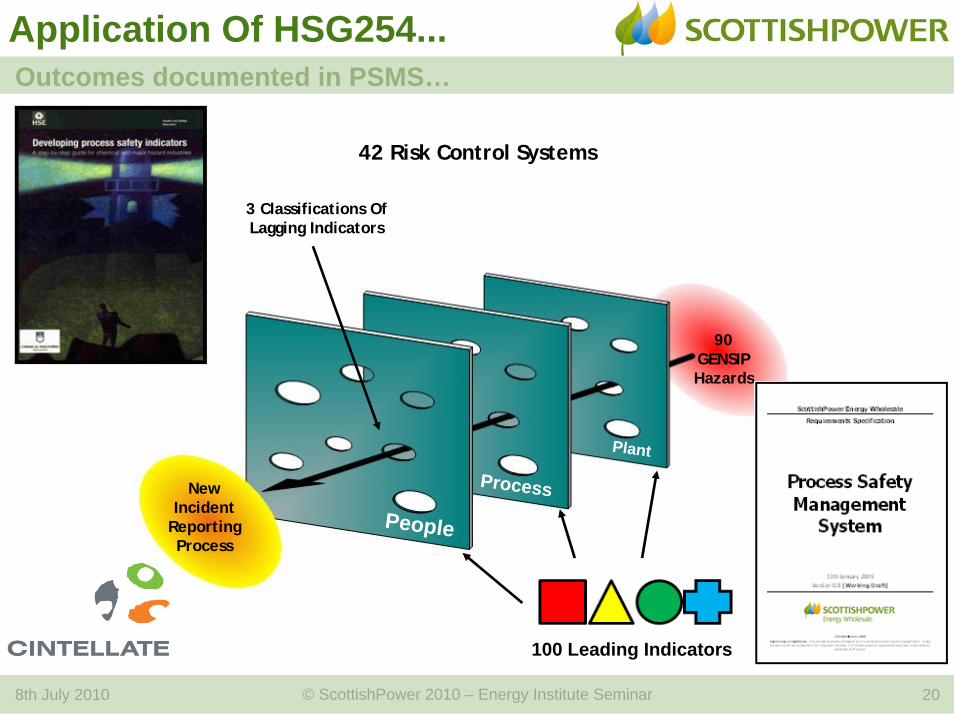
Application Of HSG254...
© ScottishPower 2010 – Energy Institute Seminar
Outcomes documented in PSMS…
People
Process
Plant
3 Classifications Of Lagging Indicators
90 GENSIP Hazards
New Incident
ReportingProcess
100 Leading Indicators
42 Risk Control Systems
8th July 2010 20

© ScottishPower 2010 – Energy Institute Seminar
Current Status Of Indicators
8th July 2010 21

Process Safety DashboardMatrix – shows worst case KPI across all RCAs at each site…
8th July 2010 22© ScottishPower 2010 – Energy Institute Seminar

Process Safety DashboardKPI Details – shows status of individual KPIs…
8th July 2010 23© ScottishPower 2010 – Energy Institute Seminar

Process Safety DashboardTrends show the positive impact that KPIs have had on performance…
8th July 2010 24© ScottishPower 2010 – Energy Institute Seminar

Process Safety DashboardDrill Down – enables the source of issues to identified and tackled…
8th July 2010 25© ScottishPower 2010 – Energy Institute Seminar

Process Safety DashboardSummary Charts – provide view of risk profile…
8th July 2010 26© ScottishPower 2010 – Energy Institute Seminar

Process Safety DashboardMonthly Reports – support Operational Risk Governance meetings…
8th July 2010 27© ScottishPower 2010 – Energy Institute Seminar

Enduring Dashboard SolutionPreview of next generation of software in development...
8th July 2010 28© ScottishPower 2010 – Energy Institute Seminar
Further HSE Guidance
© ScottishPower 2010 – Energy Institute Seminar
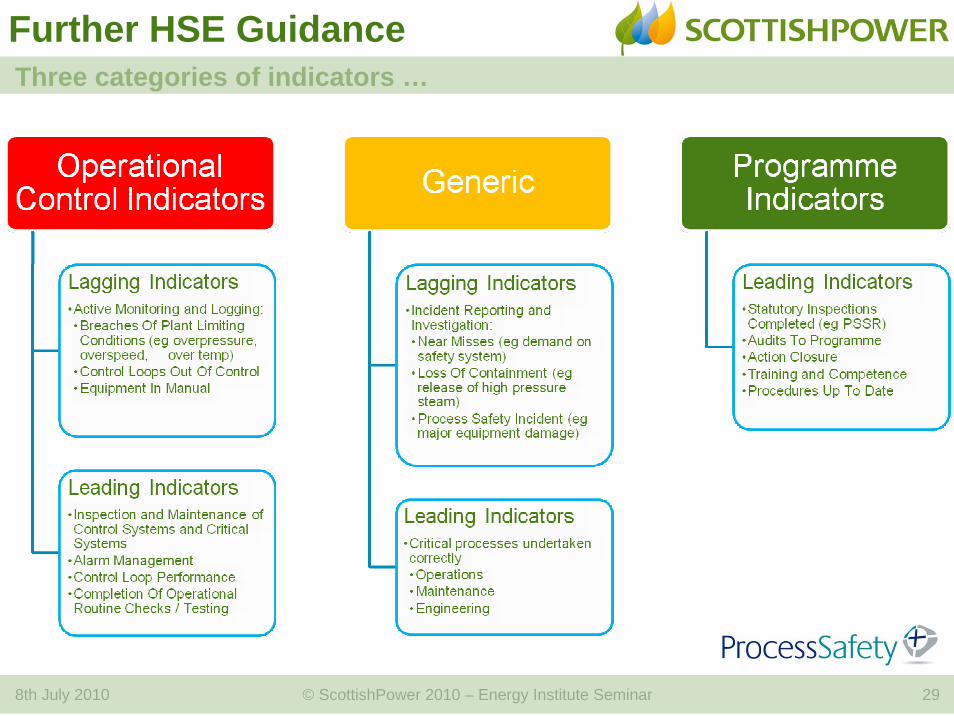
Three categories of indicators …
8th July 2010 29

Further HSE Guidance
© ScottishPower 2010 – Energy Institute Seminar
Shift Logging …
8th July 2010 30
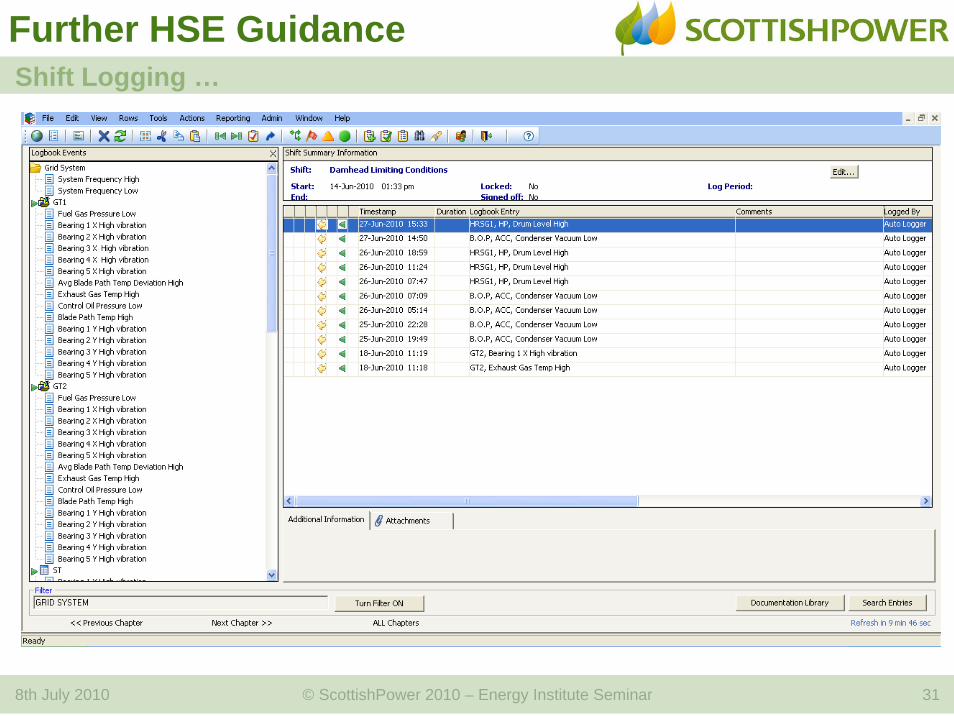
Further HSE GuidanceShift Logging …
8th July 2010 31© ScottishPower 2010 – Energy Institute Seminar

Further HSE Guidance
© ScottishPower 2010 – Energy Institute Seminar
Alarm Management …
8th July 2010 32

Further HSE GuidanceAlarm Management …
8th July 2010 33© ScottishPower 2010 – Energy Institute Seminar

Further HSE Guidance
© ScottishPower 2010 – Energy Institute Seminar
Reliability Engineering …
8th July 2010 34
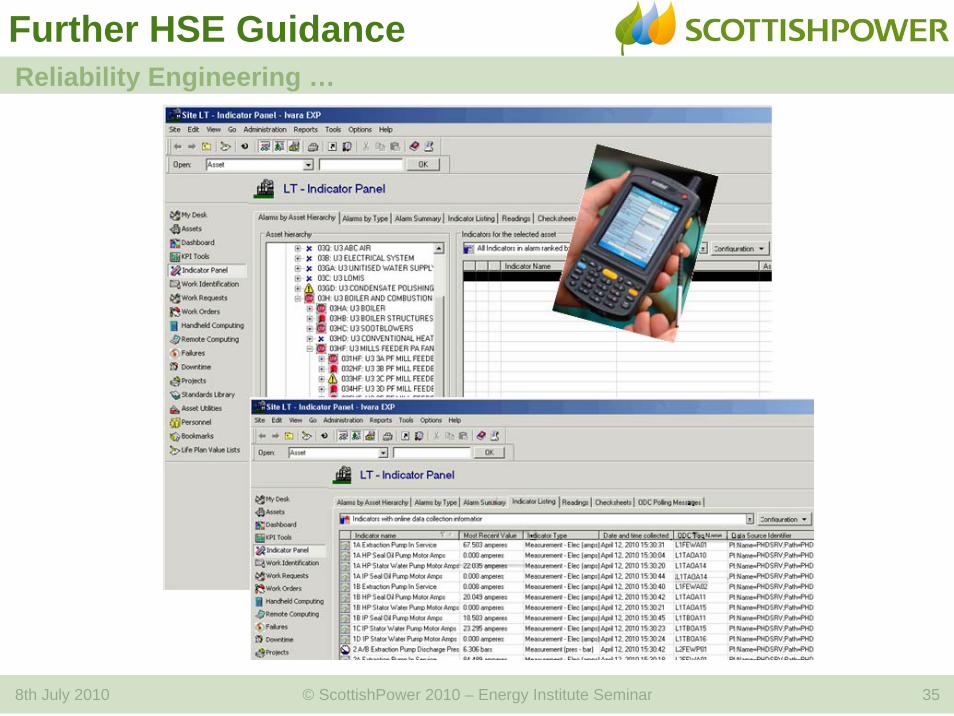
Further HSE GuidanceReliability Engineering …
8th July 2010 35© ScottishPower 2010 – Energy Institute Seminar

Further HSE Guidance
© ScottishPower 2010 – Energy Institute Seminar
Maintenance Management …
8th July 2010 36

Further HSE GuidanceMaintenance Management …
8th July 2010 37© ScottishPower 2010 – Energy Institute Seminar

Further HSE Guidance
© ScottishPower 2010 – Energy Institute Seminar
Incident Management …
8th July 2010 38

Further HSE GuidanceIncident Management …
8th July 2010 39© ScottishPower 2010 – Energy Institute Seminar

Further HSE Guidance
© ScottishPower 2010 – Energy Institute Seminar
Technical Risks …
8th July 2010 40

Further HSE GuidanceTechnical Risks …
8th July 2010 41© ScottishPower 2010 – Energy Institute Seminar

KPI Dashboard ArchitectureAn enterprise scale solution...
8th July 2010 42© ScottishPower 2010 – Energy Institute Seminar
Ad
Hoc
Ana
lysi
s (B
usin
ess
Obj
ects
)
Scheduling
EXP(Reliability Engineering)
PSR(Technical Risks)
Maximo(CMMS)
Cintellate(Incident Management)
PAS (Alarm Management)
Opralog(Shift Logging)
Dashboard

Process Safety DashboardLeading and lagging KPIs listed separately...
8th July 2010 43© ScottishPower 2010 – Energy Institute Seminar

Process Safety DashboardConcept of Leading and Lagging indicators embedded...
8th July 2010 44© ScottishPower 2010 – Energy Institute Seminar

Process Safety DashboardDonut charts used to report leading and lagging statistics separately...
8th July 2010 45© ScottishPower 2010 – Energy Institute Seminar

Status Of KPIs
8th July 2010 46© ScottishPower 2010 – Energy Institute Seminar

Weighted KPIsApplication of risk based weightings to KPIs...
8th July 2010 47© ScottishPower 2010 – Energy Institute Seminar

Top 10 KPI ReportProposed approach to ranking KPIs...
8th July 2010 48© ScottishPower 2010 – Energy Institute Seminar
Operational Control Indicators
Calculate Score Between 0 and 4 For
Each KPI
Apply Offset To Each KPI Based on
Category
+0
+1
+2

Top 10 KPI Reporting
8th July 2010 49© ScottishPower 2010 – Energy Institute Seminar
Operational Control IndicatorsGeneric Indicators
Programme Indicators
0 1 2 3 4 5 6

KPI Weight ApproachEnables individual KPI scores to be aggregated up to RCA level...
8th July 2010 50© ScottishPower 2010 – Energy Institute Seminar
Maintenance Management
Work Prioritisation
Work Identification, Routine Plant Inspections
Work Planning, Scheduling
Work Execution
Personal Risk Assessment
KPI RCA Weighting
Backlog Size In Months 20%
Corrective Maintenance Compliance 10%
Outage Defects Backlog Size In Months 5%
Percentage of WOC With Failure Information 2%
Percentage of WOC With Hours Captured 2%
Percentage of WOC With Log Completed 2%
Percentage of WOC With Re-Work 1%
Percentage of WOC With Risk Assessment 10%
Safety Defects Backlog Size 3%
Percentage of PM to CM 30%
Preventative Maintenance Compliance 15%
Apply Static Weightings To All KPIs Within Each Risk Control Area
Calculate Score Between 0 and 4 For
Each KPI

RCA Adjusted For Weighting
8th July 2010 51© ScottishPower 2010 – Energy Institute Seminar

© ScottishPower 2010 – Energy Institute Seminar
Management / Board Reporting
528th July 2010 52

Group Governance ProcessCascade up approach...
53
All Sites
© ScottishPower 2010 – Energy Institute Seminar8th July 2010 53

Operational Risk Group (ORG)Governance of Process Safety established across business...
8th July 2010 54© ScottishPower 2010 – Energy Institute Seminar
Monthly meeting
Dedicated to reviewing technical risks
AgendaReview Process Safety IncidentsProcess Safety KPIs Performance ReviewTechnical RisksBenchmarkingRegulatory Changes

8th July 2010 © ScottishPower 2010 – Energy Institute Seminar
Process Safety Key Learning Points
55

Key Learning PointsFrom ScottishPower’s journey to date...
8th July 2010 © ScottishPower 2010 – Energy Institute Seminar 56

© ScottishPower 2010 – Energy Institute Seminar
End Of Presentation
8th July 2010 57