expansion of arable land and its cessation: the case of ... · expansion of arable land and its...
TRANSCRIPT
Southeast Asian Studies, Vol. 33, No.4, March 1996
Expansion of Arable Land and Its Cessation:The Case of Northeast Thailand
FUKUI Hayao *
Introduction
One of the characteristic features of Thai agriculture has been the rapid expansion of
arable area. The increase of agricultural production and export since the mid-19th
century mostly have accrued from reclamation of new lands. Recently, however, the rate
of expansion of arable land has slowed considerably, and it may not be unrealistic to
assume that the increase of arable acreage will cease entirely in the near future. Thai
.agriculture is approaching an important turning point.
The slowing of expansion is closely related with, one, the recent changes in the
economy, that is, industrialization and urbanization and, two, perhaps the low rate of
population increase since the mid-1970s. Similarly, the rapid expansion until recent
times was also related with the strong economic orientation toward export of primary
products and the rapid increase of population. This paper attempts to examine the
relationship between agriculture, economy and demography by reviewing it
macroscopically first and, second, microscopically based on case studies in the Northeast.
Finally, the implications of the case of Thailand for developing economies in Asia and
elsewhere are discussed.
I A Statistical Review
Expansion of Arable Land
In the mid-19th century, when Thailand started being greatly influenced by the West, it
had about 2.5 million people!) and 1.0 million ha of paddy lands producing approximately
1.4 million ton of unhusked paddy [Ingram 1971] .2) The average yield then might have
* m1t~f6J , Center for Southeast Asian Studies, Kyoto University1) A popular estimate of population for the mid-19th century is five to six million, which
Ingram [1971] and others adopted. Taking into account the changes in area of the territoryof Siam or Thailand, examining various estimates from the point of view of demography andextrapolating the census data after 1911 retrospectively, Kobayashi [1984] reached a figureof 2.5 million, which is adopted in this paper.
2) Throughout this paper, the amount of rice is expressed as unhusked rough paddy unless!,
-157 - 675
been around 1.4 ton/ha. The population increased at about two percent per year during
the latter half of the century and reached 8.27 million at the time of the first census in
1911. It is well known that, in response to the strong demand for rice abroad, a large
area was reclaimed for growing rice in the late 19th and the early 20th centuries. The
1905-1909 average total paddy area was 1.47 million ha. At the turn of the century, the
volume of rice export was approaching one million ton of white rice per year.
The population continued to increase at about two percent per annum during the first
half of the present century and reached 20 million in the 1950s. The paddy area
inereased at a greater rate than the population and reached 5.54 million ha in 1950. Thus,
the per capita paddy area nearly doubled from 0.16 ha/person at the beginning of the
century to 0.30 ha/person a half century later. The volume of rice export, however, did
not increase proportionately. Thailand exported about 1.5 million ton of white rice in
1950. This is because the frontier of reclamation was ever extending to marginal lands.
Actually, the average yield of rice declined from 1.83 ton/ha in 1906-1909 to 1.26 ton/ha
in 1948-1950.
After WW II, the population increase accelerated and the annual rate of increase
surpassed three percent. The population was over 30 million in 1965, about 50 million in
1984 and 57.79 million by the end of 1992. The projected population for the year 2000 is
around 65 million. The paddy area also continued to increase after the war. It reached
7.73 million ha in 1977 and exceeded 10 million ha in the 1989/90 crop year.
Upland field crops in the pre-WW II Thailand were relatively minor compared to
rice, and no reliable statistics for them are available. From the late 1950s, however,
some of these crops became export commodities and the area planted to them increased
dramatically. By the 1990s, the aggregate area under short-term crops of which large
portions were exported, such as maize, kenaf, cassava and sugarcane, reached about 5
million ha, equivalent to more than one half of the paddy acreage. It mostly consisted of
lands reclaimed from forests in the last 30 years or less.
Thai farmers have, until recently, responded principally by expanding arable area
when demand for rice and other agricultural products increased due to population
increase or export expansion. The case of Thailand makes a good contrast with the
Japanese case.
Both countries started modernizing their economies in the mid-19th century. In
Japan, most incremental population since then has been absorbed in the urban/industrial
sector of the economy. The absolute size of the rural population and the farm land/rural
population ratio remained basically unchanged until the time of rapid economic growth in
the 1950s and 1960s. Japan did not experience the dramatic expansion of arable area that
occurred in Thailand, where the arable land increased by about 15 times in less than 200
years.
':a otherwise specified. It can be converted to polished white rice by multiplying 0.65-0.7.
676 -158-

FUKUI H. : Expansion of Arable Land and Its Cessation
Rice is of overwhelming importance in the Asian rice zone. It affects not only food
and agriculture but also various traits of economy, society and culture. Certainly,
therefore, one can find many common characteristics shared by Japan and Thailand. This
notion, however, is often misleading. We should also see the diverse features of rice
based societies.
The expansion of rice area is an example. Thailand's experience might be shared by
many of her neighbors in Southeast Asia, but not by Japan. In this case, an analogical
inference based on the Japanese experience makes no sense. For instance, it is taken for
granted in Japan that a rice farmer will inherit paddy lands on which distant ancestors
have toiled, but this is not the case at all in Thailand. There, the majority of farmers
cultivate lands opened by themselves, their parents or grandparents.
Dense population and little room for further expansion of arable land is a popular
image of Asia. This might be the case for South Asia and the Far East but it is not
necessarily so for Southeast Asia. Rice cultivation is inherently labor-intensive in
comparison to rainfed upland field crop farming elsewhere. The water manipulation in
rice cultivation may appear to be superb in the eyes of those familiar with only that type
of agriculture. In many studies on rice farming, they focus on its intensiveness and tend
to choose particularly densely populated areas for their fieldwork, e.g., Java, northern
Vietnam and Upper Burma. But the total picture of rice farming in Southeast Asia cannot
be comprehended by examples in these areas alone.
Mill. ha40
35 I I30 ;:~;:
:?-~:
25:j~jj:
.[~~j~ :i;~~.
20 ~~1~: :j~i::::l
16:11. ·l~:
10:j~;! ~~~~;
":;:
6 :{ ~}.
:~~i~i ;ff:0
0 &ft&ft &ft
~ ~
r- -'::::
0 Tree:~::
\~*crops.;;::
ii~ :~li ~~~~j • Upland field crops::=:= @ II Lowland';::: :~:: ~~;\~ I
rice:j;)~
~::i~}~ I ~: ~~ IE~~i
:-:.
iForest::;:' :::~ :t ?'~:: i'::" i:j:~
I ~;:;:;: ~~: :.::: ':~j
~.:.:: ::;::
:::;: ':::: f}:j::::
:{ :~:: I:;::; ?~:::;:
:!ii:( ~f~::~.: ;:~;: ::;:: :~~~ .;:~: 1
! &ft 0 1ft ! '" .. 00 !00 I'- I'- ! ! Oll~ ~ ~ ~
Fig. 1 Changes in Landuse (1950 - 1988)
Source: [Ammar, Suthad and Direk 1993: Table 2-2J
-159 - 677
Cessation of the Expansion
Fig. 1 shows the change In land use after 1950. It is clear that the increase of paddy
acreage was very rapid until the 1970s but slowed down greatly after that and became
small from the 1980s. The area of upland field crops and tree crops started increasing
vigorously later than rice and was still increasing in the 1980s, but at a slower rate. The
expansion of rice lands for subsistence appears to have come to a standstill and new
reclamation, if any, might be mainly for commercialized cultivation of non-rice crops. As
a result of the expansion of arable land, a huge area of forest lands was lost, but the rate
of deforestation declined from the 1980s.
I have mentioned that the yield per unit area declined continuously in the process of
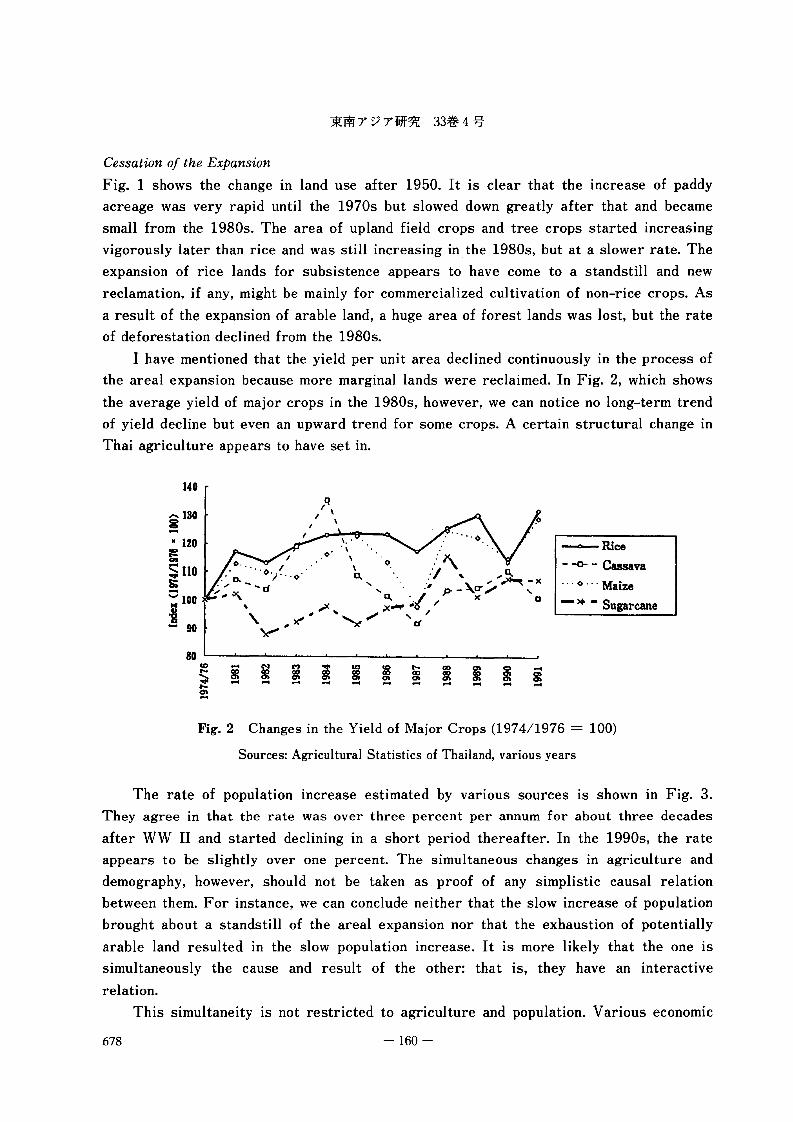
the areal expansion because more marginal lands were reclaimed. In Fig. 2, which shows
the average yield of major crops in the 1980s, however, we can notice no long-term trend
of yield decline but even an upward trend for some crops. A certain structural change in
Thai agriculture appears to have set in.
140
-Rice
- -0- - Cassava... ~ ... Maize
-» - Sugarcane
Fig.2 Changes in the Yield of Major Crops (1974/1976 = 100)
Sources: Agricultural Statistics of Thailand, various years
The rate of population increase estimated by various sources is shown in Fig. 3.
They agree in that the rate was over three percent per annum for about three decades
after WW II and started declining in a short period thereafter. In the 1990s, the rate
appears to be slightly over one percent. The simultaneous changes in agriculture and
demography, however, should not be taken as proof of any simplistic causal relation
between them. For instance, we can conclude neither that the slow increase of population
brought about a standstill of the areal expansion nor that the exhaustion of potentially
arable land resulted in the slow population increase. It is more likely that the one is
simultaneously the cause and result of the other: that is, they have an interactive
relation.
This simultaneity is not restricted to agriculture and population. Various economic
678 -160 -

FUKUI H. : Expansion of Arable Land and Its Cessation
% per year
4.50
4.00
3.50
3.00
2.50
2.00
1.50
1.00
0.50
- - - - - Bourgois-Pichat
A United Nations
.... 0 . .. U.S. Bureau of the Census
. • . .. Registered
••
•: '..'
.~: :. ~.. ::
••• •
0.00
Fig. 3 The Rate of Population Increase (1921 - 1992)
Sources: Kobayashi [1984J and Statistical Yearbook Thailand NoAO
Table 1 Economic Growth, 1870 - 1950
(in the 1950 price, mill. baht)
GDP Agricul ture Industry Service
1870 5,619 2,417 678 2,524
1890 6,822 2,959 828 3,035
1900 7,379 3,222 883 3,274
1913 9,985 4,459 1,245 4,281
1929 13,087 5,735 1,603 5,749
1938 16,918 7,490 2,091 7,337
1950 22,549 10,196 2,794 9,559
Source: [Sompop 1989: 265J
indicators also changed concurrently.
Table 1 portrays the slow and stable economic growth with no structural change
before 1950. The average growth rate of GDP between 1870 and 1950 was 1.75 percent
(less than 1 percent and less than 3 percent in the first and second half of the period,
respectively) and the share of the three sectors hardly changed. The increases of arable
acreage and population before WW II proceeded under this economic structure. Since the
-161- 679

population increased at 1.97 percent per annum from 4.18 to 19.82 million during the
period, per capita GDP decreased from 1,345 to 1,138 baht at the 1950 price.3)
The rapid economic growth of Thailand from the 1950s is well known. The annual
growth rate has never fallen below five percent since then and from the second half of
the 1980s it has been particularly remarkable. During this period, the agricultural sector
grew by three percent per annum on average but was far behind GDP. The differential
UDI GDP EiI Age. & Fish. El Indus1rY I Service
I1412 ~~~~
!L 10 ll~• 8El'a. 6
1- 42
0 ..... ..... ..... ..... ..... ..... ..... .....co co co co co co co coQ1 en en -.:l -.:l 00 00 co..... ? Q"1 ? -.:l ..... Q"1 ?I I I I J:,en en -.:l -.:l 00 00 co0 Q"1 0 -.:l ..... Q"1 0 .....
Fig.4 Economic Growth, 1951 - 1991
Source: NESDB
100%
9~
80%
7~
60%
50%
40%
30%
20%
10%
0% ..................t...Iiiiii
[J Industrial products
• Livestock, fish. & foreatproducts
OlD Other -sr. products
II Tapioca prodUds
• Ruber prodUds
E:J Rice
1957 1961 1967 1977 1985 1987 1990 1991 1992
Fig. 5 Changes of Export Commodities, 1957-1992
Source: Bank of Thailand Monthly BulletinNote 1: Minerals are excluded.
Note 2: Since canned foods, sugar, rubber products, and furniture are counted as
industrial exports, there is some duplication.
3) GDP was taken from the same source as Table 1 and population from Kobayashi [1984].
680 -162 -
FUKCI H. : Expansion of Arable Land and Its Cessation
between the agricultural and industrial sectors became more evident from the second half
of the 1980s. As a result, the share in GDP of agriculture and fishery declined gradually
from 50.1 percent in 1951 to mere 12.8 percent in 1991 (Fig. 4).
In terms of the share of different sectors in export, the decline of the agricultural
sector is more evident. Fig. 5 clearly shows the decline in the share of traditional export
commodities such as rice and rubber, and the advent of new agricultural commodities
such as kenaf, maize and cassava in the 1960s and 1970s, and of new agro-businesses
producing shrimps and broilers from the 1980s. Notwithstanding these, the sector as a
whole compares poorly with the remarkable performance of the industrial sector in the
export market.
Concomitant with these changes in the economy, the share of working population in
the agricultural sector also declined. It was 84.8 percent in 1947 but 59.2 percent in
1991 [NSO n.d.] . Though it has certainly decreased recently, it is still high compared
with other Asian countries. It can be said that the share is exceptionally high relative to
the per capita GDP of Thailand. This suggests a high percentage of wage earners
residing in villages and rampant seasonal rural-urban labor migration.
All these economic statistics referred to above indicate that the expansion of arable
land and its cessation is part of a drastic large-scale shift of the whole demographic,
economic and social structure of Thailand.
II The Khorat Plateau
The Northeast is one of the four geographical regions of Thailand and accounts for about
one third of the kingdom in total area, paddy area and population. In 1991, its per capita
income was 63 percent of the national average and about one third of Bangkok's making it
the poorest region of the country.
Rice dominates in the southeastern part of the Eurasian continent, encompassing the
temperate zone and the tropics. This Asian rice zone is characterized by the combination
of high mountains and alluvial valleys. Though alluvial plains occupy only a small portion
of the total land area, they are endowed with fertile soils and plentiful water and thus
offer ideal conditions for lowland rice.
Northeast Thailand is an exception because it is a plateau, the Khorat Plateau, not
an alluvial valley. Like plateaus elsewhere, its catchment, and thus its water resource, is
limited, resulting in the dominance of rainfed rice. The annual rainfall ranges from 1,200
to 2,200 mm over the region, but does not guarantee stable surplus production. The
dominance of sandstone in the catchment means low soil fertility. Thus, the land
conditions of the Northeast are marginal for rice growing.
The trend of the expansion of arable land and its cessation in Thailand as a whole
also applies roughly to the Northeast. The region, however, lagged behind the country as
a whole, particularly the Central region, and was much less affected by the export drive
-163 - 681
of rice.
Since most rice for export was produced in the Central region, the areal expansion
for rice-growing proceeded there first and most significantly. In the Northeast, lands
were reclaimed primarily for production of rice to be consumed domestically. Therefore,
the expansion started later and proceeded more slowly in the early years. The time lag
between the two regions is also apparent in the recent trend: rate of expansion began to
decline and intensification set in earlier in the Central than the Northeast. The average
yield of rice decreased only by 0.13 ton/ha from 1.59 to 1.46 ton/ha in the Central
between 1921-24 and 1948-50, but by as much as 0.68 ton/ha from 1.61 to 0.93 ton/ha in
the Northeast between the same years. Reclamation of new lands for subsistence under
population pressure typically proceeded in the Northeast.
The share in area planted to upland field crops in the Northeast was 63 percent for
cassava, 29 percent for maize and 16 percent for sugarcane in the 1991 crop year. That
all of them were cultivated in lands opened since the 1950s suggests how vigorous has
been the recent areal expansion in the region.
III Expansion of Paddy Land for Subsistence: The Case of DD Village4)
DD village is said to have been founded by a few small groups of farmers in the latter
half of the 19th century. In the Northeast, farmers move spontaneously "in search of good
paddy land" (called ha na di). The founding fathers of DD were also migrating farmers
for ha na die
The Village Population
During the pre-WW II period, the rate of potential or natural population increase, which
was calculated from mortality and fertility,5) was about two percent per annum, same as
the national trend that we saw earlier. During the first two decades of the century,
however, the village population increased faster than that, suggesting immigration into
DD. This was confirmed by the family history survey. Immigration continued till the
1930s but some villagers emigrated as early as in the 1920s. The period between 1920
and 1935 was an equilibrium period with nearly zero net migration.
Mortality started declining in the 1930s, while fertility remained at a high level till
the introduction of contraceptives in the late 1960s. The result was a potential population
increase of over three percent in this period. At the same time, however, vigorous
emigration started, involving more than ten people per year, and the village population
4) An intensive study of DD village was carried out by an interdisciplinary team in 1981through 1984. The agroecological aspects are reported in [Fukui 1993].
5) Mortality and fertility were estimated based on interviews with 232 mothers residing in thevillage in 1983, who gave birth to 876 children. Migration was estimated by the familyhistory survey with the help of genealogical charts.
682 -164 -
FUKCI H. : Expansion of Arable Land and Its Cessation
actually increased at a rate of less than two percent per annum. In the 1970s, the rate of
potential increase declined to about two percent, mainly due to the decline of fertility,
while emigration continued at the same high rate as in the preceding years. As a result,
the rate of increase of the village population fell to less than one percent. In the 1980s,
DD experienced a nearly static state due to further decline of fertility.
Immigration into DD in the early decades of the century was for ha na di: DD was
then a frontier village with sufficient virgin land. The family history survey shows that
most immigrants traveled several tens of kilometers, as the founders of DD did. The main
reason for emigration from DD, which started as early as in the 1930s, was similarly ha
na di. The ha na di emigration continued well into the 1970s, and it was only from the
latter half of that decade that the destination shifted to urban areas.
Rice Cultivation
All paddy fields of DD are rainfed. They lie in the floodplain of the Chi River, where
floods recur once in a decade on average and destroy virtually the whole rice crop. The
floodplain is rich in microrelief. The village paddylands occupy about twenty shallow,
saucer-shaped depressions, locally called nong. Early settlers started reclamation from
the lowest portion of a nong by draining it. The bottom land of a nong is hydrologically
superior and the soils are clayey and more fertile. By the mid-1930s, all bottom lands
had been reclaimed. The periphery of a nong is sloping, and the soils are sandy and poor
in plant nutrients. These parts were also reclaimed for paddy growing in the 1940s. Since
the early 1950s, there has been no change in the acreage of paddy fields in DD.
Nineteen percent of total arable land of DD was planted to upland field crops, mainly
cassava, in the 1980s. The upland was covered with forest before the first commercial
crop, cotton, was introduced in the 1940s. Kenaf, a fiber crop for export, replaced cotton
in the 1960s. From the 1970s, cassava became dominant, being a major export item to
Europe. Six percent of DD's arable land is vegetable gardens. The commercialization of
vegetable growing started in the 1970s.
In the early 1980s, there was no improved high-yielding variety of rice in the village.
Chemicals, fertilizers and pesticides, were seldom used for rice either, though they were
widely used for cassava and vegetables. The cultivation method was studied closely, but
we failed to discover any adaptive technology to the drought and flood which were so
frequent. It was noticed, however, that the system of rice-growing was intricately
adjusted to the intravillage variations in physical conditions: varieties, the cropping
calendar, the planting density and others were selected according to the topographical,
soil, and hydrological variations.
Even such innovative adaptive technology appears to have been of little use against
drought and flood. The paddy yield fluctuates in the extreme, as shown in Table 2. It is
no exaggeration in DD to say that the yield is poor in "normal" years, and a bumper crop
is expected only in "exceptional" years.
-165 - 683

Jltm 7 :; 7 ii]f9'l 33~ 4 {j-
Table 2 Yield of Rice and Its Variability in DD
Year Total Production Yield Reasons for
(ton) (paddy kg/ha) Poor Yield
1960 1,120
1961 123 612
1962 44 223
1963 46 228
1964 8 41
1978 30 Flood
1979 53 440 Drought
1980 34 Flood
1981 257 1,180 Drought
1982 90 600 Drought
1983 473 2,190
Sources: [Mizuno 1981; Fukui 1993]
In matching the village population and the rice supply, it is essential to assess the
average yield. The averages of the observed yield over five or six years shown in Table
2, however, cannot be taken as a long-term average, because the annual variability is so
great. In order to estimate a long-term average, a simulation model was constructed. The
primary inputs into the model are the five-day rainfall records. The soil moisture regime
and the cropping calendar were first simulated. Next, the adverse effects of water stress
at different stages of the crop growth on the yield were simulated. Finally, the effects of
flood were incorporated. The model was validated by the observations over five years.
The model indicates that the long-term (100 years) average yield is 1.1 ton of paddy
per ha of total village paddyland under the condi tions of the 1980s, and 1.4 ton for the
1930s.
The Rice Balance
Combining the results of the demographic and agronomic studies, we are now ready to
make a matching of population and rice. The rice acreage/person ratio remained
surprisingly stable from the 1930s (0.39 ha) till the 1980s (0040 ha). Since only superior
lands were used in the 1930s, the long-term average yield was higher then (104 ton/ha)
than the 1980s (1.1 ton/ha), and this resulted in greater per capita paddy production (520
kg in the 1930s and 446 kg in the 1980s). But even the per capita paddy production in the
1980s appears to be more than enough for self-sufficiency in rice, if not for significant
surplus. Disregarding the year-to-year variability of production, DD had been self
sufficient in rice throughout the whole period.
Whatever conclusion might be drawn from the simulation model, it is certain that the
684 -166 -

FUKC! H. : Expansion of Arable Land and Its Cessation
shortage of rice has been and is of great concern to villagers. The rice balance must be
expressed as it is felt by them. We must incorporate the annual variability into the rice
balance in one way or another.
Rice has seldom been sold m DD. This does not mean, however, that the whole
village economy is one of subsistence. Yet, rice is seldom sold. The total capacity of rice
granaries in the village amounts to three years of rice consumption. All the harvest is
stored in them as paddy (unhusked). The villagers' primary concern is how much paddy is
left in the granaries, not necessarily the harvest of each year. There is a saying in DD
that one bumper crop can sustain three years of consumption.
Based on the simulation model mentioned above, and with the following assumptions,
the variability of rice stock for the 1930s and the 1980s was estimated:
( a) all the production factors of the two periods remain unchanged for 100
years,
( b) rice is sold only when stock surpasses the capacity of the granaries,
( c) 400 kg of paddy is consumed as food per person per year,
( d) 50 kg per ha of paddy is needed as seed, and
( e) the loss in stock is five percent annum
We can conclude that the stock depletion probability (SDP) deteriorated from 6/100
m the 1930s to 17/100 within 30 years and remained constant from then till the 1980s.
The SDP of 6/100 means that stock is exhausted two to three times in a lifetime while
that of 17/100 means that this happens every five or six years. This reflects the reality
of the villagers' experience.
The Village Economy
The change over time of the rice balance agrees well with the pattern of migration, and it
is tempting to apply the paradigm of carrying capacity to the case of DD. There is a
serious objection to this, however, in that as a population approaches the carrying
capacity of the land, the amount of resources available per person should at least become
constant, if not decrease, and this is not the case in DD. Village elders agree unanimously
that life was really hard in the old days. And, as will be shown later, it is undeniable that
the living standard has improved significantly and the structure of the village economy
changed drastically in the past few decades. Therefore, it is necessary to take the
economy into account in the argument on population and food in DD.
Until the commercial cultivation of cotton in the 1940s, the village economy was
largely one of subsistence. A Japanese anthropologist, the late Mizuno Koichi, studied
DD in 1964-1965. His farm economic survey and ours demonstrate the growth and change
of the village economy during the interval. The village economy grew at the rate of 3.67
percent per annum, but this growth was mostly due to the nearly 10 percent annual
growth of the off-farm sector. The share of the farm sector shrank from 78.7 to 42.2
percent of the total revenue. In particular, the decline of the share of rice-growing is
-167 - 685
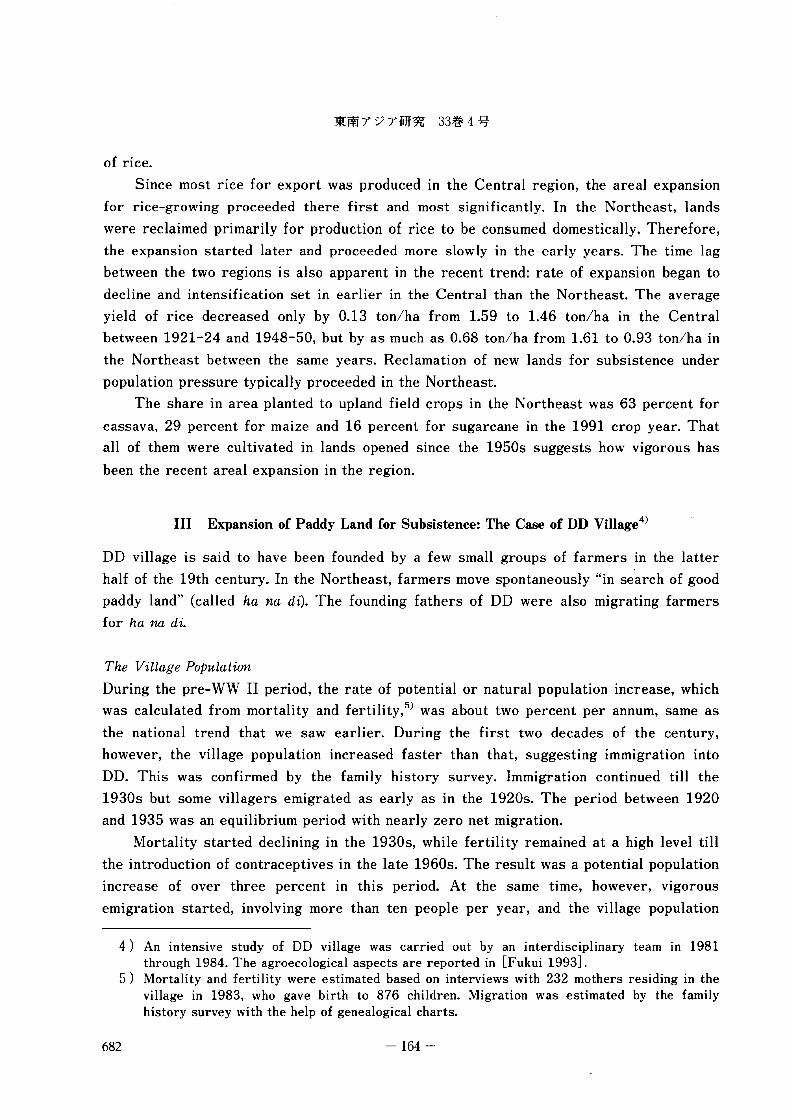
Year 1900 10 20 30 40 50 60 70 80
Demogaphic Period II/a IIIb Ilie
150 320 500 810 9003.8 2.7 1.8 1.0 0.3
2.2m 2.2 3.2 2.2
Migratioo (person /year) +3.6 +0.1 -11.0 -10.8(tor M n.rd') (!t ) (!; ) (-8) (-8) ( -4)
Relative desirability + ±of life in vinage
Paddy area
Probabilityof (S6/100) 6/100 17/100--stockdepletioo
Village ecooomieSlbsistencestnJctt.re
Fig.6 Changes in the Relation between Population, Rice and Economy in DD
Source: [Fukui 1993]
notable: from 38.4 percent in the 1960s to 16.9 percent in the 1980s.
The changes in demographic features, the rice balance, and the village economic
structure are summarized in Fig. 6.
The relevant questions to be asked are: (a) how villagers coped with deterioration of
the rice balance (from 6/100 to 17/100 of SDP) in the 1940s through the 1960s, and (b)
why the rice balance remained constant from the 1960s notwithstanding the significant
improvement of the living standard.
The rate of ha na di emigration exceeded ten persons per year from the 1930s. By
the expansion of paddy acreage, though of inferior lands, the total acreage nearly doubled
within the relatively short period of the 1940s. Yet, villagers must have been able to
tolerate the increasing SDP.
The sudden boom of cotton growing appears to have saved the village. Next, kenaf
replaced it. Cash income from these crops was sufficient for villagers to buy rice in the
years of stock depletion. This income, however, was supplementary to rice-growing,
which continued to be the basis of livelihood. Villagers know well how undependable the
income from cash crops is. But the need to purchase rice does not recur every year. As
long as there is rice in the granaries, cash earned can be used for other purposes. Thus,
"one buys rice in poor years but a shirt in bumper years."
686 -168 -
FUKUI H. : Expansion of Arable Land and Its Cessation
There are three reasons for the constant SDP (17/100) after the 1960s. The first is
ever-declining fertility. The second is the continuing trend of emigration, of which the
destination shifted from frontiers to urban areas. The third is the absence of wage
earners resident in the village who had completely abandoned rice farming.
It appears that 17/100 SDP with 0.4 ha per person is considered by villagers to be
the minimum for self-sufficiency in rice. And unless self-sufficiency in rice is assured,
there seems to be no reason to stay on in the village. Moving to towns offers more
chances for employment that is good enough to compensate for the loss incurred by not
growing rice. This may be the basic reason for the continuing emigration to towns.
From the 1970s, cash income increased dramatically: first from vegetable growing,
and second, more importantly, from off-farm employment. Since DD is within commuting
distance of Khon Kaen City, one of the boom towns in the Northeast, many villagers
commute there. Some of their jobs are quite stable, being with government agencies and
large Bangkok-based companies. And although it would thus be quite understandable if
some of them had abandoned rice farming completely, there were, as of 1984, only a few
such cases.
Rice cultivation under rainfed conditions requires a high labor input in a short
period because planting is possible only after heavy rainfalls and must be finished before
the fields dry up. Planters must stand by because nobody knows when the fields will be
ready for planting, although the actual working time is rather short. This is one of the
peculiar features of rainfed rice growing. Thus, it would be rather easy to continue to
grow rice while commuting to Khon Kaen for an off-farm job. It was observed that the
traditional mode of cooperation among close kin, called "work together, eat together" (het
nam kan, kin nam kan) was becoming more popular than before as a means to help
households in which one or more members had jobs in towns. Moreover, to be a part-time
farmer who is self-sufficient in rice guarantees the basic minimum, especially when one
gets old or sick. To be a landed farmer is strongly viewed by villagers as being on the
right side of the fence.
The follow-up surveys after 1984, however, suggest further deterioration of the
SDP. In 1991, the village population exceeded 1,000 and per capita paddy area shrank to
0.32 ha. Several households emerged with no member engaged in rice farming. A morning
market was opened in the village. Several motorcycle-taxis carry commuters between the
village and the nearest bus stop. DD is now becoming a suburban village. The village
population is not determined by the rice balance anymore.
A Summary of the DD Study
The DD study clearly shows that the popular image of Asian rice cultivation and the
rice-growing society must substantially be rectified. The popular image is based on the
situation in areas of intensive rice cultivation in alluvial valleys with a high population
density. There, paddy fields have been handed down through many generations, and rIce
-169 - 687
growing is a time-honored way of life. It is often argued that commercialization brings
about village stratification resulting in landlords, tenants and landless farmers, or a rural
proletariat. This general picture is not the case at all in DD or elsewhere in Northeast
Thailand.
The case of DD 'also illustrates the fact that most of the population increase after
the 19th century in Southeast Asia, as almost everywhere in the developing world, was
absorbed by the agricultural sector, and this was made possible mainly by expansion of
arable area. The expansion of arable area is normally toward inferior lands where the
conditions necessary for dissemination of the Green Revolution are not met.
In DD, ha na di migration ceased with the shift of destination of emigrants from
frontier lands to urban areas in the mid-1970s. This coincides with transformation of the
Thai economy from one of export of primary products to one of export of industrial
products. It appears that to control deforestation for expansion of arable area without
industrialization or urbanization would be as difficult as to control population without
improvement of the living standard.
It was shown that in the Northeast, the absorption of the increased population into
the agricultural sector by expansion of arable land was socially institutionalized in ha na
di. Ha na di is well planned with a long-term perspective. It is a highly respected action
taken by heads of rather well-off households with pride and responsibility, not by the
poorest, the landless or drop-outs. Since reclamation in the Northeast by way of ha na di
has been popular for more than a century, the majority of today's farmers cultivate lands
reclaimed by their parents or grandparents. Thus, the "traditional" village community has
been dynamic rather than static, and open rather than closed, since long before
"modernization."
Rural-urban migration was preceded by rural-rural migration. The change in
destination in the 1970s did not alter the basic attitude of villagers toward migration.
This means that in case of permanent migration, a new livelihood that is as secure and
sustainable as that of a landed peasant is a prerequisite. Thus, investment in children's
education has replaced land purchase in frontier areas today. In the case of seasonal
migration, wages are supplementary, as is cash income from upland farming, vegetable
growing and other sources available to village residents. This might be a reason for the
frequent changes of and readiness to quit temporary employment among the North
easterners.
IV Commercialization of Rice Cultivation: A Comparison of DD and NH Villages6)
As mentioned before, the rainfed rice cultivation in the Northeast has produced little
6) NH village was studied by Nakada Yoshiaki [1995J, Somkiat Konchan [Somkiat et al. 1995Jand Miyagawa Shuichi [1995J.
688 -170 -

FUKCI H. : Expansion of Arable Land and Its Cessation
surplus. In the late 1970s, however, commercial production started in some areas of the
region, though paddy fields remained unirrigated as before.
Since the Thai-Lao people, a major ethnic group of the region, eat steamed glutinous
rice, this type of rice is dominant as far as the production is for subsistence. 7) Glutinous
rice is also eaten in the North. But it is the nonglutinous type that is eaten in the other
regions, and by townspeople regardless of in which region they live. Export demand for
glutinous rice is also limited. Thus, the market is much smaller and the price lower for
glutinous than nonglutinous rice. Commercial production of rice in the Northeast means
the switch from glutinous to nonglutinous rice.
Self-sufficiency in rice is narrowly attained In villages, as the case of DD
demonstrated. Without substantial improvement of the yield, it would be impossible to
maintain self-sufficiency and, at the same time, produce the surplus.
Commercial production in the Northeast was realized by a combination of two
technologies: a supreme variety of nonglutinous rice and application of chemical
fertilizers. Farmers planted part of their holdings to nonglutinous rice and the rest to
glutinous rice, and applied fertilizers to both.
There is a big intraregional differential In the degree of commercialization. Two
villages are compared: one is DD village in Khon Kaen and the other NH village In
Yasothon, the east-central part of the Northeast. They are about 150 km apart.
The Background of DD and NH
The conditions relevant to the present topic that may differ substantially between the two
villages include the following.
First, rainfall is more favorable in Yasothon (ca. 1,500 mm per year) than in Khon
Kaen (ca. 1,200 mm). DD frequently suffers from flood while there is no flood in NH.
Drought and flood make rice production in DD highly unstable, as stated earlier. Soil
fertility, however, is higher in DD than NH because the former is in the floodplain of the
Chi .River while the latter is on a raised surface far from the river. In short, the rice
yield is highly unstable but good in favorable years in DD, while it is much more reliable
but poor in NH.
Second, Changwat Yasothon offers very limited opportunities for off-farm jobs. Job
opportunities in the adjacent two changwat, Roi Et and Ubon Ratchathani, which are 71
and 98 km away, respectively, are greater than in Yasothon, but no greater than in Khon
Kaen. Therefore, the lifestyle dominant in DD, i.e., a relatively high living standard
thanks to cash income and concurrent self-sufficiency in rice, might be difficult in
7) Nonglutinous rice is popular in the southern and southwestern parts of the Northeast, wherenon-Lao peoples are dominant. These parts were reached by rail much earlier than the restof the region, and this appears to have facilitated commercial production of rice there. It issaid that the nonglutinous variety was first brought from there to Yasothon, including NHvillage.
-171- 689
Yasothon. In Yasothon, it is to be expected that more villagers will leave their villages
for Bangkok for temporary as well as permanent off-farm jobs.
Rice Cultivation
The rice cultivation in DD prior to commercialization has been described earlier. That in
NH is similar to it with minor differences.
NH village was reportedly founded in 1889, about two decades later than DD. NH
separated from a neighboring village. It is said in NH that only about one half of the total
village rice lands was actually planted in the 1920s. It is not sure whether the rest had
been reclaimed or was simply under claim of ownership. The village population in the
1930s was about 500, the same as that of DD, but per capita paddy area was as large as
0.96 ha in NH, but only 0.40 ha in DD. Despite the large paddy area per person in NH, ha
na di emigration started then as in DD. Reclaimable land for rice-growing in NH became
exhausted in the 1960s, about a decade later than in DD. In the late 1960s, work away
appeared in NH. Seasonal migration to Bangkok and other urban centers was the usual
mode of off-farm work, because there were few opportunities for those remaining in the
village. The same can be said today. Commercial production of rice began to spread in the
second half of the 1970s when 800 lived in the village with 0.64 ha of paddy fields each, a
larger area than that in DD in the same decade.
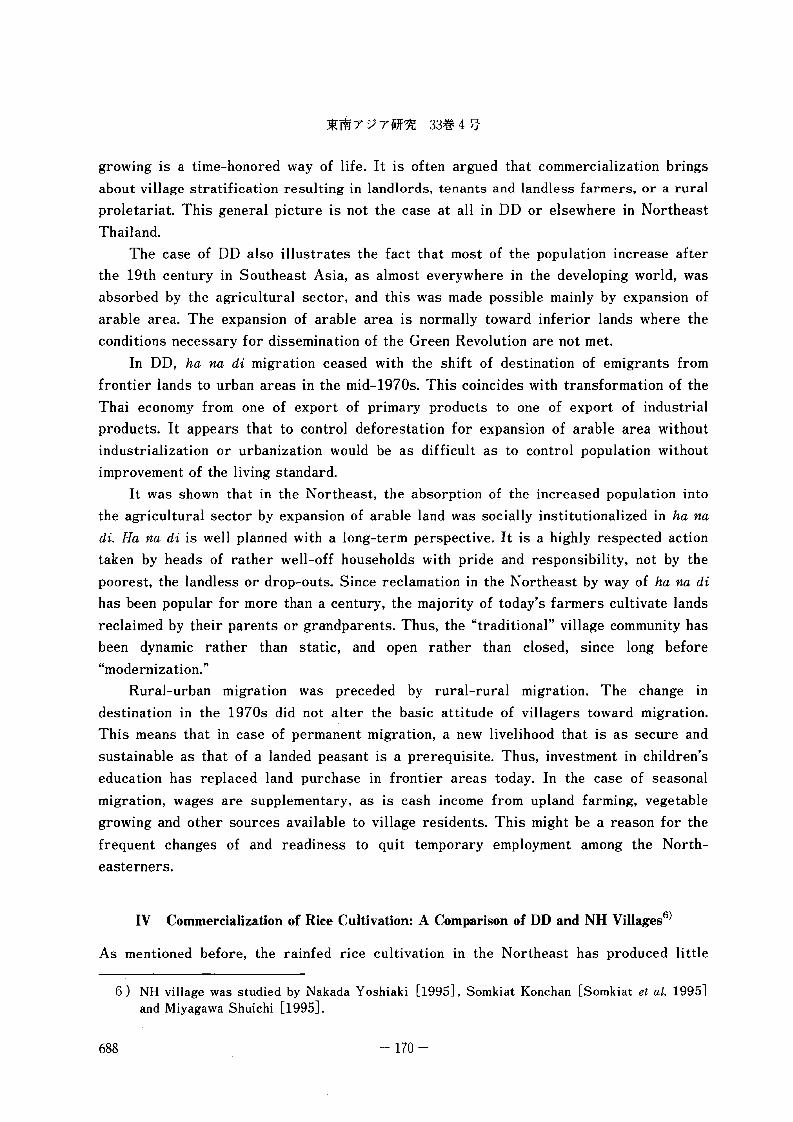
Table 3 A Comparison of Rice Cultivation between DD and NH Villages (1991)
DD NH
Area of nonglutinous rice (%) 15.5 51.8
Households selling rice (%) 37.6 88.7... --- - -. ---- --- -- .-- --- _.- ---- --- ----- --- --- - - - - --- --- -- --- --------- --- - ----- - -- - -_ .. ------ ... -- -- _..
Households using fertilizers (%)
690
Organic manure
Chemical
Expense for fertilizers
(baht/household)
Power tillers and tractors
(% of households)
Ownership
Contracted
Expense for contract plowing
(baht/household)
Expense for land consolidation
(baht/household)
Source: [Miyagawa 1996]
-172 -
22.6
70.2
650
19.4
62.1
1,470
5,203
91.9
100.0
1,899
5.1
76.8
979
2,719
FUKL'I H. : Expansion of Arable Land and Its Cessation
The rice cultivation of the two villages in 1991 is summarized in Table 3. Eight
sample households in NH planted nonglutinous rice to 37 percent of their paddy fields on
average in the three years from 1987 to 1989. The percentage increased to 51.8 percent
in 1991 as seen in the table. It was common in villages in Yasothon in 1991 for
nonglutinous rice to be planted to about one half of paddy fields. In DD, however, the
percentage of area planted to nonglutinous rice increased only from 10.5 percent in 1981
to 15.5 percent in 1991. The percentage of nonglutinous rice may not be a perfect
measure of commercialization. The percentage of households who sold rice during the 12
months after harvest in 1990 was 88.7 percent in NH while only 37.6 percent in DD. It is
evident that the commercialization of rice production spread much earlier and more
widely in NH than DD.
More fertilizers, organic and inorganic, were used in NH than DD in 1991. DD
farmers, however, appear to be more eager to mechanize their farming and spent more
money on land improvement than their counterparts in NH. A lower degree of
commercialization does not necessarily mean lower input. Money was invested in different
ways reflecting the different circumstances of the two villages.
In NH, soils are poor but the yield is more assured. Farmers can expect greater
returns from investments in fertilizers. There is almost no opportunity to earn cash by
wage labor or cultivating other crops for those who remain resident in the village.
Remittances from household members working away and the sale of rice are virtually the
sole sources of cash income. The yield increase by application of fertilizers is possible
and mandatory.
In DD, the inherent soil fertility is relatively high but the production is highly
vulnerable to drought and flood. Fertilizer application is risky and less effective.
Farmers can earn cash through various means while residing in the village: cultivation of
vegetables and cassava, and, most importantly, wage work in Khon Kaen. What they want
is to be self-sufficient in rice on the one hand and, on the other, to earn high and stable
cash income concurrently. To realize this, priority is given to labor saving. Making larger
plots by consolidating smaller ones allows them to use power tillers more easily. With
machines, planting can be accomplished with better timing and in a shorter time, which
effects stabilization of production and allows them to earn more wages.
The Surplus Due to Reduced Consumption
Another interesting feature of NH is that the surplus for sale accrued from not only
improved productivity but also the reduced consumption due to the seasonal emigration of
population.
In NH, there is a rice mill subsidized by the government, which is run by 79 member
households out of the total of 186 in the village in January 1992. Most rice eaten by the
members is milled at the mill and recorded daily. By analyzing the records, one can learn
the consumption of each member household. Together with data on production and sale
-173 - 691
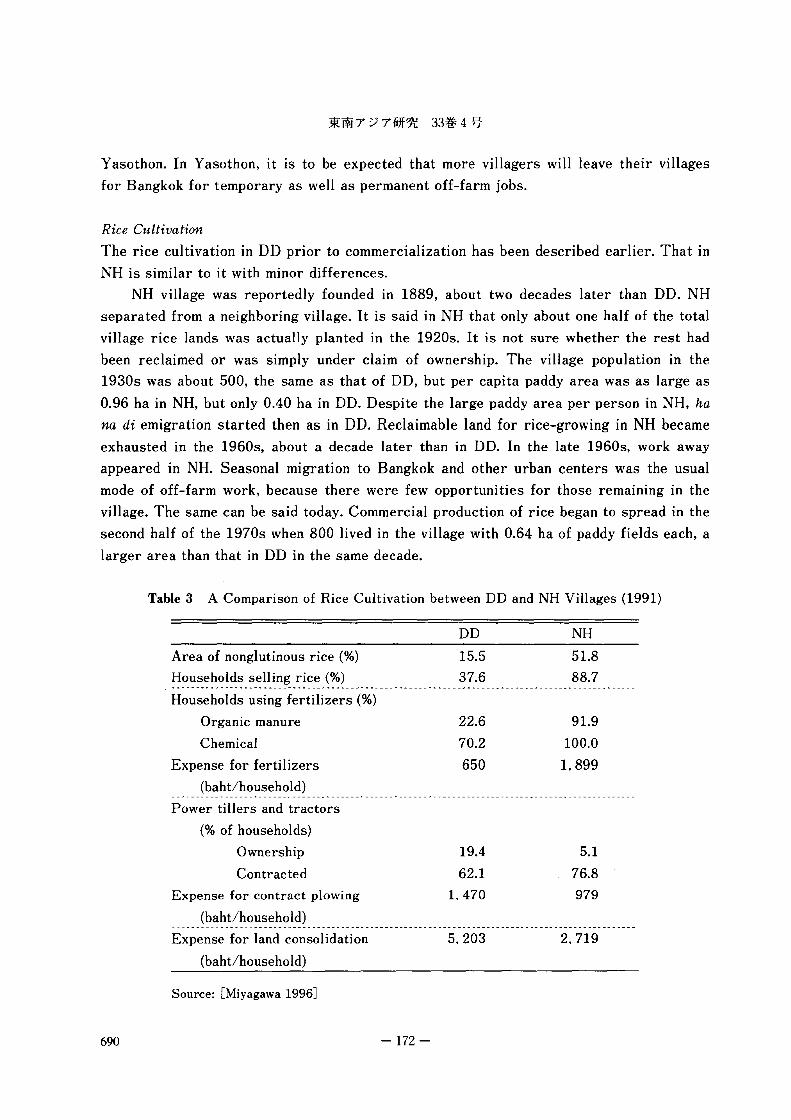
Table 4 Reduction of Rice Consumption Due to Seasonal Emigration
(NH Village, 79 Households, September 1991 - August 1992)
Actual Consumption Consumption with the Zero- Ratio
emigrant Assumption
kg % kg %
Production 298,620 100.0 298,620 100.0 100
Eaten 107,038 36.8 183,294 61.4 171
Taken away 5,106 21.7 0 0.0 0
Other uses 43,421 14.5 43,421 14.5 100
Sale 143,055 47.9 71,905 24.1 50
Source: [Nakada 1995J
(rice is always sold as husked paddy), a balance sheet of rice could be constructed for the
79 households.
Many of these households have one or more members who work away seasonally. It is
possible to calculate how much rice would have been eaten if they had had stayed in the
village throughout the year. The difference between the consumption under the zero
work-away assumption and the actual consumption gives the amount saved through work
away from home. The result of this investigation is summarized in Table 4.
Rice cultivation depended largely on the labor of the seasonally migrating members
of households who usually came back at the busy season. Therefore, the total production
was assumed not to be affected under the zero-migration assumption. Under the same
assumption, the total consumption would have increased by about 70 percent. This is
related to the fact that the migrating members belonged to the age-sex groups of highest
per capita food intake. No rice would have been taken because nobody had had left the
village under the assumption.
Overall, these households could have sold only one half of what they actually sold if
nobody had had worked away. In other words, about one half of the surplus accrued from
the saving of consumption through the work-away. The commercial production of rice in
NH was realized through not only the new variety and fertilizers but also the reduced
consumption.
V Deforestation and the Cultivation of Upland Field Crops
A Historical Review
The Northeast is rich in archaeological and historical remains. There are numerous sites
of pre-Angkor human settlement. The sphere of the Angkor civilization extended to the
region, but after the fall of the Angkor Empire in the 14th century, the region is said to
have become a demographic as well as political "vacuum." The vacuum was filled by the
692 -174 -
FUKUI H. : Expansion of Arable Land and Its Cessation
Siamese from the southwest and the Lao from across the Mae Khong River from the 18th
century. Today, Lao or Thai-Lao are most numerous in the plateau, while Siamese or
descendants of the Central Thai occupy the southwest corner, and Khmer stock from the
old days remain in the southern part.
The newcomers, mainly Lao, advanced into the heart of the plateau from the late
18th century. They opened a large area of lowlands for rice-growing but little upland.
Rather, they needed forest for grazing of water buffaloes, and hunting and gathering for
payment of tax (suai), sale, barter and self-consumption. In addition, a tract of forest was
reserved for worshipping spirits (don puta), and for burial of the dead (pa cha).
In the late 18th and the 19th centuries, many Lao principalities (muang) headed by
Lao lords (chao muang) mushroomed, and these were recognized by Thon Buri and
Bangkok [Keyes 1976J . The commoners had the obligation to pay tax in kind (suai)
[Koizumi 1992J or labor to the chao muang. The governance of the chao muang, however,
extended over the people, not the land. There might be a territorial claim by them but,
seemingly, the right to individual pieces of land was recognized only among villagers and
was not subject to intervention from higher authorities. Unused forest was virtually no
man's-land.
The principalities (muang) were abolished during the course of modernization of the
local administration in the last decade of the 19th century. The newly initiated Ministry
of Interior appointed governors in place of the chao muang [Tej 1977J. In order to
encourage land reclamation, especially for rice production in the Central region, the
government began to issue land titles from around 1905 [Suehiro and Yasuda 1987J. In
the Northeast, however, the new land tenure system began to be implemented in the
1920s or 1930s. Under this system, untitled land was supposed to belong to the
government, but the land was not effectively administered. It became a common practice
among farmers to obtain title by cultivating a tract of land in the forest for several
consecutive years. Notwithstanding this, the "king's land" and the "people's land" could
coexist without serious confrontation since only lowland was suitable for rice, and
reclamation conducted mainly for subsistence farming at that time.
The start of a new type of reclamation for commercial cultivation of upland field
crops in the 1950s and the 1960s changed the whole picture. Alarmed by this, the
government proclaimed large areas to be forest reserves in 1964, and prohibited
trespassing there. It took several years for delineation of the reserved areas, and many
settlers were found to be already cultivating lands in these areas when it was finished.
Even after the delineation, the law failed to prevent effectively incursions by new
settlers. As a result, the forest area in the Northeast decreased rapidly: from 42 percent
of the total land area in 1961 to 25 percent in 1976 and a mere 14 percent in 1988.
Though ineffective, the law made the settlers illegal squatters. They could not expect to
gain land titles however long they cultivated the lands. The peaceful coexistence of the
"king's land" and the "people's land" became impossible.
-175 - 693
The government attempted various reforestation programs. In the "forest villages,"
the "squatters" were invited to plant tree seedlings while they were allowed to grow food
crops in between. In another program, they were given land but had to promise not to go
deeper into the forest. Reforestation became an obligation of forest concessionaires.
These and other measures might not have been totally ineffective, but the statistics tell
us that the total area of reforestation in the country during the period from 1961 to 1985
accounted for a mere four percent of the forest area that vanished during the same
period.
The economic growth brought about a turning point in the competitive landuse. The
consumption of paper jumped from 260,000 ton in 1974 to 630,000 in 1985, and it was
anticipated that demand would soon surpass the capacity of domestic supply. Eucalyptus
plantation suddenly became economically viable. Subsidies and tax exemption for pulp
industries helped. The government granted the usufruct of land and subsidies to those
who planted Eucalyptus within the forest reserve. These policies and the greater concern
for forest conservation among the general public encouraged large domestic and foreign
corporations. They attempted to remove the "squatters" from lands for plantation, with
mixed success, which caused a serious social problem. In 1989, the government prohibited
exploitation of all natural forests except for mangrove forests. The resulting high price
of timber brought about an increase of illegal cutting and illegal import, but, at the same
time, economic viability of reforestation with other species suitable for timber.
Apart from Eucalyptus, the economic growth since the 1980s made it less attractive
for farmers to expand arable land because of the greater opportunities for off-farm jobs.
In the remotest areas, entire villages were sometimes deserted. A large landslide in the
South in 1988 triggered a sharpening of interest in forest conservation among
intellectuals, and it affected the rural leaders including monks. It seems, however, that
this interest and the public campaigns might have been effective to conserve forests only
against the background of economic growth.
Admitting the failure of the forest administration in the past, the government is
facing reality: that is, long existence of cultivated lands and villages in the supposedly
"reserved" forests. A new policy is now being formulated to conserve existing forests on
the one hand, and, on the other, to recognize "communal forest" (pa chumchon) , which is
managed by villagers for mixed landuse combining agriculture, forestry, and/or animal
husbandry.
A Case Study in Yasothon8)
There are two topographic types of upland in the Northeast. One is extensive upland with
no lowland suitable for rice-growing, and the other isolated upland surrounded by
8) The Nong Daeng-Maphrik area in Yasothon Province was studied by Kono Yasuyuki, SumanSijapati, and Takeda Sinya [Kono et al. 1994J .
694 -176 -
FUKUI H. : Expansion of Arable Land and Its Cessation
lowland. The former was settled by farmers specializing in commercial cultivation of
upland field crops exclusively after the late 1950s. The latter was first reclaimed by
nearby rice-growers for cultivation of subsistence crops a long time ago, for cotton in the
19405, for kenaf in the 19605 and finally for cassava in the 19705. The present case
study examines the latter type.
The study area is a flat-topped isolated hill of about 80 square kilometers, rising
40 m above the surrounding lowland. Along the foot of the hill are 36 villages. Following
the names of the national reserve forests on the hill, it is called Nong Daeng-Maphrik
area in this paper. The landuse of the area was investigated through interviews, and with
aerial photos of 1954 and 1975, and satellite imageries after 1988.
Cotton, mulberry trees and vegetables had long been grown on the hill by the slash
and-burn method. People were completely free to swidden as much land as they wished,
and in practice households planted 0.04-0.32 ha each. Government announcement of the
new land tenure system in 1905 reached the area that every piece of land in use should
be registered, and nonregistered land would become the national forest. The
announcement was largely ignored because of the villagers' suspicion of taxation and the
complexity of the procedure (the majority were illiterate then). In one of the villages,
three persons registered 4.8 ha each, representing their fellow villagers, but the location
of the lands was not specified. They collected land tax and paid in their own names.
There was no change in landuse at all through this.
The cotton boom during WW II also reached the area. Cotton was also grown by the
slash-and-burn method on 0.16-0.8 ha per household. Land was still plentiful but the
villagers' conception of upland changed drastically: what had been something like air or
water suddenly became conceived as property. They rushed to register, and each secured
0.6 to 3.2 ha.
Kenaf came in the late 1950s and early 1960s. Its cultivation required much labor,
especially for separation of fibers by soaking (retting). For this reason, it was cultivated
continuously on the same plot close to a body of water. In parts of the hill inconvenient
for kenaf-growing, the forest recovered to some extent during the kenaf period. And the
effect of off-farm jobs on landuse began to be felt around this time.
The 1970s saw rapid reclamation for growing cassava. Use of big tractors and hired
labor allowed a farmer to cultivate a large area. It is said that as much as 8 ha could be
managed by a single household. For cassava-growing, soil fertility and the distance to
water mattered little. The forests were converted to cassava plantations again on a large
scale. At the same time, however, attempts to conserve forests by the villagers
themselves began to appear.
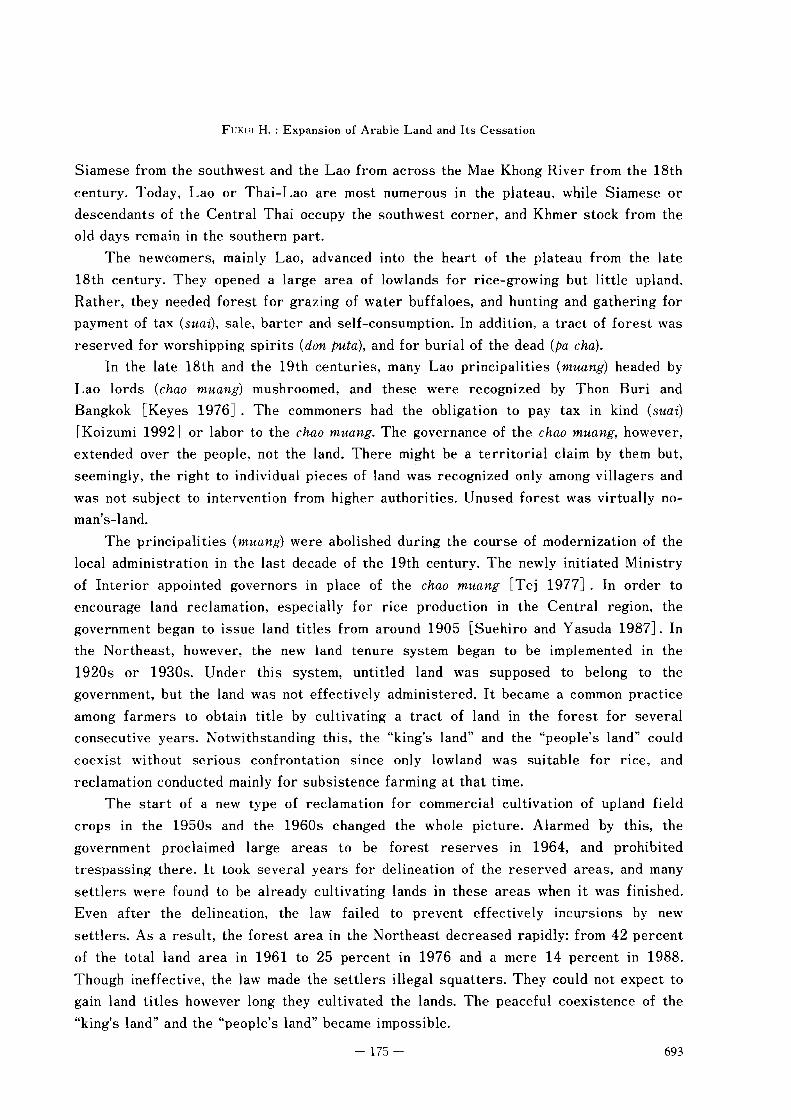
Table 5 shows the change In landuse based on the remote sensing data SInce 1954.
Though the table apparently indicates that the landuse changed little, there were actually
substantial changes. A large part of the "upland" was actually in fallow in 1954, while
there was almost no fallow after cassava-growing began. The "low forest" is former
-177 - 695
Table 5 Changes in Landuse in Nong Daeng-Maphrik
(%)
1954 1975 1993
Forest land 35 35 28
Tall trees 15 16 11
Short trees 14 14 13
Plotted 6 5 4- - -- - -- ---- -- - -- --- - -- - - - - ----- --- --- - -- - - - - --- -- --- - -- - -- - -- --- - - - --- --- --Upland (inc. fallow) 57 57 63
Paddy field 6 6 6
Settled 2 2 3
Total 100 100 100
Source: [Kono, Sijapati, and Takeda 1994]
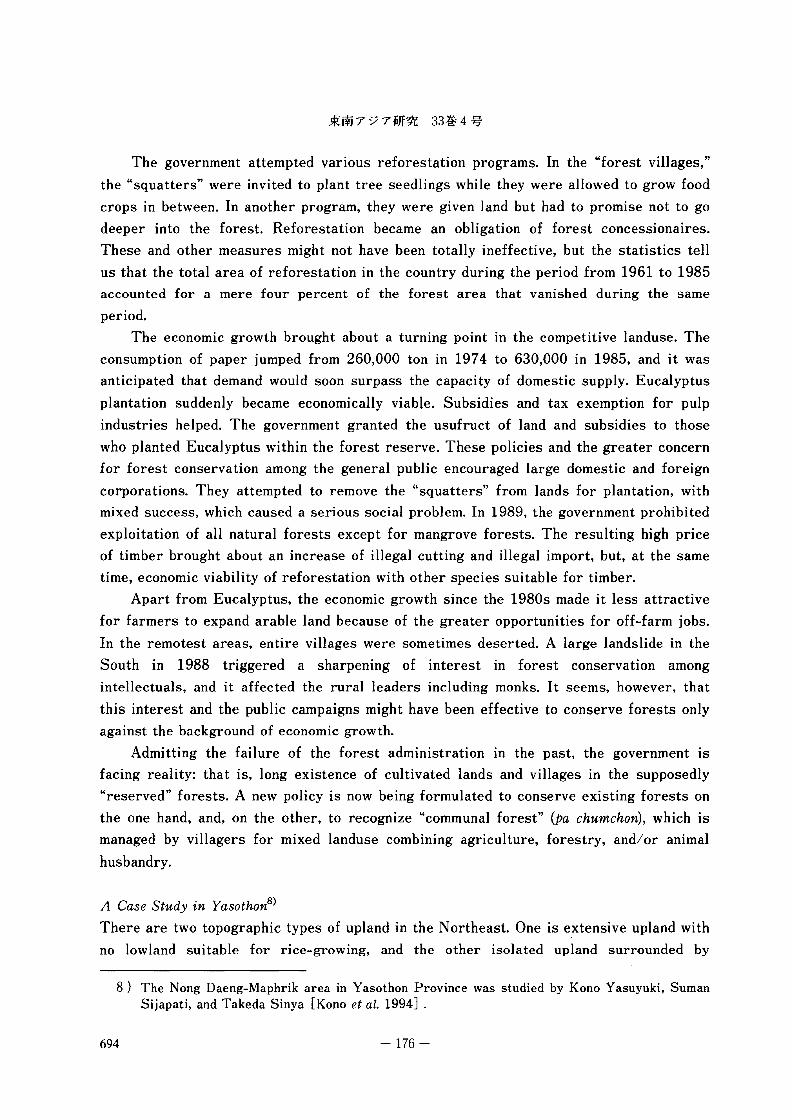
Table 6 A Classification of the Existing Forest in Nong Daeng-Maphrik
(in rai = 0.16ha)
Community forest Sacred forest for the village gurdian spirits (don puta) 350
Cremation forest (pa cha) 450
Communal forest (pa satarana) 3,550-- ----- --- --- - -- - --- -------- --- --- - --- -------- - -- --- - -- -.---- --- --- --- - --- -------- - -- - -- - --- ----- - - - - -- --- --National reserve In the marked area 4,410forest
Outside of the marked area
Private forest
and orchard
Total
Source: [Kono, Sijapti, and Takeda 1994]
5,540
14,300
arable land. The changes in landuse might not be apparent in the table, since it shows the
total acreages in different uses. Actually, however, the place of cultivation shifted
according to the kind of crops and land conditions (soil fertility, distance to a water body
and others) as mentioned above, and significant changes should be apparent if landuse
were broken down according to individual villages. Nevertheless, it is certain that most of
the forest had been opened by the 1950s and what changed thereafter was the intensity of
landuse. Most significant, perhaps, is the fact that the forest, especially the high forest,
changed little throughout the period.
The remaining forests can be classified by their uses and modes of management
(Table 6). As in the use of arable land, there are great variations in these between thevillages. A close look at individual villages would give an insight into the competition in
landuse between forest and upland.The 36 villages (mu ban) in the area formed 18 forest management units, each
696 -178 -
FUKUI H. : Expansion of Arable Land and Its Cessation
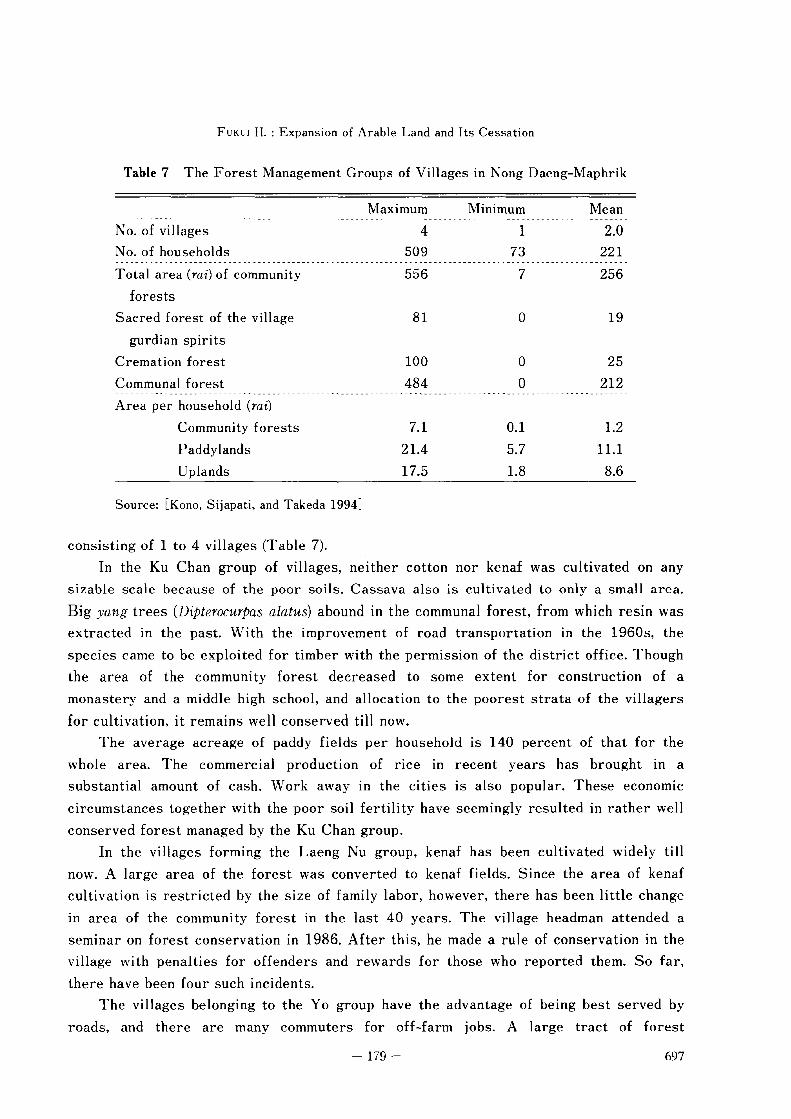
Table 7 The Forest Management Groups of Villages in Nong Daeng-Maphrik
Maximum Minimum Mean
No. of villages 4 1 2.0
No. of households 509 73 221-----------._---------------~----------------------------------------------------------------------------
Total area (rai) of community 556 7 256
forests
Sacred forest of the village 81 0 19
gurdian spirits
Cremation forest 100 0 25
Communal forest 484 0 212
Area per household (rai)
Community forests
Paddylands
Uplands
Source: [Kono, Sijapati, and Takeda 1994J
7.121.4
17.5
0.1
5.71.8
1.2
11.1
8.6
consisting of 1 to 4 villages (Table 7).
In the Ku Chan group of villages, neither cotton nor kenaf was cultivated on any
sizable scale because of the poor soils. Cassava also is cultivated to only a small area.
Big yang trees (Dipterocurpas alatus) abound in the communal forest, from which resin was
extracted in the past. With the improvement of road transportation in the 1960s, the
species came to be exploited for timber with the permission of the district office. Though
the area of the community forest decreased to some extent for construction of a
monastery and a middle high school, and allocation to the poorest strata of the villagers
for cultivation, it remains well conserved till now.
The average acreage of paddy fields per household is 140 percent of that for the
whole area. The commercial production of rice in recent years has brought in a
substantial amount of cash. Work away in the cities is also popular. These economic
circumstances together with the poor soil fertility have seemingly resulted in rather well
conserved forest managed by the Ku Chan group.
In the villages forming the Laeng Nu group, kenaf has been cultivated widely till
now. A large area of the forest was converted to kenaf fields. Since the area of kenaf
cultivation is restricted by the size of family labor, however, there has been little change
in area of the community forest in the last 40 years. The village headman attended a
seminar on forest conservation in 1986. After this, he made a rule of conservation in the
village with penalties for offenders and rewards for those who reported them. So far,
there have been four such incidents.
The villages belonging to the Yo group have the advantage of being best served by
roads, and there are many commuters for off-farm jobs. A large tract of forest
-179 - 697

disappeared for cotton cultivation In the 1940s. Little kenaf was cultivated because of
the lack of water bodies. Thus, In the 1960s, the incentive for upland reclamation
weakened and the movement to conserve forest for grazing animals was supported by
many villagers. The cotton fields were demarcated, and the forest recovered to some
extent. The cassava boom in the 1970s, however, reversed the trend. A village headman
who pledged to make the cassava fields forest again was elected as kamnan, the chief of
the tambon, an administrative unit comprising several villages. His success reflects the
reduced economic incentive for cassava cultivation relative to the increased opportunities
to earn wages by commuting.
Crops cultivated in the land managed by the Dong group changed typically from
cotton to kenaf and cassava. The site of the present communal forest was formerly used
as cotton fields but reverted to forest in the kanaf period, when the need for upland was
relatively small.
The same trend was seen in the Thung Mon group: the initial destruction of forest
for cotton, some recovery during the kenaf period, and its disappearance again with the
arrival of the cassava boom. The communal forest was delineated in the 1980s but with
little success. Two reasons are conceivable: one, the group villages were far from trunk
roads; and two, many farmers from outside the group cultivated cassava there.
Community solidarity apparently is another factor affecting forest conservation.
Examination of the changes in landuse in some of the villages in the area revealed
the following.
1. Two kinds of forest, the cremation forest and sacred forest for the village
guardian spirits, are indispensable. Their area might have shrunk in some villages, the
forests being used for public purposes, paddy fields and/or housing, but not for upland
field crops.
2. Villagers were formerly free to use the forest land. When the forest shrank to
the minimum, they recognized the need for its conservation and delineated the communal
forest. But the actual landuse of the delineated tract is variable from one forest
management group to another.
3. The spatial and temporal variations of the communal forests in the area could
largely be explained by the variations in the degree of need for arable upland and the
suitability of land conditions for upland fields crops. Where the land is suitable and other
sources of cash income are limited, it seems almost impossible to maintain large tracts of
the communal forest.
4. Concern about forest conservation is permeating into rural societies. In
practice, however, this is an effective constraint only when the incentive to cultivate
upland field crops is limited.
698 -180 -
FUKUI H. : Expansion of Arable Land and Its Cessation
VI A Summary and Implications
The dramatic economIC growth of many developing countries in East and Southeast Asia
in recent years is well known. Thailand is one of them. Her growth deserves particular
attention from the point of view of the relationship between economic growth and
agriculture since the Thai economy includes a large rural sector in which small-scale
peasantry is dominant. How the peasant agriculture and the "dual economy" are being
transformed by the economic growth would be a common interest among other developing
countries, too.
The process of expansion of arable land in Thailand since the mid-19th century can
be periodized into three. The first 100 years saw areal expansion mainly for rice. It was
a response to the increasing demand for rice for export as well as for the increasing
population. Besides rice, rubber, teak and tin became major export commodities. The
Thai economy was typically a primary-product-exporting one.
The second period of areal expansion, from the 1950s till the late 1970s,
corresponds to the so-called age of development. Throughout the period, the rate of
expansion of arable land was much accelerated. Though the high rate of population
increase, over three percent per annum, was certainly responsible for this, the demand
for export of new crops was also a strong incentive for reclamation. Notwithstanding the
expanding area of arable land, the share of the agricultural sector continuously shrank
during this period due to the greater growth rate of the industrial and other sectors.
None of the new crops for export was a traditional tropical product: they were feed
crops for export to developed countries in the temperate zone. Thailand pioneered the
feed export with great success. This was possible because of the much-improved
infrastructure during the period and the existence of an efficient marketing system
inherited from the traditional rice export of over a century. And, ironically, the
administration of forest lands then was such that it allowed the areal expansion by
peasants. The export of farm products, feeds in particular, helped the Thai economy to
evolve from one oriented to export of primary products to an industrial economy, first
for import substitution and then for export. It is said, in particular, that the critical
situation caused by the price increase of petroleum in the 1970s was much relieved by
the export of farm products [Medhi 1994J.
The third period of areal expansion is characterized by its slower rate: in the late
1970s for paddy and the late 1980s for upland and garden crops. Though the expansion
has not come to a complete halt, it is certain that a fundamental transformation of Thai
agriculture has set in. This might partly be a reflection of the significant decline of birth
rate and the concomitant slow rate of population increase since the early 1970s. But it
seems more closely related with the price decline of primary products in the second half
of the 1980s and the increased opportunities of off-farm jobs. Both of these reduced the
-181 - 699

incentive felt by the rural population to make for new lands. Part-time farming and rural
urban migration became popular and, at the same time, Thai agriculture as a whole made
a turn to intensification.
Thus, the areal expansion was much accelerated during the transitional period of the
economy, that is, between the period oriented to export of primary products and the
period of industrial production. When industrialization passed a threshold, agriculture
started transforming itself.
Accelerated expansion of arable land was seen widely in the industrialized countries
in the temperate zone at the early stage of industrialization. And it has not been long
since expansion of arable land ceased there. In Eastern Europe, Ukraine, South Africa,
North America, Oceania, Argentine and Northeast China, the cessation began only in the
present century. It seems that there was a time lag between industrialization/urban
ization and the cessation of areal expansion.
Thailand appears to be repeating what happened elsewhere. If such is a general rule,
to control areal expansion without industrialization would be as impossible as to control
population increase without raising the living standard. Some opine that the rapid
population increase and concomitant environmental deterioration (deforestation and
desertification) are the causes of impoverishment in developing countries. The case of
Thailand implies, however, that the causal relation is reverse: that is, it is poverty that
causes the continuing population increase and deterioration of the environment. The case
of Thailand implies that the only possible way out of the vicious circle would be
industrialization.
On the one hand, there is the "limit of growth," though nobody is sure when it will
come. Even for present developed countries, affluence is not guaranteed to last forever.
If more join them, the global predicament will be worsened. On the other, however, it is
unrealistic as well as immoral to try deliberately to suppress the economic growth of
developing countries.
According to the UN population projection [UN 1993], the world population will
probably become nearly static by the middle of the next century at a level of slightly over
10 billion. If this is really the case, what we should do is to design the earth assuming
that population. There is no need to assume, as Malthus thought, that population will
continue to increase exponentially and can be checked only by calamities and vice. It
appears that the human population does not follow the laws of biology.
Though the world population might be as such, the increase of per capita GDP by
the industrialization of developing countries will pose a more serious threat. Would it be
possible to design the earth assuming an omnipresense of industrialization all over the
world with 10 billion people? If the answer is no, there would be no other way but to play
a survival game. If one wants a positive answer, he has to design the earth within the
capacity of the earth. The ideology of the sustainable development is one of the efforts
along this line.
700 -182 -

FUKUI H. : Expansion of Arable Land and Its Cessation
Whatever efforts might be made, towards sustainable development or otherwise,
there is a precondition for them to be really effective. That is a strong sense of sharing
the common destiny, the oneness of all mankind, or the notion of the earth as a spaceship.
As long as the big gap between haves and have-nots persists, however, it will be
impossible to expect this sense to grow sufficiently strong and become effective to
control behaviors of governments and individuals. There will be no way out from the
world predicament without an amicable settlement of confrontation between the haves and
have-nots.
It is evident that the case of Thailand alone does not present sufficient information
to address the global issue of population and economic growth. The issue, however,
should be addressed not only by armchair deliberations and symposia, but also based on
fact-finding case studies at micro-levels. If one feels uneasy at hearing only the demands
of rich countries toward poor ones, such as population control, environmental protection
and human rights, he should listen to and initiate by himself case studies.
References
Ammar Siamwalla; Suthad Setboonsarng; and Direk Patamasiriwat. 1993. Agriculture. In The ThaiEC01wmy in Transition, edited by Peter G. Warr. Cambridge University Press.
Fukui Hayao. 1993. Food and Population in a Northeast Thai Village. Translated by Peter Hawkes.Honolulu: University of Hawaii Press.
Ingram, James. 1971. Economic Change in Thailand. 1850-1970. Stanford University Press.Keyes, Charles. 1976. In Search of Land: Village Formation in the Central Chi River Valley.
Contributions to Asian Studies 9: 45-63.Kobayashi Kazumasa. 1984. Tonan Ajia no Jinko [Population of Southeast AsiaJ. Tokyo: Sobunsha.Koizumi Junko. 1992. The Communication of Suai from Northeast Siam in the Middle of the
Nineteenth Century. Journal of Southeast Asian Studies 23(2).Kono Yasuyuki; Suman Sijapati; and Takeda Shinya. 1994. Dynamics of Upland Utilization and
Forest Land Management: A Case Study in Yasothon Province, Northeast Thailand. TonanAjia Kenkyu [Southeast Asian Studies] 32(1): 3-33.
Medhi Krongkaew. 1995. Contributions of Agriculture to Industrialization. In Thailand'sIndustrialization and Its Consequences, edited by Medhi Krongkaew, pp.33-65. New York: St.Martin's Press.
Miyagawa Shuichi. 1996. Recent Expansion of Nonglutinous Rice in Northeast Thailand:Intraregional Variation. Tonan Ajia Kenkyu [Southeast Asian Studies] 33(4): 29-56
Mizuno Koichi. 1981. Tai Noson no Shakai Soshiki [Social Organization of Thai Villages]. Tokyo:Sobunsha.
Nakada Yoshiaki. 1995. Yojo-mai to Dekasegi: Tai Tohokubu Yasothon Ken no Ichi Noson 0 Taishotoshite [Surplus Rice and Seasonal Labor Migration: A Case Study at a Village in YasothonProvince, Northeast Thailand]. Tonan Ajia Kenkyu [Southeast Asian Studies] 32(4): 523-550.
National Statistical Office (NSO). n.d. Population and Housing Census, Report of the Labor Force Survey.Somkiat Konchan; Nakada Yoshiaki; and Fukui Hayao. 1995. Food and Population under
Subsistence Rice Farming in Three Villages in Yasothon, Northeast Thailand. Tonan AjiaKenkyu [Southeast Asian Studies] 33(3): 58-80.
Sompop Manarungsan. 1989. Economic Development of Thailand. 1850 -1950: Response to the Challengeof the World Economy. lAS Monograph No.042 Bangkok: Institute of Asia Studies,Chulalongkorn University.
-183 - 701

Suehiro Akira; and Yasuda Kiyoshi. 1987. Tai no Kogyo·ka: NAIC eno Chosen [Industrialization ofThailand: A Challenge to N.A.I.C']. Tokyo: Institute of Developing Economy.
Tej Bunnag. 1977. The Provincial Administration of Siam. 1892-1915. Kuala Lumpur: OxfordUniversity Press.
United Nations Population Fund. 1992. The State of World Population, 1992. New York: UNFPA.
702 -184 -