expanding taxable capacity and reaching revenue...
TRANSCRIPT

Policy ReseaRch WoRking PaPeR 4559
Expanding Taxable Capacity and Reaching Revenue Potential:
Cross-Country Analysis
Tuan Minh LeBlanca Moreno-DodsonJeep Rojchaichaninthorn
The World BankPoverty Reduction and Economic Management NetworkMarch 2008
WPS4559P
ublic
Dis
clos
ure
Aut
horiz
edP
ublic
Dis
clos
ure
Aut
horiz
edP
ublic
Dis
clos
ure
Aut
horiz
edP
ublic
Dis
clos
ure
Aut
horiz
ed

Produced by the Research Support Team
Abstract
The Policy Research Working Paper Series disseminates the findings of work in progress to encourage the exchange of ideas about development issues. An objective of the series is to get the findings out quickly, even if the presentations are less than fully polished. The papers carry the names of the authors and should be cited accordingly. The findings, interpretations, and conclusions expressed in this paper are entirely those of the authors. They do not necessarily represent the views of the International Bank for Reconstruction and Development/World Bank and its affiliated organizations, or those of the Executive Directors of the World Bank or the governments they represent.
Policy ReseaRch WoRking PaPeR 4559
An effective tax system is fundamental for successful country development. The first step to understand public revenue systems is to establish some commonly agreed performance measurements and benchmarks. This paper employs a cross-country study to estimate tax capacity from a sample of 104 countries during 1994-2003. The estimation results are then used as benchmarks to compare taxable capacity and tax effort in different countries. Taxable capacity refers to the predicted tax-gross domestic product ratio that can be estimated with the regression, taking into account a country’s specific economic, demographic, and institutional features. Tax
This paper—a product of the Poverty Reduction and Economic Management Network—is part of a larger effort in the department to support developing countries in revenue policy reforms. Policy Research Working Papers are also posted on the Web at http://econ.worldbank.org. The author may be contacted at [email protected]@worldbank.org.
effort is defined as an index of the ratio between the share of the actual tax collection in gross domestic product and the predicted taxable capacity. The authors classify countries into four distinct groups by their level of actual tax collection and attained tax effort. This classification is based on the benchmark of the global average of tax collection and a tax effort index of 1 (when tax collection is exactly the same as the estimated taxable capacity). The analysis provides guidance for countries with various levels of tax collection and tax effort.

EXPANDING TAXABLE CAPACITY AND REACHING REVENUE POTENTIAL:
CROSS-COUNTRY ANALYSIS
Tuan Minh Le Blanca Moreno-Dodson
Jeep Rojchaichaninthorn
___________________________ * We thank our peer reviewers Pierre-Richard Agenor (Manchester University), Roy Bahl (Georgia State University), Michael Engelschalk (World Bank), Pierre-Pascal Gendron (Humber Institute of Technology and Advanced Learning), Christopher Heady (Center for Tax Policy and Administration, OECD), Eduardo Ley (World Bank), and Anand Rajaram, (World Bank) for helpful comments and suggestions. Errors remain our own.

- 1 -
I. Introduction The conventional argument for raising tax revenues as an underpinning for economic and social improvement is being coupled with additional lessons emerging from recent aid-effectiveness dialogues. The idea is that attention to tax policy and administration is necessary if a country is to avoid the external aid dependency trap that undercuts accountable governance and, in turn, sustainable efforts toward poverty reduction. The World Bank’s World Development Report (1997) emphasized the essential role of government in allocating resources and highlights that taxation and expenditure are essential tools for macroeconomic stabilization, growth, and development. In the long run, countries must rely on an effective tax system to meet the needs of the public sector. However, most developing countries have not been able to raise sufficient revenues for essential public infrastructure and human development services [World Bank Global Monitoring Report (2005)]. The United Nations report on Financing for Development (2002) highlighted the importance of mobilizing own-financial resources in order for nations to grow and develop. Emphasizing that financing an adequate level of public expenditure while limiting budget deficits calls for substantial tax revenues, the report further concludes that most countries of the developing world must undertake significant tax reforms if they are to raise the required additional revenues. The UN Secretary-General’s Report to the Preparatory Committee for Financing for Development (2002) reinforces this message.1 An effective tax system is fundamental for successful development. There is a large volume of theoretical and empirical literature on taxation that attests to the increasing attention that this topic has received from both academics and policy makers. The problems for developing countries to raise revenues are twofold. First, they typically have limited taxable capacity and a large share of economic activity in the informal sector.2 Second, their tax regimes may be riddled with numerous tax relief initiatives and/or or tax expenditures, which further deplete the tax base and tends to reduce the efficiency and effectiveness of tax collection efforts. A first step in understanding revenue systems is to establish some commonly agreed upon performance measures and accompanying benchmarks. This is the motivation for and main focus of this paper. The paper particularly deals with the concept and empirical estimation of countries’ taxable capacity and tax effort. The analysis and findings of the paper are intended 1 Inter alia, the Report recommends (i) taking measures to ensure that the incidence of taxation falls equitably across income classes as well as across different categories of income and consumption; (ii) extending the tax base to cover incomes from activities that are not currently taxed; (iii) expanding indirect tax productivity and structural equity by targeting the growing (and, yet, often tax-excluded) service sector; and (iv) recognizing that regardless of how well designed a nation’s tax policy may be, how such policies are implemented and administered will determine the ultimate impacts (“tax administration-is-tax policy”). 2 The growing consensus among tax economists is that a higher share of informality supports for introduction of a value added tax (VAT) for both revenue and equity purposes; some consumption in the informal economy cannot completely evade the tax as part of it eventually is picked up by the VAT (see, for example, Bird and Gendron, 2007).

- 2 -
to provide a starting point for tax policy discussion and design. The structure of the paper is as follows. Section II provides an overview of the worldwide trend in revenue collection, using the common tax-to-GDP index as the cross country benchmark for collection. Section III highlights some critical problems in using the tax-GDP ratios to measure tax performance and extends the existing literature to the empirical estimation of a country’s taxable capacity. This section also shows a comparison between a country’s actual collection and its estimated taxable capacity to derive an index of tax effort. On the basis of their respective level of actual collection and tax effort, four distinct groups of countries are classified distilling some policy implications for revenue reforms. Section IV concludes with a summary of the overall pattern and worldwide trends in tax performance and brief remarks on the challenges in designing an effective tax reform program.
II. Pattern and Worldwide Trend in Taxation Tax economists and tax practitioners usually rely on, inter alia, the ratio of tax collection as a share of gross domestic product (GDP) to assess the level of collection effort of a country and establish worldwide patterns and trends for tax collection efforts. The index is calculated on a regional or income classification basis, and also country-by-country. To provide deeper analysis of a country’s tax performance in comparison with its peers, existing tax collection structures are also assessed using the share of each type of tax in GDP or in the total tax collection. The measurement and interpretation of such indexes are relatively simple and straightforward. This section provides an overview of the regional and international pattern and trend in tax collection, using the conventional tax-GDP ratios. To specify how the pattern has changed in the past decade (1994-2003), the data are collected from 104 countries and presented in three benchmark years: 1994, 1998, and 2003. The data are from IMF Government Finance Statistics (GFS) and the World Development Indicators (WDI). Each country’s data are weighted equally and the countries in the sample for which GDP data are available are divided into regions and income groups.3 The data reconfirm the patterns and trends already presented by a number of leading economists (Bird 2007;Fox, et al. 2005). First, tax collection for a country – as a percentage of GDP (measured at market prices) – usually rises as the country’s per capita income level increases. Second, region-specific patterns of collection have been established, which may well reflect certain common features of socio-economic conditions and tax regimes in the neighboring countries.
3 The regional and income group classification is based on the World Bank definition. The World Bank classifies countries into four groups by their income level on the basis of 2005 GNI per capita (unit of currency: USD): Low income group includes countries with GNI per capita of $825 or less; lower middle income, $826–3,255; and upper middle income, $3,256–10,065; and high income, $10,066 or more. For the purpose of our analysis, we have formed three groups of countries: Low income countries with the 2005 GNI per capita of $825 or less, Middle income countries, $826–10,065, and High income countries, $10,066 or more.

- 3 -
Per Capita Income and Tax Revenue Linkage Figure 1 indicates that in 1994, 1998, and 2003, higher income countries collected higher tax revenues and the pattern holds for all the three groups of countries of different levels of income per capita. In the high-income countries, the tax-GDP ratio increased dramatically from 21 percent to approximately 30 percent over the decade. The levels of collection efforts, however, did not significantly change for the groups of low- and middle-income countries. Low-income countries’ collections stayed relatively flat, at around 14 percent, while middle-income countries experienced a modest increase from 20 percent to 21 percent. The observed trend in tax collection implies that low-income countries are being trapped in a structural dilemma: they typically have low taxable capacity – coupled with inefficient collection structure overwhelmed by trade and consumption taxes – while having enormous needs for resources to finance development needs. A general established trend is that, in aggregate, tax intake increases over time: the average of tax-GDP in all groups of countries rose from approximately 19 percent in 1994 to 22 percent in 2003. A number of demand and supply factors account for the tax-income relationship. For example, the demand for public goods and services may rise faster in higher income countries where urbanization tends to rise at a faster speed compared to the one in lower income countries; and it is usually easier to collect taxes in urban areas with higher concentration of the formal sector (Bird 2007). In addition, there are other issues related to good governance and application of voluntary tax compliance philosophy on the basis of improved taxpayer service and enforcement in advanced tax administrations that help enhance revenue collections. Figure 1: Central Tax Revenue as a Percentage of GDP by Income Group (1994-2003)
14.4 13.914.5
20.118.7
21.121.0
28.329.6
0
5
10
15
20
25
30
1994 1998 2003
%GDP
Low income Middle income High income
Source: IMF GFS; WDI.
- 4 -
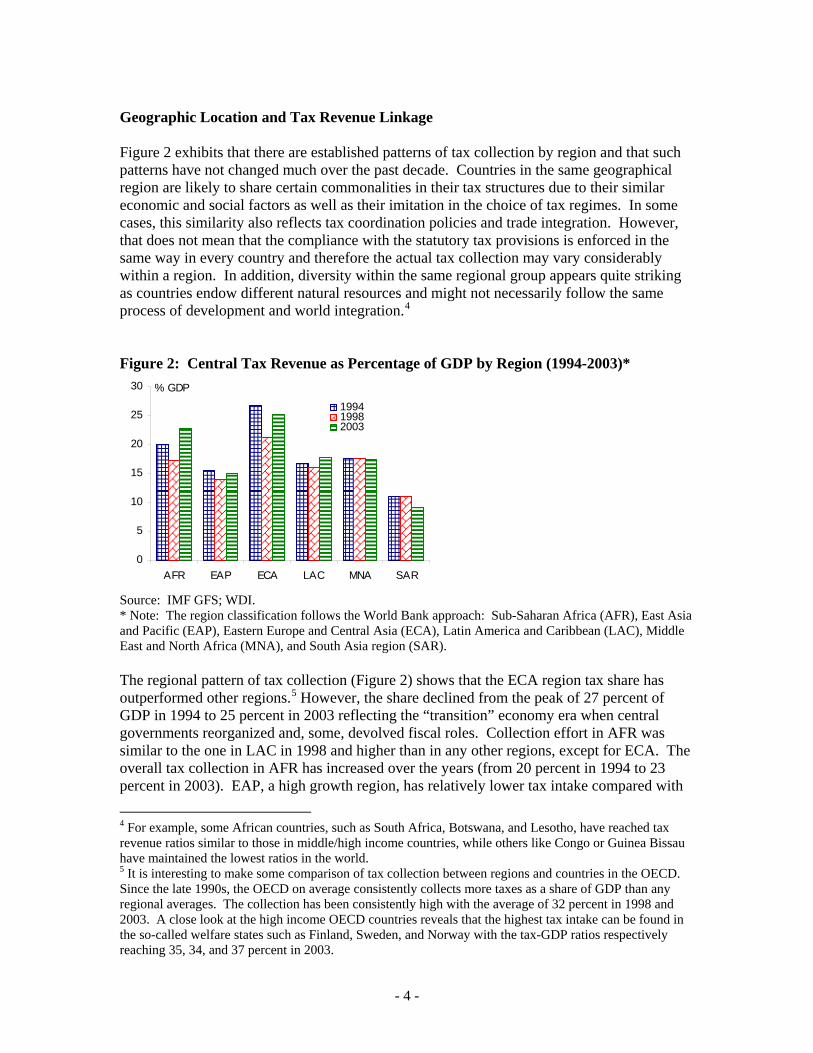
Geographic Location and Tax Revenue Linkage Figure 2 exhibits that there are established patterns of tax collection by region and that such patterns have not changed much over the past decade. Countries in the same geographical region are likely to share certain commonalities in their tax structures due to their similar economic and social factors as well as their imitation in the choice of tax regimes. In some cases, this similarity also reflects tax coordination policies and trade integration. However, that does not mean that the compliance with the statutory tax provisions is enforced in the same way in every country and therefore the actual tax collection may vary considerably within a region. In addition, diversity within the same regional group appears quite striking as countries endow different natural resources and might not necessarily follow the same process of development and world integration.4 Figure 2: Central Tax Revenue as Percentage of GDP by Region (1994-2003)*
0
5
10
15
20
25
30
AFR EAP ECA LAC MNA SAR
% GDP
199419982003
Source: IMF GFS; WDI. * Note: The region classification follows the World Bank approach: Sub-Saharan Africa (AFR), East Asia and Pacific (EAP), Eastern Europe and Central Asia (ECA), Latin America and Caribbean (LAC), Middle East and North Africa (MNA), and South Asia region (SAR). The regional pattern of tax collection (Figure 2) shows that the ECA region tax share has outperformed other regions.5 However, the share declined from the peak of 27 percent of GDP in 1994 to 25 percent in 2003 reflecting the “transition” economy era when central governments reorganized and, some, devolved fiscal roles. Collection effort in AFR was similar to the one in LAC in 1998 and higher than in any other regions, except for ECA. The overall tax collection in AFR has increased over the years (from 20 percent in 1994 to 23 percent in 2003). EAP, a high growth region, has relatively lower tax intake compared with
4 For example, some African countries, such as South Africa, Botswana, and Lesotho, have reached tax revenue ratios similar to those in middle/high income countries, while others like Congo or Guinea Bissau have maintained the lowest ratios in the world. 5 It is interesting to make some comparison of tax collection between regions and countries in the OECD. Since the late 1990s, the OECD on average consistently collects more taxes as a share of GDP than any regional averages. The collection has been consistently high with the average of 32 percent in 1998 and 2003. A close look at the high income OECD countries reveals that the highest tax intake can be found in the so-called welfare states such as Finland, Sweden, and Norway with the tax-GDP ratios respectively reaching 35, 34, and 37 percent in 2003.

- 5 -
any other region, and SAR exhibits the lowest ratios. Overall, the tax collection as percentage of GDP has somehow improved in AFR and LAC countries, stayed relatively flat in EAP and MNA, and decreased in SAR.6 The review of the tax-GDP ratios indicates that the tax collections tend to be linked positively to a country’s level of income. In addition, there are clearly established regional patterns of the aggregate tax collection, despite significant intra-regional variation in collection due to multiple institutional and different fiscal architectures. Part III explores in details the determinants of taxable capacity and the empirical approach to measure it.
III. Expanding Taxable Capacity and Reaching Revenue Potential: Empirical Evidence and Policy Implications
The Concepts of Taxable Capacity and Tax Effort The actual tax to GDP (or GNP) collection ratio is usually interpreted as a measure of tax effort and used as the basis for cross country tax comparison. The use of such ratio is reasonable if one attempts to establish trends or to compare tax revenue performance across countries with similar economic structure and at the same level of income (Musgrave 1987).7 The advantage of using this approach is that it is simple and provides a quick overview of the trends of the worldwide tax collections (Section II). However, when used to compare the effectiveness in revenue mobilization across countries in different income groups, the tax-GDP ratio could provide a “completely distorted” picture due to different economic structures, institutional arrangements, and demographic trends (Prest 1979). In essence, this ratio does not reflect the tax capacity of a country and hence it is impossible to assess whether or not a country is out of line in comparison with its peers in its effort to raise domestic tax revenues. A number of tax economists have attempted to deal with this problem by applying an empirical approach to estimate the determinants of tax collection and identify the impact of such variables on each country’s taxable capacity.8 Taxable capacity is the predicted tax-GDP ratio estimated from a regression, taking into account the country’s specific characteristics. Tax effort is the index of the ratio between the share of the actual collection to GDP and the predicted taxable capacity. A tax effort of above 1 (high tax effort) implies that the country utilizes well its tax base to increase revenues (Stotsky, et al. 1997). On the other hand, a country with the tax effort below 1 (low tax effort) is likely to have relatively substantial scope or potential to raise revenues.
6 One should interpret the data with great caution. The tax collection in SAR may be much more decentralized than in any other region, and the available data are largely for the central government revenues. 7 In the early 1970s, international tax advisors used the ratio of 18 percent, postulated by W.A. Lewis, as an arbitrary benchmark for a desirable minimum level of tax collection (Musgrave and Musgrave, 1974). 8 See, for example Lotz and Mross, 1967; Bahl, 1971; Chelliah et al. 1975; Tait et al., 1979, Tanzi, 1987; Stotsky and WoldeMariam, 1997; Bird et al., 2004.

- 6 -
The concepts of taxable capacity and tax effort can be extended to measure (fiscal) revenue capacity and (fiscal) revenue effort. Total fiscal revenue, by definition, consists of both tax and non-tax collection; it represents cash receipts from taxes, social contributions, and non-tax sources such as fines, fees, rent, and income from property or sales. One should be cautious about the methodology used to estimate and interpret the tax effort index. The calculation of the index is sensitive to the predicted results of a country’s taxable capacity. There exist certain caveats typical in empirical work such as systematic errors in measurement of independent variables. Other caveats, including the quality of the GDP measurement, are inherent in both tax effort indexes and tax-GDP ratios. More importantly, the measurement of the taxable capacity is based on, a priori, set of explanatory variables that determine the potential capacity of a country to tax, but it does not reflect either the demand for higher public expenditures or the political willingness to tax (Bird 1978;Toye 1978). In addition, as the taxable capacity is estimated from a regression specification, inherently the tax effort index reflects the tax collection performance of a country in comparison with the average effort exercised by an average country in the selected sample. However, the “average” performance may not be directly relevant to the actual performance of a particular country; thus one may need to simply interpret the tax effort index as an indication for assessing the feasibility of raising additional revenues, given the tax mix policy and collection effort attained at the average level (Ahmad, et al. 1986). Due to multiple potential issues related to the methodology used to estimate and interpret tax effort indexes, Chelliah et al. (1975) emphasize that “the tax effort indexes are not intended to be applied in a mechanistic fashion but rather to be considered useful additional information in judging the scope for more taxes.” (P.195.) Tax effort cannot substitute for a comprehensive study of taxation in direct relation with the need for and composition of public expenditures of a particular country. This section provides an overall assessment of worldwide tax performance, using the concept of tax effort with due attention to its potential caveats. We conduct an empirical analysis to estimate a country’s taxable capacity and tax effort over the period of 1994-2003 and the two sub-periods of 1994-99 and 2000-03.
Empirical Analysis of Taxable Capacity and Tax Effort
The Model and Data In this study, we extend the empirical methodology applied by Tanzi and Davoodi (1997), and Bird, Vazquez, and Torgler (2004) to cover a large sample of 104 countries for the ten year period 1993-2004. To analyze the dynamics of taxable capacity and tax effort across countries between the 1990s and early 2000s, we also look at the two sub-periods: 1993-1999, and 2000-2004. Following Bird et al. (2004), we apply the empirical approach to both tax and total fiscal revenue efforts to test the robustness. The basic specification is: ),,,,,( ititititititit BUREAUCORRAGRTRADEPOPGDPfY = Where,
tiY : Tax (including social contributions) or total fiscal revenue ratio to GDP.
- 7 -
itGDP : GDP per capita (constant 2000 $US).
itPOP : Rate of population growth or age dependency ratio as a share of the total population.
itTRADE : Trade openness (measured as ratio of exports plus imports of goods and services to GDP).
itAGR : Agricultural value added.
itCORR : Corruption index.
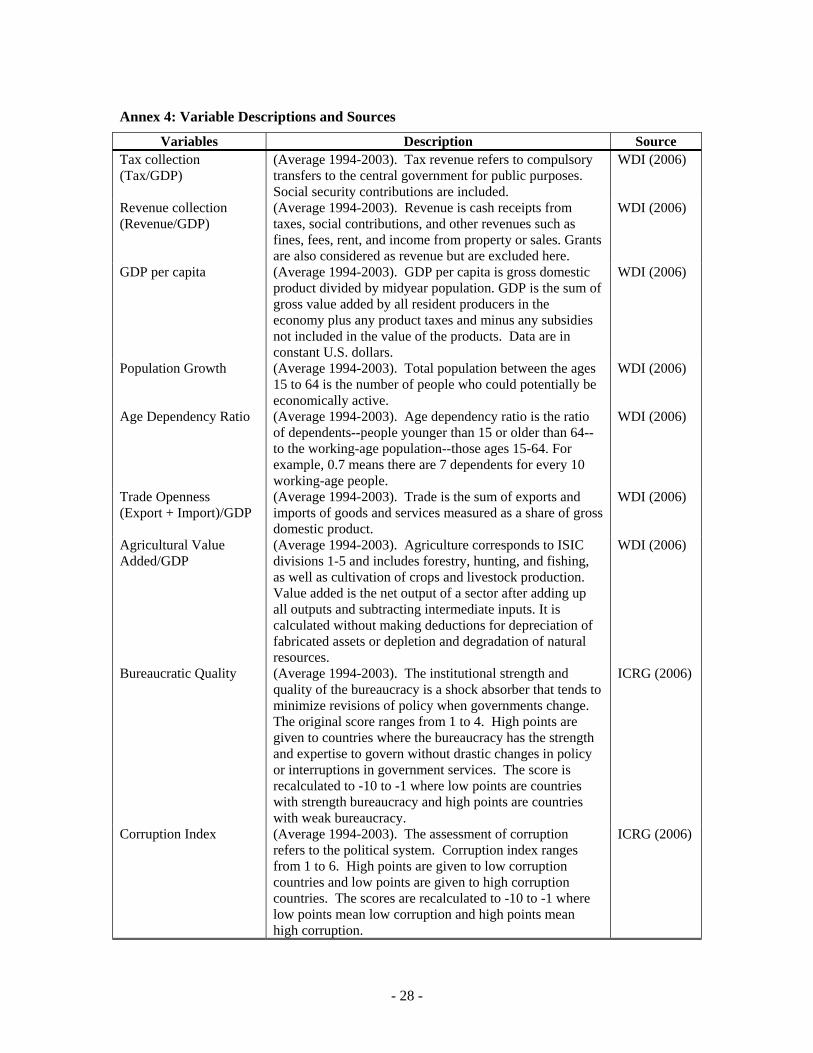
itBUREAU : Bureaucracy quality. The underlying hypothesis of the specification is that the tax or fiscal revenue capacity of a country is determined not only by economic factors but also by key demographic and institutional characteristics. In particular, high corruption, high population growth rates, and high age dependency ratios tend to depress the taxable capacity of a country, other things being equal. There are two major sets of the independent variables tested. The first part consists of traditional supply side factors, including GDP per capita, population growth rate, international trade, and agricultural value added as a fraction of GDP. The data are mainly obtained from the World Bank’s WDI (World Bank 2006). The second part includes the proxies for the institutional setting of a country. To test the robustness of the institutional impact on a country’s taxable income, two alternatives are used: the corruption index and the bureaucratic quality scores. The indexes are obtained from the Institutional Country Risk Guide (ICRG). Annex 2 presents descriptions and data sources for each variable used in the model.
GDP per capita. GDP per capita is included in the regression as a proxy for the level
of development of a country. In our analysis, GDP per capita is measured in constant 2000 USD. As a higher level of income typically correlates with a greater demand for public goods and services, and higher income increases the overall ability to pay in a society, one should expect higher tax payment and collection (Bahl 1971;Fox, et al. 2005). By analyzing the recent worldwide trend and pattern of revenue collection, we also demonstrate that richer countries tend to collect more revenues, and similarly, countries tend to collect more revenues as they become more affluent (Section II). One would expect the sign of the coefficient on GDP per capita in the regression to be positive
Population growth rate and age dependency ratio. To test the impact of
demographic characteristics on a country’s taxable income, we use two alternatives, specifically population growth rate and age dependency ratio. Bird et al. (2004) suggest that as the rate of population growth increases, the tax system may lag behind in its ability to capture new taxpayers. This problem is more pronounced when a country has weak tax administration capacity. Thus, the population growth rate is expected to be negatively related to the tax capacity. An alternative approach to measure the impact of the demographic feature on the taxable capacity is to use the age dependency ratio indicator. Consistent to the World Bank WDI definition, this indicator is the ratio of the dependents – people younger than 15 or older than 64—to the working age population—those in the productive age

- 8 -
between 15 and 64. It is expected that the higher the age dependency ratio, the lower the productive population and hence the narrower the tax base. Thus, we would predict that demographic characteristics, both population growth and age dependency ratio, are negatively correlated to the tax and fiscal revenue collections.
Trade openness. Trade openness is an aggregated level of export and import
calculated as a fraction of GDP. Traditionally, trade taxes have been one of the key sources of revenue in the developing world. The sector is more formalized and it is relatively easy to tax. However, globalization and international competition have gradually led countries to reduce their reliance on trade taxes. The governments, especially those in middle- and high-income countries, are obligated to reduce tariffs at their borders over time. A growing concern in developing countries is how to strengthen domestic revenue system to compensate for the expected losses in trade taxes. However collections from the borders remain high, especially in low-income countries in Africa. We expect to observe a positive relationship between trade openness and taxable capacity, but the strength of this correlation should be gradually decreased (Rodrik 1998).
Agricultural value added. Agricultural value added is measured as a fraction of GDP. Value added is the net output of the agricultural sector after adding up all outputs and subtracting intermediate inputs. Agriculture is one typical hard-to-tax sector; most developing countries exempt from taxes a large share of agricultural activities due to its inherent difficulty to collect the tax or due to equity and political reasons. Thus a higher level of agricultural value added is expected to correlate with a lower level of taxable capacity. In addition, countries with a relatively larger share of agriculture in the economy generally have lower demand for public goods and services since most high-value public services are city-based (Tanzi 1992).
Corruption index and bureaucratic quality. The International Country Risk Guide
(ICRG) provides alternatives for gauging the quality of the institutional setting of a country, particularly the corruption index and bureaucratic quality. The ICRG staff collects political information and financial and economic data, converting these into points for each individual component on the basis of a consistent pattern of evaluation. The political risk assessments are made on the basis of subjective analysis of the available information and the assessments are conducted on an annual basis.9 The corruption index measures the extent of corruption by assigning a numerical value to a country. The index ranges from 1 to 6, where a higher number means lower corruption.
The bureaucracy quality index is an alternative institutional indicator of governance.
The index assesses political stability of a country and ranges from 1 to 4. The higher scores are given to countries where the bureaucracy has the better strength and expertise to govern without having to resort to drastic and frequent changes in policy or to interruptions in government services (ICRG 2006). To make the comparison of the regression results based on the use of these two alternative indicators and to facilitate our presentation of the institutional impact on tax effort, we follow Tanzi and Davoodi (1997), by rescaling the original ICRG corruption index and bureaucracy quality indicator to a range of -6 (least corrupt or best bureaucratic quality) and -1 (most corrupt or worst bureaucratic quality). Our 9 http://www.prsgroup.com/ICRG_Methodology.aspx

- 9 -
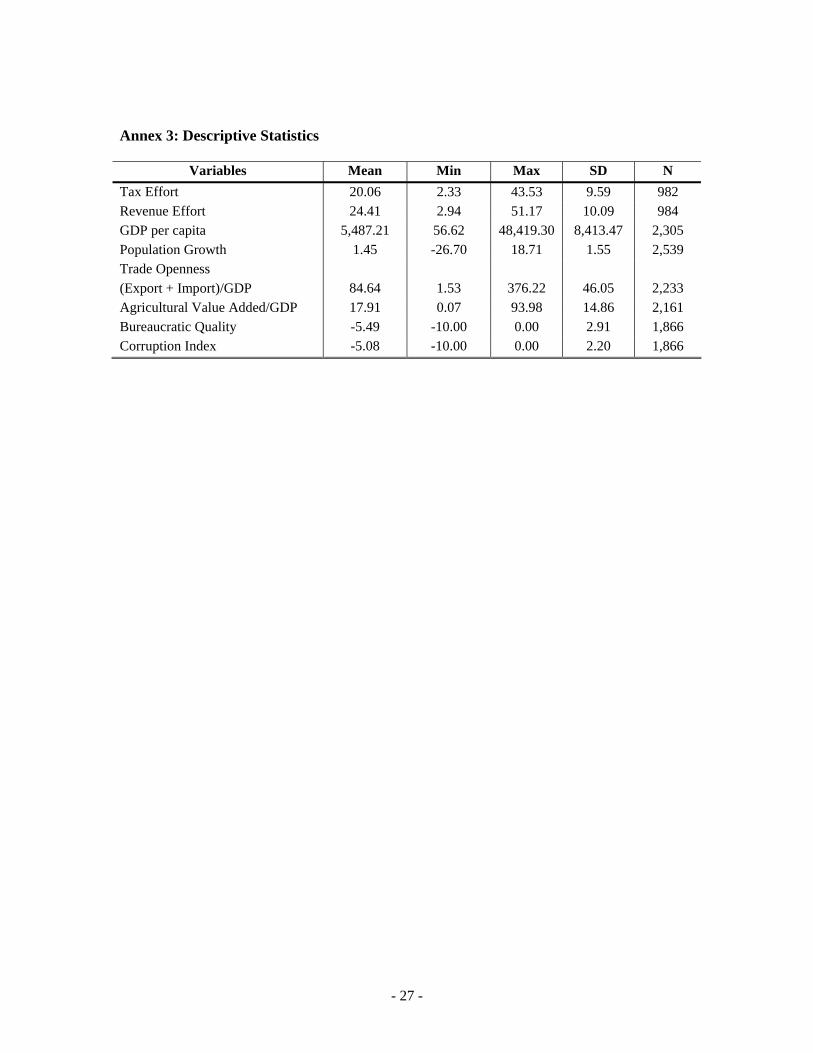
hypothesis is that lower bureaucratic quality is correlated with lower taxable capacity, other things being equal. To ensure consistency, all data on tax-GDP and fiscal revenue-GDP ratios are taken from the same sources, WDI 2006. It is worth noting that sub-national revenue data from either WDI or IMF Government Finance Statistics are largely missing, and due to the limitation of the statistics, the analysis covers only the tax and revenue collection at the central level. The data tend to under record the tax level in countries with significant collection at the sub-national levels, which Bird et al. (2004) has also cautioned about. After checking outliers, we have excluded Kuwait and United Arab Emirates from the sample as these oil abundant countries appear to rely mostly on royalties and fees from natural resources. Annex 2 presents the statistics for all variables. Annex 3 presents the period average of data by variable and country during 1994-2003. Annex 4 summarizes the statistical correlation across variables. It is observed that all the intended independent variables, GDP per capita, population growth rate, age dependency ratio, trade openness, agriculture value added, corruption index and bureaucratic quality indicator, have the predicted sign of correlation with either tax or revenue-GDP ratios. In addition, all the correlations are sizable, ranging from 0.35 to more than 0.6 in absolute terms (Annex 4). Several considerations regarding the model specification should be mentioned. First, there are a number of institutional variables that have high correlation. For example, bureaucratic quality highly correlates with political stability and rule of law—leading to constraints in using a larger number of the institutional variables without the risk of multi-colinearity. Second, some of the institutional variables may be endogenous. For example, a conventional conjecture is that higher institutional quality may lead to higher taxes and revenues, and on the other hand, better tax and revenue performance may result in higher institutional quality. Bird et al (2006) test the presence of endogeneity problem, applying 2-Stage Least Squares (2SLS) approach and Hausman Chi-square test. The instrumental variables include ethnic fractionalization, language, and latitude. The Hausman Chi-square tests fail to detect the presence of simultaneity of the tax/revenue effort and institutional variables.
Empirical Estimation of Tax and Total Fiscal Revenue Capacity The empirical results are presented in Tables 1 and 2 for taxable capacity and for fiscal revenue capacity, respectively.10 Each table has two panels: panel A presents results of the specifications using population growth as proxy for the demographic influence on taxable capacity, and panel B replaces population growth with age-dependency ratios. The regressions capture the entire period of 1994-2003 and the two sub-periods of 1994-1998 and 1999-2003 to test the dynamics of tax and fiscal revenue capacity. In each table, equation 1 (the first column of the estimated coefficients) represents the regression on traditional tax
10 As previously defined, taxable capacity refers to the predicted tax-GDP ratio on the basis of a regression accounting for a country’s specific tax handles and quality of institutional setting, and the similar concept of (fiscal) revenue capacity refers to the predicted revenue-GDP ratio.

- 10 -
handles. Equations 2 and 3 show results when institutional elements (corruption index and bureaucratic quality indicator) are respectively added on the right hand side.
In Table 1, coefficients on the entire set of independent variables generally have predicted signs and are statistically significant. The exception is the coefficients on GDP per capita in equations 1-3 (panel A) and equations 2-3 (panel B) for the period 1994-98, which are not statistically significant or have unpredicted sign (equation 3, panel A). Table 2, Panel A, shows similar results: the coefficients on GDP per capita are insignificant for equations 1-3 for the sub-period 1994-98 and unpredicted sign in equations 2-3. In Table 2, panel B, the coefficients on GDP per capita are, again, insignificant for the period 1994-98 but have predicted sign. It is worth noting that while the coefficients on population growth are statistically significant and have predicted signs in all equations, the coefficients on age dependency ratio are generally insignificant, except for equations 2 and 3 for the 1999-2003, and have an unpredicted sign for equation 1 (period 1994-2003) and equations 1-3 (sub-period 1994-98).
In general, the results support the previous studies on the determinants of taxable and revenue capacity and particularly the recent empirical work by Bird et al. (2007), and Tanzi and Davoodi (1997).11 A country with higher income level, lower population growth rate, more trade openness, lower agriculture share in GDP, and higher institutional quality is likely to have higher tax and revenue capacity. The empirical results fit well to the statistics of the sample as summarized in the cross variable correlation (Annex 4).
It is interesting to observe that in addition to the traditional tax collection determinants, corruption has highly statistically significant and sizable impact on both taxable and revenue capacity. Particularly, the results in equation 2 (Tables 1 and 2) indicate that, (controlling for the level of income, demographic characteristics, trade openness, and agriculture) an increase in corruption by one-standard deviation (2.2) reduce the mean tax and revenue collection as a share of GDP by approximately 1.4 and 1.2 percentage points, or by 6.7 and 4.9 percent, respectively.
11 For an excellent review of the empirical results of other major studies on taxable capacity, see Bird et al. (2007).

- 11 -
Table 1: Determinants of Taxable Capacity Panel A (population growth used as proxy for demographic characteristic)
Tax/GDP 1994-2003 1994-1998 1999-2003 (Eq. 1) (Eq. 2) (Eq. 3) (Eq. 1) (Eq. 2) (Eq. 3) (Eq. 1) (Eq. 2) (Eq. 3) GDP per capita¹ 2.273 2.171 2.051 0.094 0.146 -0.233 3.493 2.730 2.647 (8.06)** (5.46)** (5.15)** (1.26) (0.16) (0.25) (8.08)** (4.79)** (5.00)** Population Growth -2.157 -2.662 -2.560 -2.525 -2.647 -2.753 -2.37 -2.903 -2.767 (8.60)** (10.64)** (10.63)** (7.28)** (5.50)** (5.75)** (6.40)** (7.29)** (7.50)** Trade Openness 0.059 0.046 0.046 0.062 0.040 0.038 0.048 0.039 0.040 (9.11)** (7.78)** (7.70)** (5.23)** (3.74)** (3.64)** (5.43)** (4.63)** (4.58)** Agriculture Value Added -0.185 -0.129 -0.118 -0.196 -0.155 -0.154 -0.212 -0.141 -0.120 (9.18)** (5.79)** (5.28)** (6.75)** (4.30)** (4.34)** (6.42)** (3.93)** (3.37)** Corruption -0.612 -0.693 -0.694 (4.04)** (2.61)** (2.81)** Bureaucracy -0.560 -0.638 -0.666 (4.59)** (2.87)** (3.60)** Constant 19.559 17.321 17.093 21.053 18.185 19.015 20.341 17.913 16.976 (22.65)** (15.84)** (15.71)** (12.96)** (7.72)** (9.25)** (16.82)** (11.38)** (10.58)** Observations 884 724 724 329 252 252 380 333 333 R-squared 0.49 0.52 0.52 0.42 0.39 0.40 0.56 0.58 0.58
Panel B (Age dependency ratio used as proxy for demographic characteristic)
Tax/GDP 1994-2003 1994-1998 1999-2003 (Eq. 1) (Eq. 2) (Eq. 3) (Eq. 1) (Eq. 2) (Eq. 3) (Eq. 1) (Eq. 2) (Eq. 3) GDP per capita¹ 3.037 2.731 2.614 1.621 1.343 1.402 3.535 2.680 2.620 (8.39)** (6.46)** (6.14)** (1.97)* (1.37) (1.50) (7.57)** (4.40)** (4.33)** Age Dependency Ratio -5.337 -8.593 -7.315 -6.859 -6.114 -5.815 -6.301 -12.680 -10.175 (2.75)** (4.34)** (3.80)** (2.11)* (1.84) (1.71) (2.05)* (3.84)** (3.24)** Trade Openness 0.058 0.044 0.045 0.059 0.028 0.028 0.049 0.042 0.044 (7.80)** (6.21)** (6.22)** (4.17)** (2.30)* (2.23)* (4.84)** (4.15)** (4.12)** Agriculture Value Added -0.184 -0.134 -0.133 -0.163 -0.127 -0.134 -0.236 -0.142 -0.139 (7.60)** (4.90)** (4.91)** (4.85)** (3.16)** (3.20)** (5.79)** (3.19)** (3.23)** Corruption -0.451 -0.647 -0.693 (2.76)** (2.18)* (2.64)** Bureaucracy -0.445 -0.429 -0.661 (3.37)** (1.93) (2.95)** Constant 20.055 19.967 18.963 21.310 18.109 19.341 21.808 22.291 20.158 (13.15)** (12.84)** (11.35)** (7.24)** (5.51)** (6.13)** (10.14)** (9.22)** (7.49)** Observations 868 724 724 323 252 252 374 333 333 R-squared 0.41 0.44 0.44 0.30 0.29 0.28 0.50 0.52 0.52
Robust t statistics in parentheses ¹GDP per capita*10,000 Note: The dependent variable is Taxable capacity. Estimation technique is OLS.

- 12 -
Table 2: Determinants of Fiscal Revenue Capacity Panel A (population growth used as proxy for demographic characteristic)
Revenue/GDP 1994-2003 1994-1998 1999-2003 (Eq. 1) (Eq. 2) (Eq. 3) (Eq. 1) (Eq. 2) (Eq. 3) (Eq. 1) (Eq. 2) (Eq. 3) GDP per capita¹ 2.157 1.555 1.624 0.359 -0.510 -0.984 2.966 2.251 2.666 (5.39)** (3.36)** (3.48)** (0.45) (0.55) (1.01) (6.00)** (3.47)** (4.33)** Population Growth -1.246 -1.605 -1.504 -1.508 -1.590 -1.691 -1.635 -2.133 -2.054 (5.64)** (6.65)** (6.36)** (4.41)** (3.16)** (3.28)** (4.41)** (5.60)** (5.60)** Trade Openness 0.070 0.057 0.057 0.077 0.051 0.050 0.054 0.046 0.047 (10.02)** (9.26)** (9.08)** (5.83)** (4.52)** (4.41)** (5.69)** (5.12)** (4.96)** Agriculture Value Added -0.285 -0.268 -0.264 -0.289 -0.298 -0.294 -0.309 -0.264 -0.266 (13.18)** (11.97)** (11.37)** (8.72)** (7.33)** (7.28)** (9.51)** (8.26)** (8.12)** Corruption -0.545 -0.545 -0.603 (3.29)** (1.90) (2.25)* Bureaucracy -0.392 -0.587 -0.260 (3.27)** (2.79)** (1.41) Constant 23.278 21.704 22.079 24.332 23.236 23.501 24.337 22.434 23.449 (24.92)** (18.93)** (20.50)** (13.82)** (9.06)** (11.27)** (19.05)** (13.62)** (15.30)** Observations 886 725 725 330 252 252 381 334 334 R-squared 0.47 0.50 0.50 0.41 0.39 0.39 0.54 0.57 0.57
Panel B (Age dependency ratio used as proxy for demographic characteristic)
Revenue/GDP 1994-2003 1994-1998 1999-2003 (Eq. 1) (Eq. 2) (Eq. 3) (Eq. 1) (Eq. 2) (Eq. 3) (Eq. 1) (Eq. 2) (Eq. 3) GDP per capita¹ 2.488 2.094 1.970 1.098 0.559 0.233 2.984 2.286 2.523 (6.14)** (4.37)** (4.17)** (1.31) (0.57) (0.25) (5.92)** (3.37)** (3.82)** Age Dependency Ratio 1.488 -1.200 -0.224 0.830 0.407 0.725 -2.061 -7.569 -6.309 (0.75) (0.57) (0.11) (0.24) (0.11) (0.19) (0.77) (2.70)** (2.25)* Trade Openness 0.066 0.055 0.055 0.071 0.042 0.041 0.051 0.047 0.048 (9.01)** (8.13)** (8.11)** (5.13)** (3.66)** (3.54)** (5.09)** (4.70)** (4.62)** Agriculture Value Added -0.315 -0.310 -0.308 -0.290 -0.309 -0.307 -0.345 -0.289 -0.294 (12.68)** (10.36)** (10.39)** (7.92)** (6.22)** (6.08)** (10.25)** (7.65)** (7.84)** Corruption -0.336 -0.454 -0.490 (1.95) (1.50) (1.79) Bureaucracy -0.357 -0.494 -0.283 (2.95)** (2.56)* (1.35) Constant 21.214 21.874 20.963 21.525 21.217 21.062 24.658 25.693 25.489 (13.72)** (14.94)** (13.52)** (7.13)** (6.71)** (6.93)** (12.23)** (11.94)** (10.58)** Observations 871 726 726 324 252 252 375 334 334 R-squared 0.44 0.48 0.48 0.36 0.36 0.36 0.52 0.54 0.54
Robust t statistics in parentheses ¹GDP per capita*10,000 Note: The dependent variable is Taxable capacity. Estimation technique is OLS.
- 13 -
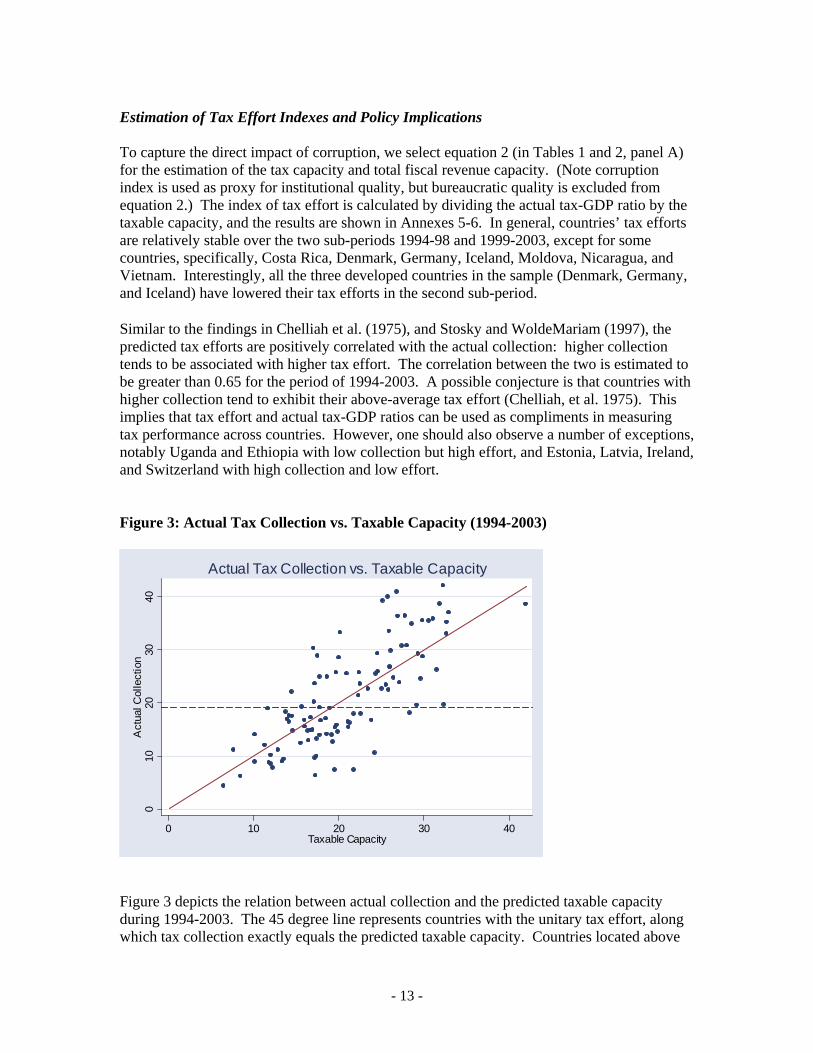
Estimation of Tax Effort Indexes and Policy Implications To capture the direct impact of corruption, we select equation 2 (in Tables 1 and 2, panel A) for the estimation of the tax capacity and total fiscal revenue capacity. (Note corruption index is used as proxy for institutional quality, but bureaucratic quality is excluded from equation 2.) The index of tax effort is calculated by dividing the actual tax-GDP ratio by the taxable capacity, and the results are shown in Annexes 5-6. In general, countries’ tax efforts are relatively stable over the two sub-periods 1994-98 and 1999-2003, except for some countries, specifically, Costa Rica, Denmark, Germany, Iceland, Moldova, Nicaragua, and Vietnam. Interestingly, all the three developed countries in the sample (Denmark, Germany, and Iceland) have lowered their tax efforts in the second sub-period. Similar to the findings in Chelliah et al. (1975), and Stosky and WoldeMariam (1997), the predicted tax efforts are positively correlated with the actual collection: higher collection tends to be associated with higher tax effort. The correlation between the two is estimated to be greater than 0.65 for the period of 1994-2003. A possible conjecture is that countries with higher collection tend to exhibit their above-average tax effort (Chelliah, et al. 1975). This implies that tax effort and actual tax-GDP ratios can be used as compliments in measuring tax performance across countries. However, one should also observe a number of exceptions, notably Uganda and Ethiopia with low collection but high effort, and Estonia, Latvia, Ireland, and Switzerland with high collection and low effort. Figure 3: Actual Tax Collection vs. Taxable Capacity (1994-2003)
010
2030
40A
ctua
l Col
lect
ion
0 10 20 30 40Taxable Capacity
Actual Tax Collection vs. Taxable Capacity
Figure 3 depicts the relation between actual collection and the predicted taxable capacity during 1994-2003. The 45 degree line represents countries with the unitary tax effort, along which tax collection exactly equals the predicted taxable capacity. Countries located above

- 14 -
the line are those with tax efforts greater than 1 (high tax efforts), and below the line are those with tax efforts less than 1 (low tax efforts). Let’s use 1 as the benchmark for tax effort and 19 percent (the median of the tax-GDP ratios in the country sample) for actual tax collection. A country is regarded as a low-collection country if its actual collection is lower than the median of 19 percent, and regarded as a high-collection country if its collection is above the median threshold. The use of tax effort and actual tax collection benchmarks allows us to rank countries into four different groups: (i) low tax collection, low tax effort; (ii) high tax collection, high tax effort; (iii) low tax collection, high tax effort; and, (iv) high tax collection, low tax effort. Consistent to our observation that tax effort is positively correlated with actual collection, the majority of countries clusters in the first two groups (low tax collection and low tax effort; or high tax collection and high tax effort). Table 3 provides a list of the countries in the four different groups. We argue that while taxation is always a critical dimension of fiscal policy for all countries, countries at various stages of development and with different initial levels of tax collection and effort should rely on different strategies for tax reforms. Our analysis focuses on tax performance and broad directions for reforms in developing countries. A caution should be emphasized again in interpreting our broad country classification by tax effort and tax collection and subsequent comments. They serve as complimentary but not substituting for detailed analysis of a country’s specific fiscal policies and its path on taxation reforms. As previously highlighted, there are unavoidable potential caveats in empirical work and in estimation of a country’s taxable capacity. The later is essentially based on comparison with the sample’s average performer, which may not necessarily be relevant to the specific country under consideration. Different countries may have different sets of fiscal preferences regarding relative size of government and pressing needs to rely on taxation to finance public expenditures.

- 15 -
Table 3: List of Countries according to Tax Efforts and Tax Collections Level TAX EFFORT LOW HIGH
LOW
Developing Countries Developed Countries Albania Dominican Nicaragua Korea, Rep Argentina Ecuador Oman United States Armenia El Salvador Panama Azerbaijan Guatemala Paraguay Bahrain India Peru Bangladesh Indonesia Philippines Botswana Iran Sierra Leone Cameroon Kazakhstan Sri Lanka Chile Lebanon Sudan China Madagascar Thailand Colombia Malaysia Venezuela Congo, DR Mexico Yemen Congo, Rep
Developing Countries Developed Countries Bolivia Cote D'Ivoire Ethiopia Ghana Kenya Pakistan Senegal Syria Turkey Uganda Vietnam Zambia
TAX COLLECTION
HIGH
Developing Countries Developed Countries Estonia Australia Latvia Canada Lithuania Germany Moldova Ireland Romania Luxembourg Trinidad &Tobago Switzerland Ukraine
Developing Countries Developed Countries Algeria Namibia Austria Norway Belarus PNG Belgium Portugal Brazil Poland Cyprus Slovenia Bulgaria Russian Fed Denmark Spain Croatia Slovak Rep Finland Sweden Czech Rep South Africa France UK Egypt Tunisia Greece Hungary Uruguay Italy Jamaica Yugoslavia Morocco Jordan Zimbabwe Netherlands Mongolia New Zealand

- 16 -
Group 1: Low Collection and Low Effort Countries listed in this group share some critical similarities. Except for the two high-income countries (Korea and the United States), all others are from the developing world, of which three fourths are ranked in low-income or lower-middle-income countries (as defined by the World Bank). Some of the countries (for example, Cameroon and Madagascar) are heavily aid dependent. The majority of the developing countries in this group have numerous problems in both tax policy and tax administration. Some countries (e.g., Cameroon, Madagascar, the Philippines, and India) have their tax policies riddled with overly complex structures and multiple—largely ad-hoc—incentives that narrow the already limited tax base, create more loopholes for tax avoidance and evasion, intensify the public perception of unfairness of taxes, and generate opportunity for corruption. In response to the challenge of increasing capital mobility and deepening globalization, some countries (e.g., India and Cameroon) choose to retain generous tax incentives to compensate for their relatively high statutory rates on corporate income. Such complex tax regimes combined with the existing weak revenue administration capacity have led to chronic low tax collection at high administrative and compliance costs. Given this existing tax system, an improvement in tax collection would require that these low and lower-middle-income countries undertake comprehensive reforms of both tax policy and tax administration. Revenue enhancement should be one of the key objectives for the reforms as long as it is compatible with efficiency and equity criteria. In tax policy, they particularly need to broaden the base, rationalize the rate structure and incentive schemes, and remove tax-induced economic distortions with focus on enhancing revenue productivity of major taxes, particularly the broad-based consumption VAT. Group 2: High Collection and High Effort Included in this group typically are middle and high-income countries. For these countries, there appears relatively little scope for further enhancing revenue collection without generating disproportionately high economic costs. It is worth noting that the initial condition of high collection and high tax effort in a number of developing countries does not necessarily mean their tax structures or administrations could be regarded as conforming to international best practices. In reality tax regimes in many countries remain highly complex and inefficient. For example, in Brazil, the complexity of the coexistence of both federal VAT (IPI) and state VAT (ICMS) is further aggravated by multiple rate structure (with 24 positive rates effective at the current stage), numerous exemptions and special VAT regimes, which have triggered pervasive inter-state competition. In all of these countries, widespread deductions, exemptions, and other incentives are also granted in major direct income taxes (PIT, CIT). Revenue enhancement should not be the key objective of tax reforms in these countries with already high level of collection and high tax effort. Instead, revenue neutrality or even lower overall tax burden in some countries with excessively high tax rates may be strategically sought. Reform activities should primarily aim to enhance the economic efficiency of

- 17 -
existing taxes, reduce tax-induced distortions and improve the business climate through further rationalizing the tax regimes, rebalancing the tax mix, and simplifying the administration procedures. Group 3: Low Collection and High Effort Listed in this group are only a small number of countries, the majority of which (approximately 80 percent) are still at their early stage of development.12 In the low-income countries, administration capacity is notably low and the tax regime is highly unstable. They have low collections, whereas high tax efforts are usually achieved by either enforcing easy taxes (particular trade taxes) or imposing high taxes on the formal sector, or both. Uganda is the case in point. The country’s tax system represents a combination of multiple contrasts: relatively high tax effort, low collection, and taxation being considered as a significant impediment to investment and formality (Chen, et al. 2001). Revenue collection has stagnated at about 12 percent since the early 2000s. The recent tax policy reform strategies have been largely inconsistent: an increase of statutory rates in some major taxes was blended with introduction of new exemptions and zero rates in the VAT. In addition, Uganda, being a land-locked country, still relies heavily on distorting trade taxes; and a high tax burden is being imposed on a limited number of taxpayers, and medium sized firms which already bear disproportionately high share of taxes (Gauthier, et al. 2006). Short-term tax reform measures should aim at streamlining tax policy and tax administration procedures to reduce compliance costs and encourage formality, and to lower tax barriers to firms’ entry and operations. Medium to long term reform priorities are to expand the scope for raising revenue by broadening the effective tax base and enhancing the functioning of the tax administration. Group 4: High Collection, Low Effort Of the total 13 countries listed in this group, about 77 percent are from the rank of upper-middle-income and above. Six are developed countries, and four—upper-middle-income countries. Of the ECA countries, Estonia, Latvia, and Lithuania are part of the EU-8, and Romania just joined the EU from the beginning of 2007. Ukraine with a robust increase in revenue collection in 2005 to 35 percent has apparently shifted to the group of countries with high collection, high effort (group 2). These countries demonstrate that they have high revenue potential and that their existing high level of tax collection but low effort may reflect their choice of the level of taxation. A close look at the experience of the ECA countries in this group reveals that with the already high level of collection, they need to consider restructuring their tax mix, particularly reducing the excessive burden on production factors and shifting toward taxation of broad-based consumption sources. These countries typically impose high factor income taxes, specifically taxes on labor. The tax wedge on labor, defined as the ratio of the total taxes
12 The tax-GDP ratio was about 20 percent in Kenya in 2005, while it was approximately 24 percent in Turkey in 2006. With the recent surge in tax collection in these two countries, both Kenya and Turkey appear to have shifted to the group of countries with high collection and high effort (group 2). .

- 18 -
(income taxes and social security contributions) over wages plus employer’s social security contributions, in EU-8 and Romania is on average greater than 45 percent, which is probably highest in the world (for comparison, the average rate in OECD countries is around 40 percent) (Rutkowski, et al. 2005).
IV. Conclusion Finding a composite index for measuring and benchmarking performance in taxation is both theoretically and practically challenging. The use of a tax effort index which relates the actual tax collection of a country to its estimated taxable capacity is tempting because it takes into account the country’s specific fiscal, demographic, and institutional characteristics as compared to its peers and hence provides a fuller picture of the country’s tax performance in comparative terms. However due to certain potential caveats in the modeling of taxable capacity and in the measurement of the actual tax-GDP ratio itself, the results need to be interpreted with care and be complimentary to but not substituting detailed analysis of a country’s tax system. Such analysis should cover the contexts of the country’s overall fiscal policy, and particularly the demand for and composition of public expenditures at a particular stage of development. The paper lends support to the suggestions in the available literature that developing countries have limitations to expand the scope for taxation, efficiently and equitably, which is in turn dependent on the underlying taxable capacity and the country’s initial level of tax collection. While taxation is the best reliable alternative to finance public spending in the long run, developing countries generally experience a chronic gap between the level of revenues and the desirable level of public funds. The structural issues related to taxation indicate that all countries have to adopt a long term vision for taxation reforms, and specific strategies for reforms cannot be “one size fits all.” For example, countries with low level of actual collection and low tax effort may have ample scope for raising revenues to reach their potential without aggravating economic distortions within the medium term. In contrast, a few low-income countries, trapped in the situation of relatively low collection and high tax effort, have limited short-term scope to enhance revenue without inducing high collection (both compliance and administration) costs and creating negative incentives for the formal sector. Finally, in addition to structural factors, the politics of taxation is critically important in revenue reforms in all countries at vastly different levels of development. As Lora et al. (2006) emphasize, taxation is highly path-dependent due to resistance of the elites; and in addition, the wide-reaching effects of taxation as well as the common pool nature of tax revenues make it difficult to reach the cooperative solutions on establishing simple, efficient and equitable tax systems. It is politically, and hence practically challenging, to make fundamental changes to an established tax structure. Hence, the success of any tax revenue reform is highly dependent, inter alia, on the top political commitments. The discussion on revenue reforms must be country specific and reliant on comprehensive analysis of the country’s revenue potential, revenue performance, and political readiness to difficult reform measures.

- 19 -
References: Ahmad, Ehtisham and Nicholas Stern. 1986. "Taxation for Developing Countries." The Development Research Programme, London School of Economics.
Bahl, Roy. 1971. "A Regression Approach to Tax Effort and Tax Ratio Analysis." International Monetary Fund Staff Paper:18, pp. 570-612.
Bird, Richard M. 1978. "Assessing Tax Performance in Developing Countries: a Critical Review of the Literature," in Taxation and Economic Development: Twelve Critical Studies. J.F.J. Toye ed. London, UK: Totowa, N.J., pp. 33-61.
Bird, Richard M. 2007. "Tax Challenges Facing Developing Countries: A Perspective from Outside the Policy Arena."
Bird, Richard M. and Pierre-Pascal Gendron. 2007. The VAT in Developing and Transitional Countries: Cambridge University Press.
Bird, Richard M., Jorge Martinez-Vazquez, and Benno Torgler. 2004. "Societal Institutions and Tax Efforts in Developing Countries." Working Paper 04-06. Andrew young School of Policy Studies, Georgia State University: Georgia, Atlanta.
Chelliah, Raja J., Hessel J. Baas, and Margaret R. Kelly. 1975. "Tax Ratios and Tax Effort in Developing Countries." IMF Staff Papers.
Chen, Duanjie, John Matovu, and Ritva Reinikka. 2001. "A Quest for Revenue and Tax Incidence in Uganda." IMF Working Paper 01/04. International Monetary Fund: Washington, DC.
Fox, William F. and Tami Gurley. 2005. "An Exploration of Tax Patterns around the World." Tax Notes International: Special Reports, 37:9, pp. 793-807.
Gauthier, Bernard and Ritva Reinikka. 2006. "Shifting Tax Burdens through Exemptions and Evasion: an Empirical Investigation of Uganda." Journal of African Economies.
ICRG. 2006. "International Country Risk Guide Index." The PRS Group: New York.
Lora, Eduardo and Mauricio Olivera. 2006. "The Political Determinants of Taxation (preliminary version)." LACEA-PEC.
Lotz, Jorgen R. and Elliott R. Morss. 1967. "Measuring "Tax Effort" in Developing Countries (Evaluation de l'effort fiscal dans les pays en voie de developpement) (Medicion del "esfuerzo tributario" de los paises en desarrollo)." Staff Papers - International Monetary Fund, 14:3, pp. 478-99.

- 20 -
Musgrave, Richard. 1987. "Tax Reform in Developing Countries. Chapter 9.," in The Theory of Taxation for Developing Countries. David Newbery and Nicholas Stern eds. Washington, DC: The World Bank Group.
Prest, A. R. 1979. "The Taxable Capacity of a Country." Taxation and Economic Development. London School of Economics and Political Science: London, UK.
Rodrik, Dani. 1998. "Why Do More Open Economies Have Bigger Governments?" Journal of Political Economy, 106:5, pp. 997-1032.
Rutkowski, Jan J. and Stefano Scarpetta. 2005. "Enhancing Job Opportunities." The World Bank Group: Washington, DC.
Stotsky, Janet G. and Asegedech WoldeMariam. 1997. "Tax Effort in Sub-Saharan Africa." IMF Working Paper. The International Monetary Fund: Washington, DC.
Tait, Alan A., Wildfrid Gratz, and Barry J. Eichengreen. 1979. "International Comparisons of Taxation for Selected Developing Countries." IMF Staff Papers, 26:1.
Tanzi, Veto. 1992. "Structural Factors and Tax Revenue in Developing Countries: A Decade of Evidence," in Open Economies: Structural Adjustment and Agriculture. I. Goldin and L. A. Winters eds. Cambridge: Cambridge University Press, pp. 267-81.
Tanzi, Vito and Hamid Davoodi. 1997. "Corruption, Public Investment, and Growth." IMF: Washington, DC.
Toye, J.F.J. 1978. Taxation and Economic Development: Twelve Critical Studies. London, UK.
United Nations. 2002. "Financing for Development." Monterrey Consensus.
United Nations. 2002. Report of the International Conference on Financing for Development. Monterrey, Mexico: The United Nations.
World Bank. 1997. World Development Report 1997: The State in Changing World. Washington, DC: The World Bank Group.
World Bank. 2005. "Global Monitoring Report 2005: Millennium Development Goals: From Consensus to Momentum." 280. World Bank: Washington, DC.
World Bank. 2006. World Development Index. Washington, DC: The World Bank Group.

- 21 -
Annex 1: Matrix of Correlation Coefficients, 1994-2003
itY (Tax/GDP) itY (Rev/GDP) itGDP itPOP
itAGE itTRADE itAGR
itCORR itBUREAU
itY (Tax/GDP) 1
itY (Rev/GDP) 0.9005 1
itGDP 0.5593 0.5212 1
itPOP -0.5198 -0.4113 -0.3427 1
itAGE -0.4848 -0.4430 -0.4805 0.7638 1
itTRADE 0.3497 0.4013 0.1765 -0.1148 -0.2416 1
itAGR -0.5373 -0.6051 -0.5586 0.3697 0.6398 -0.2935 1
itCORR -0.4292 -0.4209 -0.6278 0.1333 0.2679 -0.1337 0.4438 1
itBUREAU -0.5155 -0.4888 -0.7236 0.2628 0.4732 -0.1643 0.563 0.0617 1 Note: Number of observations 724. Number of countries 104.

- 22 -
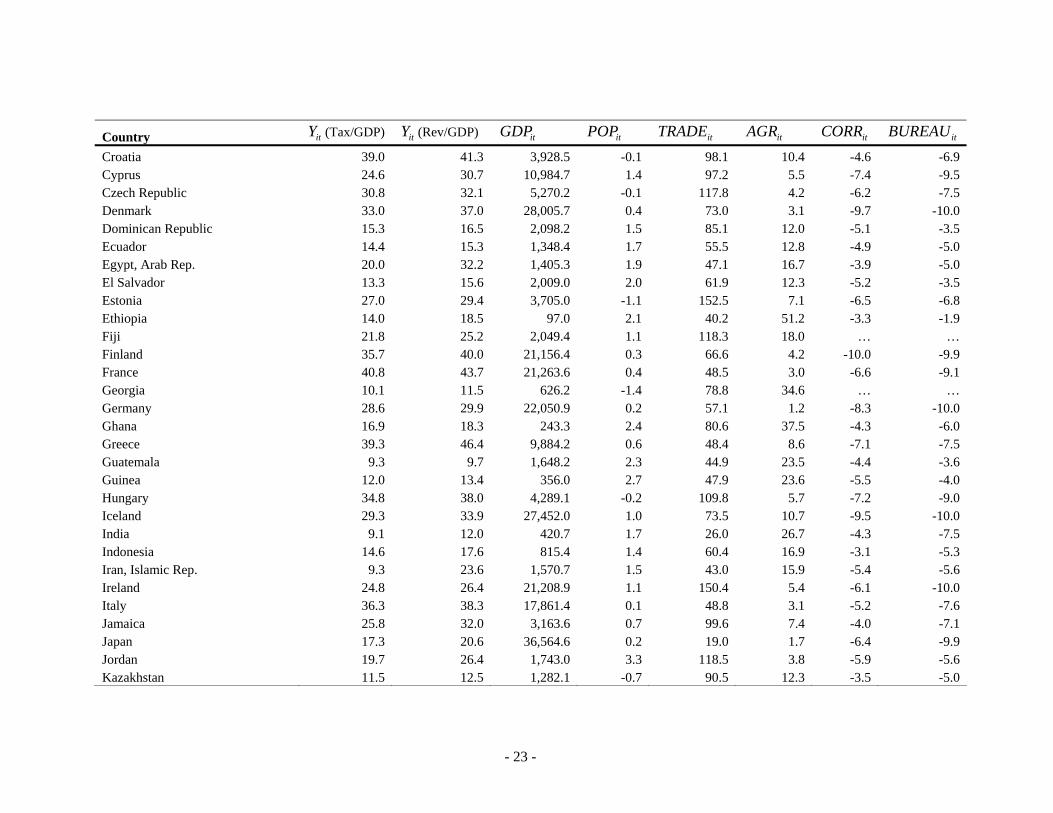
Annex 2 : Period Average of Data by Variable and Country, 1994-2003* Country itY (Tax/GDP) itY (Rev/GDP) itGDP itPOP itTRADE itAGR itCORR itBUREAU
Albania 14.6 18.6 1,067.2 -0.4 59.0 36.7 -4.4 -3.1 Algeria 30.3 32.6 1,734.4 1.7 54.9 10.8 -3.8 -4.0 Argentina 15.0 16.5 7,391.5 1.2 25.0 6.7 -4.5 -6.5 Armenia 17.3 18.9 597.3 -1.1 85.4 33.0 -2.9 -2.5 Australia 23.5 26.0 19,529.3 1.2 40.6 3.5 -8.2 -10.0 Austria 35.5 37.9 22,665.0 0.4 81.2 2.4 -7.8 -10.0 Azerbaijan 17.3 18.0 677.3 1.0 100.7 21.4 -3.3 -2.5 Bahrain 7.0 28.0 11,754.0 2.6 151.7 0.9 -5.0 -5.7 Bangladesh 7.9 10.0 334.9 2.1 30.3 25.1 -2.8 -3.8 Belarus 29.0 30.5 1,227.7 -0.3 129.2 14.9 -4.6 -2.5 Belgium 42.1 43.4 20,953.5 0.3 147.7 1.6 -6.7 -10.0 Belize 19.5 21.9 3,147.0 2.9 111.8 17.0 … … Bhutan 7.2 18.1 566.4 2.9 76.2 37.7 … … Bolivia 15.4 19.1 979.6 2.1 49.3 15.8 -4.3 -3.7 Bosnia And Herzegovina 36.9 42.0 1,002.1 -0.5 92.2 18.3 … … Botswana 20.6 44.8 2,810.7 1.4 89.1 3.6 -5.1 -5.0 Brazil 19.1 24.6 3,360.6 1.5 22.1 8.5 -5.0 -6.0 Bulgaria 27.1 34.3 1,574.9 -0.8 104.9 14.9 -5.6 -5.0 Burundi 15.6 17.5 113.5 1.8 30.9 51.1 … … Cambodia 8.4 10.5 265.3 2.4 89.5 41.8 … … Cameroon 9.8 13.7 585.1 2.2 48.3 40.4 -4.0 -4.5 Canada 19.3 20.9 21,558.5 1.0 74.5 2.7 -9.3 -10.0 Chile 17.7 21.5 4,636.8 1.4 59.9 6.3 -5.9 -6.7 China 5.8 6.2 852.2 0.9 45.5 16.9 -4.0 -5.3 Colombia 13.2 17.6 2,023.1 1.8 37.8 13.7 -4.2 -5.9 Congo, Dem. Rep. 4.1 4.9 104.4 2.7 42.6 52.7 -1.2 -1.0 Congo, Rep. 9.9 31.7 968.0 3.2 126.7 8.5 -5.1 -2.5 Costa Rica 18.9 20.9 3,830.2 2.3 87.1 11.3 -7.1 -5.1 Cote D'Ivoire 17.5 18.2 612.7 2.4 73.3 24.9 -4.8 -3.9
- 23 -
Country itY (Tax/GDP) itY (Rev/GDP) itGDP itPOP itTRADE itAGR itCORR itBUREAU
Croatia 39.0 41.3 3,928.5 -0.1 98.1 10.4 -4.6 -6.9 Cyprus 24.6 30.7 10,984.7 1.4 97.2 5.5 -7.4 -9.5 Czech Republic 30.8 32.1 5,270.2 -0.1 117.8 4.2 -6.2 -7.5 Denmark 33.0 37.0 28,005.7 0.4 73.0 3.1 -9.7 -10.0 Dominican Republic 15.3 16.5 2,098.2 1.5 85.1 12.0 -5.1 -3.5 Ecuador 14.4 15.3 1,348.4 1.7 55.5 12.8 -4.9 -5.0 Egypt, Arab Rep. 20.0 32.2 1,405.3 1.9 47.1 16.7 -3.9 -5.0 El Salvador 13.3 15.6 2,009.0 2.0 61.9 12.3 -5.2 -3.5 Estonia 27.0 29.4 3,705.0 -1.1 152.5 7.1 -6.5 -6.8 Ethiopia 14.0 18.5 97.0 2.1 40.2 51.2 -3.3 -1.9 Fiji 21.8 25.2 2,049.4 1.1 118.3 18.0 … … Finland 35.7 40.0 21,156.4 0.3 66.6 4.2 -10.0 -9.9 France 40.8 43.7 21,263.6 0.4 48.5 3.0 -6.6 -9.1 Georgia 10.1 11.5 626.2 -1.4 78.8 34.6 … … Germany 28.6 29.9 22,050.9 0.2 57.1 1.2 -8.3 -10.0 Ghana 16.9 18.3 243.3 2.4 80.6 37.5 -4.3 -6.0 Greece 39.3 46.4 9,884.2 0.6 48.4 8.6 -7.1 -7.5 Guatemala 9.3 9.7 1,648.2 2.3 44.9 23.5 -4.4 -3.6 Guinea 12.0 13.4 356.0 2.7 47.9 23.6 -5.5 -4.0 Hungary 34.8 38.0 4,289.1 -0.2 109.8 5.7 -7.2 -9.0 Iceland 29.3 33.9 27,452.0 1.0 73.5 10.7 -9.5 -10.0 India 9.1 12.0 420.7 1.7 26.0 26.7 -4.3 -7.5 Indonesia 14.6 17.6 815.4 1.4 60.4 16.9 -3.1 -5.3 Iran, Islamic Rep. 9.3 23.6 1,570.7 1.5 43.0 15.9 -5.4 -5.6 Ireland 24.8 26.4 21,208.9 1.1 150.4 5.4 -6.1 -10.0 Italy 36.3 38.3 17,861.4 0.1 48.8 3.1 -5.2 -7.6 Jamaica 25.8 32.0 3,163.6 0.7 99.6 7.4 -4.0 -7.1 Japan 17.3 20.6 36,564.6 0.2 19.0 1.7 -6.4 -9.9 Jordan 19.7 26.4 1,743.0 3.3 118.5 3.8 -5.9 -5.6 Kazakhstan 11.5 12.5 1,282.1 -0.7 90.5 12.3 -3.5 -5.0

- 24 -
Country itY (Tax/GDP) itY (Rev/GDP) itGDP itPOP itTRADE itAGR itCORR itBUREAU
Kenya 18.9 21.3 419.6 2.5 56.6 30.4 -4.1 -6.0 Korea, Rep. 16.3 19.2 10,102.7 0.8 67.2 5.4 -6.2 -8.0 Kyrgyz Republic 13.4 15.7 280.8 1.0 84.2 40.1 … … Latvia 23.7 27.0 3,047.8 -1.1 103.1 7.0 -4.1 -5.7 Lebanon 14.1 18.3 4,881.3 1.8 64.0 8.5 -2.8 -4.0 Lesotho 37.7 45.5 476.7 0.8 140.8 17.9 … … Lithuania 25.0 27.2 3,208.4 -0.6 107.9 9.9 -4.6 -5.7 Luxembourg 38.6 41.5 39,788.3 1.2 238.6 0.9 -8.9 -10.0 Madagascar 8.5 12.7 232.3 2.9 53.7 28.8 -6.6 -2.5 Malaysia 18.3 24.2 3,677.2 2.4 196.6 11.3 -5.5 -6.8 Malta 27.6 33.4 8,724.7 0.8 184.3 3.1 -6.2 -7.0 Mauritius 18.8 21.7 3,492.5 1.1 123.8 8.5 … … Mexico 12.9 14.7 5,496.1 1.6 54.7 5.1 -4.3 -6.5 Moldova 22.1 26.3 356.4 -0.3 113.4 29.9 -2.9 -4.5 Mongolia 28.5 37.9 372.3 1.2 129.1 32.5 -5.4 -5.0 Morocco 25.3 28.6 1,195.7 1.5 63.2 16.0 -4.9 -5.0 Namibia 29.1 32.2 1,800.3 2.5 103.5 11.0 -5.3 -6.5 Nepal 8.5 10.4 212.4 2.3 52.4 41.4 … … Netherlands 38.5 41.3 21,564.0 0.6 114.7 3.2 -9.5 -10.0 New Zealand 30.1 35.3 13,102.8 1.2 60.9 7.9 -9.1 -10.0 Nicaragua 16.7 18.6 742.4 2.2 68.4 23.7 -6.5 -2.5 Norway 37.4 48.2 34,830.9 0.6 71.7 2.5 -8.9 -9.8 Oman 7.2 26.9 8,080.1 2.2 87.8 2.4 -4.7 -6.0 Pakistan 12.0 15.8 521.1 2.4 34.1 25.4 -3.4 -5.0 Panama 16.0 24.2 3,733.2 2.0 159.7 7.6 -3.3 -4.2 Papua New Guinea 21.5 23.9 655.3 2.4 107.4 28.7 -3.9 -6.0 Paraguay 11.1 15.5 1,455.6 2.5 72.1 24.1 -3.0 -3.5 Peru 14.7 16.8 1,978.9 1.7 32.3 9.6 -4.8 -4.0 Philippines 14.8 16.6 965.6 2.0 93.5 17.9 -4.4 -5.7 Poland 29.3 33.0 3,890.7 0.0 56.0 4.8 -6.3 -7.6

- 25 -
Country itY (Tax/GDP) itY (Rev/GDP) itGDP itPOP itTRADE itAGR itCORR itBUREAU
Portugal 33.5 37.4 9,588.3 0.4 67.5 4.6 -7.5 -7.5 Romania 22.5 25.8 1,745.6 -0.5 66.0 17.3 -5.1 -2.5 Russian Federation 22.7 28.9 1,818.1 -0.3 62.4 6.6 -3.4 -3.5 Rwanda 9.2 10.6 234.8 2.0 34.4 42.0 … … Senegal 16.4 17.3 412.0 2.5 66.9 18.9 -4.8 -3.5 Seychelles 35.4 44.3 6,792.4 1.3 145.3 3.3 … … Sierra Leone 9.3 9.7 173.0 2.0 48.7 50.2 -3.5 -0.2 Slovak Republic 30.7 35.2 3,575.9 0.1 134.8 4.8 -5.9 -7.7 Slovenia 36.7 39.0 8,823.0 0.0 112.2 4.0 -5.8 -7.5 South Africa 25.3 26.8 3,030.0 1.8 49.1 3.8 -6.1 -6.7 Spain 25.9 28.6 13,444.8 0.7 50.1 4.9 -7.0 -8.3 Sri Lanka 16.2 18.3 783.8 0.9 79.7 21.6 -5.6 -5.0 St. Kitts And Nevis 24.6 31.5 6,915.5 0.9 120.9 4.6 … … St. Vincent and the Grenadines 23.8 28.6 2,781.4 0.6 117.6 11.7 … … Sudan 6.2 7.5 349.6 2.2 29.7 41.0 -2.2 -2.5 Swaziland 26.0 27.4 1,324.1 2.6 173.5 14.9 … … Sweden 35.2 39.6 25,078.9 0.3 74.8 2.3 -9.6 -10.0 Switzerland 19.5 22.2 32,926.5 0.6 74.4 1.9 -8.6 -10.0 Syria 17.3 22.9 1,100.2 2.6 67.5 26.5 -5.2 -3.5 Tajikistan 10.3 11.3 188.2 1.3 120.1 28.6 … … Thailand 16.5 19.5 2,012.2 1.1 103.8 9.7 -3.8 -6.4 Trinidad And Tobago 23.1 27.1 5,935.3 0.5 94.5 1.8 -4.6 -6.5 Tunisia 25.5 29.7 1,906.0 1.4 90.9 12.8 -4.5 -5.0 Turkey 15.7 19.3 2,822.5 1.7 50.7 15.3 -4.6 -6.0 Uganda 11.1 11.4 227.4 3.2 34.4 41.4 -3.9 -4.0 Ukraine 23.1 27.8 751.4 -0.7 92.2 15.6 -3.1 -2.5 United Kingdom 35.5 37.0 22,876.3 0.3 55.0 1.4 -8.0 -10.0 United States 17.7 18.3 32,420.3 1.1 23.4 1.5 -7.5 -10.0 Uruguay 25.6 28.1 5,890.9 0.7 41.7 7.9 -5.0 -4.3 Vanuatu 19.4 22.3 1,255.2 2.3 101.3 15.9 … …

- 26 -
Country itY (Tax/GDP) itY (Rev/GDP) itGDP itPOP itTRADE itAGR itCORR itBUREAU
Venezuela 14.0 20.3 4,886.1 2.0 50.1 4.9 -4.3 -3.5 Vietnam 17.3 21.2 365.8 1.5 98.9 26.0 -3.7 -4.5 Yemen, Rep. 10.0 22.8 502.2 3.6 81.2 17.7 -4.4 -3.5 Yugoslavia 33.3 35.8 969.9 -1.9 62.7 19.0 -3.6 -5.0 Zambia 17.7 19.2 315.3 2.2 63.8 21.8 -4.9 -2.5 Zimbabwe 23.5 25.7 588.0 1.3 66.1 17.0 -3.2 -5.9
* Note: (…) denotes missing variables. A country sample without institutional quality variables is 126, and country sample with institutional quality variables is 104.
- 27 -
Annex 3: Descriptive Statistics
Variables Mean Min Max SD N Tax Effort 20.06 2.33 43.53 9.59 982 Revenue Effort 24.41 2.94 51.17 10.09 984 GDP per capita 5,487.21 56.62 48,419.30 8,413.47 2,305 Population Growth 1.45 -26.70 18.71 1.55 2,539 Trade Openness (Export + Import)/GDP 84.64 1.53 376.22 46.05 2,233 Agricultural Value Added/GDP 17.91 0.07 93.98 14.86 2,161 Bureaucratic Quality -5.49 -10.00 0.00 2.91 1,866 Corruption Index -5.08 -10.00 0.00 2.20 1,866
- 28 -
Annex 4: Variable Descriptions and Sources
Variables Description Source Tax collection (Tax/GDP)
(Average 1994-2003). Tax revenue refers to compulsory transfers to the central government for public purposes. Social security contributions are included.
WDI (2006)
Revenue collection (Revenue/GDP)
(Average 1994-2003). Revenue is cash receipts from taxes, social contributions, and other revenues such as fines, fees, rent, and income from property or sales. Grants are also considered as revenue but are excluded here.
WDI (2006)
GDP per capita (Average 1994-2003). GDP per capita is gross domestic product divided by midyear population. GDP is the sum of gross value added by all resident producers in the economy plus any product taxes and minus any subsidies not included in the value of the products. Data are in constant U.S. dollars.
WDI (2006)
Population Growth (Average 1994-2003). Total population between the ages 15 to 64 is the number of people who could potentially be economically active.
WDI (2006)
Age Dependency Ratio (Average 1994-2003). Age dependency ratio is the ratio of dependents--people younger than 15 or older than 64--to the working-age population--those ages 15-64. For example, 0.7 means there are 7 dependents for every 10 working-age people.
WDI (2006)
Trade Openness (Export + Import)/GDP
(Average 1994-2003). Trade is the sum of exports and imports of goods and services measured as a share of gross domestic product.
WDI (2006)
Agricultural Value Added/GDP
(Average 1994-2003). Agriculture corresponds to ISIC divisions 1-5 and includes forestry, hunting, and fishing, as well as cultivation of crops and livestock production. Value added is the net output of a sector after adding up all outputs and subtracting intermediate inputs. It is calculated without making deductions for depreciation of fabricated assets or depletion and degradation of natural resources.
WDI (2006)
Bureaucratic Quality (Average 1994-2003). The institutional strength and quality of the bureaucracy is a shock absorber that tends to minimize revisions of policy when governments change. The original score ranges from 1 to 4. High points are given to countries where the bureaucracy has the strength and expertise to govern without drastic changes in policy or interruptions in government services. The score is recalculated to -10 to -1 where low points are countries with strength bureaucracy and high points are countries with weak bureaucracy.
ICRG (2006)
Corruption Index (Average 1994-2003). The assessment of corruption refers to the political system. Corruption index ranges from 1 to 6. High points are given to low corruption countries and low points are given to high corruption countries. The scores are recalculated to -10 to -1 where low points mean low corruption and high points mean high corruption.
ICRG (2006)

- 29 -
Annex 5: Actual vs. Predicted Tax Capacity
1994-2003 1994-1998 1999-2003
Country Tax/GDP Predicted Tax/GDP
Tax Effort Country Tax/GDP
Predicted Tax/GDP
Tax Effort Country Tax/GDP
Predicted Tax/GDP
Tax Effort
Albania 14.60 19.89 0.74 Albania 14.60 19.89 0.74 Algeria 32.36 17.13 1.89 Algeria 30.30 16.92 1.79 Algeria 28.65 16.75 1.71 Argentina 13.95 18.88 0.74 Argentina 13.95 18.88 0.74 Austria 35.24 29.42 1.20 Armenia 16.40 21.06 0.78 Armenia 16.40 21.06 0.78 Azerbaijan 16.80 18.05 0.93 Australia 23.41 24.99 0.94 Australia 23.41 24.99 0.94 Bahrain 7.35 21.96 0.33 Austria 35.55 30.10 1.18 Austria 35.50 29.99 1.18 Belarus 27.08 26.76 1.01 Azerbaijan 16.54 17.88 0.93 Azerbaijan 16.67 17.96 0.93 Belgium 42.51 30.85 1.38 Bangladesh 7.79 12.21 0.64 Bahrain 7.35 21.96 0.33 Botswana 17.08 18.55 0.92 Belarus 26.65 26.02 1.02 Bangladesh 7.79 12.21 0.64 Brazil 20.18 16.84 1.20 Belgium 42.06 32.18 1.31 Belarus 26.72 26.15 1.02 Bulgaria 26.55 25.33 1.05 Bolivia 14.80 14.61 1.01 Belgium 42.13 31.96 1.32 Cameroon 8.94 10.45 0.86 Bulgaria 26.93 26.62 1.02 Bolivia 14.80 14.61 1.01 Canada 19.36 28.34 0.68 Canada 19.83 29.51 0.67 Botswana 17.08 18.55 0.92 China 5.25 16.98 0.31 Chile 17.87 21.60 0.83 Brazil 20.18 16.84 1.20 Congo, Dem Rep 4.35 7.11 0.71 China 7.49 17.29 0.43 Bulgaria 26.74 25.97 1.03 Costa Rica 18.26 18.73 0.98 Colombia 12.96 16.32 0.79 Cameroon 8.94 10.45 0.86 Cote D'Ivoire 18.69 13.32 1.40 Congo, Dem Rep 4.36 6.42 0.71 Canada 19.54 28.78 0.68 Croatia 43.53 27.15 1.60 Congo, Rep. 9.92 17.72 0.56 Chile 17.87 21.60 0.83 Cyprus 25.48 24.31 1.05 Costa Rica 19.79 19.57 1.01 China 6.37 17.13 0.37 Denmark 34.25 31.54 1.09 Cote D'Ivoire 16.37 15.53 1.06 Colombia 12.96 16.32 0.79 Dominican 15.00 19.35 0.78 Croatia 39.28 25.29 1.61 Congo, Dem Rep 4.35 6.80 0.71 Ecuador 12.40 15.55 0.80 Czech Republic 30.85 27.94 1.11 Congo, Rep. 9.92 17.72 0.56 Egypt 19.23 15.69 1.22 Denmark 32.82 32.02 1.03 Costa Rica 19.02 19.15 0.99 Estonia 28.03 32.35 0.87 Dominican Rep 15.73 19.99 0.79 Cote D'Ivoire 17.53 14.43 1.23 Finland 35.86 30.07 1.19 El Salvador 13.30 17.38 0.77 Croatia 39.99 25.60 1.61 France 40.49 27.00 1.50 Estonia 25.67 31.45 0.82 Cyprus 25.48 24.31 1.05 Germany 28.71 29.24 0.98 Ethiopia 14.04 10.45 1.34 Czech Republic 30.85 27.94 1.11 Greece 38.36 24.18 1.59 Finland 35.89 30.65 1.17 Denmark 33.06 31.94 1.04 Guatemala 8.41 13.59 0.62 France 40.99 25.95 1.58 Dominican Rep 15.37 19.67 0.78 Iceland 28.40 29.70 0.96 Germany 28.76 29.16 0.99 Ecuador 12.40 15.55 0.80 India 9.06 13.11 0.69 Ghana 18.30 14.20 1.29 Egypt 19.23 15.69 1.22 Indonesia 15.80 16.99 0.93 Greece 39.76 25.22 1.58 El Salvador 13.30 17.38 0.77 Iran 9.41 17.04 0.57 Guatemala 10.43 13.71 0.77

- 30 -
1994-2003 1994-1998 1999-2003
Country Tax/GDP Predicted Tax/GDP
Tax Effort Country Tax/GDP
Predicted Tax/GDP
Tax Effort Country Tax/GDP
Predicted Tax/GDP
Tax Effort
Estonia 26.26 31.68 0.83 Ireland 24.59 29.49 0.83 Hungary 34.85 28.53 1.22 Ethiopia 14.04 10.45 1.34 Italy 37.01 26.48 1.40 Iceland 29.52 28.57 1.03 Finland 35.88 30.55 1.17 Jordan 19.91 18.12 1.10 India 8.85 13.64 0.65 France 40.90 26.12 1.57 Kazakhstan 10.64 27.02 0.39 Indonesia 13.41 15.61 0.86 Germany 28.74 29.20 0.98 Kenya 19.83 11.89 1.67 Iran 9.82 17.26 0.57 Ghana 18.30 14.20 1.29 Korea, Rep. 15.85 23.55 0.67 Italy 36.17 26.23 1.38 Greece 39.29 24.87 1.58 Latvia 27.01 29.76 0.91 Jamaica 25.75 22.27 1.16 Guatemala 9.42 13.65 0.69 Madagascar 8.48 12.33 0.69 Jordan 18.40 17.85 1.03 Hungary 34.85 28.53 1.22 Malaysia 19.26 22.40 0.86 Kazakhstan 10.57 23.45 0.46 Iceland 29.29 28.79 1.02 Mexico 12.64 18.90 0.67 Kenya 17.88 11.97 1.50 India 8.96 13.38 0.67 Moldova 27.17 21.77 1.25 Korea, Rep. 18.18 23.61 0.77 Indonesia 14.74 16.37 0.90 Morocco 24.63 17.55 1.41 Latvia 23.23 26.31 0.88 Iran 9.62 17.15 0.57 Namibia 28.55 17.22 1.66 Lebanon 14.11 18.25 0.77 Ireland 24.59 29.49 0.83 Nicaragua 14.50 16.03 0.90 Lithuania 24.77 26.27 0.94 Italy 36.31 26.28 1.38 Oman 7.53 18.14 0.42 Luxembourg 38.57 41.62 0.93 Jamaica 25.75 22.27 1.16 Pakistan 13.08 11.63 1.13 Malaysia 16.73 23.94 0.70 Jordan 19.16 17.98 1.07 Panama 15.93 21.97 0.72 Mexico 12.72 19.64 0.65 Kazakhstan 10.58 24.05 0.45 PNG 21.77 14.59 1.49 Moldova 20.30 22.64 0.90 Kenya 18.96 11.92 1.59 Paraguay 11.54 13.31 0.87 Mongolia 28.54 20.41 1.40 Korea, Rep. 16.72 23.58 0.71 Peru 15.51 16.40 0.95 Morocco 26.07 18.55 1.41 Latvia 23.86 26.89 0.89 Philippines 16.37 16.66 0.99 Namibia 29.23 18.25 1.61 Lebanon 14.11 18.25 0.77 Portugal 32.65 26.17 1.25 Netherlands 38.66 31.50 1.23 Lithuania 24.77 26.27 0.94 Senegal 15.76 14.21 1.11 New Zealand 29.85 25.86 1.15 Luxembourg 38.57 41.62 0.93 Sierra Leone 9.19 12.85 0.72 Nicaragua 16.60 16.43 1.01 Madagascar 8.48 12.33 0.69 Slovenia 34.93 28.19 1.24 Norway 37.03 31.97 1.16 Malaysia 18.00 23.17 0.78 Spain 26.95 26.37 1.02 Oman 7.08 21.60 0.33 Mexico 12.66 19.11 0.66 Sri Lanka 16.64 18.53 0.90 Pakistan 10.97 11.14 0.98 Moldova 21.45 22.49 0.96 Sudan 6.02 8.25 0.73 Panama 14.63 20.46 0.71 Mongolia 28.54 20.41 1.40 Sweden 35.48 32.07 1.11 PNG 22.39 15.22 1.47 Morocco 24.91 17.75 1.41 Switzerland 20.06 31.52 0.64 Paraguay 10.79 12.78 0.84 Namibia 28.89 17.74 1.63 Syria 16.82 14.17 1.19 Peru 14.20 16.72 0.85 Netherlands 38.66 31.50 1.23 Trinidad-Tobago 22.66 23.29 0.97 Philippines 13.37 17.58 0.76 New Zealand 29.85 25.86 1.15 Tunisia 25.18 19.25 1.31 Poland 29.35 24.16 1.22 Nicaragua 15.55 16.23 0.96 Turkey 16.73 15.94 1.05 Portugal 33.92 25.37 1.34

- 31 -
1994-2003 1994-1998 1999-2003
Country Tax/GDP Predicted Tax/GDP
Tax Effort Country Tax/GDP
Predicted Tax/GDP
Tax Effort Country Tax/GDP
Predicted Tax/GDP
Tax Effort
Norway 37.03 31.97 1.16 Uganda 10.03 7.44 1.35 Romania 22.45 25.58 0.88 Oman 7.36 19.44 0.38 United Kingdom 35.66 29.18 1.22 Russian Fed 23.54 22.15 1.06 Pakistan 12.02 11.39 1.05 Uruguay 26.82 20.57 1.30 Senegal 17.10 14.55 1.17 Panama 15.44 21.40 0.72 Venezuela 14.86 17.68 0.84 Sierra Leone 6.82 8.27 0.82 PNG 22.04 14.87 1.49 Vietnam 17.90 16.20 1.11 Slovak Rep 30.75 27.49 1.12 Paraguay 11.16 13.04 0.86 Yemen, Rep. 10.28 12.16 0.84 Slovenia 36.72 27.49 1.34 Peru 14.85 16.56 0.90 Zambia 17.82 14.99 1.19 South Africa 24.90 18.48 1.35 Philippines 14.87 17.12 0.87 Zimbabwe 23.65 17.48 1.35 Spain 25.74 23.73 1.08 Poland 29.35 24.16 1.22 Sri Lanka 14.77 21.60 0.72 Portugal 33.50 25.64 1.31 Sudan 6.35 8.83 0.72 Romania 22.45 25.58 0.88 Sweden 35.12 32.03 1.10 Russian Fed 23.54 22.15 1.06 Switzerland 19.25 31.63 0.61 Senegal 16.43 14.38 1.14 Syria 17.49 14.59 1.20 Sierra Leone 8.79 12.09 0.74 Thailand 16.20 21.35 0.76 Slovak Rep 30.75 27.49 1.12 Tunisia 26.31 20.31 1.30 Slovenia 36.42 27.61 1.32 Uganda 11.36 7.96 1.43 South Africa 24.90 18.48 1.35 Ukraine 22.71 25.00 0.91 Spain 25.94 24.17 1.07 United Kingdom 35.53 29.09 1.23 Sri Lanka 15.81 19.89 0.82 United States 18.07 27.26 0.66 Sudan 6.19 8.54 0.72 Uruguay 24.31 20.59 1.18 Sweden 35.18 32.04 1.10 Venezuela 12.91 17.40 0.74 Switzerland 19.70 31.57 0.62 Vietnam 16.50 17.90 0.92 Syria 16.94 14.24 1.19 Yemen, Rep. 9.42 13.53 0.70 Thailand 16.20 21.35 0.76 Yugoslavia 33.27 19.97 1.67 Trinidad-Tobago 22.66 23.29 0.97 Zambia 18.43 14.47 1.27 Tunisia 25.74 19.78 1.30 Turkey 16.73 15.94 1.05 Uganda 11.14 7.88 1.41 Ukraine 22.71 25.00 0.91 United Kingdom 35.55 29.11 1.23 United States 18.07 27.26 0.66 Uruguay 25.57 20.58 1.24 Venezuela 13.89 17.54 0.79

- 32 -
1994-2003
Country Tax/GDP Predicted Tax/GDP
Tax Effort
Vietnam 17.28 16.95 1.03 Yemen, Rep. 10.14 12.39 0.82 Yugoslavia 33.27 19.97 1.67 Zambia 17.92 14.90 1.20 Zimbabwe 23.65 17.48 1.35

- 33 -
Annex 6: Actual vs. Predicted Revenue Capacity
1994-2003 1994-1998 1999-2003
Country Revenue/
GDP Predicted
Revenue/GDP Revenue
Effort Country Revenue/
GDP Predicted
Revenue/GDP Revenue
Effort Country Revenue
/GDP Predicted
Revenue/GDP Revenue
Effort Albania 14.60 18.11 0.82 Albania 14.60 18.11 0.82 Algeria 32.36 21.94 1.47 Algeria 30.30 21.75 1.39 Algeria 28.65 21.59 1.33 Argentina 13.95 22.54 0.62 Argentina 13.95 22.54 0.62 Austria 35.24 32.67 1.08 Armenia 16.40 22.36 0.73 Armenia 16.40 22.36 0.73 Azerbaijan 16.80 21.37 0.79 Australia 23.41 28.80 0.81 Australia 23.41 28.80 0.81 Bahrain 7.35 30.25 0.24 Austria 35.55 33.55 1.06 Austria 35.50 33.40 1.06 Belarus 27.08 29.52 0.92 Azerbaijan 16.54 21.02 0.79 Azerbaijan 16.67 21.20 0.79 Belgium 42.51 35.21 1.21 Bangladesh 7.79 15.66 0.50 Bahrain 7.35 30.25 0.24 Botswana 17.08 25.18 0.68 Belarus 26.65 29.28 0.91 Bangladesh 7.79 15.66 0.50 Brazil 20.18 21.24 0.95 Belgium 42.06 36.69 1.15 Belarus 26.72 29.32 0.91 Bulgaria 26.55 27.18 0.98 Bolivia 14.80 19.26 0.77 Belgium 42.13 36.45 1.16 Cameroon 8.94 12.12 0.74 Bulgaria 26.93 28.75 0.94 Bolivia 14.80 19.26 0.77 Canada 19.36 32.25 0.60 Canada 19.83 33.36 0.59 Botswana 17.08 25.18 0.68 China 5.25 19.93 0.26 Chile 17.87 26.63 0.67 Brazil 20.18 21.24 0.95 DRC 4.35 7.90 0.64 China 7.49 20.74 0.36 Bulgaria 26.74 27.97 0.96 Costa Rica 18.26 24.04 0.76 Colombia 12.96 20.75 0.62 Cameroon 8.94 12.12 0.74 Cote D'Ivoire 18.69 17.67 1.06 DRC 4.36 5.39 0.86 Canada 19.54 32.66 0.60 Croatia 43.53 29.02 1.50 Congo, Rep. 9.92 25.55 0.39 Chile 17.87 26.63 0.67 Cyprus 25.48 29.44 0.87 Costa Rica 19.79 25.27 0.78 China 6.37 20.33 0.31 Denmark 34.25 34.19 1.00 Cote D'Ivoire 16.37 19.17 0.86 Colombia 12.96 20.75 0.62 Dominican 15.00 23.97 0.63 Croatia 39.28 28.61 1.39 DRC 4.35 6.78 0.74 Ecuador 12.40 19.82 0.63 Czech Rep 30.85 32.31 0.96 Congo, Rep. 9.92 25.55 0.39 Egypt 19.23 19.78 0.97 Denmark 32.82 34.78 0.94 Costa Rica 19.02 24.66 0.77 Estonia 28.03 35.73 0.78 Dominican 15.73 24.89 0.63 Cote D'Ivoire 17.53 18.42 0.96 Finland 35.86 32.97 1.09 El Salvador 13.30 22.78 0.58 Croatia 39.99 28.68 1.41 France 40.49 30.07 1.35 Estonia 25.67 35.53 0.72 Cyprus 25.48 29.44 0.87 Germany 28.71 32.26 0.89 Ethiopia 14.04 11.51 1.22 Czech Rep 30.85 32.31 0.96 Greece 38.36 27.32 1.40 Finland 35.89 33.42 1.07

- 34 -
1994-2003 1994-1998 1999-2003
Country Revenue/
GDP Predicted
Revenue/GDP Revenue
Effort Country Revenue/
GDP Predicted
Revenue/GDP Revenue
Effort Country Revenue
/GDP Predicted
Revenue/GDP Revenue
Effort Denmark 33.06 34.68 0.95 Guatemala 8.41 17.04 0.49 France 40.99 29.36 1.40 Dominican 15.37 24.43 0.63 Iceland 28.40 31.86 0.89 Germany 28.76 32.31 0.89 Ecuador 12.40 19.82 0.63 India 9.06 15.25 0.60 Ghana 18.30 16.66 1.10 Egypt 19.23 19.78 0.97 Indonesia 15.80 20.82 0.76 Greece 39.76 28.35 1.40 El Salvador 13.30 22.78 0.58 Iran 9.41 20.58 0.46 Guatemala 10.43 17.48 0.60 Estonia 26.26 35.58 0.74 Ireland 24.59 33.63 0.73 Hungary 34.85 32.89 1.06 Ethiopia 14.04 11.51 1.22 Italy 37.01 29.58 1.25 Iceland 29.52 31.31 0.94 Finland 35.88 33.35 1.08 Jordan 19.91 26.16 0.76 India 8.85 16.39 0.54 France 40.90 29.48 1.39 Kazakhstan 10.64 28.62 0.37 Indonesia 13.41 19.55 0.69 Germany 28.74 32.29 0.89 Kenya 19.83 14.95 1.32 Iran 9.82 21.37 0.46 Ghana 18.30 16.66 1.10 Korea, Rep. 15.85 27.75 0.57 Italy 36.17 29.35 1.23 Greece 39.29 28.01 1.40 Latvia 27.01 32.47 0.83 Jamaica 25.75 26.92 0.96 Guatemala 9.42 17.26 0.55 Madagascar 8.48 16.16 0.53 Jordan 18.40 25.66 0.72 Hungary 34.85 32.89 1.06 Malaysia 19.26 29.13 0.66 Kazakhstan 10.57 27.02 0.39 Iceland 29.29 31.42 0.93 Mexico 12.64 24.14 0.52 Kenya 17.88 14.67 1.22 India 8.96 15.82 0.57 Moldova 27.17 22.51 1.21 Korea, Rep. 18.18 27.91 0.65 Indonesia 14.74 20.25 0.73 Morocco 24.63 21.34 1.16 Latvia 23.23 29.84 0.78 Iran 9.62 20.97 0.46 Namibia 28.55 23.73 1.20 Lebanon 14.11 22.88 0.62 Ireland 24.59 33.63 0.73 Nicaragua 14.50 19.58 0.74 Lithuania 24.77 29.69 0.83 Italy 36.31 29.39 1.24 Oman 7.53 25.23 0.30 Luxembourg 38.57 46.64 0.83 Jamaica 25.75 26.92 0.96 Pakistan 13.08 15.03 0.87 Malaysia 16.73 31.07 0.54 Jordan 19.16 25.91 0.74 Panama 15.93 28.93 0.55 Mexico 12.72 24.95 0.51 Kazakhstan 10.58 27.29 0.39 PNG 21.77 18.13 1.20 Moldova 20.30 24.25 0.84 Kenya 18.96 14.83 1.28 Paraguay 11.54 17.50 0.66 Mongolia 28.54 24.71 1.16 Korea, Rep. 16.72 27.81 0.60 Peru 15.51 21.24 0.73 Morocco 26.07 22.29 1.17 Latvia 23.86 30.28 0.79 Philippines 16.37 21.11 0.78 Namibia 29.23 23.82 1.23 Lebanon 14.11 22.88 0.62 Portugal 32.65 29.95 1.09 Netherlands 38.66 35.48 1.09 Lithuania 24.77 29.69 0.83 Senegal 15.76 18.92 0.83 New Zealand 29.85 28.86 1.03 Luxembourg 38.57 46.64 0.83 Sierra Leone 9.19 11.28 0.85 Nicaragua 16.60 20.56 0.81 Madagascar 8.48 16.16 0.53 Slovenia 34.93 32.02 1.09 Norway 37.03 34.67 1.07
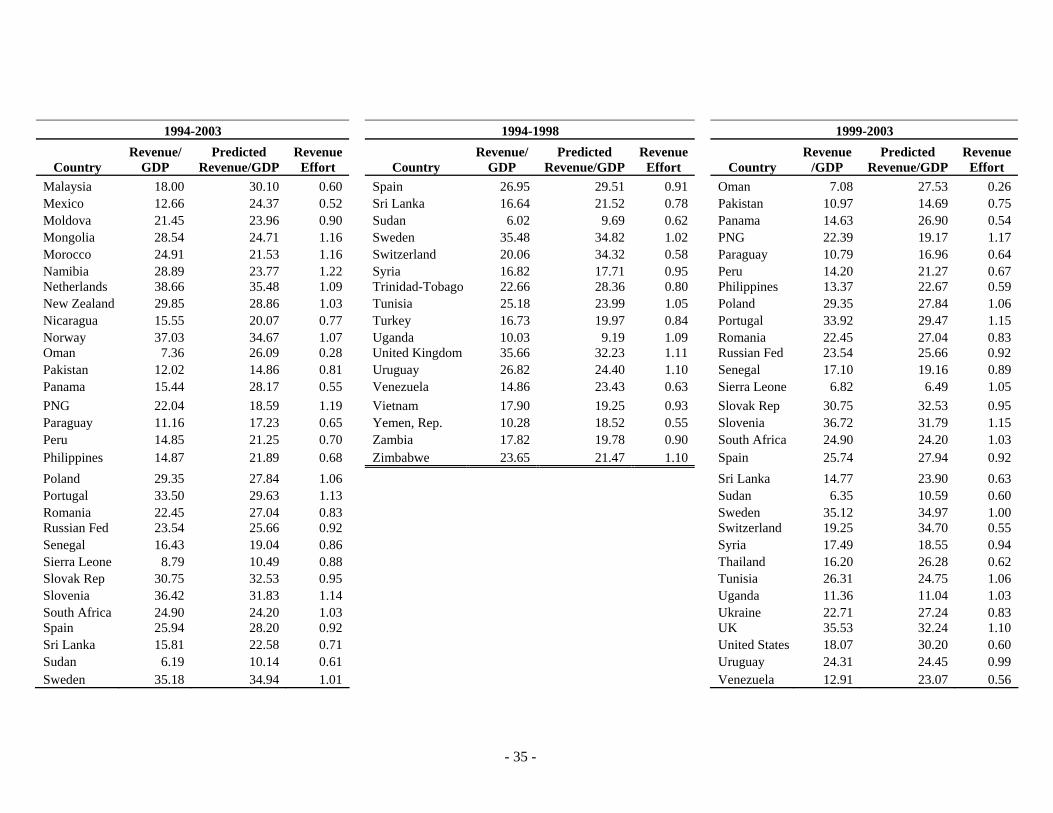
- 35 -
1994-2003 1994-1998 1999-2003
Country Revenue/
GDP Predicted
Revenue/GDP Revenue
Effort Country Revenue/
GDP Predicted
Revenue/GDP Revenue
Effort Country Revenue
/GDP Predicted
Revenue/GDP Revenue
Effort Malaysia 18.00 30.10 0.60 Spain 26.95 29.51 0.91 Oman 7.08 27.53 0.26 Mexico 12.66 24.37 0.52 Sri Lanka 16.64 21.52 0.78 Pakistan 10.97 14.69 0.75 Moldova 21.45 23.96 0.90 Sudan 6.02 9.69 0.62 Panama 14.63 26.90 0.54 Mongolia 28.54 24.71 1.16 Sweden 35.48 34.82 1.02 PNG 22.39 19.17 1.17 Morocco 24.91 21.53 1.16 Switzerland 20.06 34.32 0.58 Paraguay 10.79 16.96 0.64 Namibia 28.89 23.77 1.22 Syria 16.82 17.71 0.95 Peru 14.20 21.27 0.67 Netherlands 38.66 35.48 1.09 Trinidad-Tobago 22.66 28.36 0.80 Philippines 13.37 22.67 0.59 New Zealand 29.85 28.86 1.03 Tunisia 25.18 23.99 1.05 Poland 29.35 27.84 1.06 Nicaragua 15.55 20.07 0.77 Turkey 16.73 19.97 0.84 Portugal 33.92 29.47 1.15 Norway 37.03 34.67 1.07 Uganda 10.03 9.19 1.09 Romania 22.45 27.04 0.83 Oman 7.36 26.09 0.28 United Kingdom 35.66 32.23 1.11 Russian Fed 23.54 25.66 0.92 Pakistan 12.02 14.86 0.81 Uruguay 26.82 24.40 1.10 Senegal 17.10 19.16 0.89 Panama 15.44 28.17 0.55 Venezuela 14.86 23.43 0.63 Sierra Leone 6.82 6.49 1.05 PNG 22.04 18.59 1.19 Vietnam 17.90 19.25 0.93 Slovak Rep 30.75 32.53 0.95 Paraguay 11.16 17.23 0.65 Yemen, Rep. 10.28 18.52 0.55 Slovenia 36.72 31.79 1.15 Peru 14.85 21.25 0.70 Zambia 17.82 19.78 0.90 South Africa 24.90 24.20 1.03 Philippines 14.87 21.89 0.68 Zimbabwe 23.65 21.47 1.10 Spain 25.74 27.94 0.92 Poland 29.35 27.84 1.06 Sri Lanka 14.77 23.90 0.63 Portugal 33.50 29.63 1.13 Sudan 6.35 10.59 0.60 Romania 22.45 27.04 0.83 Sweden 35.12 34.97 1.00 Russian Fed 23.54 25.66 0.92 Switzerland 19.25 34.70 0.55 Senegal 16.43 19.04 0.86 Syria 17.49 18.55 0.94 Sierra Leone 8.79 10.49 0.88 Thailand 16.20 26.28 0.62 Slovak Rep 30.75 32.53 0.95 Tunisia 26.31 24.75 1.06 Slovenia 36.42 31.83 1.14 Uganda 11.36 11.04 1.03 South Africa 24.90 24.20 1.03 Ukraine 22.71 27.24 0.83 Spain 25.94 28.20 0.92 UK 35.53 32.24 1.10 Sri Lanka 15.81 22.58 0.71 United States 18.07 30.20 0.60 Sudan 6.19 10.14 0.61 Uruguay 24.31 24.45 0.99 Sweden 35.18 34.94 1.01 Venezuela 12.91 23.07 0.56

- 36 -
1994-2003 1999-2003
Country Revenue/GDP
Predicted Revenue/GDP
Revenue Effort Country
Revenue/GDP
Predicted Revenue/GDP
Revenue Effort
Switzerland 19.70 34.49 0.57 Vietnam 16.50 21.22 0.78 Syria 16.94 17.85 0.95 Yemen 9.42 19.27 0.49 Thailand 16.20 26.28 0.62 Yugoslavia 33.27 22.40 1.49 Trinidad 22.66 28.36 0.80 Zambia 18.43 18.10 1.02 Tunisia 25.74 24.37 1.06 Turkey 16.73 19.97 0.84 Uganda 11.14 10.73 1.04 Ukraine 22.71 27.24 0.83 UK 35.55 32.24 1.10 United States 18.07 30.20 0.60 Uruguay 25.57 24.43 1.05 Venezuela 13.89 23.25 0.60 Vietnam 17.28 20.12 0.86 Yemen 10.14 18.64 0.54 Yugoslavia 33.27 22.40 1.49 Zambia 17.92 19.50 0.92 Zimbabwe 23.65 21.47 1.10
