expanding our presence in growing markets and regions · expanding our presence in growing markets...
TRANSCRIPT

Annual Report
2009Year Ended March 31, 2009
Expanding Our Presence
in Growing Markets
and Regions

ProfileTaiyo Nippon Sanso Corporation is the fruit of the merger of Nippon Sanso Corporation and Taiyo Toyo Sanso Co., Ltd., on October 1, 2004. The Company is drawing on the capabilities of its two predecessors in its drive to become a leading player in Asia and around the world.
Management Philosophy“Market-driven collaborative innovation: improving the future through gases”
Financial HighlightsTaiyo Nippon Sanso Corporation and Consolidated Subsidiaries Years ended March 31, 2009 and 2008
Millions of yen Thousands ofU.S. dollars1
Percentage change
2009 2008 2009
Operating ResultsNet sales ¥495,746 ¥507,718 $5,046,788 (2.4)%) Net income 16,533 21,930 168,309 (24.6))%
Yen
U.S. dollars1Percentage
change2009 2008 2009
Per share data:Net income2 ¥ 41.21 ¥0054.48 $ 0.42 (24.4)%)Cash dividends 12.00 12.00 0.12 — %)
Millions of yen Thousands ofU.S. dollars1
Percentagechange
2009 2008 2009
Corporate PositionTotal assets ¥534,350 ¥547,237 $5,439,784 (2.4)%)Total shareholders’ equity 181,037 203,696 1,842,990 (11.1))%Notes: 1. U.S. dollar amounts have been translated, solely for convenience, at the rate of ¥98.23=U.S.$1,
the approximate rate of exchange at March 31, 2009. 2. Net income per share is computed based on the weighted average number of shares of
common stock outstanding during each year, as adjusted retroactively for free share distributions made during the period.
Contents 1 Operational Highlights 2 To Our Stakeholders 4 An Interview with the President 8 Special Feature 16 Segment Overview 18 Our Businesses 23 Board of Directors, Corporate Auditors and Corporate Officers 24 Management’s Analysis of Operating Results and Financial Position 27 Six-Year Summary 28 Consolidated Financial Statements 33 Notes to Consolidated Financial Statements 48 Report of Independent Auditors 49 Investor Information
Disclaimer Regarding Forward-Looking StatementsThis annual report contains forward-looking statements regarding the future plans, strategies, activities and performance of Taiyo Nippon Sanso Corporation. Forward-looking statements reflect management’s assumptions and beliefs based on information available as of the date of this document‘s publication and inherently involve risks and uncertainties. Actual results may thus differ substantially from these statements. Risks and uncertainties include, but are not limited to, changes in general economic and specific market conditions, currency exchange rate fluctuations and evolving trends in demands for the Company’s products and services.

1
Operational Highlights
Overseas OperationsIn fiscal 2009, we made concrete progress in our efforts to implement two of the key strategies outlined in our new medium-term business plan, launched in fiscal 2008, namely, to allocate management resources and strengthen our presence in growing mar-kets and regions, and to promote an active merger and acquisition (M&A) strategy. In March 2009, acting through wholly owned subsidiary Matheson Tri-Gas, Inc., in the United States, we acquired Valley National Gases LLC, the largest independent distributor of industrial gases and welding supplies in the United States. The purchase of Valley National Gases, which has a strong marketing base in the American northeast, will enable us to establish a network of industrial gases sales bases across the contiguous United States, thereby positioning us to dramatically expand our U.S. industrial gases business.
We also look forward to considerable synergies in the areas of production and sales, with Valley National Gases distributing specialty gases and helium provided by Matheson Tri-Gas. We expect these synergies to support an annual increase in earnings of approximately $18 million.
Domestic OperationsIn Japan, we concluded a contract for a joint monosilane production project with Evonik Degussa Japan Co., Ltd. The project involves the integration of monosilane gas production, purification, filling and quality management in a new joint venture. Output from the joint venture will be marketed in Japan and elsewhere in Asia exclu-sively by the Taiyo Nippon Sanso Group. We currently enjoy a 50% share of the Japanese monosilane gas market. This project will increase our annual production capacity to approximately 1,000 tons, enabling us to capitalize on an anticipated increase in demand for monosilane gas from liquid crystal display (LCD) and solar cell manufacturers by providing a safe and stable supply.
Owing to rising demand for monosilane in the manufacture of semiconductors, LCDs and thin-film solar cells, the annual global market for this gas is expected to reach approximately 4,000 tons in 2011, double the current level. We expect our annual sales to reach between 600 and 700 tons in fiscal 2013, and will thus proceed with the con-struction of facilities with the aim of launching full-scale production within three years.
For more information,please see pages 10 and 11.
For more information,please see pages 12 and 13.
For more information,please see pages 10 and 11.
For more information,please see pages 12 and 13.

2
New Medium-Term Management Plan: Year One in ReviewFiscal 2009, ended March 31, 2009, was the first year of a newly formulated medium-term business plan. During the period, the financial crisis that originated in the United States triggered a global economic downturn, leading to a sharp deterioration of business conditions for the Taiyo Nippon Sanso Group’s prin-cipal customer industries, particularly from the third quarter on. Despite operating in a harsh environment, we steadfastly maintained our commitment to rein-forcing our ability to serve customers in the electron-ics market and to expand our overseas operations. Preferring to look at the opportunities provided by the current economic situation and with a shared sense of urgency, the companies of the Taiyo Nippon Sanso Group sought to improve earnings and strengthen the Group’s financial condition by pro-moting decisive efforts to reduce costs, thereby trans-forming the Group into a firmer and fitter organization. At the same time, we radically revised capital invest-ment plans under our new medium-term business plan—initially set at ¥200 billion—and initiated measures aimed at responding to the changes taking place in our operating environment.
Taking a look at conditions in principal industries, the steel industry was hit hard by weak demand for high-end steel materials from automobile and electronic appliance manufacturers, prompting a sharp decline in production volumes that persisted from autumn 2008 forward. In the chemicals indus-try, manufacturers struggled to contend with higher raw materials prices and diminishing demand for high-performance plastics, which forced sharp cut-backs in the production of ethylene. In the electronics industry, declining demand for digital household elec-trical appliances and automotive electronics equip-ment, among others, triggered sharp inventory adjustments, significant production cutbacks, delayed capital investments and the integration and reorgani-zation of production facilities, resulting in the closure of some plants.
In the Gas Business segment, demand for gases declined against a background of falling production in customer industries, with the exception of nitrogen, which continued to benefit from demand for use in eliminating the risk of explosions when operating rates are low. As a consequence, shipments
To Our Stakeholders
of mainstay oxygen and argon fell 17% and 10%, respectively, from fiscal 2008. In our Plant and Gas Equipment Business segment, sales of air separation plants were level with the previous fiscal year, while the absence of major orders drove down sales of electronics-related machinery and equipment. In the Housewares Business and Others segment, sales of mainstay vacuum insulated sports bottles and insulated mugs were robust. As a result of all these factors, consolidated net sales slipped 2.4%, to ¥495,746 million. Operating income fell 24.8%, to ¥29,164 million and net income declined 24.6%, to ¥16,533 million.
Becoming a Global Player: Implementing Structural Reforms Under Our New Medium-Term Business PlanWhile certain areas of the steel and chemicals indus-tries are showing signs of improvement, this is seen as a temporary phase and it is likely to be some time before we see a real recovery from the economic downturn that began in the fiscal 2009 second half.
In this environment, we will continue to push ahead boldly with a variety of measures aimed at ensuring our place as a major global player in line with the four strategic themes of our new medium-term business plan, which are to accelerate growth and achieve a commensurate increase in income, pro-mote further globalization, implement cost-cutting measures and strengthen Group management. Given the uncertain economic outlook, however, we do intend to rethink the numerical goals we have set for the final year of the plan.
We also recognize the need to implement swift structural reforms to overcome the difficulties we cur-rently face and secure sufficient earnings. We began addressing this task in fiscal 2009. In terms of efforts in core businesses, which are responsible for the bulk of our earnings, in the Gas Business our focus is on enhancing operating efficiency and rallying Group strengths to create a solid foundation that will assure our position as a major global player despite adverse conditions. We are also endeavoring to ensure future growth for the Gas Business by focusing on maintain-ing appropriate sales prices; further improving effi-ciency; reducing costs; reinforcing management of receivables; expanding Gas Business operations overseas and increasing demand from new sectors.

3
Chairman PresidentHiroshi Taguchi Hirosuke Matsueda
In the Electronics-Related Business, our emphasis is on expanding into and increasing sales in new growth markets in Japan and overseas; strengthening our earnings structure, an initiative that includes principal affiliated companies; establishing a solid position as a manufacturer of, and formulating an overseas business strategy for, key strategic products; and reinforcing management of receivables.
In the Onsite and Plant Business, efforts are centered on maintaining plant operating rates and expanding target markets; achieving an optimum operating structure that further lowers production costs for semiconductors; stepping up risk manage-ment to guarantee stable supplies; and securing onsite plant contracts in overseas markets.
Improving Corporate Governance and Taking On New ChallengesIn a harsh operating environment, the challenge of creating an effective and outstanding corporate gover-nance system, thereby enhancing transparency and ensuring accountability, takes on increasing importance.
To date we have modified our corporate gover-nance organization by introducing a corporate officer system to expedite management decision making and by establishing a management team suited to the nature of our businesses that consists of a Board of Directors, which has 16 members, one of whom is an outside director, and a Board of Auditors comprising four standing corporate auditors, including two outside auditors.
In terms of financial reporting and compliance, management is responsible for the entire financial reporting process, including the preparation of financial statements and the creation of a system of related internal controls. The Board of Auditors oversees the independent auditors. The Board of Auditors also maintains close contact with the inde-pendent auditors to establish the latter’s autonomy from the Board of Directors, convening to hear the independent auditors’ annual auditing plans in advance and to hear the results of audits conducted by the independent auditors.
As a part of our effort to establish an effective inter-nal control framework, we have created the Technology Risk Management Committee, recognizing the need for us—as a company engaged primarily in the provi-sion of high-pressure gases—to manage risks in four
categories, namely, security, safety, quality assurance and the environment. We have also created the Risk Assessment Subcommittee, which is charged with pro-tecting our interests as an inherent part of our corpo-rate culture by identifying, assessing and debating business risks affecting the Group’s businesses.
Aware of the need to incorporate effective corpo-rate governance and compliance into all aspects of corporate activity as the core of a solid foundation for continued survival and prosperity, management pledges to continue reinforcing such efforts. To fulfill our mission as “the Gas Professionals,” we will con-tinue striving to earn the confidence of customers in key markets and in doing so to enhance corporate value.
Our forecasts for fiscal 2010 call for consolidated net sales of ¥450,000 million, operating income of ¥27,400 million and net income of ¥13,300 million.
In closing, on behalf of the Board of Directors, we thank stakeholders for their guidance and support to date. We look forward to your continued understanding and confidence in the years ahead.
June 2009
Hiroshi TaguchiChairman
Hirosuke MatsuedaPresident

4
A
An Interview with the President
In the domestic market, we have seen a pronounced decline in demand across the board from main customer industries, including electronics, steel, chemicals and automobiles. If you look at it from a medium- to long-term perspective, however, the real keys to future growth are resources, energy and the environment. Our portfolio already encompasses solar cell-, LED- and hydrogen-related materials, but before we can say that we have laid the foundations for future business development we must take further steps to strengthen these businesses.
Another key strategy we are pursuing is to establish ourselves as an upstream manufactur-er of helium and electronics materials gases. To this end, it is vital that we ensure stable sup-ply capabilities and reinforce our competitiveness.
QThe core strategy set forth in your new medium-term business plan is to focus your investment of management resources in growing markets and regions. Given the tremendous changes that occurred in fiscal 2009, the first year of the plan, what are your thoughts on this now?
The real keys to future growth are resources, energy
and the environment

5
AIn the United States, where the recent financial crisis originates, we recognize that it is unlikely we will be able to avoid the impact of retreating demand. Nevertheless, as indicated by our purchase of Aeris, Inc., of northern California, sluggish market conditions and a strong yen make this a good time for mid-tier acquisitions. We see more opportunities like this arising moving forward.
In Asia, the impact of slowing economic growth is evident, but growth remains strong in China and elsewhere. We intend to further expand the scale of our operations in the region, and will continue to allocate management resources to this effort, seeing it as an important prerequisite to future growth.
QWhat can you tell us about the other aspect of that strategy, that is, focusing investment of management resources in growing regions?
AThe driving force behind our efforts is our strategy to expand our operations in growing regions. In addition, we are increasing collaboration with R&D organizations overseas, evi-denced during the period under review by the start of joint development projects with IBM of the United States in next-generation materials gases and process technologies for semiconduc-tors, and IMEC of Belgium in fabrication technology for high-brightness green LED devices.
To facilitate the optimum allocation of personnel, one of our most important manage-ment resources, we are concentrating on implementing training programs around the world for mid- and management-level employees developed to foster globally competent individu-als. This reflects our fundamental belief that being a major global player in industrial gases means being a company in which talented individuals have the opportunity to rise to the top of the executive ladder regardless of nationality. As a major global player, our target market will be considerably broader than it is today, as will the scope of our operations. Accordingly, it will be crucial to have executives who are well-versed in business practices and customs in different countries and regions, who have experience working abroad and a solid record of achievement.
QWhat steps are you taking to reinforce the foundation of your global operations?

6
AThe entire Taiyo Nippon Sanso Group is accelerating efforts to achieve total cost reductions, including administrative costs. Just to give you a few examples, we are continuing with a project designed to increase the efficiency of distribution. We are also working to increase the efficiency of day-to-day operations at our gas production facilities, lower production costs, expand local procurement and overseas manufacturing capabilities and step up use of telecommunications systems, including teleconferencing.
In fiscal 2009, we also upgraded our backbone system, combining and facilitating inte-grated management of intra-Group sales, purchasing, production, accounting and personnel systems in an integrated management system. This has greatly enhanced efficiency from the perspective of ensuring the optimal allocation of human resources, physical assets and capital.
QExpansion of businesses is of course important, but in the current operating environment—and especially given the precipitous decline in demand from core customer industries—stakeholders will also be interested in what you are doing to enhance profitability. What steps are you taking to lower costs?
ATo date, we have focused on enhancing the performance of Group companies by reassessing their strengths and reorganizing and integrating them with the aim of enhancing coordina-tion. Our ability to overcome the challenges of an operating environment characterized by sharply deteriorating economic conditions depends to a large degree on our own efforts to enhance our efficiency and capabilities, so I prefer to look at the current situation as a good opportunity for us to accelerate these efforts.
Of course, in a rapidly changing economic environment there is also the danger of getting too caught up in Group optimization and the need to reduce costs, and as a result losing sight of the basics of manufacturing, namely, ensuring the safety, reliability and quality of our products. The road is littered with cases of companies that have fallen into this trap and as a result lost the confidence of customers. The Taiyo Nippon Sanso Group pledges to rally its strengths and reinforce compliance, thereby earning the trust of the market and increas-ing corporate value—results that give a solid sense of having reinforced management—as swiftly as possible. We are confident that this will enable us to overcome the current crisis and push forward with efforts to achieve our goal of becoming a major global player.
QTranslating stronger Group management into clearly recognizable increases in corporate value is always a key challenge for management. What are your views on this at present?

7
AWe are engaged in a variety of efforts aimed at addressing the issue of global warming. In particular, we have taken steps to reduce energy consumed at gas manufacturing plants and installed load indicators (LIs) in our tanker trucks to reduce energy consumed in logistics.
Among our various operations, the most energy intensive is the production of industrial gases, such as oxygen, nitrogen and argon, which use a significant amount of electric power. CO2 emissions from these operations account for 98% of total CO2 emissions for the Group. We have established the Energy Conservation Subcommittee, a subset of our Environment Committee, the purpose of which is to reduce energy use per unit of produc-tion at our gas manufacturing plants (lower volume of electric power used, higher volume of gases produced).
With the aim of reducing energy consumption in logistics, we have installed liquefied gas LIs in approximately 90% of our tanker trucks in a bid to improve the efficiency of logistics practices. Eventually, we plan to install LIs in all of our tanker trucks not only to reduce dis-tances traveled and fuel consumed, but also to facilitate energy-efficient driving, multidrop deliveries and other environment-friendly practices.
Q
Our strategy is to expand our operations in
growing regions
In closing, can you tell us about your efforts to address environmental issues—an important factor in increasing brand value?

8
Rising to the Challenge:
Expanding Our Presence in Growing Markets and RegionsWith the aim of establishing itself as an Asian-born major player in the global industrial gases industry, Taiyo Nippon Sanso continues to address new challenges as it embarks upon the second year of its new medium-term business plan.
The central strategy of our new medium-term business plan is to focus allo-cation of management resources in growing markets and regions. The major growth market we are targeting is electronics, and principal growth regions include the United States and Asia. In this year’s special feature, we take a look at our progress to date and our outlook for fiscal 2010.
Three Core Strategies of Our New Medium-Term Business Plan (Fiscal 2009–Fiscal 2011)• Focusallocationofmanagementresourcesingrowingmarketsandregions• Expandupstreambusinesses• PromoteanambitiousM&Astrategy
Special Feature

9
Theme 1Focus allocation of management resources in growing markets:
Electronics• Noteworthyelectronicsindustrytrends• Acceleratingeffortstoexpandelectronics-relatedbusinesses• Strengthsincompoundsemiconductorfabricationequipmentbusiness• R&Daimedatdifferentiatingproductsandservices• Expandingourbusinessfoundationtosupportfuturegrowth
Theme 2Focus allocation of management resources in growing markets:
Advancing our U.S. industrial gases business• OurU.S.industrialgasesbusinesstoday• OurhistoryintheU.S.industrialgasesmarket• Marketpositionandkeyachievements• ReinforcingourbusinessfoundationinthepromisingU.S.market
Theme 3Focus allocation of management resources in growing markets:
China and Asia• PositionofourChineseindustrialgasesbusiness• OurhistoryinChina’sindustrialgasesmarket• EffortstorespondtocustomerneedsintheKoreanmarket• EffortstorespondtocustomerneedsintheTaiwanesemarket• OperationsinSoutheastAsia(Singapore,Malaysia,thePhilippines)• IndustrialgasesmarketpotentialinotherpartsofAsia

1010
Noteworthy electronics industry trends• Advances in integrationbodewell for semiconductor demand,while forLCDs the trend toward ever-bigger
panels offers promise.• Globalinitiativesaimedatconservingenergyandaddressingenvironmentalissuesareexpectedtofurtherbolster
demand for solar cell- and LED-related materials.• Demandcontinuestoriseformonosilanegas,aspecialtygasusedinthemanufactureofthin-filmsolarcells(the
global market for monosilane gas is estimated at approximately 2,000 tons).
Accelerating efforts to expand electronics-related businesses• WecontinuetopromotethefocusedallocationofinvestmentsintheUnitedStates,eastAsiaandSoutheastAsia,
and to accelerate efforts to secure a solid position in the market for electronics materials-related gases. Additionally, we will expand our production capacity for specialty gases to ensure stable supply capabilities.
• Wearedevelopingacomprehensivelineupencompassingspecialtygases,metalorganicchemicalvapordeposition(MOCVD) equipment, devices, compact nitrogen generators, safe delivery sources (SDSs) and waste gas processing equipment, thereby enabling us to offer comprehensive solutions.
• We are reinforcing our supply capabilities formonosilane gas, demand forwhich is expected to grow forapplications in thin-film transistors (TFTs), key process materials in chemical vapor deposition (CVD).
• TaiyoNipponSanso’ssalesofspecialtygasesforuseinsolarcellswereapproximately230tonsinfiscal2009.Infiscal 2012, we will launch production of these promising gases, thereby positioning us to take advantage of expanding demand.
Strengths in compound semiconductor manufacturing equipment business• Trendsinthemarketforcompoundsemiconductors
Rising demand for LCD backlights, white LEDs for ordinary lighting and semiconductor lasers, among others, are spurring interest in large-scale mass production equipment.
Demand is particularly strong for use in electronic devices, notably LED backlights, which have replaced cold cathode tube backlights.
Theme 1Focus allocation of management resources in growing markets:
Electronics
201320122011201020092008200720060
1
2
3
4
5
6
7
0
20
40
60
80
100
120
140(Thousands of tons) (Billions of yen)
Global Outlook for Monosilane Gas (by Application)
Semiconductors
LCs
Solar cells
Photoreceptor drums
SemiconductorsLeft axis (Shipments) Right axis (Sales) (Calendar year)
LCs
Solar cells
Photoreceptor drums
Total global sales
Source: “Market Outlook for Monosilane Gas for Use in Electronics Process Materials and Products in 2008,” Fuji-Keizai Group

1111
• CompetitiveadvantagesofourMOCVDequipment Thanks to our outstanding gas supply technologies, our MOCVD equipment enables precise control over
CVD and pressure. This equipment facilitates epitaxial growth not only in decompressed, but also in high-pressure, ambient
environments.
R&D aimed at differentiating products and services• InOctober 2008,we commenced joint R&Dwith
Interuniversitair Micro-Electronica Centrum vzw (IMEC) in the area of manufacturing (film fabrication) technology for high-efficiency LED devices. Realization of this goal will enhance the precision of our MOCVD equipment.
• We are also promoting thedevelopment ofMOCVDequipment with 2–3 times the processing speed and outstanding throughput of existing models (in the area of compound semiconductors, we are focusing on the fabrication of blue LEDs, white LEDs and gallium nitride (GaN) devices using purple lasers).
• In the area of cutting-edge semiconductor processdevelopment, in April 2008 we signed an agreement with International Business Machines Corporation (IBM) to develop next-generation semiconductor materials and process technologies for 32 nm node devices and later DRAMs, while in October we initiated a project with Albany NanoTech Center, at the University of Albany in the United States.
Expanding our business foundation to support future growth• AtSakaiGasCenterCo.,Ltd.—establishedinNovember2007aspartofa“21stCenturyIndustrialComplex”in
the city of Sakai, in Osaka—we are currently constructing core gas production and supply facilities for a new LCD panel plant slated to open in the complex in October 2009.
• WerecentlylaunchedajointmonosilaneproductionprojectwithEvonikDegussaJapanCo.,Ltd.,anaffiliateofEvonik Industries AG of Germany. Production is scheduled to get underway in early 2011, with annual production capacity of 1,000 tons. Output from the project will enable us to expand monosilane gas sales in Japan and elsewhere in Asia.
• InJune2008,subsidiariesNSEngineeringCorporationandSaanEngineeringCorporationweremergedunderthe name Taiyo Nippon Sanso Engineering Corporation. The new company has taken over its predecessors’ semiconductor-related engineering operations, including gas equipment sales, installation and maintenance. The aims of this integration include enhancing the efficiency and competitiveness of our semiconductor equipment and engineering business, facilitating the effective allocation of management resources, leveraging synergies, rallying technological and engineering capabilities, and enhancing product quality and safety assurance, as well as cost reductions.
• Intheareaofspecialtygases,in2009subsidiaryMathesonTri-Gascommencedproductionofhydrogenselenide(H
2Se) for use in copper indium gallium selenide (CIGS) solar cells, for which demand is expected to increase.
German company 59%Others 7%TAIYO NIPPON SANSO 15%
U.S. company 19%
Efforts to Reinforce Compound Semiconductor Manufacturing Equipment Business
Acquired MOCVD equipment business of competitors.
Global Market for MOCVD Equipment in 2006: Approximately ¥25 billion
Enhanced product lineup
Share of domestic market: 80%–90% Source: MLSI materials for 2006
0
400
600
800
1,000
1,200
1,400
1,600
1,800
2,000
2020201520102007(Calendar year)
Global Outlook for LEDsIncrease in demand for LEDs
Anticipated increase in demand for MOCVD equipment
General lighting applications
Special lighting applications
Further market growth
Interior: Offices, homes; Exterior: Roads, tunnels, sports facilities
Interior: Commercial facilities (base lighting); Exterior: Sidewalks, parks, squares
LED lighting
Backlights for large LCDs
Streetlights
Backlights for small and medium-sized LCDs, vehicle interior lighting
(Billions of yen)
Interior: Retail premises (spotlights); Exterior: Landscape, signage

12
Our U.S. industrial gases business today• TheUnitedStatesistheworld’slargestconsumerofindustrialgases;growthintheU.S.marketisessentialforus
in our bid to become a major global player. We have thus positioned the United States as one of our most important markets.
• Inlinewithourcurrentmedium-termbusinessplan,whichcameintoeffectinApril2008,weareseekingoutpromising M&A opportunities in the United States with the aim of acquiring capable regional distributors, thereby reinforcing our supply capabilities.
• WehaveestablishedaproductionandsalesnetworkthatessentiallycoverstheentireUnitedStates.
Our history in the U.S. industrial gases market• Wehave viewed theUnitedStates as a promisingmarket for our industrial gases business,which comprised
general-purpose and specialty gases, since establishing Japan Oxygen Co. Ltd. in 1980.• In 1999,wemerged industrial gasmanufacturer subsidiariesMathesonGasProducts Inc. andTri-gas Inc., to
create New Jersey-based Matheson Tri-Gas, Inc. Since then, we have continued to reinforce our U.S. operations as the Taiyo Nippon Sanso Group by conducting our ambitious U.S. M&A strategy through Matheson Tri-Gas.
• Wehave expandedourpresence in theU.S.market through strategicM&Adeals that have seenus acquirecapable industrial gas distributors in the central-southeast, western and Pacific regions.
Market position and key achievements• InMarch2009,weacquiredValleyNationalGasesLLC,thelargestindependentdistributorofindustrialgasesin
the United States, through Matheson Tri-Gas.• ThislatestacquisitionhasgivenusamarketingbaseinthenortheasternUnitedStates.• Wewill expandValleyNationalGases’ business domain to encompass the integratedproduction and sale of
general-purpose industrial gases by building an ASU at the company’s site. • MathesonTri-GasspearheadedtheacquisitionofFiveStarGas&Gear, Inc.,whichenjoysa strongmarketing
base in southern California, in March 2008, and Aeris, Inc., the largest distributor of industrial gases in northern California, in October 2008.
• InSeptember2008,wecommencedoperationof a hel ium fi l l ing stat ion in southern California. This began with the purchase in 2006 of the helium business of the former BOCGroupplcoftheUnitedKingdom.
• In spring2011,weplan to beginproductionof helium at a joint venture with a U.S. firm. Global demand for helium is centered in the United States, Europe and Asia and is expected to increase for electronics applications in all three markets.
Theme 2Focus allocation of management resources in growing markets:
Advancing our U.S. industrial gases business

13
Reinforcing our business foundation in the promising U.S. market• WewillcontinueexpandingourR&D,productionandsalesactivitiesintheU.S.market,andtouseourU.S.
business foundation as a springboard from which to accelerate efforts to cultivate operations in other markets around the world, in line with our goal of transforming the Taiyo Nippon Sanso Group into a major global player.
• Expansion effortswill encompass general-purpose industrial and specialty gases andhelium.These effortswillfocus on optimizing our global production network, including related facilities, seeking higher levels of efficiency and realizing synergies with other businesses.
• Againstabackgroundofrisingdemandforspecialtygases fortheelectronics industry,wewill launchfull-scaleproduction of H
2Se for use in CIGS solar cells.
• Withtheaimofacceleratingdecisionmaking,wewill introduceateleconferencingsystemto linkkeybases inJapan with those overseas, including Matheson Tri-Gas’s five bases.
New ASUs
Impact of Valley National Gases Acquisition on U.S. Business Development
ASUs in 2008
New ASUs established in 2009
Original Matheson Tri-Gas markets (2008)
New Matheson Tri-Gas markets obtained through acquisition of Valley National Gases LLC

14
• Asthecenteroftheglobalelectronicsindustry,Asiahasemergedasaparticularlypromisinggrowthmarketforthe industrial gases sector. To take advantage of opportunities in this market, we are stepping up efforts to ensure a stable supply of products by securing sales channels, as well as by establishing new production bases and expanding facilities.
• With thenumber ofmanufacturers of solar cells entering themarket expected to increase, demand formonosilane gas, a specialty gas, is expected to grow markedly in Asia.
• Movingforward,wewillcontinuetoactivelyfostertheexpansionofouroperationsinChinaandotherpartsofeast Asia, as well as in Southeast Asia, including Singapore, Malaysia and the Philippines.
Position of our Chinese industrial gases business• InJune2008,weestablishedDalianChangxingIslandTaiyoNipponSansoGasCo.,Ltd.,tosupplyindustrial
gases to the Dalian Changxing Island Harbor Industrial Zone, which will primarily house shipbuilding and related firms. A large-scale air separation facility with a capacity of 8,000 m3/h, which is scheduled to come on line in 2010, is currently under construction.
• InMay2008,weacquiredmonosilanegasfillingcompanyYangzhouZhongyuanSemiconductorGasCo.Ltd.,whichbeganoperationsthefollowingmonthunderthenameYangzhouTaiyoNipponSansoSemiconductorGasCo., Ltd.
Our history in the Chinese industrial gases market• We first set up operations in theChinesemarket in 1993with the establishment of industrial gases
manufacturing and sales company Dalian Nippon Sanso Gas Co., Ltd., which was renamed Dalian Taiyo Nippon Sanso Gas Co., Ltd., in May 2005. Since then, we have actively expanded our presence to capitalize on growth in the promising Chinese market.
• Having received anorder to supply industrial gases to anLCDmanufacturer in Shanghai inMay2003weestablished Shanghai Taiyo Nippon Sanso Gas Co., Ltd., to supply industrial gases. The following May, Shanghai Taiyo Nippon Sanso Gas began supplying industrial gases by pipeline and in October 2004 brought its main plant on line and began to offer bulk gas services.
Efforts to respond to customer needs in the Korean market• Lookingtocapitalizeonexpectedgrowthindemandforspecialtygasesfromsemiconductor,LEDandsolarcell
manufacturers, in September 2006 we built a new industrial gases production facility focusing on specialty gases at an industrial estate in Asan.
• InJune2007,weestablishedSKCAirgasInc.,inajointventurewithKoreanconglomerateSKC.
Efforts to respond to customer needs in the Taiwanese market• TaiyoNipponSansoTaiwan, Inc., is currently rankedNo. 2 in theTaiwanese specialty gasesmarket.The
company is pushing forward with our business into foundry, Dram, Lcd markets, in Taiwan furthermore by using our industrial gas supply technologies to meet the relevant needs of customers.
Theme 3Focus allocation of management resources in growing markets:
China and Asia

15
Operations in Southeast Asia (Singapore, Malaysia, the Philippines)• SingaporeindustrialgasesaffiliateNationalOxygenPte.Ltd.(NOX)iscurrentlyexpandingitsstorageandfilling
facilities for specialty gases for use in semiconductor fabrication.• In2008,actingthroughNOX’swhollyownedMalaysiansubsidiaryNipponOxygenSdn.Bhd.,webuiltanew
onsite plant in the state of Terengganu to supply industrial gases to steelmakers and petrochemicals manufacturers.
• InthePhilippines,wehavecontinuouslyinvestedinourlocaloperationsformanyyearsandin2008increasedour production capacity by, among others, expanding our industrial gases production facility. As this indicates, we expect demand for industrial gases to remain firm in the Philippines for the foreseeable future.
Industrial gases market potential in other parts of Asia• Withdemandforindustrialgasesexpectedtoincreaseintheyearsahead,VietnamandThailandareparticularly
promising markets.• InVietnam,we responded to the launchof severalmajor steel andpetrochemicals projects by expandingour
industrial gases production facility and endeavored to consolidate our operating foundation in the north of the country, recently a favored destination for investments.
• PoliticalunrestpromptedatemporarylullininvestmentinThailand,butthesituationhasimprovedandwearepreparing to resume.
• OwingtotheglobalfinancialcrisisthatbeganintheUnitedStates,growthinthemarketsforindustrialgasesinother parts of Asia has been generally sluggish in recent months. Demand from the electronics industry, particularly for specialty gases, remains on an uptrend, however, and is expected to sustain steady growth.
China15,500m3/h
Vietnam3,500m3/hThailand
33,600m3/hJapan168,500m3/h
Singapore17,100m3/h
the Philippines19,300m3/h
USA157,000m3/h
Production Capacity for Liquefied Gases (Oxygen, Nitrogen and Argon) in Fiscal 2009 (Estimate)
Capacity (m3/h) Share of total (%)
Japan 168,500 40.5%North America 157,000 37.8%Rest of Asia 90,000 21.7%Total 415,500 100.0%

16
Gas BusinessIn fiscal 2009, shipments and sales of mainstay oxygen and argon were down from the previous period. The decline occurred despite robust results in Japan and overseas in the first half, including the positive impact of M&A activities, and was due largely to a steep decline in demand in the second half as the financial and economic crises sweeping world markets spread into a global economic downturn. The drop in domestic demand was particularly abrupt and reflected production cuts by customers in the wake of inventory adjustments.
The decline in shipments and sales of oxygen reflected a sharp drop in demand from major customer industries, including steel and chemicals. Shipments and sales of nitrogen were level with the previous fiscal year, as demand remained firm, particularly from the chemicals and electronics industries, where applications include ensuring product safety, purging and enhancing product quality. Shipments and sales of argon fell, reflecting plummeting demand for stainless steel smelting and welding applica-tions, as well as for use in production of silicon crystals, among others.
Owing to these and other factors, sales to outside customers in the Gas Business segment slipped 2.5%, to ¥329,813 million, and operating income declined 27.5%, to ¥22,449 million.
Segment Sales as Percentage of Consolidated Net SalesYear ended March 31¥329,813 million
Net Sales per Employee
Years ended March 31(Millions of yen)
20092008
Segment Sales as Percentage of Consolidated Net SalesYear ended March 31¥147,445 million
Net Sales per Employee
Years ended March 31(Millions of yen)
20092008
Segment Sales as Percentage of Consolidated Net SalesYear ended March 31¥18,488 million
Net Sales per Employee
Years ended March 31(Millions of yen)
20092008
0
20
40
60
0
4
8
12
0
30
60
90
66.5%
29.7%
3.7%
Main Products•Oxygen•Nitrogen•Argon•Medicalgases•Specialtygases•Electronicmaterialsgases•Stableisotopes
Topics•Reinforcedelectronicmaterialsgasesbusiness•IncreasedinvestmentsinAsia•CompletedKawaguchiSogoGasCenter,Japan’s
largest gas filling plant•AcquiredValleyNationalGasesLLC,thelargest
independent distributor of industrial gases in the United States, thereby facilitating expansion of operations across the country
R&D Highlights•Commencedproductionofhydrogen
selenide, used in compound solar cells•Launchedfour-yearjointprogramwith
IBM to develop next-generation semiconductor materials, including materials gases, and semiconductor process technologies
Plant and Gas Equipment BusinessDespite favorable gains in orders for major projects in the domestic market, sales of electronics-related equipment fell substantially below the fiscal 2008 level. This trend reflected the sharp deterioration of economic conditions in the second half, which pushed down demand both in Japan and overseas from manufacturers of digital house-hold electronic appliances and of the semiconductors and liquid crystals used therein.
Sales of compound semiconductor fabrication equipment remained firm, although demandfrommanufacturersofwhitelight-emittingdiodes(LEDs)usedinLCDbacklightsand standard lighting equipment—seen as a growth market—flagged. Inquiries regard-ing this equipment for major mass-production applications have since picked up again, however, and expectations remain high that orders will increase once the economy has bottomed out.Asaconsequence,salestooutsidecustomersinthePlantandGasEquipment
Business segment dipped 2.8%, to ¥147,445 million, while operating income rose 11.4%, to ¥11,587 million.
Segment Sales as Percentage of Consolidated Net SalesYear ended March 31¥329,813 million
Net Sales per Employee
Years ended March 31(Millions of yen)
20092008
Segment Sales as Percentage of Consolidated Net SalesYear ended March 31¥147,445 million
Net Sales per Employee
Years ended March 31(Millions of yen)
20092008
Segment Sales as Percentage of Consolidated Net SalesYear ended March 31¥18,488 million
Net Sales per Employee
Years ended March 31(Millions of yen)
20092008
0
20
40
60
0
4
8
12
0
30
60
90
66.5%
29.7%
3.7%
Main Products•Large-scaleairseparationplants•Compactnitrogengenerators•High-puritygasproductionequipment•Exhaustgasprocessingequipment•Metalorganicvapordeposition(MOCVD)equipment•Cuttingandweldingequipment
Topics•Soughttocultivatenewmarketsinthesemiconductor
fabrication field by focusing on usefulness of products in responding to environmental concerns
•Intheareaofelectronics,promotedinvestmentinnew production facility-related project with our major customer
•EnteredalliancewithKoikeSansoKogyoCo.,Ltd.,with the aim of establishing a development and production joint venture in the area of cutting and welding equipment
•Proceededwithconstructionoflarge-scaleairseparationplantinChina’sDalianChangxingIslandHarbor Industrial Zone with the aim of commencing production of industrial gases by the end of 2009
R&D Highlights•Endeavoredtomaterializealarge-sized
refrigeration unit using neon as refrigerant•Developedandsuccessfullycompleted
performance tests for new biogas concentratordevelopedjointlywithJapan’sResearch Institute of Innovative Technology fortheEarth(RITE),commercializationofwhich is slated for fiscal 2010
•Commencedjointdevelopmentof high-brightnessgreenLEDdevicewithIMECofBelgium
Housewares Business and OthersThermosK.K.spearheadsthemanufactureandsaleofhousewares.Infiscal2009,sales of these products were up from the previous fiscal year, reflecting brisk sales of new products and firm shipments of mainstay vacuum insulated sports bottles, personal-sizedinsulatedmugsandthermalcookers.
As a result of such factors, the Housewares Business and Others segment reported a 4.7% increase in sales, to ¥18,488 million. Segment operating income rose 15.5%, to ¥2,232 million.
Segment Sales as Percentage of Consolidated Net SalesYear ended March 31¥329,813 million
Net Sales per Employee
Years ended March 31(Millions of yen)
20092008
Segment Sales as Percentage of Consolidated Net SalesYear ended March 31¥147,445 million
Net Sales per Employee
Years ended March 31(Millions of yen)
20092008
Segment Sales as Percentage of Consolidated Net SalesYear ended March 31¥18,488 million
Net Sales per Employee
Years ended March 31(Millions of yen)
20092008
0
20
40
60
0
4
8
12
0
30
60
90
66.5%
29.7%
3.7%
Main Products•Stainlesssteelvacuumbottles•Cookingimplements•Professional-usecookingimplements
Topics•Introducedfivenewdesignstoitslineupofhighly
popular insulated, vacuum sports bottles•Launchedtwonewinsulatedlunchboxesfor
Japanese-style boxed lunches with outstanding thermal-insulating properties
•Unveiledtwonewultralight,compactmodelsintheKeitai Mug line of insulated mugs
•Introducedtwoinsulatedshoppingbagswithhighcold-insulating properties
R&D Highlight•Continuedtocapitalizeonproprietary
thermal insulation and metal processing technologies to develop innovative products
Note: Taiyo Nippon Sanso had a total of 8,471 employees. Of these, 528 employees in administrative and technical departments that are not assigned to a specific segment are not included in the calculations for sales per employee in each segment.
Segment Overview

1717
Gas BusinessIn fiscal 2009, shipments and sales of mainstay oxygen and argon were down from the previous period. The decline occurred despite robust results in Japan and overseas in the first half, including the positive impact of M&A activities, and was due largely to a steep decline in demand in the second half as the financial and economic crises sweeping world markets spread into a global economic downturn. The drop in domestic demand was particularly abrupt and reflected production cuts by customers in the wake of inventory adjustments.
The decline in shipments and sales of oxygen reflected a sharp drop in demand from major customer industries, including steel and chemicals. Shipments and sales of nitrogen were level with the previous fiscal year, as demand remained firm, particularly from the chemicals and electronics industries, where applications include ensuring product safety, purging and enhancing product quality. Shipments and sales of argon fell, reflecting plummeting demand for stainless steel smelting and welding applica-tions, as well as for use in production of silicon crystals, among others.
Owing to these and other factors, sales to outside customers in the Gas Business segment slipped 2.5%, to ¥329,813 million, and operating income declined 27.5%, to ¥22,449 million.
Main Products•Oxygen•Nitrogen•Argon•Medicalgases•Specialtygases•Electronicmaterialsgases•Stableisotopes
Topics•Reinforcedelectronicmaterialsgasesbusiness•IncreasedinvestmentsinAsia•CompletedKawaguchiSogoGasCenter,Japan’s
largest gas filling plant•AcquiredValleyNationalGasesLLC,thelargest
independent distributor of industrial gases in the United States, thereby facilitating expansion of operations across the country
R&D Highlights•Commencedproductionofhydrogen
selenide, used in compound solar cells•Launchedfour-yearjointprogramwith
IBM to develop next-generation semiconductor materials, including materials gases, and semiconductor process technologies
Plant and Gas Equipment BusinessDespite favorable gains in orders for major projects in the domestic market, sales of electronics-related equipment fell substantially below the fiscal 2008 level. This trend reflected the sharp deterioration of economic conditions in the second half, which pushed down demand both in Japan and overseas from manufacturers of digital house-hold electronic appliances and of the semiconductors and liquid crystals used therein.
Sales of compound semiconductor fabrication equipment remained firm, although demandfrommanufacturersofwhitelight-emittingdiodes(LEDs)usedinLCDbacklightsand standard lighting equipment—seen as a growth market—flagged. Inquiries regard-ing this equipment for major mass-production applications have since picked up again, however, and expectations remain high that orders will increase once the economy has bottomed out.Asaconsequence,salestooutsidecustomersinthePlantandGasEquipment
Business segment dipped 2.8%, to ¥147,445 million, while operating income rose 11.4%, to ¥11,587 million.
Main Products•Large-scaleairseparationplants•Compactnitrogengenerators•High-puritygasproductionequipment•Exhaustgasprocessingequipment•Metalorganicvapordeposition(MOCVD)equipment•Cuttingandweldingequipment
Topics•Soughttocultivatenewmarketsinthesemiconductor
fabrication field by focusing on usefulness of products in responding to environmental concerns
•Intheareaofelectronics,promotedinvestmentinnew production facility-related project with our major customer
•EnteredalliancewithKoikeSansoKogyoCo.,Ltd.,with the aim of establishing a development and production joint venture in the area of cutting and welding equipment
•Proceededwithconstructionoflarge-scaleairseparationplantinChina’sDalianChangxingIslandHarbor Industrial Zone with the aim of commencing production of industrial gases by the end of 2009
R&D Highlights•Endeavoredtomaterializealarge-sized
refrigeration unit using neon as refrigerant•Developedandsuccessfullycompleted
performance tests for new biogas concentratordevelopedjointlywithJapan’sResearch Institute of Innovative Technology fortheEarth(RITE),commercializationofwhich is slated for fiscal 2010
•Commencedjointdevelopmentof high-brightnessgreenLEDdevicewithIMECofBelgium
Housewares Business and OthersThermosK.K.spearheadsthemanufactureandsaleofhousewares.Infiscal2009,sales of these products were up from the previous fiscal year, reflecting brisk sales of new products and firm shipments of mainstay vacuum insulated sports bottles, personal-sizedinsulatedmugsandthermalcookers.
As a result of such factors, the Housewares Business and Others segment reported a 4.7% increase in sales, to ¥18,488 million. Segment operating income rose 15.5%, to ¥2,232 million.
Main Products•Stainlesssteelvacuumbottles•Cookingimplements•Professional-usecookingimplements
Topics•Introducedfivenewdesignstoitslineupofhighly
popular insulated, vacuum sports bottles•Launchedtwonewinsulatedlunchboxesfor
Japanese-style boxed lunches with outstanding thermal-insulating properties
•Unveiledtwonewultralight,compactmodelsintheKeitai Mug line of insulated mugs
•Introducedtwoinsulatedshoppingbagswithhighcold-insulating properties
R&D Highlight•Continuedtocapitalizeonproprietary
thermal insulation and metal processing technologies to develop innovative products
Note: Taiyo Nippon Sanso had a total of 8,471 employees. Of these, 528 employees in administrative and technical departments that are not assigned to a specific segment are not included in the calculations for sales per employee in each segment.

18
Electronics-Related BusinessAmidst advances in device integration and the use of thin films in semiconductors and the increasing size of LCD panels, and with rising demand for photovoltaic power generation as a viable alternative energy and LEDs to reduce energy consumption, electronics-related firms face growing pressure to achieve higher
quality and production effi-ciency. Taiyo Nippon Sanso helps such firms by supply-ing, via pipeline, high-purity nitrogen, an inert gas that is essential to semiconductor device, LCD and other manufacturing processes. We also deliver stable sup-plies of electronic materials gases used in film deposition and other processes.
In constructing special piping, we draw on our industrial gas supply technologies to facilitate the installation of environment-friendly gas purification and abatement sys-tems in optimal locations. We also provide remote monitoring of safety levels and design alarm systems as part of our broad range of solutions for semiconductor and LDC manufacturing processes.
We operate in Japan and around the world as a part-ner to electronics manufacturers. We produce and sell high-purity industrial gases, electronic materials gases and electronics-related equipment to customers in the United States, Taiwan, China, Singapore and the Philippines.
Our Businesses
Fiscal 2009 sales Approximately ¥134,100 million
Principal products and operations
High-purity nitrogen and argon Electronicmaterialsgases,includingSafeDeliverySource(SDS)MOCVDequipmentGas purification, abatement and other systems High-purity gas supply facility installation and construction
Market needs Comprehensive gas supplies Total gas and equipment solutions
Competitive advantages Strong ties with domestic electronics manufacturersClose relationships with users who employ advanced technologies • Superior marketing strength through the provision of total solutions for gas and • equipment Comprehensive, world-class technologies • Engineeringoperationsandgascenternetwork• Supplystructurecoveringkeyworldmarkets—Japan,EastAsia (SouthKorea,China• andTaiwan),SoutheastAsia,theUnitedStatesandEurope
Fiscal 2009 highlights Commenced joint development of next-generation semiconductor process • technologies with IBMReleasedUR25K,astate-of-the-artlarge-scaleMOCVDsystem• Commenced joint development of manufacturing technology for high-brightness • greenLEDdevicewith IMEC, aBelgian researchorganization specializing in next-generation chemical compound semiconductor technologiesLaunchedjointmonosilaneproductionprojectwithEvonikDegussaJapanCo.,Ltd.• Reinforced semiconductor specialty gases supply capabilities of Nippon Oxygen Sdn • Bhd,asubsidiaryofoursubsidiaryNationalOxygenPteLtd.
Sales of Electronics-Related BusinessYears ended March 31
Billions of yen
Sales of Gas Business
Years ended March 31
Billions of yen
Sales of Onsite and Plant BusinessYears ended March 31
Billions of yen
Sales of Medical-Related BusinessYears ended March 31
Billions of yen
Sales of LP Gas Business
Years ended March 31
Billions of yen
20092008 20092008 20092008 20092008
23113.8141 64
50
0
10
20
30
40
50
60
70
2011(Target)
2009
134229
70
13.745
0
40
80
120
160
0
50
100
150
200
250
0
4
8
12
16
0
10
20
30
40
50

19
Taiyo Nippon Sanso supplies oxygen, nitrogen, argon and a host of other industria l gases that are indispensable to advanced production activities of modern industry, including cutting, welding,
c o m b u s t i n g , m e l t i n g , chilling and freezing. We supply these gases in safe f o r m s , i n c l u d i n g v i a pipeline, tanker truck and cylinder.
We have built a strong technological base over m a n y y e a r s , g a i n i n g particular expertise in low- temperature, high-pressure, separation, vacuum and gas control technologies.
Drawing on these capabilities, we provide a diverse range of equipment for the manufacture, supply, transport and storage of various types of gases. In these ways, we help industrial customers enhance their productivity and quality while supporting efforts to improve the environment. In addit ion to maintaining the largest industrial gas supply network in Japan, we are expanding our manufacturing and supply bases in the United States as well as in China and other parts of Asia.
Gas Business
Sales of Electronics-Related BusinessYears ended March 31
Billions of yen
Sales of Gas Business
Years ended March 31
Billions of yen
Sales of Onsite and Plant BusinessYears ended March 31
Billions of yen
Sales of Medical-Related BusinessYears ended March 31
Billions of yen
Sales of LP Gas Business
Years ended March 31
Billions of yen
20092008 20092008 20092008 20092008
23113.8141 64
50
0
10
20
30
40
50
60
70
2011(Target)
2009
134229
70
13.745
0
40
80
120
160
0
50
100
150
200
250
0
4
8
12
16
0
10
20
30
40
50
Fiscal 2009 sales Approximately ¥228,800 million
Principal products and operations
Oxygen, nitrogen, argon, carbon dioxide, hydrogen, helium and other industrial gases Gas supply (filling, transport, storage) equipment, facilities installation and constructionGasequipment(includingforcutting,welding,combustionandfreezing)
Market needs Use of gases to raise productivity, enhance quality, save energy and enhance the environment Optimal, stable, economic supply of gases
Competitive advantages Japan’s largestandstrongest industrialgasproducer,offering increasedcostadvantagesand price competitiveness
Production and sales capabilities• Balanced, nationwide network of production basesLiquidgasproductioncapacityequivalentto30%ofthedomesticmarket
Logisticscapabilities• Approximately 500 filling stations capable of serving approximately 40% of the domestic marketTanker truck fleet and extensive network of shipping basesGrowing marketing network, including around 250 sales agents
Further strengthening of operations in China and other parts of Asia, as well as in the United StatesCurrentlyinvolvedinprojecttomanufactureindustrialgasesinChina’sDalianChanxing• Island Harbor Industrial ZoneEstablishedunassailablemarketpositionsinthePhilippines,VietnamandSingapore• Promoting M&A activities and construction of gas production facilities in the United • States
High market shares for other industrial gasesIn Japan, number 1 in carbon dioxide, number 1 in helium and number 2 in acetylene•
Fiscal 2009 highlights AcquiredValleyNationalGasesLLC, the largest independentdistributor of industrial• gases in the United StatesAcquired Aeris, Inc., the largest gas manufacturer in northern California• CompletedKawaguchiSogoGasCenter,Japan’slargestgasfillingplant•

20
Fiscal 2009 sales Approximately ¥70,100 million
Principal operations Onsite:
Plant:
Supplies of oxygen, nitrogen, argon and other gases by pipeline
Cryogenic air separation plants, pressure swing adsorption (PSA) air separation plants/cryogenic vacuum equipment and other chemical equipment
Market needs Onsite:
Plant:
Large,stablesupplysystems
Production and installation of high-performance facilities
Competitive advantages With onsite and plant businesses, Taiyo Nippon Sanso can provide support for both plants and engineering on a global scale, drawing on its capabilities as a manufacturer of industrial gases
Abilitytooptimizefacilitiesandoperatingefficiency•
Fiscal 2009 highlights Completing two air separation plants with capacity of 18,000 m• 3 per hour in the American states of Iowa and Texas, both of which will go into operation by the end of 2009
Completing air separation plant with capacity of 8,000 m• 3 per hour inChina’sDalianChanxing Island Harbor Industrial Zone
Focused on securing new demand for gases and expanding sales in overseas markets; • endeavored to expand scale by reducing plant costs per unit of production
Onsite and Plant BusinessIn the onsite business, Taiyo Nippon Sanso constructs large cryogenic air separation plants on the premises of major industrial gas users, notably steel mills and chemical complexes. The largest of our plants can pro-duce up to 65,000 Nm3 of gas per hour. We also pro-vide stable supplies of oxygen and nitrogen through
our pipelines. Our onsite business operates around the clock every day of the year, ensuring consistent supplies of large volumes of indus-trial gases and earning us the trust of steelmakers and chemical manufacturers.
In our plant business, we build a wide range of air separation plants, which form the foundation of the industrial gases business. We draw on our expertise in industrial gas production and supply not only to serve industrial gas producers but also to build a strong track record in manufacturing air separation plants, many of which we export around the globe. In addition, we supply many different types of experimental equip-ment, including space simulation chambers, which replicate the condi-tions of outer space. We also supply e q u i p m e n t f o r explor ing bas ic physics and discov-ering new func-tional materials.
Sales of Electronics-Related BusinessYears ended March 31
Billions of yen
Sales of Gas Business
Years ended March 31
Billions of yen
Sales of Onsite and Plant BusinessYears ended March 31
Billions of yen
Sales of Medical-Related BusinessYears ended March 31
Billions of yen
Sales of LP Gas Business
Years ended March 31
Billions of yen
20092008 20092008 20092008 20092008
23113.8141 64
50
0
10
20
30
40
50
60
70
2011(Target)
2009
134229
70
13.745
0
40
80
120
160
0
50
100
150
200
250
0
4
8
12
16
0
10
20
30
40
50

21
Fiscal 2009 sales Approximately ¥13,700 million
Principal products Medical-related oxygen and other gases
Synthesized(pure)airsupplyfacilities,portableoxygencylindersandmedical-useoxygencompressors
Stable isotopes
Market needs Quality control and assurance for medical-use gases
Mass production and ongoing supply of stable isotopes used in cancer diagnostic agents
Competitive advantages Productionandsaleofpharmaceuticalingredientsforpositronemissiontomography(PET)diagnostics
Strong position as manufacturer of Water–180, a pharmaceutical ingredient for reagents • usedinPETdiagnostics,witha70%domesticmarketshare
Have commenced shipments of world-class pharmaceutical ingredients to leading • manufacturersoffluorodeoxyglucose(FDG)PETreagentsinEuropeandtheUnitedStates
Reliable systems for manufacture and sale of pharmaceutical products
Continue to gather safety information and data•
Fiscal 2009 highlights EstablishedT-IMedicalCo., Ltd.,with the aimof strengtheninghomehealth care• businessintheKansaiarea
Brought TN-Medical Inc. andSEEDVESTCo., Ltd., into theGroup; beganoffering• installation and inspection and maintenance services for gas piping in hospitals
CommencedsterilizingservicestogetherwithKonoikeMedicalCo.,Ltd.•
Expandedsalesofstable isotopesandsoughtoutM&Aopportunitieswith theaimof• strengthening medical gas and equipment businesses
Developed Cryolibrary, a cryopreservation system for bioresources with automatic • storage/retrieval function
We build special filling facilities for medical gases within our industrial gas production and sales networks to ensure stable supplies of medical oxygen and other high-quality gases used by medical institutions. We help improve the safety and reliability of medical treatment by developing pure air
supply systems and other medical support equipment, as well as devices for home oxygen therapy (HOT), and through such services as regular inspection of equipment and operation of remote monitoring systems.
Applying our advanced gas-related technologies, we also make and sell stable isotopes for advanced diagnostics and treatment, as well as specialty gases.
Medical-Related Business
Sales of Electronics-Related BusinessYears ended March 31
Billions of yen
Sales of Gas Business
Years ended March 31
Billions of yen
Sales of Onsite and Plant BusinessYears ended March 31
Billions of yen
Sales of Medical-Related BusinessYears ended March 31
Billions of yen
Sales of LP Gas Business
Years ended March 31
Billions of yen
20092008 20092008 20092008 20092008
23113.8141 64
50
0
10
20
30
40
50
60
70
2011(Target)
2009
134229
70
13.745
0
40
80
120
160
0
50
100
150
200
250
0
4
8
12
16
0
10
20
30
40
50

22
Fiscal 2009 sales Approximately ¥45,100 million
Principal products and operations
Propane, butane and other liquid gases
Related equipment and devices (air conditioners, hot water heaters)
ConstructionofLPgassupplyfacilities,air-conditioningfacilities
Market needs StablesupplyofLPgasto25millionhouseholdsinareasnotservedbytowngasservices
Competitive advantages 400,000-tonLPgassupplycapacitynationwide(rankedseventhinJapan)
Fiscal 2009 highlights SubsidiarySaanGasCo.,Ltd., introduced rawmaterialspriceadjustmentsystem,• enhancing transparency of pricing to customers
IntegratedsalescompaniesintheKantoregion•
Strove to achieve goal of 100,000 direct sales outlets through M&As and other initiatives•
LP Gas BusinessLP gas is highly valued as a clean energy source, with applications ranging from industrial to home power generation. An environment-friendly alternative to chlorofluorocarbons, LP gas is also used as an aerosol gas and as fuel for taxi fleets.
Taiyo Nippon Sanso wholesales LP gas to plants and for other industrial applica-tions, supplies taxi fueling stations and a wide range of customers, from restaurants and other commercial users to residential users. Our energy business also sells LP gas for household use to 96,000 homes throughout Japan through direct sales outlets.
With residential-use fuel cells expected to achieve increased market penetration, LP gas—which is used to fuel cells—is attracting increasing attention as an environment-friendly energy.
Sales of Electronics-Related BusinessYears ended March 31
Billions of yen
Sales of Gas Business
Years ended March 31
Billions of yen
Sales of Onsite and Plant BusinessYears ended March 31
Billions of yen
Sales of Medical-Related BusinessYears ended March 31
Billions of yen
Sales of LP Gas Business
Years ended March 31
Billions of yen
20092008 20092008 20092008 20092008
23113.8141 64
50
0
10
20
30
40
50
60
70
2011(Target)
2009
134229
70
13.745
0
40
80
120
160
0
50
100
150
200
250
0
4
8
12
16
0
10
20
30
40
50

23
Board of Directors, Corporate Auditors and Corporate Officers
Board of Directors
ChairmanHiroshi Taguchi
PresidentHirosuke Matsueda
Executive Vice PresidentYasunobu Kawaguchi
Executive Director/AdvisorKonosuke Ose
Senior Managing DirectorsKen-ichiro Ebisawa
Fumio Hara
Toyoo Go
Masashi Yamashita
Ken-ichi Kasuya
Managing DirectorsToshio Sato
Akira Ito
Shinji Tanabe
Kunishi Hazama
Tadashige Maruyama
Executive DirectorsRyuichi Tomizawa *1
William J. Kroll
Corporate Auditors
Shigeto Umatani
Kiyoshi Fujita
Keiichi Kiyota *2
Shigeru Koyama *2
Corporate Officers
Corporate Executive OfficersYoshikazu Yamano
Masayuki Tanino
Yujiro Ichihara
Shigeru Amada
Hiroshi Katsumata
Kinji Mizunoe
Masanori Zaima
Shin-ichiro Hiramine
Akihiko Umekawa
Notes: *1 Outside DirectorNotes: *2 Outside Corporate Auditor
Corporate OfficersMasakazu Naruo
Akira Nishimoto
Keiki Ariga
Masahiro Imagawa
Tetsuya Nakayama
Masami Sakaguchi
Yoichi Washizu
Susumu Naka
Yoshihide Kenmochi
Yuki Hajikano
Shigenobu Somaya
Jun Ishikawa
Takashi Tatsumi
Masahiro Sakamoto
Takashi Fukano
Masahiko Kitabatake
Mikio Yamaguchi
Hiroyuki Tanizawa
(As of June 26, 2009)

24
20092008200720062005 2009200820072006200520092008200720062005
Net Sales
(Billions of yen) (%)
Gas businessPlant and gas equipment businessHousewares business and othersOverseas sales ratio (right scale)
Operating Income
(Billions of yen) (%)
Gas businessPlant and gas equipment businessHousewares business and othersOverseas sales ratio (right scale)
Net Income
(Billions of yen) (Yen)
Net income per share (right scale)
0
10
20
30
40
50
0
9
18
27
36
45
0
5
10
15
20
25
0
11
22
33
44
55
0
100
200
300
400
500
0
6
12
18
24
30
Note: Since the merger of Nippon Sanso and Taiyo Toyo Sanso took place October 1, 2004, consolidated figures for fiscal 2005, ended March 31, 2005, exclude the figures for the former Taiyo Toyo Sanso for the six months ended September 30, 2004. Taiyo Nippon Sanso’s results for fiscal 2005 are compared to the fiscal 2004 totals of the former Nippon Sanso.
Management’s Analysis of Operating Results and Financial Position
Scope of Consolidation and Application of the Equity Method
As of March 31, 2009, the Taiyo Nippon Sanso Group consisted of Taiyo Nippon Sanso Corporation (the parent company); 71 consolidated subsidiaries (43 based in Japan and 28 based overseas); and 29 equity-method affiliates (nine based in Japan and 20 based overseas).
A total of 59 consolidated subsidiaries and 21 equity-method affiliates are accounted for in the Gas Business segment. The Plant and Gas Equipment Business segment comprises six consolidated subsidiaries, while the Housewares Business and Others segment encompasses six consolidated subsidiaries and eight equity-method affiliates.
Operating Results
In fiscal 2009, consolidated net sales slipped 2.4% from fiscal 2008, to ¥495,746 million. Cost of sales rose 2.3%, to ¥343,905 million, and selling, general and administrative expenses advanced 4.7%, to ¥122,676 million, the latter due primarily to increases in depreci-ation and amortization, and in research and development costs. Owing to such factors, operating income declined 24.8%, to ¥29,164 million, and the operating margin, at 5.9%, was down 4.7 percentage points.
Other income, a net figure, fell 67.2%, to ¥655 million. The Company also posted a spe-cial loss of ¥2,765 million. As a consequence, net income amounted to ¥16,503 million, down 24.6%. Net income per share was ¥41.21, while return on equity (ROE) was 8.6%, 2.2 percentage points less than in the previous fiscal year.

25
20092008200720062005 20092008200720062005 20092008200720062005
Total Assets
(Billions of yen)
Equity
(Billions of yen) (%)
Equity ratio (right scale)
Return on Equity (ROE) and Return on Assets (ROA)
(%)
ROEROA
0
110
220
330
440
550
0
3
6
9
12
15
0
50
100
150
200
250
0
8
16
24
32
40
Financial Position
As of March 31, 2009, total assets amounted to ¥534,350 million, down 2.4% from the fiscal 2008 year-end. This result was due largely to a decline in unrealized gains on short-term investments brought on by falling share prices, which pushed short-term investments down to ¥16,191 million. The current ratio was 125%, level with the previous fiscal year.
Property, plant and equipment, net, rose 9.5%, to ¥233,831 million. Total investments and other assets fell 20.3%, to ¥63,664 million, reflecting sluggish conditions in the stock market.
Owing to increases in notes and accounts payable—trade and short-term loans payable, total current liabilities declined 2.2%, to ¥164,965 million. Total noncurrent liabilities rose 8.9%, to ¥42,952 million, primarily reflecting an increase in long-term loans pay-able. Interest-bearing debt rose ¥31,333 mil-lion, to ¥191,074 million.
Total net assets decreased ¥23,563 million, to ¥194,250 million. As a consequence, the net assets ratio slipped 3.3 percentage points, to 33.9%, and net assets per share dropped ¥53.35, to ¥452.67.
Cash Flow Analysis
In fiscal 2009, net cash provided by operating activities amounted to ¥51,912 million, up ¥17,238 million from fiscal 2008. Principal factors contributing to this result were a ¥24,580 million decrease in notes and accounts receivable—trade. The interest cov-erage ratio was 14.7 times, up 4.4 points.
Net cash used in investing activities amounted to ¥25,956 million, down ¥701 million. This change primarily reflected ¥24,712 million in payments for purchases of property, plant and equipment, up from fiscal
2008, and an increase in purchases of invest-ment securities.
Net cash provided by financing activities, at ¥30,363 million, was up ¥3,960 million from the previous period. The factor behind this change included a rise in interest-bearing debt.
Owing to the Company’s operating, invest-ing and financing activities in fiscal 2009, cash and cash equivalents at the end of the year totaled ¥28,776 million, ¥16,067 million higher than at the fiscal 2008 year-end.

26
Business Risks
Management Policies, Business-Related Risks
Purchase of Property, Plant and EquipmentThe Company maintains large-scale gas supply facilities for major customers and needs to spend heavily to maintain and upgrade these facilities. Accordingly, interest rate trends could have a material impact on the Company’s busi-ness performance.
Reliance on Specific IndustriesThe Company supplies gases to a wide range of industries and its exposure to risks from reli-ance on specific industries is thus low. Nevertheless, changes in key electronics mar-kets (semiconductors, liquid crystals, solar cells) could have a significant impact on the Company’s business performance.
Manufacturing CostsElectricity is the major component of the cost of manufacturing such core products as oxygen, nitrogen and argon. Accordingly, a sharp increase in the price of crude oil could result in a substantial increase in electricity charges, which the Company may be unable to reflect in the pricing of its products.
Overseas FactorsThe Company maintains operations overseas, particularly in the United States and in other parts of Asia, including China, where the Company has substantial gas operations. Political and economic changes in countries where the Company has operations may have an adverse impact on its business performance.
Technical and Safety Factors
Technological DevelopmentThe creation of new products and technologies entails various uncertainties, owing to the Company’s reliance on technological develop-ment in such areas as compound semiconductors, the environment and energy.
Intellectual PropertyThe Company’s business depends on proprie-tary technological development. The Company endeavors to obtain intellectual property rights as necessary for its proprietary technological development activities. However, there are no guarantees that its technologies are completely protected.
Product Defects The Company sells high-pressure gas-related products and handles toxic and flammable gases used in electronics manufacturing
(semiconductors, liquid crystals, solar cells). While the Company strives to ensure the effec-tive management of related risks, it cannot guarantee that all of its products are free of defects.
Financial Risks and Other Factors
Foreign Exchange RiskThe Company exports products for sale outside of Japan. The Company strives to hedge foreign exchange risks by entering into forward exchange contracts and other derivatives trans-actions. However, the Company may not be able to respond to sudden fluctuations in cur-rency rates, which therefore may have an adverse impact on its business performance.
Retirement Benefit LiabilitiesA sudden deterioration in retirement plan returns resulting in an increase in retirement benefit costs may have an adverse impact on its business performance.
Natural DisastersThe occurrence of earthquakes or other natural disasters in areas where the Company has man-ufacturing facilities may damage facilities. In particular, damage to the Company’s large-scale manufacturing facilities may lead to a signifi-cant decline in production capacity and incur major recovery costs. Such factors may adversely affect the Company’s business performance.
Legal IssuesUnanticipated changes to existing laws, the introduction of new laws, particularly in coun-tries overseas where the Company maintains operations, may adversely affect the Company’s business performance. Revisions to environ-mental laws that result in a tightening of restrictions may result in an increase in costs to ensure compliance, which may also adversely affect the Company’s business performance.
Medium-Term Business PlanIn April 2008, the Company formulated a new medium-term business plan. The Company is currently devoting its best efforts toward achieving the quantitative targets of this plan. Based on the information available to manage-ment at the time the plan was formulated, these targets are judged to be appropriate. However, a number of factors—including changes in the operating environment—could render the achievement of these targets impossible.

27
Millions of yenYears ended March 31 2009 2008 2007 2006 2005 2004
Net sales ¥495,746 ¥507,718 ¥458,587 ¥397,308 ¥300,055 ¥230,272
Operating income 29,164 38,783 36,488 26,788 20,727 14,317
Net income 16,533 21,930 20,094 14,444 11,568 4,541
Selling, general and administrative
expenses/Net sales (%) 24.7% 23.1% 23.2% 24.0% 24.5% 24.1%
Return on equity (%) 8.6% 10.8% 10.6% 8.7% 8.7%2 4.9%
Return on assets (%) 3.1% 4.0% 3.6% 3.1% 3.3%2 1.8%
Capital expenditure 66,010 36,260 35,891 22,176 38,092 7,413
Depreciation and amortization 28,339 25,506 21,210 18,982 14,592 11,627
Research and development
expenses 3,936 2,903 2,713 2,223 2,056 2,296
Interest-bearing debt 191,074 159,500 152,232 122,196 122,089 86,325
Total net assets 194,250 217,813 216,068 178,055 154,207 94,802
Total assets 534,350 547,237 547,791 471,602 404,668 263,595
Yen
Per share data:
Net income1 ¥41.21 ¥54.48 ¥49.93 ¥35.45 ¥32.76 ¥15.38
Cash dividends 12.00 12.00 12.00 10.00 9.00 6.00
Times
Price earnings ratio 15.55 14.65 21.31 24.54 19.17 31.21
Notes: 1. Net income per share is computed based on the weighted average number of shares of common stock outstanding during each year, as adjusted retroactively for free share distributions made during the period.
2. ROE and ROA for fiscal 2005 are computed based on the combined net incomes of Taiyo Nippon Sanso for fiscal 2005 and the former Taiyo Toyo Sanso for the six months ended September 30, 2004.
3. Since the merger of Nippon Sanso and Taiyo Toyo Sanso took place October 1, 2004, consolidated figures for fiscal 2005 exclude the figures for the former Taiyo Toyo Sanso for the six months ended September 30, 2004. Taiyo Nippon Sanso’s results for fiscal 2005 are compared to the fiscal 2003 and 2004 totals of the former Nippon Sanso.
4. Figures given for total net assets prior to fiscal 2007 are for total shareholders’ equity.
Six-Year SummaryTaiyo Nippon Sanso Corporation and Consolidated Subsidiaries

28
Thousands of U.S. dollars Millions of yen (Note 3)March 31 2009 2008 2009
Assets
Current assets:
Cash and deposits (Note 4) ¥ 29,208 ¥ 12,971 $ 297,343
Notes and accounts receivable—trade (Note 6) 116,977 139,331 1,190,848
Merchandise and finished goods 18,108 21,187 184,343
Work in process 17,803 14,596 181,238
Raw materials and supplies 8,597 5,689 87,519
Deferred tax assets (Note 10) 6,012 7,213 61,203
Other 10,966 11,624 111,636
Allowance for doubtful accounts (1,771) (979) (18,029)
Total current assets 205,904 211,633 2,096,142
Property, plant and equipment (Notes 8, 9 and 18) 572,328 542,900 5,826,407
Accumulated depreciation (338,497) (329,396) (3,445,964)
Property, plant and equipment, net 233,831 213,504 2,380,444
Investments and other assets:
Investment securities (Note 5) 43,930 58,764 447,216
Long-term loans receivable 651 1,685 6,627
Total intangible assets 30,950 42,242 315,077
Prepaid pension cost (Note 13) 12,518 13,189 127,436
Deferred tax assets (Note 10) 2,501 2,149 25,461
Other 6,753 6,083 68,747
Valuation allowance for investments (1,430) (980) (14,558)
Allowance for doubtful accounts (1,258) (1,033) (12,807)
Total investments and other assets 94,615 122,099 963,199
Total assets ¥534,350 ¥547,237 $5,439,784
See notes to consolidated financial statements.
Consolidated Balance SheetsTaiyo Nippon Sanso Corporation and Consolidated Subsidiaries
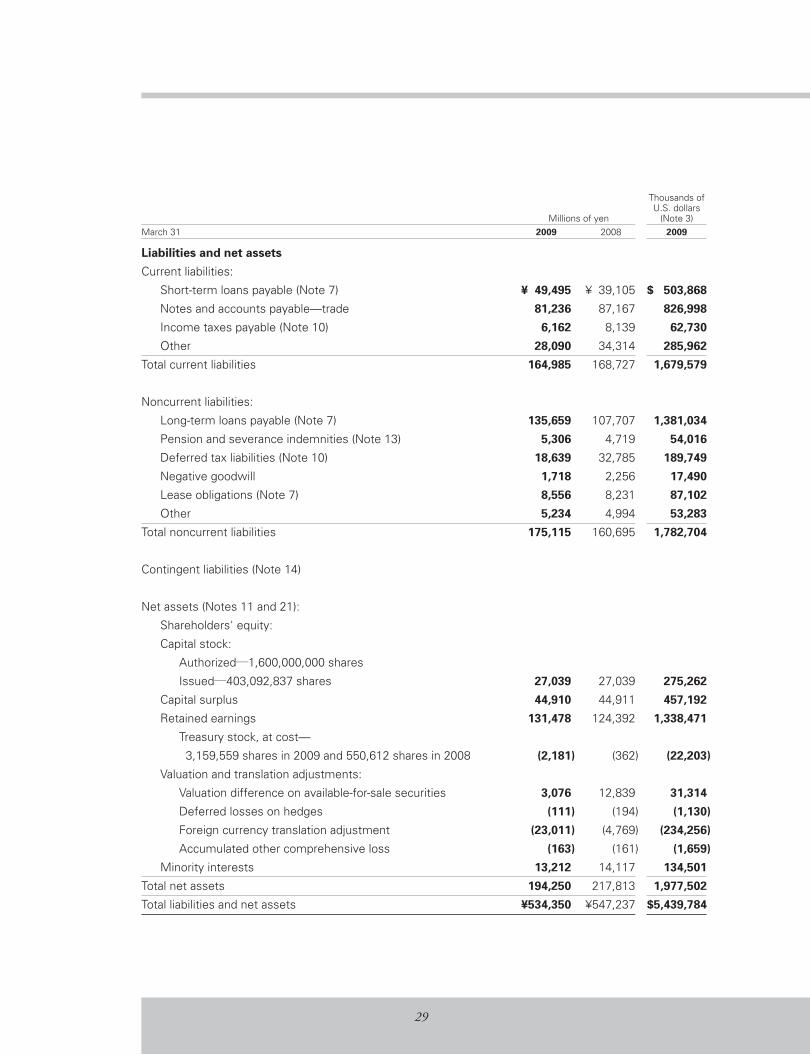
29
Thousands of U.S. dollars Millions of yen (Note 3)March 31 2009 2008 2009
Liabilities and net assets
Current liabilities:
Short-term loans payable (Note 7) ¥ 49,495 ¥ 39,105 $ 503,868
Notes and accounts payable—trade 81,236 87,167 826,998
Income taxes payable (Note 10) 6,162 8,139 62,730
Other 28,090 34,314 285,962
Total current liabilities 164,985 168,727 1,679,579
Noncurrent liabilities:
Long-term loans payable (Note 7) 135,659 107,707 1,381,034
Pension and severance indemnities (Note 13) 5,306 4,719 54,016
Deferred tax liabilities (Note 10) 18,639 32,785 189,749
Negative goodwill 1,718 2,256 17,490
Lease obligations (Note 7) 8,556 8,231 87,102
Other 5,234 4,994 53,283
Total noncurrent liabilities 175,115 160,695 1,782,704
Contingent liabilities (Note 14)
Net assets (Notes 11 and 21):
Shareholders' equity:
Capital stock:
Authorized―1,600,000,000 shares
Issued―403,092,837 shares 27,039 27,039 275,262
Capital surplus 44,910 44,911 457,192
Retained earnings 131,478 124,392 1,338,471
Treasury stock, at cost—
3,159,559 shares in 2009 and 550,612 shares in 2008 (2,181) (362) (22,203)
Valuation and translation adjustments:
Valuation difference on available-for-sale securities 3,076 12,839 31,314
Deferred losses on hedges (111) (194) (1,130)
Foreign currency translation adjustment (23,011) (4,769) (234,256)
Accumulated other comprehensive loss (163) (161) (1,659)
Minority interests 13,212 14,117 134,501
Total net assets 194,250 217,813 1,977,502
Total liabilities and net assets ¥534,350 ¥547,237 $5,439,784

30
Thousands of U.S. dollars Millions of yen (Note 3)Years ended March 31 2009 2008 2009
Net sales ¥495,746 ¥507,718 $5,046,788
Cost of sales (Note 16) 343,905 351,789 3,501,018
Gross profit 151,841 155,928 1,545,770
Selling, general and administrative expenses (Note 16) 122,676 117,145 1,248,865
Operating income 29,164 38,783 296,895
Other income (expenses): Interest and dividend income 1,313 1,391 13,367
Interest expenses (3,504) (3,453) (35,671)
Amortization of negative goodwill 667 571 6,790
Gain on sales of noncurrent assets (Note 17) 354 1,334 3,604
Loss on sale and retirement of noncurrent assets (Note 17) (916) (785) (9,325)
Foreign exchange losses (824) (102) (8,388)
Gain on sales of investment securities 9 277 92
Loss on sales of investment securities — (29) —
Loss on valuation of investment securities (209) (105) (2,128)
Loss on valuation of golf club memberships (81) (88) (825)
Gain on sales of golf club memberships 2 — 20
Loss on sales of golf club memberships — (14) —
Gain on sales of subsidiaries and affiliates’ stocks 9 — 92
Equity in earnings of affiliates 1,333 1,305 13,570
Impairment loss (Note 18) (141) (49) (1,435)
Loss on liquidation of subsidiaries and affiliates — (1,001) —
Loss on revaluation of investments (450) (50) (4,581)
Merger expense — (295) —
Gain on revaluation of investments — 352 —
Compensation for transfer — 35 —
Reversal of allowance for doubtful accounts 278 — 2,830
Provision of allowance for doubtful accounts (722) — (7,350)
Loss on revision of retirement benefit plan (333) — (3,390)
Early extra retirement payments (311) — (3,166)
Expenses for integration — (42) —
Other 200 467 2,036
(3,325) (281) (33,849)
Income before income taxes and minority interests 25,839 38,502 263,046
Income taxes (Note 10): Current 12,332 16,205 125,542
Deferred (4,089) (1,047) (41,627)
8,243 15,157 83,915
Minority interests in income 1,062 1,413 10,811
Net income ¥ 16,533 ¥ 21,930 $ 168,309
U.S. dollars Yen (Note 3)
Amounts per share: Net assets ¥452.67 ¥506.02 $4.61
Net income 41.21 54.48 0.42
Cash dividends 12.00 12.00 0.12
See notes to consolidated financial statements.
Consolidated Statements of IncomeTaiyo Nippon Sanso Corporation and Consolidated Subsidiaries

31
Millions of yen Number of Valuation Deferred Foreign Accumulated shares of difference on gains or currency other common Common Capital Retained Treasury available-for- losses on translation comprehensive Minority Total stock stock surplus earnings stock sale securities hedges adjustments loss interests net assets
Balance at March 31, 2007 403,092,837 ¥27,039 ¥44,746 ¥107,495 ¥ (376) ¥24,982 ¥ 56 ¥ (2,535) ¥(111) ¥14,770 ¥216,068 Disposal of treasury stock — — 164 — 211 — — — — — 375 Change of scope of consolidation (increase) — — — 81 — — — — — — 81 Change of scope of equity method — — — 136 — — — — — — 136 Dividends from surplus — — — (5,233) — — — — — — (5,233) Other — — — (18) — — — — — — (18) Net income — — — 21,930 — — — — — — 21,930 Purchase of treasury stock — — — — (196) — — — — — (196) Net changes of items other than shareholders’ equity — — — — — (12,143) (251) (2,233) (49) (653) (15,329)Balance at March 31, 2008 403,092,837 ¥27,039 ¥44,911 ¥124,392 ¥ (362) ¥12,839 ¥(194) ¥ (4,769) ¥(161) ¥14,117 ¥217,813 Disposal of treasury stock — — (0) — 35 — — — — — 34
Change of scope of consolidation (decrease) — — — (99) — — — — — — (99)
Decrease due to merger — — — (10) — — — — — — (10)
Effect of changes in accounting policies applied to foreign subsidiaries — — — (4,506) — — — — — — (4,506)
Dividends from surplus — — — (4,830) — — — — — — (4,830)
Net income — — — 16,533 — — — — — — 16,533
Purchase of treasury stock — — — — (1,854) — — — — — (1,854)
Net changes of items other than shareholders’ equity — — — — — (9,762) 83 (18,242) (2) (904) (28,828)
Balance at March 31, 2009 403,092,837 ¥27,039 ¥44,910 ¥131,478 ¥(2,181) ¥ 3,076 ¥(111) ¥(23,011) ¥(163) ¥13,212 ¥194,250
Thousands of U.S. dollars (Note 3) Valuation Deferred Foreign Accumulated difference on gains or currency other Common Capital Retained Treasury available-for- losses on translation comprehensive Minority Total stock surplus earnings stock sale securities hedges adjustments loss interests net assets
Balance at March 31, 2008 $275,262 $457,202 $1,266,334 $ (3,685) $130,703 $(1,975) $ (48,549) $(1,639) $143,714 $2,217,378 Disposal of treasury stock — (0) — 356 — — — — — 346
Change of scope of consolidation (increase) — — (1,008) — — — — — — (1,008)
Decrease due to merger — — (102) — — — — — — (102)
Effect of changes in accounting policies applied to foreign subsidiaries — — (45,872) — — — — — — (45,872)
Dividends from surplus — — (49,170) — — — — — — (49,170)
Net income — — 168,309 — — — — — — 168,309
Purchase of treasury stock — — — (18,874) — — — — — (18,874)
Net changes of items other than shareholders’ equity — — — — (99,379) 845 (185,707) (20) (9,203) (293,474)
Balance at March 31, 2009 $275,262 $499,949 $1,338,471 $(22,203) $ 31,314 $(1,130) $(234,256) $(1,659) $134,501 $1,977,502
See notes to consolidated financial statements.
Consolidated Statements of Changes in Net AssetsTaiyo Nippon Sanso Corporation and Consolidated Subsidiaries

32
Thousands of U.S. dollars Millions of yen (Note 3)Years ended March 31 2009 2008 2009
Operating activitiesIncome before income taxes and minority interests ¥25,839 ¥38,502 $263,046Depreciation and amortization 28,339 25,506 288,496Impairment loss 141 49 1,435Amortization of goodwill 1,961 283 19,963Interest and dividends income (1,313) (1,392) (13,367)Interest expense 3,504 3,453 35,671Equity in earnings of affiliates (1,333) (1,305) (13,570)Gain (loss) on sales and retirement of noncurrent assets 527 (619) 5,365Gain on sales of investment securities (19) (248) (193)Decrease in accounts receivable—other 470 293 4,785Decrease (increase) in notes and accounts receivable—trade 18,962 (5,618) 193,037Decrease (increase) in advance payments 1,006 (1,513) 10,241Increase in inventories (4,970) (1,567) (50,596)Decrease in notes and accounts payable—trade (6,225) (9,272) (63,372)(Decrease) increase in accrued expenses (1,519) 3,547 (15,464)Increase in advances received 503 830 5,121Decrease (increase) in prepaid pension costs 670 (204) 6,821Increase in provision for retirement benefits 273 76 2,779Other, net 2,011 (630) 20,472
68,828 50,170 700,682Interest and dividends income received 1,767 2,895 17,988Interest expenses paid (3,541) (3,368) (36,048)Income taxes paid (15,141) (15,023) (154,138)
Net cash provided by operating activities 51,912 34,674 528,474
Investing activities Increase in short-term investments 168 671 1,710Purchases of property, plant and equipment (58,703) (33,991) (597,608)Proceeds from sales of property, plant and equipment 1,000 1,892 10,180Purchases of intangible assets (1,426) (2,340) (14,517)Purchases of investment securities (5,833) (2,710) (59,381)Proceeds from sales of investment securities 102 1,720 1,038Payments for assets purchase (5,425) — (55,228)Purchase of investments in subsidiaries resulting in change in scope of consolidation — (3,261) —Payments of loans receivable (30) (2,287) (305)Other, net 48 (23) 489
Net cash used in investing activities (70,100) (40,330) (713,631)
Financing activities Net increase in short-term loans payable 10,136 8,159 103,186Net decrease in commercial papers (4,000) (1,000) (40,721)Proceeds from long-term loans payable 57,875 18,980 589,178Repayment of long-term loans payable (22,172) (16,560) (225,715)Proceeds from issuance of common stock — 241 —Proceeds from issuance of bonds — 10,000 —Redemption of bonds — (10,000) —Repayments of lease obligations (990) (602) (10,078)Cash dividends paid (4,831) (5,233) (49,180)Cash dividends paid to minority shareholders (280) (208) (2,850)Purchase of treasury stock (1,852) (194) (18,854)Proceeds from sales of treasury stock 74 16 753
Net cash provided by financing activities 33,960 3,597 345,719
Effect of exchange rate change on cash and cash equivalents (499) (33) (5,080)
Net increase (decrease) in cash and cash equivalents 15,273 (2,091) 155,482Cash and cash equivalents at beginning of period 12,709 14,404 129,380Increase in cash and cash equivalents resulting from change of scope of consolidation 777 396 7,910Increase in cash and cash equivalents resulting from merger with unconsolidated subsidiaries 15 — 153
Cash and cash equivalents at end of period (Note 4) ¥28,776 ¥12,709 $292,945
See notes to consolidated financial statements.
Consolidated Statements of Cash FlowsTaiyo Nippon Sanso Corporation and Consolidated Subsidiaries

33
Notes to Consolidated Financial StatementsTaiyo Nippon Sanso Corporation and Consolidated Subsidiaries
1. Basis of Consolidated Financial Statements
As permitted by the Financial Instruments and Exchange Law of Japan, amounts of less than one million yen have been omitted. As a result, the totals shown in the accompanying consolidated financial statements (both in yen and U.S. dollars) do not necessarily agree with the sums of the individual amounts. Certain amounts previously reported have been reclassified to conform to the current year presentation.
The accompanying consolidated financial statements of TAIYO NIPPON SANSO CORPORATION (the “Company”) and consoli-dated subsidiaries are prepared on the basis of accounting principles generally accepted in Japan, which are different in certain respects as to applica-tion and disclosure requirements of International Financial Reporting Standards, and are compiled from the consolidated financial statements prepared by the Company as required by the Financial Instruments and Exchange Law of Japan.
(a) Consolidation
The accompanying consolidated financial statements include the accounts of the Company and its 71 significant subsidiaries. All significant intercompany accounts and transactions have been eliminated in consolidation. In accordance with the regulations for the preparation of consolidated financial statements under the Financial Instruments and Exchange Law of Japan, investments in certain unconsoli-dated subsidiaries and significant affiliates are accounted for by the equity method of accounting. The differences at the dates of acquisition between the cost and the underlying net equity in investments in consolidated subsidiaries and the companies accounted for by the equity method are amortized equally over the years for which their effect are reasonably estimated. Investments in unconsolidated subsidiaries and affiliates other than those which are accounted for by the equity method are principally stated at cost. Effective from the beginning of the fiscal year, April 1, 2008, the Company has adopted the “Practical Solution on Unification of Accounting Policies Applied to Foreign Subsidiaries for Consolidated Financial Statements” (Practical Issues Task Force No. 18 issued by the Accounting Standards Board of Japan on May 17, 2006). As a result, the balance of consolidated retained earnings for the year ended March 31, 2009 decreased by ¥4,506 million ($45,872 thousand). In addition, operating income and income before income taxes for the year ended March 31, 2009 decreased by ¥1,420 million ($14,456 thousand), compared with the amounts that would have been reported under the previous accounting method.
The effect of the adoption of this accounting standard on the segment information is described in the relevant section.
(b) Cash equivalents
For purposes of the statements of cash flows, the Company considers all highly liquid instruments with maturity of three months or less when purchased to be cash equivalents.
(c) Marketable and investment securities
Marketable securities and investments in securities are classified into three categories: trading securities, held-to-maturity securities and other securities. The Company and certain of its subsidiaries have marketable securities classified as other securities, which are carried at fair value with any changes in valuation difference on available-for-sale securities, net of the applicable income taxes, reported as a separate component of net assets. Non-marketable securities classified as other securities are carried at cost. Under the Corporate Law of Japan, unreal-ized gain or loss on other securities, net of the applicable income taxes, is not available for distribution as dividends.
(d) Inventories
Inventories of the Company and its domestic subsidiaries are stated at cost, determined by the weighted-average method, specific identification method or the moving-average method (lower than book value due to a decline in profitability). As for overseas consolidated subsidiaries, inventories are stated at the lower of cost or market, cost being determined by the first-in first-out method.
2. Summary of Significant Accounting Policies

34
(Change in accounting policy)Effective from the beginning of the fiscal year, April 1, 2008, the Company has adopted the “Accounting Standard for Measurement of Inventories” (Financial Accounting Standard No. 9, issued by the Accounting Standards Board of Japan on July 5, 2006), and the method of measurement of inventories held for the purpose of ordinary sales has been changed to the cost, determined by the average method, the specific identification method, or the moving-average method. Net book value of inventories in the consolidated balance sheets is written down when their net realizable values decline. The effect of this change on the consolidated statement of income for the year ended March 31, 2009 was immaterial. The effect of the adoption of this accounting standard on the segment information is described in the relevant section.
(e) Property, plant and equipment (except for
leased assets)
Property, plant and equipment is stated at cost, and for the Company and its domestic subsidiar-ies, depreciation is computed by the straight-line method for buildings and leased equipment and by the declining balance method for other equipment based on the estimated useful lives of the respective assets. As for overseas consolidated subsidiaries, depreciation is principally computed by the straight-line method based on the estimated useful lives of the respective assets.
The useful lives are as follows: Buildings 3 to 50 years Machinery 4 to 15 years
(Supplementary information)Effective from the beginning of the fiscal year, April 1, 2008, the Company and its domestic subsidiaries have changed the estimates for useful lives of machinery pursuant to the revision to the Corporate Tax Law. As a result of this change, operating income and income before income taxes and minority interests for the year ended March 31, 2009 decreased by ¥1,907 million ($19,414 thousand), compared with the amounts that would have been reported under the previous estimates. The effect of the adoption of this accounting change on the segment information is described in the relevant section.
(f) Leases
Leased assets are initially accounted for at their acquisition costs and depreciated over the lease term by the straight-line method with no residual value.
(Changes in accounting policy)Previously, finance lease transactions that do not transfer ownership of the leased assets to the lessee followed methods applicable to ordinary operating lease transactions. Effective from the beginning of the fiscal year, April 1, 2008, however, the Company has adopted “Accounting Standard for Lease Transactions” (Financial Accounting Standard No. 13 originally issued by the First Committee of the Business Accounting Council on June 17, 1993 and revised by the Accounting Standards Board of Japan on March 30, 2007) and “Implementation Guidelines for Accounting Standards for Lease Transactions” (Financial Accounting Standard Implementation Guidelines No. 16 originally issued by the Accounting System Committee of the Japanese Institute of Certified Public Accountants on January 18, 1994 and revised by the Accounting Standards Board of Japan on March 30, 2007), and such transactions are now accounted for as ordinary sale and purchase transactions. Finance leases contracted on or before March 31, 2008 that do not deem to transfer ownership of the leased asset to the lessee are accounted for as operating lease transactions. As a result of the change, total assets increased by ¥3,900 million ($39,703 thousand) compared with the amounts that would have been reported under the previous accounting method. The effect on operating income and income before income taxes and minority interests was immaterial. The effect of the adoption of this accounting standard on the segment information is described in the relevant section.
(g) Translation of foreign currency
transactions
All monetary assets and liabilities, regardless of short-term or long-term, denominated in foreign currencies other than receivables and payables hedged by qualified foreign exchange forward contracts, are translated into yen at the exchange rates prevailing as of the fiscal year-end, and resulting gains and losses are included in income. The accounts of the overseas consolidated subsidiaries are translated into yen at the year-end exchange rates, except for net assets, which are translated at historical rates, and income statement items are translated into yen at average exchange rates during the year. Differences arising from the translations are stated under “Foreign currency translation adjustments” and minority interests in consolidated subsidiaries in the accompanying consolidated balance sheets.

35
(h) Pension and severance indemnities
Allowance for employees’ retirement benefits is recognized at the net total of the present value of the defined benefit obligation at the balance sheet date, plus any actuarial gains (less any actuarial losses) not yet recognized, minus the fair value of plan assets (if any) at the balance sheet date out of which the obligations are to be settled directly. If the amount determined above is negative (an asset), such asset should be recorded as prepaid pension expenses. Net retirement benefit expense or income is recognized at the net total of current service cost and interest cost, minus the expected return on any plan assets, minus any actuarial gains (less any actuarial losses) and past service cost recognized during the year, plus any retirement benefits paid at a lump sum. To determine the present value of a defined benefit obligation and the related current service cost and, where applicable, the past service cost, the project unit credit method are used. Actuarial gains or losses and past service cost are recognized for each defined benefit plan over a period not exceeding the expected average remain-ing service years of the employees participating in the plan. The Company and its domestic subsidiar-ies recognize actuarial gains or losses evenly over 12 to 16 years following the respective fiscal years when such gains or losses are identified. Past service cost is amortized using the straight-line method over 13 to 16 years. The Company recognized the amount of unrecognized past service cost due to the revision of the retirement rule at April 1, 2003. For transition benefit liability, the Company established the pension and severance indemnity trust by contribution of shares owned by the Company, and the remaining transition benefit liability is being recognized over a period of 15 years.
(i) Allowance for directors’ and corporate
auditors’ retirement benefits
The allowance for directors’ and corporate auditors’ retirement benefits of the Company and certain of its domestic subsidiaries is provided at the amount which would have been required to be paid if all directors and corporate auditors had voluntarily terminated their services as of the balance sheet date. This amount has been determined in accordance with the internal rules of the respective companies. The allowance included ¥410 million ($4,174 thousand) and ¥323 million for corporate officers at March 31, 2009 and 2008, respectively.
(j) Research and development expenses
Research and development expenses are charged to operations as incurred.
(k) Income taxes
Deferred tax assets and liabilities are determined based on the differences between financial report-ing and the tax bases of assets and liabilities and are measured using the enacted tax rates and laws which will be in effect when the differences are expected to reverse.
(l) Amounts per share
Presentation of diluted net income per share is not applicable as there were no potentially dilutive securities for the years ended March 31, 2009 and 2008.
(m) Allowance for doubtful accounts
To cover possible losses on collection of receivables, the Company and its domestic subsidiaries provided for an allowance with respect to specific debts of which recovery is doubtful, based on estimated write-off amounts, after considering the likelihood of recovery on an individual basis. (n) Valuation allowance for investments
To state the investment amount fairly, the allowance is provided by considering the related parties’ assets and other factors.
(o) Derivative and hedging transactions
The Company and certain of its subsidiaries have used foreign exchange forward contracts solely in order to hedge against risks of fluctuations in foreign currency exchange rates relating to its receivables and payables denominated in foreign currencies, and have used interest-rate swap agreements solely to hedge against risks of fluctuations in interest rates relating to its long-term loans payable. Also, currency exchange swap agreements have been used solely to hedge against risks of fluctuations in foreign exchange of long-term loans payable denominated in foreign currencies, in compliance with the internal rules of respective companies. Under the “Accounting Standard for Financial Instruments, (No.10 issued by the Accounting Standards Board of Japan)” derivative transactions are valued at market prices, except for hedging transactions whose gains or losses are deferred and recorded in the balance sheet until the hedged trans-actions are settled. Moreover, if interest-rate swaps in Japan are specifically tied to the hedged loan trans-actions, unrealized gains or losses on those swaps are not recognized in the consolidated financial state-ments as such gains or losses are to be offset with those on the hedged transactions. Deferred hedge accounting is applied to currency swaps. Receivables and payables hedged by qualified foreign exchange forward contracts are translated at the corresponding foreign exchange forward contract rates.

36
should not be construed as a representation that Japanese yen have been, could have been, or could in the future be converted into U.S. dollars at the above or any other rate.
3. U.S. Dollar Amounts
The translation of Japanese yen amounts into U.S. dollar amounts is included solely for convenience, as a matter of arithmetical computation only, at the rate of ¥98.23 = U.S.$1, the approximate rate of exchange at March 31, 2009. The translation
Millions of yen Thousands of U.S. dollars 2009 2009
Balance sheet Unrecognized Balance sheet Unrecognized Cost amount gain (loss) Cost amount gain (loss)
Unrecognized gain items: Stock ¥19,479 ¥24,818 ¥5,339 $198,300 $252,652 $54,352
Unrecognized loss items: Stock 567 423 (144) 5,772 4,306 (1,466)
Total ¥20,046 ¥25,241 ¥5,195 $204,072 $256,958 $52,886
5. Marketable and Investment Securities
At March 31, 2009 and 2008, information with respect to other securities for which market prices
were available was summarized as follows:
4. Cash and Cash Equivalents
The components of cash and cash equivalents at March 31, 2009 and 2008 were as follows:
Thousands of Millions of yen U.S. dollars 2009 2008 2009
Cash and deposits ¥29,208 ¥12,971 $297,343
Time deposits with maturities of more than three months (432) (261) (4,398)
¥28,776 ¥12,709 $292,945
Millions of yen 2008 Balance sheet Unrecognized Cost amount gain (loss)
Unrecognized gain items: Stock ¥15,185 ¥37,076 ¥21,890Unrecognized loss items: Stock 803 645 (158)Total ¥15,988 ¥37,721 ¥21,732
Proceeds from sales of securities classified as other securities amounted to ¥62 million ($631 thousand) and ¥782 million with an aggregate gain on sales of ¥19 million ($193 thousand) and ¥277 million for the years ended March 31, 2009 and 2008, respectively, and an aggregate loss on sales of
nil and ¥29 million for the years ended March 31, 2009 and 2008, respectively. Balance sheet amounts of non-marketable securities classified as other securities at March 31, 2009 and 2008 were as follows:
Other securities: Thousands of Millions of yen U.S. dollars 2009 2008 2009
Unlisted securities (except for OTC securities) ¥2,796 ¥2,358 $28,464
Preferred securities — — —
Preferred stock 1,000 1,000 10,180
Money market fund — — —
There are no securities with maturity dates classified as other securities at March 31, 2009.

37
6. Notes and Accounts Receivable
7. Short-Term Borrowings, Long-Term Loans Payable and Lease Obligations
(a) Notes and accounts receivable liquidated at March 31, 2009 and 2008 were as follows: Thousands of Millions of yen U.S. dollars 2009 2008 2009
Accounts receivable transferred by liquidation ¥10,280 ¥11,771 $104,652
Notes receivable transferred by liquidation 7,726 9,087 78,652
(b) Notes receivable discounted at March 31, 2009 and 2008 were as follows: Thousands of Millions of yen U.S. dollars 2009 2008 2009
Notes receivable discounted ¥20 ¥166 $204
At March 31, 2009 and 2008, short-term borrow-ings and the current portion of long-term loans
payable consisted of the following:
Thousands of Millions of yen U.S. dollars 2009 2008 2009
Bank loans ¥24,581 ¥16,593 $250,239
Current portion of long-term loans payable 9,914 22,512 100,926
0.95% unsecured bonds, payable in yen, due 2009 15,000 ― 152,703
Total ¥49,495 ¥39,105 $503,869
Thousands of Millions of yen U.S. dollars 2009 2008 2009
Loans from banks due through 2017 at average interest rates of 1.93% in 2009 and 2.29% in 2008 ¥110,659 ¥ 67,707 $1,126,530
0.95% unsecured bonds, payable in yen, due 2009 — 15,000 —
1.81% unsecured bonds, payable in yen, due 2011 15,000 15,000 152,703
1.58% unsecured bonds, payable in yen, due 2012 10,000 10,000 101,802
¥135,659 ¥107,707 $1,381,034
The annual maturities of long-term loans payable subsequent to March 31, 2009 are summarized as follows:
Thousands ofYears ending March 31 Millions of yen U.S. dollars
2010 ¥ 9,914 $ 100,9262011 22,215 226,1532012 17,668 179,8642013 20,209 205,7312014 33,608 342,1362015 and thereafter 16,959 172,646 ¥120,573 $1,227,456
The annual maturities of lease obligations subsequent to March 31, 2009 are summarized as follows:
Thousands ofYears ending March 31 Millions of yen U.S. dollars
2010 ¥ 966 $ 9,8342011 1,092 11,1172012 2,913 29,6552013 1,035 10,5372014 1,200 12,2162015 and thereafter 2,316 23,577 ¥9,522 $96,936
The average interest rates applicable to short-term loans payable outstanding at March 31, 2009 and 2008 were 2.93% and 3.75%, respectively.
Long-term loans payable at March 31, 2009 and 2008 were comprised of the following:
At March 31, 2009, commercial paper (¥1,000 million ($10,180 thousand)) with a borrowing rate of 0.54% and at March 31, 2008 commercial paper (¥5,000 million) with a borrowing rate of 0.68%
were included in other current liabilities. Short-term lease obligations of ¥966 ($9,834 thousand) were included in other current liabilities.

38
8. Pledged Assets
Assets pledged as collateral for short-term loans payable of ¥72 million ($733 thousand) and ¥235 million, long-term loans payable of ¥697 million ($7,096 thousand) and ¥780 million, and other
liabilities of ¥136 million ($1,385 thousand) and ¥308 million at March 31, 2009 and 2008, respec-tively, were as follows:
Thousands of Millions of yen U.S. dollars 2009 2008 2009
Property, plant and equipment, at net book value ¥3,176 ¥4,578 $32,332
Assets replaced by national subsidy at March 31, 2009 and 2008 were as follows: Thousands of Millions of yen U.S. dollars 2009 2008 2009
Property, plant and equipment ¥411 ¥411 $4,184
9. Assets Replaced by National Subsidy
Income taxes applicable to the Company comprise corporation, enterprise and inhabitants’ taxes, which, in the aggregate, resulted in a statutory tax rate of 40.69% for the years ended March 31, 2009 and 2008.
Significant components of the Company’s deferred tax assets and liabilities at March 31, 2009 and 2008 were as follows:
10. Income Taxes
Thousands of Millions of yen U.S. dollars 2009 2008 2009
Current deferred tax assets and liabilities
Deferred tax assets: Accrued bonus ¥2,000 ¥2,415 $20,360
Loss from valuation of inventory 310 272 3,156
Accrued expenses 1,346 1,708 13,703
Other 2,538 3,030 25,837
Deferred tax assets—subtotal 6,196 7,427 63,076
Valuation allowance (184) (212) (1,873)
Deferred tax assets—net 6,012 7,215 61,203
Deferred tax liabilities — (1) —
Net deferred tax assets ¥6,012 ¥7,213 $61,203
Deferred tax liabilities: Adjustment of allowance for doubtful accounts ¥ (24) ¥ (1) $ (244)
Deferred tax liabilities—subtotal (24) (1) (244)
Offset by deferred tax assets — 1 -Net deferred tax liabilities ¥ (24) ¥ - $ (244)

39
Thousands of Millions of yen U.S. dollars 2009 2008 2009
Noncurrent deferred tax assets and liabilities
Deferred tax assets: Depreciation ¥ 1,579 ¥ 1,059 $ 16,075
Reserve for retirement benefits 1,533 1,312 15,606
Net operating loss carryforward for tax purposes 86 100 875
Other 8,145 7,368 82,918
Deferred tax assets—subtotal 11,343 9,841 115,474
Valuation allowance (4,763) (4,095) (48,488)
Deferred tax assets—net 6,580 5,745 66,986
Deferred tax liabilities (4,079) (3,596) (41,525)
Net deferred tax assets ¥ 2,501 ¥ 2,149 $ 25,461
Deferred tax liabilities: Valuation difference on other securities ¥ (2,230) ¥ (8,959) $ (22,702)
Reserve for replacement of fixed assets (6,731) (7,852) (68,523)
Reserve for special depreciation (182) - (1,853)
Reserve for replacement of fixed assets—special (142) (415) (1,446)
Depreciation (5,542) (7,546) (56,419)
Other (7,889) (11,608) (80,312)
Deferred tax liabilities—subtotal (22,718) (36,381) (231,274)
Offset by deferred tax assets 4,079 3,596 41,525
Net deferred tax liabilities ¥(18,639) ¥(32,785) $(189,749)
2009
Statutory tax rate 40.69%
Non-deductible entertainment expenses 1.57
Dividends received and others (2.55)
Valuation allowance for deferred tax assets 2.47
Undistributed earnings of overseas affiliates (9.70)
Other (0.58)
Effective tax rate 31.90%
11. Shareholder’s Equity
(a) Dividends
Under the Corporate Law, companies can pay dividends at any time during the fiscal year in addition to the year-end dividend upon resolution at the shareholders’ meeting. For companies that meet certain criteria, such as (1) having a Board of Directors, (2) having independent auditors, (3) having a Board of Corporate Auditors, and (4) the term of service of the directors is prescribed as one year rather than two years of normal term by its articles of incorporation, the Board of
Directors may declare dividends (except for dividends in kind) if the Company has prescribed so in its articles of incorporation. The Corporate Law permits companies to distribute dividends-in-kind (non-cash assets) to shareholders subject to a certain limitation and additional requirements. Semiannual interim dividends may also be paid once a year upon resolution by the Board of Directors if the articles of incorporation of the Company so stipulate.
A reconciliation between the normal effective statutory tax rate and the actual effective tax rate reflected in the accompanying consolidated
statements of income for the year ended March 31, 2009 is as follows:
The reconciliation was omitted for the year ended March 31, 2008 because the difference was
less than 5% of the statutory tax rate.

40
12. Leases
(a) The following pro forma amounts represent the acquisition costs, accumulated depreciation and net book value of leased assets at March 31, 2009 and 2008, which would have been reflected in the consolidated balance sheets if
finance lease accounting had been applied to the finance lease transactions currently accounted for as operating leases:
Thousands of Millions of yen U.S. dollars 2009 2008 2009
Acquisition costs: Property, plant and equipment ¥9,578 ¥10,055 $ 97,506
Other assets 408 549 4,154
¥9,987 ¥10,604 $101,670
Accumulated depreciation: Property, plant and equipment ¥6,058 ¥ 5,410 $ 61,672
Other assets 248 285 2,525
¥6,307 ¥ 5,696 $ 64,206
Net book value: Property, plant and equipment ¥3,519 ¥ 4,644 $ 35,824
Other assets 160 263 1,629
¥3,680 ¥ 4,908 $ 37,463
Lease payments relating to finance lease transactions accounted for as operating leases amounted to ¥1,621 million ($16,502 thousand) and ¥1,788 million, which were equal to the
depreciation expense of the leased assets computed by the straight-line method over the respective lease terms for the years ended March 31, 2009 and 2008, respectively.
(b) Increases/decreases and transfer of
common stock, reserve and surplus
The Corporate Law requires that an amount equal to 10% of dividends must be appropriated as a legal reserve (a component of retained earnings) or as additional paid-in capital (a component of capital surplus) depending on the equity account charged upon the payment of such dividends until the total of aggregate amount of legal reserve and additional paid-in capital equals 25% of the common stock. Under the Corporate Law, the total amount of additional paid-in capital and legal reserve may be reversed without limitation. The Corporate Law also provides that common stock, legal reserve, additional paid-in capital, other capital surplus and retained earnings can be transferred among the accounts under certain conditions upon resolution of the shareholders.
(c) Treasury stock and treasury stock
acquisition rights
The Corporate Law also provides for companies to purchase treasury stock and dispose of such treasury stock by resolution of the Board of Directors. The amount of treasury stock purchased cannot exceed the amount available for distribution to the shareholders, which is determined by specific formula. Under the Corporate Law, stock acquisi-tion rights, which were previously presented as a liability, are now presented as a separate component of shareholders’ equity. The Corporate Law also provides that companies can purchase both treasury stock acquisition rights and treasury stock. Such treasury stock acquisition rights are presented as a separate component of shareholders’ equity or deducted directly from stock acquisition rights.

41
Thousands ofYear ending March 31 Millions of yen U.S. dollars
2009
2010 ¥1,400 $14,252
2011 and thereafter 2,279 23,201
Total ¥3,680 $37,463
2008 2009 ¥1,585 2010 and thereafter 3,322 Total ¥4,908
(b) Future minimum lease payments subsequent to March 31, 2009 and 2008 or non-cancelable
Future minimum lease payments (including the interest portion thereon) subsequent to March 31, 2009 and 2008 for finance lease transactions
13. Pension and Severance Indemnities
The Company has the cash balance plan (market rate-linked pension plan) and the defined contri-bution benefit plan. The Company’s domestic subsidiaries have, jointly or severally, defined benefit plans, including funded non-contributory tax-qualified retirement pension plans and a lump-sum retirement benefits plan, which together cover substantially all full-time employees who meet certain eligibility requirements.
Certain overseas subsidiaries have a defined contribution benefit plan. The funded status and amounts recognized in the accompanying consolidated balance sheets at March 31, 2009 and 2008 and the components of net retirement benefit expenses recognized in the accompanying consolidated statements of income for the years ended March 31, 2009 and 2008 are summarized as follows:
(a) Retirement benefit liabilities Thousands of Millions of yen U.S. dollars 2009 2008 2009
Projected benefit obligation ¥ 33,865 ¥ 34,008 $ 344,752 Plan assets at fair market value (27,975) (35,115) (284,791)
Unfunded retirement benefit liabilities 5,890 (1,107) 59,961
Net unrecognized actuarial losses (14,043) (7,896) (142,960)
Difference at change of accounting standard (2,777) (3,302) (28,270)
Unrecognized prior service cost 2,372 2,614 24,147
Prepaid pension cost 12,518 13,189 127,436
Allowance for employees’ retirement benefits (3,960) (3,497) (40,314)
accounted for as operating leases are summarized as follows:
operating leases are summarized as follows:
Thousands ofYear ending March 31 Millions of yen U.S. dollars
2009
2010 ¥ 1,809 $18,416
2011 and thereafter 6,572 66,904
Total ¥ 8,381 $85,320
2008 2009 ¥ 1,991 2010 and thereafter 8,540 Total ¥10,532

42
(b) Net retirement benefit expenses Thousands of Millions of yen U.S. dollars 2009 2008 2009
Current service cost ¥1,360 ¥1,531 $13,845
Interest cost 594 581 6,047
Expected return on plan assets (786) (858) (8,002)
Expense of actuarial loss 707 292 7,197
Net loss on change in accounting standard for employees’ retirement benefits 466 466 4,744
Adjustment for prior service cost (241) (241) (2,453)
Total of retirement benefit expenses ¥2,100 ¥1,772 $21,378
Other 745 785 7,584
Total ¥2,846 ¥2,557 $28,973
(c) The principal assumption used in determining retirement benefit obligations and other
components for the Company and certain of its domestic subsidiaries plans are shown below:
14. Contingent Liabilities
At March 31, 2009 and 2008, the Company and certain of its subsidiaries had contingent liabilities as guarantors of indebtedness, amounting to ¥9,214 million ($93,800 thousand) and ¥8,701 million, which included reguarantees by joint
investors amounting to ¥785 million ($7,991 thousand) and ¥743 million and commitments to guarantees amounting to ¥1,058 million ($10,771 thousand) and ¥1,244 million, respectively.
(a) Outline of transactions and conditions
The Company and certain of its subsidiaries have used foreign exchange forward contracts and interest-rate swap agreements and currency swap agreements to hedge against the risk of fluctuations in interest and currency exchange rates relating to their short-term receivables and payables and long-term loans payable. No market risk is anticipated as such deriva-tives have been entered into to offset or mitigate gains or losses resulting from the hedged loan and other transactions. The Company and these subsidiaries do not anticipate nonperformance by any of the counter-parties to the above transactions, all of whom are leading financial institutions which are deemed highly creditworthy. The Company and these subsidiaries have established rules for the authorization of derivative
transactions and related risk management rules which stipulate the limits on derivative transactions for each contract amount. All derivative transac-tions have been entered into in compliance with these rules. Risk management for derivative transactions has been under the control of the Finance Department of the Company which reports regularly or as necessary to the responsible officer.
(b) Interest-related derivatives
There were no interest-related derivatives at March 31, 2009 and 2008.
(c) Currency-related derivatives
Market value information at March 31, 2009 and 2008 is not required as all of the Company and these subsidiaries’ derivative transactions are accounted for as hedging transactions.
15. Derivative and Hedging Activities
2009 2008
Discount rate Mainly 2.0% Mainly 2.0 %Rate of return on assets Mainly 3.0% Mainly 3.0 %Period of recognition of actuarial gains or losses Mainly 12 to 16 years Mainly 12 to 16 yearsPeriod of recognition of transition gains or losses Mainly 15 years Mainly 15 yearsPeriod of recognition of prior service cost 13 to 16 years 13 to 16 yearsAllocation method of estimated retirement benefits Evenly for period Evenly for period

43
16. Research and Development Costs
Research and development costs, included in cost of sales and selling, general and administrative expenses, for the years ended March 31, 2009 and
2008 totaled ¥3,936 million ($40,069 thousand) and ¥2,903 million, respectively.
Thousands of Millions of yen U.S. dollars 2008 2007 2008
Land ¥118 ¥114 $1,201
Machinery 398 218 4,052
Thousands of Millions of yen U.S. dollars 2009 2008 2009
Land ¥354 ¥1,334 $3,604
Significant components of the gain on sale of noncurrent assets of ¥354 million ($3,604 thousand) and ¥1,334 million for the years ended
March 31, 2009 and 2008, respectively, were as follows:
Significant components of the loss on sale and retirement of noncurrent assets of ¥916 million ($9,325 thousand) and ¥785 million for the years
ended March 31, 2009 and 2008, respectively, were as follows:
17. Gain and Loss on Sale and Retirement of Noncurrent Assets
18. Impairment Loss
The Company and its subsidiaries categorize business assets by business segmentation and idle assets without a specific future use are categorized separately. For idle assets affected by a decrease of fair market value of land, the book values are written down to the recoverable amounts and such write-downs were recorded as impairment loss of ¥141 million ($1,435 thousand) (of which land accounted for ¥99 million ($1,008 thousand) and
buildings accounted for ¥41 million ($417 thousand)) and ¥49 million (all of which was land) for the years ended March 31, 2009 and 2008, respectively, due to the lack of recovery probability of market value or projected recovery probability in the near future. Recoverable amounts for relevant assets are the net selling price (selling price is based on contract, valuation by property tax or valuation by inheritance tax).

44
19. Segment Information
The business, geographical and overseas segment information of the Company and its consolidated
subsidiaries for the years ended March 31, 2009 and 2008 is summarized as follows:
(a) Business Segments
Millions of yen Plant and gas Housewares Gas equipment business EliminationsYear ended or as of March 31, 2009 business business and others Total or corporate Consolidated
I. Sales: (1) Sales to third parties ¥329,813 ¥147,445 ¥18,488 ¥495,746 ¥ — ¥495,746
(2) Intersegment sales 20 23,362 57 23,441 (23,441) —
Total sales 329,834 170,807 18,546 519,187 (23,441) 495,746
Operating costs and expenses 307,384 159,219 16,313 482,917 (16,335) 466,582
Operating income ¥ 22,449 ¥ 11,587 ¥ 2,232 ¥ 36,269 ¥ (7,105) ¥ 29,164
II. Assets, depreciation expenses and capital expenditure: Assets ¥390,458 ¥79,757 ¥19,405 ¥489,621 ¥44,729 ¥534,350
Depreciation expenses ¥ 25,141 ¥ 2,454 ¥ 767 ¥ 28,363 ¥ (23) ¥ 28,339
Impairment loss ¥ — ¥ — ¥ — ¥ — ¥ 141 ¥141
Capital expenditure ¥ 58,862 ¥ 7,939 ¥ 667 ¥ 67,469 ¥ (1,459) ¥ 66,010
Millions of yen Plant and gas Housewares Gas equipment business EliminationsYear ended or as of March 31, 2008 business business and others Total or corporate Consolidated
I. Sales: (1) Sales to third parties ¥338,347 ¥151,717 ¥17,653 ¥507,718 ¥ — ¥507,718 (2) Intersegment sales 19 11,720 150 11,890 (11,890) —Total sales 338,366 163,438 17,804 519,608 (11,890) 507,718Operating costs and expenses 307,421 153,037 15,871 476,331 (7,396) 468,934Operating income ¥ 30,945 ¥ 10,400 ¥ 1,932 ¥ 43,277 ¥ (4,494) ¥ 38,783II. Assets, depreciation expenses and capital expenditure:Assets ¥394,125 ¥75,178 ¥19,322 ¥488,626 ¥58,611 ¥547,237Depreciation expenses ¥ 22,507 ¥ 2,121 ¥ 647 ¥ 25,276 ¥ 230 ¥ 25,506Impairment loss ¥ — ¥ — ¥ — ¥ — ¥ 49 ¥ 49Capital expenditure ¥ 33,312 ¥ 2,081 ¥ 826 ¥ 36,220 ¥ 40 ¥ 36,260
Notes: 1. The business segments are classified into “Gas business,” “Plant and gas equipment business” and “Housewares business and others” on the basis of the kind and character of products and merchandise.
2. The amounts of the operating costs and expenses included in the column “Eliminations or corporate” for the fiscal year ending March 31, 2009 and 2008 were ¥3,645 million ($37,107 thousand) and ¥2,387 million, respectively, which mainly consisted of expenses in the business administration department.
Thousands of U.S. dollars Plant and gas Housewares Gas equipment business EliminationsYear ended or as of March 31, 2009 business business and others Total or corporate Consolidated
I. Sales: (1) Sales to third parties $3,357,559 $1,501,018 $188,211 $5,046,788 $ — $5,046,788
(2) Intersegment sales 204 237,830 580 238,634 (238,634) —
Total sales 3,357,773 1,738,848 188,802 5,285,422 (238,634) 5,046,788
Operating costs and expenses 3,129,227 1,620,880 166,069 4,916,187 (166,293) 4,749,893
Operating income $ 228,535 $ 117,958 $ 22,722 $ 369,225 $ (72,330) $ 296,895
II. Assets, depreciation expenses and capital expenditure: Assets $3,974,936 $ 811,941 $197,547 $4,984,434 $ 455,350 $5,439,784
Depreciation expenses $ 255,940 $ 24,982 $ 7,808 $ 288,741 $ (234) $ 288,496
Impairment loss $ — $ — $ — $ — $ 1,435 $ 1,435
Capital expenditure $ 599,226 $ 80,821 $ 6,790 $ 686,847 $ (14,853) $ 671,994

45
3. The amounts of the corporate assets included in the column “Eliminations or corporate” for the fiscal years ended March 31, 2009 and 2008 were ¥75,135 million ($764,889 thousand) and ¥76,309 million, respectively, which mainly consisted of sur-plus working funds, investment securities and the assets in the business administration department.
4. As shown in the Summary of Significant Accounting Policies, from the beginning of the fiscal year, April 1, 2008, the Company has adopted the “Accounting Standard for Measurement of Inventories” (Financial Accounting Standard No. 9, issued by the Accounting Standards Board of Japan on July 5, 2006). The effect of this change on the consolidated statement of income for the year ended March 31, 2009 was immaterial.
5. As shown in the Summary of Significant Accounting Policies, from the beginning of the fiscal year, April 1, 2008, the Company has adopted the “Practical Solution on Unification of Accounting Policies Applied to Foreign Subsidiaries for Consolidated Financial Statements” (Practical Issues Task Force No. 18 issued by the Accounting Standards Board of Japan on May 17, 2006). As a result, operating income and income before income taxes for the year ended March 31, 2009 decreased by ¥1,420 million ($14,456 thousand) in Gas business segment compared with the amounts that would have been reported under the previous accounting method.
6. As shown in the Summary of Significant Accounting Policies, from the beginning of the fiscal year, April 1, 2008, the Company has adopted “Accounting Standard for Lease Transactions” (Financial Accounting Standard No. 13 originally issued by the First Committee of the Business Accounting Council on June 17, 1993 and revised by the Accounting Standards Board of Japan on March 30, 2007) and “Implementation Guidelines for Accounting Standard for Lease Transactions” (Financial Accounting Standard Implementation Guidelines No. 16 originally issued by the Accounting System Committee of the Japanese Institute of Certified Public Accountants on January 18, 1994 and revised by the Accounting Standards Board of Japan on March 30, 2007). As a result of the change, total assets increased by ¥3,461 million ($35,234 thousand) in the Gas business segment, ¥411 million ($4,184 thousand) in the Plant and gas equipment business segment and ¥27 million ($275 thousand) in the Housewares business and others segment compared with the amounts that would have been reported under the previous accounting method. The effect of this change on the consolidated statement of income for the year ended March 31, 2009 was immaterial.
7. Supplementary information As shown in the Summary of Significant Accounting Policies, from the beginning of the fiscal year, April 1, 2008, the Company
and its domestic subsidiaries have changed the estimates for useful lives of machinery pursuant to the revision to the Corporation Tax Law. As a result of this change, operating income and income before income taxes and minority interests for the year ended March 31, 2009 decreased by ¥1,840 million ($18,732 thousand) in the Gas business segment, ¥50 million ($509 thousand) in the Plant and gas equipment business and ¥16 million ($163 thousand) in the Housewares business and others segment, respectively, compared with the amounts that would have been reported under the previous estimates.
(b) Geographical Segments
Millions of yen North Other EliminationsYear ended or as of March 31, 2009 Japan America countries Total or corporate Consolidated
Sales: Sales to third parties ¥383,936 ¥ 82,006 ¥29,802 ¥495,746 ¥ — ¥495,746
Intersegment sales 7,177 9,985 3,298 20,461 (20,461) —
Total sales 391,114 91,992 33,101 516,208 (20,461) 495,746
Operating costs and expenses 368,386 83,462 31,513 483,362 (16,779) 466,582
Operating income ¥ 22,728 ¥ 8,529 ¥ 1,587 ¥ 32,846 ¥ (3,682) ¥ 29,164
Assets ¥324,729 ¥102,332 ¥34,653 ¥461,715 ¥ 72,635 ¥534,350
Millions of yen North Other EliminationsYear ended or as of March 31, 2008 Japan America countries Total or corporate Consolidated
Sales: Sales to third parties ¥393,227 ¥ 84,833 ¥29,656 ¥507,718 ¥ — ¥507,718 Intersegment sales 5,762 13,128 3,178 22,069 (22,069) —Total sales 398,990 97,962 32,834 529,787 (22,069) 507,718Operating costs and expenses 369,542 87,940 30,778 488,261 (19,326) 468,934Operating income ¥ 29,447 ¥ 10,021 ¥ 2,056 ¥ 41,525 ¥ (2,742) ¥ 38,783Assets ¥311,037 ¥121,374 ¥40,479 ¥472,890 ¥ 74,346 ¥547,237

46
Notes: 1. Main countries or areas other than Japan North America: the United States Other countries: Singapore, Malaysia, Philippines, China, Taiwan, etc. 2. The amounts of the operating costs and expenses included in the column “Eliminations or corporate” for the fiscal year ending
March 31, 2009 and 2008 were ¥ 3,645 million ($37,107 thousand) and ¥2,387 million, respectively, which mainly consist of the expenses in business administration department.
3. The amounts of the corporate assets included in the column “Eliminations or corporate” for the fiscal years ended March 31, 2009 and 2008 were ¥75,135 million ($764,889 thousand) and ¥76,309 million, respectively, which mainly consist of surplus working funds, investment securities and the assets in business administration department.
4. As shown in the Summary of Significant Accounting Policies, from the beginning of the fiscal year, April 1, 2008, the Company has adopted the “Accounting Standard for Measurement of Inventories” (Financial Accounting Standard No. 9, issued by the Accounting Standards Board of Japan on July 5, 2006). The effect of this change on the consolidated statements of income for the year ended March 31, 2009 was immaterial.
5. As shown in the Summary of Significant Accounting Policies, from the beginning of the fiscal year, April 1, 2008, the Company has adopted the “Practical Solution on Unification of Accounting Policies Applied to Foreign Subsidiaries for Consolidated Financial Statements” (Practical Issues Task Force No. 18 issued by the Accounting Standards Board of Japan on May 17, 2006). As a result, operating income and income before income taxes and minority interests for the year ended March 31, 2009 decreased by ¥1,420 million ($14,456 thousand) in North America segment, compared with the amounts that would have been reported under the previous accounting method.
6. As shown in the Summary of Significant Accounting Policies, from the beginning of the fiscal year, April 1, 2008, the Company has adopted “Accounting Standard for Lease Transactions” (Financial Accounting Standard No. 13 originally issued by the First Committee of the Business Accounting Council on June 17, 1993 and revised by the Accounting Standards Board of Japan on March 30, 2007) and “Implementation Guidelines for Accounting Standard for Lease Transactions” (Financial Accounting Standard Implementation Guidelines No. 16 originally issued by the Accounting System Committee of the Japanese Institute of Certified Public Accountants on January 18, 1994 and revised by the Accounting Standards Board of Japan on March 30, 2007). As a result of the change, total assets increased by ¥3,900 million ($39,703 thousand) in the Japan segment compared with the amounts that would have been reported under the previous accounting method. The effect of this change on the consolidated statements of income for the year ended March 31, 2009 was immaterial.
7. Supplementary information As shown in the Summary of Significant Accounting Policies, from the beginning of the fiscal year, April 1, 2008, the Company
and its domestic subsidiaries have changed the estimates for useful lives of machinery pursuant to the revision to the Corporation Tax Law. As a result of this change, operating income and income before income taxes and minority interests for the year ended March 31, 2009 decreased by ¥1,907 million ($19,414 thousand) in the Japan segment compared with the amounts that would have been reported under the previous estimates.
(c) Overseas Sales
Overseas sales, which include export sales of the Company and its domestic consolidated subsidiar-ies and sales (other than exports to Japan) of its
overseas consolidated subsidiaries, for the years ended March 31, 2009 and 2008 are summarized as follows:
Millions of yen Thousands of U.S. dollars North NorthYear ended or as of March 31, 2009 America Other Total America Other Total
Overseas sales ¥69,124 ¥48,406 ¥117,531 $703,695 $492,782 $1,196,488
Consolidated net sales 495,746 $5,046,788
Ratio of overseas sales to consolidated net sales 13.9% 9.8% 23.7%
Thousands of U.S. dollars North Other EliminationsYear ended or as of March 31, 2009 Japan America countries Total or corporate Consolidated
Sales: Sales to third parties $3,908,541 $ 834,837 $303,390 $5,046,788 $ — $5,046,788
Intersegment sales 73,063 101,649 33,574 208,297 (208,297) —
Total sales 3,981,615 936,496 336,974 5,255,095 (208,297) 5,046,788
Operating costs and expenses 3,750,239 849,659 320,808 4,920,717 (170,813) 4,749,893
Operating income $ 231,375 $ 86,827 $ 16,156 $ 334,379 $ (37,483) $ 296,895
Assets $3,305,803 $1,041,759 $352,774 $4,700,346 $ 739,438 $5,439,784

47
Notes: 1. Main countries or areas North America: the United States Other countries: Singapore, Malaysia, Philippines, China, Taiwan, etc. 2. “Overseas sales” are sales outside of Japan by the Company and its consolidated subsidiaries.
20. Assets and Liabilities Acquired through Asset Purchase
The acquisition cost and net payments for assets and liabilities of Aeris and Advanced Gas Technologies, acquired through an asset purchase
by Matheson Tri-Gas (“MTG”), Inc., a consoli-dated subsidiary of the Company, for the year ended March 31, 2009 was as follows:
Millions of yen NorthYear ended or as of March 31, 2008 America Other Total
Overseas sales ¥71,448 ¥55,140 ¥126,589 Consolidated net sales 507,718 Ratio of overseas sales to consolidated net sales 14.1% 10.8% 24.9%
Thousands of Millions of yen U.S. dollars
Current assets ¥ 858 $ 8,735
Property, plant and equipment 2,110 21,480
Goodwill 2,086 21,236
Other assets 986 10,038
Total assets ¥ 6,042 $ 61,509
Current liabilities ¥ 164 $ 1,670
Noncurrent liabilities 269 2,738
Total liabilities ¥ 434 $ 4,418
Acquisition cost of assets ¥(5,459) $(55,574)
Cash and cash equivalents 33 336
Payments for asset purchase ¥(5,425) $(55,228)
(1) The Company completed the acquisition
of Valley National Gases LLC (“VNG”)
through asset purchase by MTG on April
20, 2009.
(a) Purpose of acquisition Through the acquisition of VNG, which
demonstrates a strong competitiveness in industrial gas business in the U.S. mid-west to northeast regions, the Company intends to expand its industrial gas business and establish more robust business functions in those regions.
(b) Name of counter party CI Capital Partners LLC
(c) Name, business and total assets of the company acquired
Name: Valley National Gases LLC Business: Sales of industrial gases and
gas-related equipment Total assets: $514 million (d) Acquisition date April 20, 2009 (e) Percentage of shares owned after acquisition 100% shares of VNG owned by MTG (f ) Source of financing and payment plan MTG funded $572.5 million by bank loan for
this acquisition and the Company provided a guarantee for MTG by the same amount.
21. Subsequent Events
Thousands of Millions of yen U.S. dollars
Cash dividends—¥6.00 ($0.061) per share ¥2,400 $24,432
(2) Appropriation of retained earnings
The following appropriations of retained earnings, which have not been reflected in the accompanying
consolidated financial statements for the year ended March 31, 2009, were approved at the shareholders’ meeting held on June 26, 2009:

48
Report of Independent Auditors

49
Investor Information(At March 31, 2009)
Head Office:
Toyo Building, 1-3-26, Koyama, Shinagawa-ku, Tokyo 142-8558, Japan
Number of Employees:
9,074
Date of Incorporation:
October 1910
Number of Shares:
Authorized—800,000,000 Issued—403,092,837
Minimum Trading Unit:
1,000 shares
Number of Stockholders:
24,710
Major Stockholders:
Thousands of Percentage ofMajor Stockholders Shares Owned TotalMitsubishi Chemical Corporation 53,591 13.30%JFE Steel Corporation 25,254 6.27Taiyo Nippon Sanso Client Shareholding Society 18,102 4.49Meiji Yasuda Life Insurance Company 16,491 4.09Japan Trustee Services Bank, Ltd. (Trust Account 4G) 15,291 3.79Mizuho Corporate Bank, Ltd. 14,484 3.59Japan Trustee Services Bank, Ltd. (Trust Account) 13,498 3.35Dai-ichi Mutual Life Insurance Company 10,037 2.49The Norinchukin Bank 10,000 2.48State Street Bank and Trust Company (Account 505225) 8,638 2.14 185,390 45.99%
Common Stock Price Range and Trading Volume: (Yen) (Thousand Shares)
0
250
500
750
1,000
1,250
0
20,000
40,000
60,000
80,000
100,000
4th Quarter3rd Quarter2nd Quarter1st Quarter4th Quarter3rd Quarter2nd Quarter1st Quarter
Fiscal 2009Fiscal 2008
Common Stock Price Range
Trading Volume

Printed in Japan
Toyo Building, 1-3-26, Koyama,Shinagawa-ku, Tokyo 142-8558, JapanTel: 81-3-5788-8000www.tn-sanso.co.jp