exp5
DESCRIPTION
EXP5TRANSCRIPT

SKKK 2721 2012/2013 [FLUID MECHANICS LABORATORY]
FINAL REPORT SKKK 2721FLUID MECHANICS LABORATORY
2012/2013-SEM 2
EXPERIMENT 5CALIBRATION OF BOURDON TUBE PRESSURE GAUGE
DATE OF EXPERIMENT11th MARCH 2013
LAB INSTRUCTORDR LAI JAU CHOY
SECTION 09GROUP 3
NO.
TEAM MEMBERS NRIC
1. HOW CHEE YANG 911123-14-53712. 921001-01-73033. MUHAMMAD ZA'IM BIN MOHD ZIN 921128-03-61654. NUZUL ARDZAN BIN MOKHTAR
EXPERIMENT 5: CALIBRATION OF BOURDON TUBE PRESSURE GAUGE | 2-SKKK (SECTION 09) 1
Faculty of Chemical Engineering(FChE)

SKKK 2721 2012/2013 [FLUID MECHANICS LABORATORY]
Date of submission: 18th MARCH 2013
MARKING FORM: Criteria Maximum Percentage Score Comment
Technical Aspects 5%
Abstract 5%
Introduction 5%
Literature Review/Theory 5%
Methodology 5%
Results 5%
Discussion 5%
Conclusion 5%
References 5%
OVERALL TOTAL 45%
TABLE OF CONTENTS
EXPERIMENT 5: CALIBRATION OF BOURDON TUBE PRESSURE GAUGE | 2-SKKK (SECTION 09) 2
SKKK 2721 2012/2013 [FLUID MECHANICS LABORATORY]
Section Page
Abstract 4
Introduction 4
Literature Review 5
Methodology 6
Results and Discussion 8
Conclusion 11
References 11
Appendix 12
1.0 ABSTRACT
EXPERIMENT 5: CALIBRATION OF BOURDON TUBE PRESSURE GAUGE | 2-SKKK (SECTION 09) 3

SKKK 2721 2012/2013 [FLUID MECHANICS LABORATORY]
The objective of this experiment is to perform pressure calibration on a Bourdon tube
pressure gauge using a dead weight tester. Calibration is very important both in laboratory
and industry for both safety and economic reasons. In this experiment, different amount of
weights were used to produce different readings of the gauge. It was found that calibrated
pressure correlated linearly with true pressure. The linear calibration curve meant that given
any reading on the gauge, we can determine the true pressure from the calibration curve with
high accuracy. In conclusion, pressure calibration was performed successfully on the Bourdon
tube pressure gauge.
2.0 INTRODUCTION
The pressure intensity at any point in static or moving fluid can be measured using various
types of pressure measuring instrument. One of these devices is the bourdon tube pressure
gauge. Bourdon tube pressure gauges are most widely used now-a-days because of their
reliability, compactness, low cost and ease of use. It consists of a curved tube of elliptical
cross section bent into a circular arc as shown in Figure 1. When pressure is applied to the
tube, it tends to straighten out, and the deflection of the end of the tube is communicated
through a system of levers to a recording pointer. This gauge is widely used for steam and
compressed gases. The pressure indicted is the difference between the system pressure and to
the external (ambient) pressure, and is usually referred to as the gauge pressure.
Figure 1 Schematic of a Bourdon-tube Pressure Gauge
As the bourdon tube pressure gauge is used extensively, the stiffness of the internal
components change from factory setup and therefore calibration is necessary to give correct
pressure readings. Calibration means checking the pressure gauge readings against a very
accurate device. One of the calibration devices that is available in our lab is the so-called
“Dead Weight Tester”.
EXPERIMENT 5: CALIBRATION OF BOURDON TUBE PRESSURE GAUGE | 2-SKKK (SECTION 09) 4

SKKK 2721 2012/2013 [FLUID MECHANICS LABORATORY]
2.1 OBJECTIVE
The objective of this experiment is to perform pressure calibration on a Bourdon tube
pressure gauge using a dead weight tester.
2.2 SIGNIFICANCE OF STUDY
Calibration is the process of checking devices and making sure that their readings are as
accurate as possible or within engineering tolerances. Thus, through this experiment, the
findings of the experiment (e.g. calibration curve) are very important to recalibrate the
Bourdon tube pressure gauge in order to have a higher accuracy. Besides that, we usually
need to know the pressure in a high pressure boiler industrially. If a pressure gauge shows a
lower pressure than actual, explosion may occur despite the pressure gauge indicating a safe
pressure level. With routine calibration, we can ensure the safety of personnel and equipment
with measuring device.
3.0 LITERATURE REVIEW
Bourdon tube is a mechanical pressure measurement device, named after the French engineer
and inventor Eugene Bourdon according to Cengel and Cimbala (2010). According to
www.ehow.com bourdon tube pressure gauges are usually used for a number of applications
such as oil drilling, ocean liner operations and manufacturing plants. These gauges inform the
operator concerning the amount of pressure in tanks or running through pipe work. This
pressure can involve air, steam, water, oil or other materials. The machinery operator should
calibrate the pressure gauge to ensure the readings are accurate.
In this experiment, a piston of known area, A was loaded with a known weight,
therefore the actual pressure in the cylinder was
P=FA
=mgA
……………………………………3.1
where m is total mass of load and g is gravitational acceleration. From equation 3.1 the actual
pressure can be calculated.
The basic principle of bourdon tube pressure gauge is when an elastic transducer is
subjected to a pressure, it deflects. This deflection is proportional to the applied pressure
EXPERIMENT 5: CALIBRATION OF BOURDON TUBE PRESSURE GAUGE | 2-SKKK (SECTION 09) 5

SKKK 2721 2012/2013 [FLUID MECHANICS LABORATORY]
when calibrated according to yourinstrumentation.blogspot.com. These bourdon tube pressure
gauges can give accurate results as long as it calibrated.
The only significant source of error is due to static friction along the interface between
the piston and cylinder, but even this error is usually negligibly small. The reference pressure
port is connected to either an unknown pressure that is to be measured or to a pressure sensor
that is to be calibrated.
4.0 METHODOLOGY
4.1 APPARATUS
Dead Weight Tester apparatus, Bourdon gauge, piston, 0.5 kg weights, oil.
4.2 PROCEDURE
1. A cylinder and connecting hose were filled up with oil.
2. The piston was inserted into the cylinder and air bubble was removed as much as
possible from cylinder and hose.
Figure 2 Inserting Piston
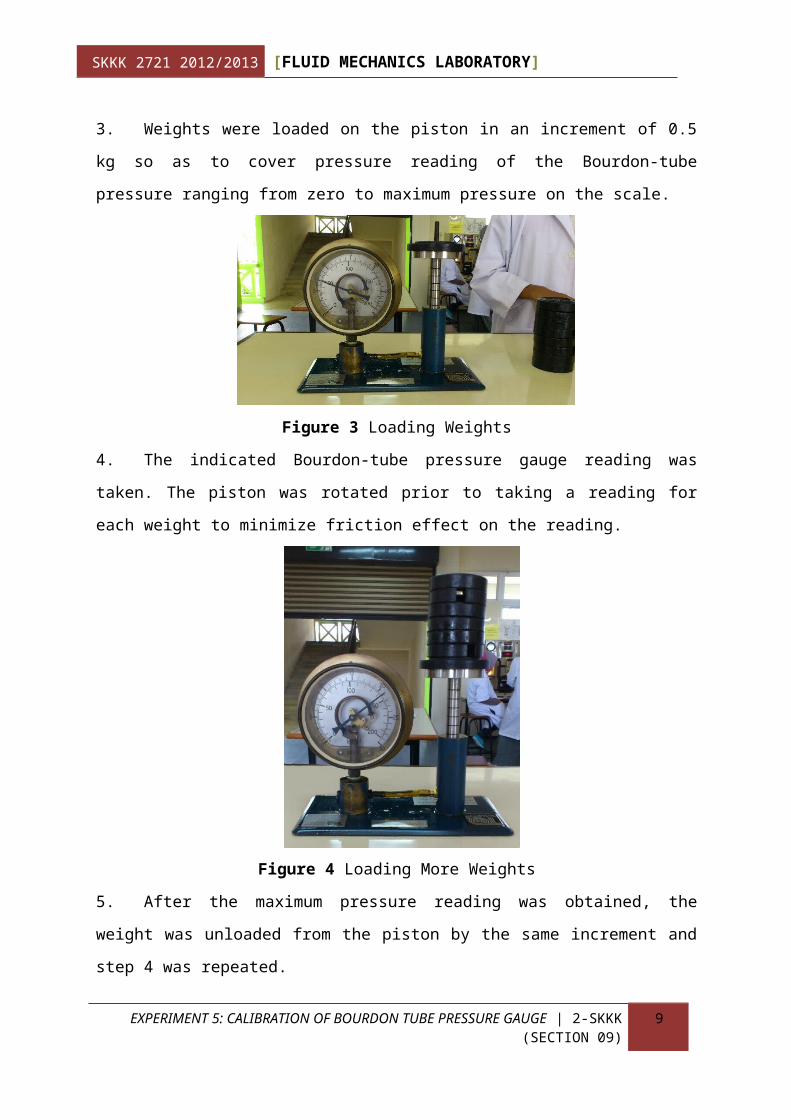
3. Weights were loaded on the piston in an increment of 0.5 kg so as to cover pressure
reading of the Bourdon-tube pressure ranging from zero to maximum pressure on the scale.
EXPERIMENT 5: CALIBRATION OF BOURDON TUBE PRESSURE GAUGE | 2-SKKK (SECTION 09) 6

SKKK 2721 2012/2013 [FLUID MECHANICS LABORATORY]
Figure 3 Loading Weights
4. The indicated Bourdon-tube pressure gauge reading was taken. The piston was rotated
prior to taking a reading for each weight to minimize friction effect on the reading.
Figure 4 Loading More Weights
5. After the maximum pressure reading was obtained, the weight was unloaded from the
piston by the same increment and step 4 was repeated.
Figure 5 Unloading Weights
EXPERIMENT 5: CALIBRATION OF BOURDON TUBE PRESSURE GAUGE | 2-SKKK (SECTION 09) 7

SKKK 2721 2012/2013 [FLUID MECHANICS LABORATORY]
5.0 RESULTS AND DISCUSSION
EXPERIMENT 5: CALIBRATION OF BOURDON TUBE PRESSURE GAUGE | 2-SKKK (SECTION 09) 8
Figure 6 Graph of Bourdon Pressure (Calibrated) versus True Pressure
SKKK 2721 2012/2013 [FLUID MECHANICS LABORATORY]
EXPERIMENT 5: CALIBRATION OF BOURDON TUBE PRESSURE GAUGE | 2-SKKK (SECTION 09) 9
Figure 7 Graph of Percentage of Error versus True Pressure

SKKK 2721 2012/2013 [FLUID MECHANICS LABORATORY]
Based on the data obtained, the true pressure exerted by total mass and the percentage error of
the data was calculated. According to the Figure 6, the R2 value for increasing and decreasing
pressure was 0.9994 and 0.9993 respectively where R2 stands for coefficient of determination.
According to Chapra (2012), coefficient of determination is an indicator indicates how well
your data fits the model we are testing. The closer the R2 value is to 1 the more likely the data
points are solution to the equation that defines the curve. Hence based on the R 2 value
obtained, we can conclude that the line was a good fit to the data obtained throughout the
experiment. The graph also showed that the lines nearly intercept the origin.
Besides that, based on the Figure 6, the slope of the increasing and decreasing graph
was 1.0492 and 1.0378 respectively. According to University of Puerto Rico (2010) the slope
of the calibration curve shows the sensitivity of the pressure gauge. Sensitivity is a measure
of its ability in established that such differences are significant. Ideally, the line should have a
slope of 1. The reason that might affect both values of slope above was the large scale
division of the Bourdon tube pressure gauge (i.e. in scale of 10 kN/m2) compared to the true
pressure correct to 2 decimal places. Non-zero intercepts of both lines suggested that positive
zero error of about 3 kN/m2 existed.
According to Figure 7 it can be calculated that the average percentage error for
increasing and decreasing was 8.32 percent and 8.80 percent respectively. Based on the
percentage error calculated, the rather low percentage error meant that calibrated pressure did
not deviate much from true pressure. Based on Figure 7, it can also be observed that the
percentage errors of the first and second readings were quite high compared to the other
readings. This was due to the rather small value of true pressure used as denominator in the
calculation of the percentage error.
In addition to that, others factors that might contribute to errors or inaccuracies in
experimental data were:
1. Presence of microscopic bubbles of air trapped inside the tube when the experiment
was carried out.
2. Wear and backlash in the gauge linkage can affect the pressure.
3. Parallax error when observer’s eyes were not perpendicular to the scale of the
Bourdon gauge during the value of gauge pressure was recorded.
EXPERIMENT 5: CALIBRATION OF BOURDON TUBE PRESSURE GAUGE | 2-SKKK (SECTION 09) 10

SKKK 2721 2012/2013 [FLUID MECHANICS LABORATORY]
4. Friction between piston and cylinder.
Some ways that can be practiced in order to improve the result were to:
1. Carry out a few replicate measurements to reduce random errors.
2. Increase the division of the scale of the Bourdon tube pressure gauge so more accurate
data can be taken.
3. Make sure the eyes were perpendicular to the scale when taking the reading to avoid
parallax error.
4. Make sure no air bubbles inside the tube when conducting the experiment.
5. Make sure to rotate the piston after adding each weight to minimize frictional effect
on the reading.
All in all, it can be said that when we already minimize all the errors, it can be
concluded that the Bourdon tube pressure gauge need to be recalibrated and maintained well
to increase its accuracy.
6.0 CONCLUSION
The Bourdon tube pressure gauge was calibrated using a dead weight tester since its
calibration data showed good correlation with a linear curve.
7.0 REFERENCES
1. Cengel, Y. A. and Cimbala, J. M. (2010). Fluid Mechanics Fundamentals and Applications,
2nd ed. New York, N. Y.: McGraw-Hill. 87.
2. Chapra, S. C. (2012). Applied Numerical Methods with MATLAB for Engineers and
Scientists, 3rd ed. New York, N. Y.: McGraw-Hill. 342.
3. http://www.ehow.com/how_12082003_calibrate-bourdon-tube-pressure-gauge.html
4. http://yourinstrumentation.blogspot.com/2011/10/bourdons-tube-pressure-gauge-
principle.html
5. http://www.me.uprm.edu/laboratories/inme4031/pdf_Documents/Classes/Microsoft%20
Word%20-%20Class%204_Pressure%20Measurements.pdf
EXPERIMENT 5: CALIBRATION OF BOURDON TUBE PRESSURE GAUGE | 2-SKKK (SECTION 09) 11

SKKK 2721 2012/2013 [FLUID MECHANICS LABORATORY]
8.0 APPENDIX
SAMPLE CALCULATION
Mass of the piston: 1 kg
Cross sectional area of the piston: 3.1731 x 10⁻⁴ m2
Table 1 Sample Data
Mass (kg) True
pressure
(kN/m2)
Calibrated pressure
(Bourdon gauge)
(kN/m2)
Percentage of error
Mass
added (kg)
Total mass
(kg)
Pressure
exerted by
total mass
Increasing
order of
weight
Decreasing
order of
weight
Increasing
order of
weight
Decreasing
order of
weight
0 1 (piston) 30.92 35 37 13.20 19.66
0.5 1.5 46.37 52 53 12.14 14.30
True Pressure Value:
True Pressure exerted by piston=Mass of the piston×(9.81×10⁻³)Cross sectional area of piston
kN /m2
True Pressure exerted by piston=1kg× (9.81×10−3 )kN /kg
3.1731×10⁻⁴m2 =30.92kN /m2
True Pressure exerted by totalmass=Totalmass (weight+ piston)×(9.81×10⁻³)
Cross sectional area of pistonkN /m2
True Pressure exerted by totalmass=1.5kg× ( 9.81×10⁻³ )kN /kg
3.1731×10⁻⁴m2 =46.37 kN /m2
Percentage of Error:
EXPERIMENT 5: CALIBRATION OF BOURDON TUBE PRESSURE GAUGE | 2-SKKK (SECTION 09) 12

SKKK 2721 2012/2013 [FLUID MECHANICS LABORATORY]
Percentage of error= Increasing∨decreasing pressure−Tru e pressureTrue Pressure
×100 %
Percentageerror of increasing pressure=35−30.9230.92
×100 %=13.20 %
Percentageerror of decreasing pressure=37−30.9230.92
×100 %=19.66 %
EXPERIMENT 5: CALIBRATION OF BOURDON TUBE PRESSURE GAUGE | 2-SKKK (SECTION 09) 13