executive summary understanding the link between alcohol
TRANSCRIPT

Executive summary
Understanding the link between alcohol
excises and the price of alcoholic drinks
in UK supermarkets using scanner data
March 2020
Research team Luca Panzone, School of Natural & Environmental Sciences, Newcastle University Viviana Albani, Institute of Health and Society, Newcastle University
Key findings
• The alcoholic drinks market is characterised by an incomplete pass-through: for every £1 tax increase only £0.66 is passed onto the price.
• The pass-through varies by store formats and product volumes.
• The tax stimulates consumers to move away from products with a higher post-tax price to products with a lower post-tax price within a category.
• Increases in excise vary strategically to protect certain products (e.g. the most common size) over others.
• While the results support the idea that alcohol excises can change behaviour by increasing prices, they are less effective than they should be.

2
Background In the UK, the price of alcoholic drinks has increased by almost 300% from 19871 to
2017, with UK prices currently considered among the highest in the EU2. Alcohol
consumption has decreased in the last decade3, but with no reduction in the detrimental
effects of excessive intake (HSCIC, 2016), which causes an economic burden estimated
at £51 billion/year (Burton et al., 2017).
The main policy to tackle alcohol overconsumption in the UK has been through alcohol
excises, which charge tax consumers proportionally to the quantity they consume – so
that heavy drinkers pay more tax than occasional ones. However, taxation can drive
behaviour only if the increase in costs imposed by the tax is effectively translated into
higher prices at the point of purchase (e.g. Weyl and Fabinger, 2013; Bonnet et al.,
2013). This concept, known as tax pass-through, reflects the extent to which the tax is
passed onto the price the consumer pays or is (partially) absorbed by the retailer or
manufacturer (Fullerton and Metcalf, 2002).
Notably, a £1 tax increase can increase prices by: £0 (zero pass-through) if the supplier
absorbs the whole tax; a value strictly between £0 and £1 (under-shifting) if the supply
side of the market offsets the increase in price by reducing costs, e.g. labour costs; £1
(full pass-through) when consumers pay the full extent of the tax; or more than £1 (over-
shifting) when suppliers facing an inelastic demand increase prices by more than the
value of the tax to retain profits. See also Fullerton and Metcalf (2002) for more detail.
In the UK, alcohol excises have increased supermarket prices, but less so for low-priced
drinks compared to expensive ones (Ally et al., 2014). Looking only at the prices that
retailers charge for alcohol, however, does not provide an indication of the impact of
taxation on the prices of alcoholic drinks paid by consumers. In fact, consumers can
adjust to price increases by shifting to equivalent products that fit within their original
price range in what is called product substitution (DeCicca et al., 2012). For example,
consumers can shift to a cheaper category (e.g. beer instead of wine); to a cheaper
subcategory within the same excise category (e.g. a vodka-based alcopop instead of
pure vodka); or to a cheaper product within the same category (e.g. buying red wine as
usual but a cheaper brand).
1 https://www.ons.gov.uk/economy/inflationandpriceindices/timeseries/chbt/mm23 2 https://www.ons.gov.uk/economy/inflationandpriceindices/articles/uktobaccoandalcoholpricesamonghighestineu/2018-02-01 3 https://www.gov.uk/government/publications/food-statistics-pocketbook-2017/food-statistics-in-your-pocket-2017-prices-and-expenditure

3
Methods
Tax pass-through is estimated using a reduced-form pricing regression (DeCicca et al., 2012; Besley and Rosen, 1999; Nakamura and Zerom, 2010; Marion and Muehlegger, 2011; Bonnet et al., 2013), using a fixed-effects panel regression with autocorrelated errors. The pass-through rate is estimated from the regression coefficients. Missing prices for products that did not sell in a particular time period have been estimated using a multiple imputation by chained equations (MICE) method, used to impute missing average price and average discount values. The analysis uses data on the (off-licence) sales of alcoholic drinks in one of the largest UK retailers over 262 weeks (from February 2008 to February 2013). The data contains (quantity weighted) average prices paid, quantity sold, and variety sold by product type (e.g. red wine, ready-to-drink spirits, etc.) across different store size formats (superstore, convenience store, etc.) and product volumes. In the analyses, unique product corresponds to any combination of product category, size, and store format (e.g. a 750ml bottle of red wine sold in a convenience store is recorded as a different product to a 750ml bottle of red wine sold in a large store). Regressions adjust for VAT4. The analysis is based on data from the most common store formats, classified by surface area as ‘Convenience’, ‘Medium’, ‘Large’ and ‘Extra-large’ stores, respectively. Products with relatively small volumes (fruit wine, fruit beer, cocktails, syrup, wheat beer, and wine mixes – wines in cases of mixed colours) were removed because their sales were very sparse and irregular, thus not providing enough observations for analysis.
4 Notably, the VAT changed several times in the time window of the analysis: the VAT rate was 17.5% until the 30/11/2008, it was then reduced to 15% from the 01/12/2008 to the 31/12/2009, and subsequently raised first to 17.5% from the 01/01/ 2010 to the 03/01/2011, and further raised to 20% on the 04/01/2011. See also https://www.gov.uk/vat-rates
4
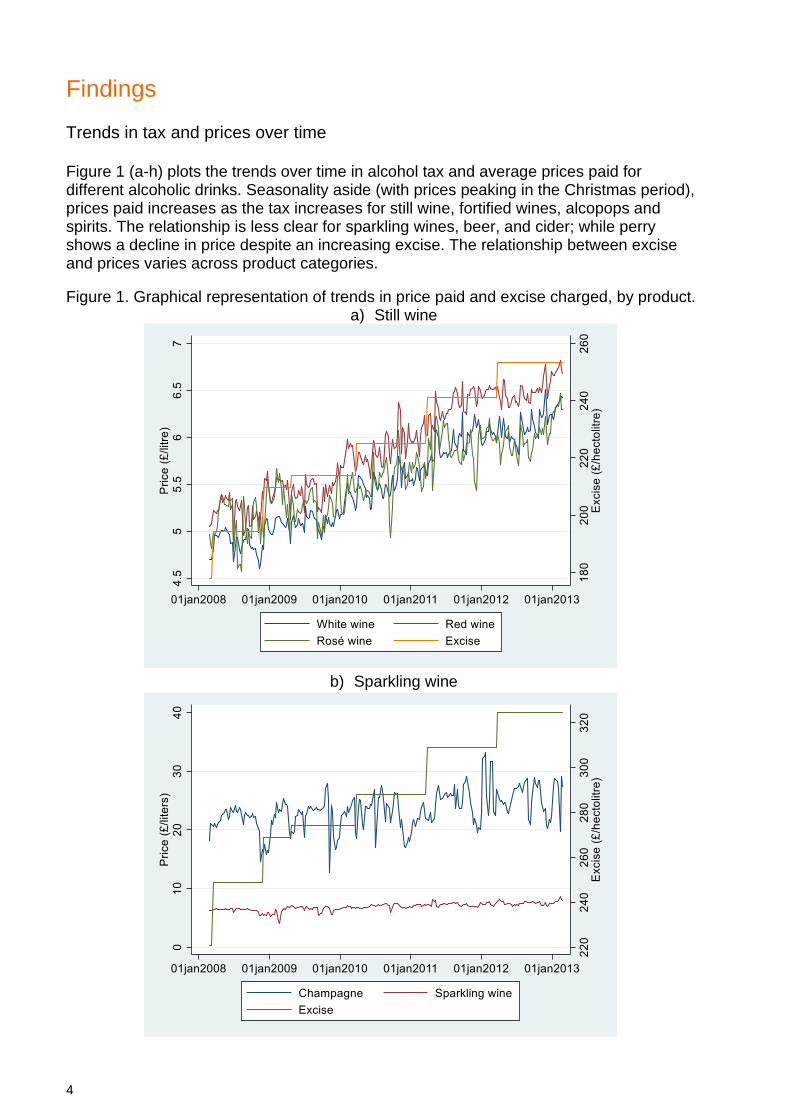
Findings Trends in tax and prices over time Figure 1 (a-h) plots the trends over time in alcohol tax and average prices paid for different alcoholic drinks. Seasonality aside (with prices peaking in the Christmas period), prices paid increases as the tax increases for still wine, fortified wines, alcopops and spirits. The relationship is less clear for sparkling wines, beer, and cider; while perry shows a decline in price despite an increasing excise. The relationship between excise and prices varies across product categories.
Figure 1. Graphical representation of trends in price paid and excise charged, by product. a) Still wine
b) Sparkling wine

5
c) Fortified wine
d) Gin, Rum, Vodka, and Whisky

6
e) Spirits, Brandy, and Liqueur
f) Alcopops

7
g) Cider and Perry
h) Beer
Alcohol pass-through for the alcoholic drinks market The estimated pass-through for the whole alcoholic drinks market is presented in Table 1. Results provide evidence of under-shifting of the alcohol excise, so that for every £1 increase in tax, only two thirds (£0.66) is passed onto the price. Figure 2 reports the estimates of the pass-through for each drink category, showing considerable variation. With the exception of ales and bitter, prices of spirits were affected by alcohol tax changes (p-value < 0.05); while there was no evidence that alcohol excise increases the prices of wines (still and sparkling), beers, cider and perry. Products with a pass-through rate significantly different than 1.00, however, were only brandy and cider. The lack of significance is driven by a large variability in the pass-through across products within each category.

8
Table 1. Estimated alcohol pass-through rate for the whole alcohol drinks market
Drink category Pass-through S.E.
All products 0.66*† 0.10
S.E: standard error. *5% significance or lower for the null hypothesis H0: ρ = 0; †5% significance or lower for the null hypothesis H0: ρ = 1.
Figure 2: Pass-through rates of different product categories5
*5% significance or lower for the null hypothesis H0: ρ = 0. †5% significance or lower for the null hypothesis H0: ρ = 1.
The impact of volume size and store size on the alcohol pass-through The pass-through also varies depending on the characteristics of the product and the characteristics of the store where the product is sold. In this section, estimates are relative to a baseline volume, selected as the volume with the largest market share in the category (e.g. 0.75l bottle for wine, see Table 2), and a baseline store type, selected as extra-large stores.
5 Liqueur includes products such as Baileys, Grand Marnier, Cointreau, amaretto, cherry liqueur, etc. Spirits includes products such as schnapps, tequila, kirsch, grappa, and ouzo.
0.46 1.33 *
0.90 * 0.99
0.69 * 0.65
0.95 * 0.01
0.37 1.64
0.41 0.35
0.79 * 0.90
-0.05†
-0.26 1.38 *
†
1.55 * 1.74 *
-1 0 1 2
White wine Whisky Vodka Stout
Spirits Sparkling wine
Rum Rosé wine Red wine
Perry Liqueur
Lager Gin
Fortified wine Cider
Champagne Brandy
Ale/Bitter Alcopops
9
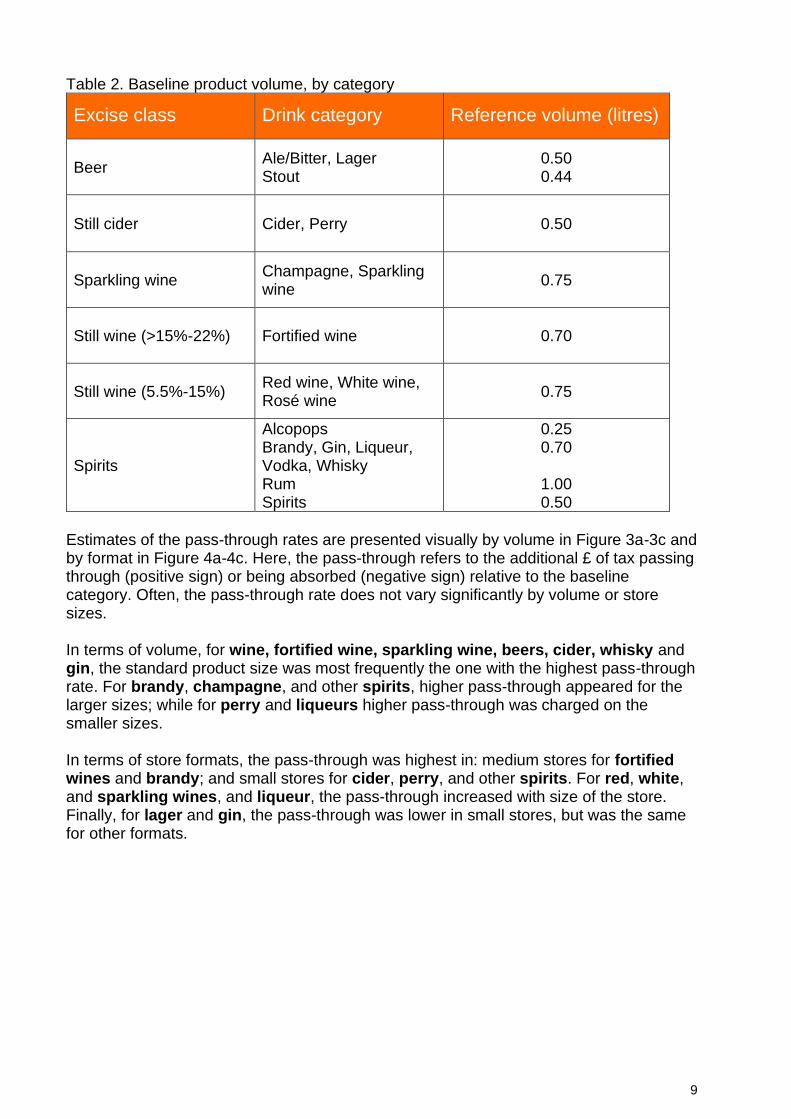
Table 2. Baseline product volume, by category
Excise class Drink category Reference volume (litres)
Beer Ale/Bitter, Lager Stout
0.50 0.44
Still cider Cider, Perry 0.50
Sparkling wine Champagne, Sparkling wine
0.75
Still wine (>15%-22%) Fortified wine 0.70
Still wine (5.5%-15%) Red wine, White wine, Rosé wine
0.75
Spirits
Alcopops Brandy, Gin, Liqueur, Vodka, Whisky Rum Spirits
0.25 0.70
1.00 0.50
Estimates of the pass-through rates are presented visually by volume in Figure 3a-3c and by format in Figure 4a-4c. Here, the pass-through refers to the additional £ of tax passing through (positive sign) or being absorbed (negative sign) relative to the baseline category. Often, the pass-through rate does not vary significantly by volume or store sizes. In terms of volume, for wine, fortified wine, sparkling wine, beers, cider, whisky and gin, the standard product size was most frequently the one with the highest pass-through rate. For brandy, champagne, and other spirits, higher pass-through appeared for the larger sizes; while for perry and liqueurs higher pass-through was charged on the smaller sizes. In terms of store formats, the pass-through was highest in: medium stores for fortified wines and brandy; and small stores for cider, perry, and other spirits. For red, white, and sparkling wines, and liqueur, the pass-through increased with size of the store. Finally, for lager and gin, the pass-through was lower in small stores, but was the same for other formats.

10
Figure 3. Pass-through rates of different categories by volume size for (a) wine, (b) beer, cider and perry, and (c) spirits
*5% significance or lower for the null hypothesis H0: ρ = 0.
(b) Beer and cider
(a) Wine
(c) Spirits
-2.38 *
0.45
1.49 6.40 *
-0.93 * -0.69 *
-7.25 *
-6.91 * 0.67
-0.27
-7.5 -6.5 -5.5 -4.5 -3.5 -2.5 -1.5 -.5 .5 1.5 2.5 3.5 4.5 5.5 Pass-through
Stout
Perry
Lager
Cider
Ale/Bitter
P r o d u
c t c a t e
g o r y
(b) Beer and cider

11
Figure 4. Pass-through rates of different categories by size of store format for (a) wine, (b) beer, cider and perry and (c) spirits *5% significance or lower for the null hypothesis H0: ρ = 0.
(b) Beer and cider
(c) Spirits
(a) Wine

12
Implications Alcohol excises are an effective tool to increase the prices consumers pay for alcoholic
drinks, in line with previous research (e.g. Ally et al., 2014; Kenkel, 2005). While alcohol
excises have increased the price of alcoholic drinks by the full amount of the tax (Ally et
al., 2014), results show that consumer spending increased by less than £1. This result
occurs because the tax stimulates consumers to move away from products with a higher
post-tax price to products with lower post-tax price. The pass-through changed by store
formats and product volumes, an indication that increases in excise vary strategically to
protect certain products (e.g. the most common size) over others. The differences at
category level reflect the ability of consumers to shop around, and a higher price
elasticity of demand (Anderson et al., 2001). For instance, the large variety of still wines
(5.5%-15% ABV) in the marketplace helps consumers in finding a suitable cheaper
replacement when a tax increases; this behaviour is then translated in a wine pass-
through rate lower than the average of the whole alcohol market. Other segments (e.g.
brandy, whisky) have little variety, leading to higher pass-through rates.
While the results support the idea that alcohol excises can change behaviour by
increasing prices, they are less effective than they should be. In current alcohol pricing
policies, alcohol taxes are disconnected from alcohol content. The exception is spirits
(which have a higher pass-through than average), where the tax is linked to the litres of
pure alcohol (Griffith et al., 2017). For example, still wines in the 8.5%-15% ABV excise
range pay a lower excise than champagne in the same ABV range; moreover, an 11%
ABV wine and a 14.5% ABV wine pay the same excise, despite having a different impact
on health. Similarly, the excise for an average 4.4% ABV beer is considerably higher than
that of cider, despite the comparable alcohol content. The above suggests that a linear
alcohol tax that targets the alcohol content of products may be more effective in
addressing excessive alcohol consumption, and possibly show a higher pass-through
rate.
Future research should aim at incorporating information on consumer demand in the
estimation of pass-through rates. This could be done using a structural model (following,
e.g. Bonnet et al., 2013; Besanko et al., 2005). Moreover, there remains a need to
incorporate discounts in studies of taxation, because price-based promotions erode price
increases caused by tax (Panzone, 2012).
Conclusion
This work tested for the impact of alcohol excises on the price of alcoholic drinks that
consumers pay. Results indicate that on average taxes are only partially passed into
consumer prices, meaning that taxation does not achieve its full potential for increasing
prices and consequently changing consumer choices. Results differ across product
categories, so that in some categories tax is more effectively passed to consumers than
others. As a result, there is a need to understand more clearly the barriers that limit the
full pass-through of alcohol excises, and particularly a need to determine strategies
(behavioural as well as structural) to ensure that tax is fully reflected in the prices

13
consumers pay. The ability to continue working with large sales datasets will be key to
the design and evaluation of policy interventions.
Further Information Luca Panzone School of Natural and Environmental Sciences Newcastle University Agriculture Building, King's Road Newcastle upon Tyne, Tyne and Wear, NE1 7RU United Kingdom Tel. +44 (0)1912083594 [email protected] Viviana Albani Institute of Health and Society Newcastle University Baddiley-Clark Building Newcastle upon Tyne, Tyne and Wear, NE2 4AX United Kingdom Tel. +44 (0)191 208 7908 [email protected]
This report was funded by Alcohol Change UK. Alcohol Change UK works to
significantly reduce serious alcohol harm in the UK. We create evidence-driven
change by working towards five key changes: improved knowledge, better policies
and regulation, shifted cultural norms, improved drinking behaviours, and more and
better support and treatment.
Find out more at alcoholchange.org.uk.
Opinions and recommendations expressed in this report are those of the authors.
Opinions and recommendations expressed in this report are those of the authors.

14
References Ally, A. K., Meng, Y., Chakraborty, R., Dobson, P. W., Seaton, J. S., Holmes, J., Angus, C., Guo, Y., Hill-McManus, D., Brennan, A. & Meier, P. S. 2014. Alcohol tax pass-through across the product and price range: do retailers treat cheap alcohol differently? Addiction, 109, 1994-2002. Anderson, S. P., De Palma, A. & Kreider, B. 2001. Tax incidence in differentiated product oligopoly. Journal of Public Economics, 81, 173-192. Besanko, D., Dubé, J.-P. & Gupta, S. 2005. Own-Brand and Cross-Brand Retail Pass-Through. Marketing Science, 24, 123-137. Besley, T. J. & Rosen, H. S. 1999. Sales Taxes and Prices: An Empirical Analysis. National Tax Journal, 157-178. Bonnet, C., Dubois, P., Villas Boas, S. B. & Klapper, D. 2013. Empirical Evidence on the Role of Nonlinear Wholesale Pricing and Vertical Restraints on Cost Pass-Through. The Review of Economics and Statistics, 95, 500-515. Burton, R., Henn, C., Lavoie, D., O'Connor, R., Perkins, C., Sweeney, K., Greaves, F., Ferguson, B., Beynon, C., Belloni, A., Musto, V., Marsden, J. & Sheron, N. 2017. A rapid evidence review of the effectiveness and cost-effectiveness of alcohol control policies: an English perspective. The Lancet, 389, 1558-1580. Decicca, P., Kenkel, D. & Liu, F. 2012. Who Pays Cigarette Taxes? The Impact of Consumer Price Search. The Review of Economics and Statistics, 95, 516-529. Fullerton, D. & Metcalf, G. E. 2002. Tax incidence. Handbook of public economics, 4, 1787-1872. Griffith, R., O'Connell, M. & Smith, K. 2017. Design of optimal corrective taxes in the alcohol market. IFS Working Paper Series. Institute for Fiscal Studies. HSCIC 2016. Statistics on Alcohol. England 2016. London, Office of National Statistics, Health & Social Care Information Centre. http://content.digital.nhs.uk/catalogue/PUB20999/alc-eng-2016-rep.pdf. Kenkel, D. S. 2005. Are Alcohol Tax Hikes Fully Passed through to Prices? Evidence from Alaska. The American Economic Review, 95, 273-277. Marion, J. & Muehlegger, E. 2011. Fuel tax incidence and supply conditions. Journal of Public Economics, 95, 1202-1212. Nakamura, E. & Zerom, D. 2010. Accounting for Incomplete Pass-Through. The Review of Economic Studies, 77, 1192-1230. Panzone, L. A. 2012. Alcohol Tax, Price–Quality Proxy and Discounting: A Reason Why Alcohol Taxes May Rebound. Journal of Agricultural Economics, 63, 715-736. Weyl, E. G. & Fabinger, M. 2013. Pass-Through as an Economic Tool: Principles of Incidence under Imperfect Competition. Journal of Political Economy, 121, 528-583.