executive summary - esa's artes programmes cba exec summary.pdf · infrastructure to bridge...
TRANSCRIPT

Prepared by:
Executive Summary
Technical assistance in bridging the “digital divide”: A Cost benefit Analysis for Broadband connectivity in Europe
27 August 2004
6th October 2004
With:

EC/ESA Digital Divide CBA – Final Report 6 October 2004
Contents
1 Overview of Conclusions................................................................................................ 3 2 Background and approach .............................................................................................. 5 3 Existing level of broadband connectivity and unmet demand in Europe ....................... 7 4 Combined system and user costs .................................................................................. 11 5 Optimal technical solution ............................................................................................ 16 6 Estimation of Benefits .................................................................................................. 19 7 Conclusions on Cost Benefit......................................................................................... 23 8 Next steps...................................................................................................................... 25 ESA STUDY MANAGER Pierluigi Mancini Ph.D. Applications Strategy Manager Directorate of EU and Industrial Programmes Email: [email protected] This document has been prepared on the instructions of the European Space Agency (“ESA”) and with only ESA's interests in mind. PricewaterhouseCoopers LLP, its members, partners, employees and agents neither owe nor accept any duty or responsibility to other parties (“you”), whether in contract or in tort (including without limitation, negligence and breach of statutory duty) or howsoever otherwise arising, and shall not be liable in respect of any loss, damage or expense of whatsoever nature which is caused by any use you may choose to make of this document, or which is otherwise consequent upon the provision of the document to you. Without conferring any greater rights than you would otherwise have at law, we accept that this disclaimer does not exclude or indemnify us against any liability we may have for death or personal injury arising from our negligence or for the consequences of our own fraud. This report represents the Phase I analysis on behalf of the ESA of the state of the Digital Divide in Europe, on a technology neutral basis. The report will provide inputs for a second phase to develop a business case to address the Divide, where further analysis and/or refinement of the findings will be carried out as necessary to gain greater specificity.
(1)

EC/ESA Digital Divide CBA – Final Report 6 October 2004
Glossary ADSL Asymmetric digital subscriber line ADSL2 and ADSL2+
Enhanced ADSL – greater bandwidth on short-mid length lines
ARPU Average Revenue Per User B2C Business to Customer BFWA Broadband Fixed Wireless Access CAPM Capital Asset Pricing Model CATV Cable Television CBA Cost Benefit Analysis EC European Commission EMRP Equity Market Risk Premium ESA European Space Agency EU European Union FTTB/U Fibre To The Building/User FTTC Fibre To The Cabinet/Curb GCSE General Certificate of Secondary
Education HFC Hybrid Fibre Co-ax ICT
Information and Communications Technologies
LAN Local Area Network NPV Net Present Value PLC Powerline Communications PPP Public Private Partnership PwC PricewaterhouseCoopers LLP SME Small & Medium-Size Enterprises SoHo Small Office Home Office VAT Value Added Tax VoIP Voice Over Internet Protocol VSDL Very high speed digital subscriber line WACC Weighted Average Cost of Capital WiFi WLAN used in the wide area WLAN Wireless Local Area Network
(2)
EC/ESA Digital Divide CBA – Final Report 6 October 2004
1 Overview of Conclusions
• Our analysis indicates a total benefit:cost ratio of 1.69x for the provision of broadband services across the European Union, taking into account the more material net benefits estimated to arise in the period after 2013. This implies that the NPV of the benefits is 69% larger than that of the costs and should be regarded as a strongly positive ratio as it suggests that the rewards of rolling out infrastructure to bridge the digital divide in Europe are likely to be substantially greater than the investment required to do so.
• This benefit ratio is however significantly lower in rural areas compared to urban. The ratio in the rural regions is 1.13x in the period between 2004-2013, indicating a much more marginal case for investment in these regions. A ratio of up to 1.32x for rural regions can be derived taking into account the more material net benefits estimated to arise in the period after 2013. This is primarily because the costs are higher in rural areas than in urban areas while the benefits per user are comparable.
• The majority of unmet demand1 for broadband in Europe is forecast to be in the rural regions. Given the likelihood that commercially acceptable returns on investment in broadband networks in these areas will not be forthcoming for at least 10 years, the private sector is unlikely to be persuaded of the commercial merits of rolling out terrestrial broadband networks into them, despite the fact that these areas hold the key to bridging the digital divide in Europe. As a result, the total number of would-be users expected to remain unserved is between 1.3m and 2m enterprises and between 3.3m and 5m consumer households, equating to between 13m and 20m people across Europe.
• The total NPV of the net benefits achieved from the combined urban and rural regions, including a value for future costs and benefits after 2013, is estimated at €297bn, or approximately €66 per annum for each head of population in Europe (including recent entrant countries).
• It is estimated that the optimal technology mix for extending broadband availability across Europe over the next 10 years will be ADSL, complemented by Broadband Fixed Wireless Access (BFWA) and Satellite in rural areas and by HFC and FTTB in urban and suburban areas.
• The potential role of satellite in bridging the digital divide across Europe may be key if the objective of offering near 100% connectivity across all the EU is to be
1 Unmet demand is defined as the number of enterprises and consumers in areas not currently covered by terrestrial broadband networks who would take up broadband services if they were made available at the prices prevailing in areas where those services are available
(3)

EC/ESA Digital Divide CBA – Final Report 6 October 2004
achieved. It is estimated that satellite may prove to be the optimal method (in terms of financing and speed of rollout) to meet the demand from many of the 4.7m to 7m unserved users across Europe, especially those in the most challenging locations. Only 1m of these otherwise unserved users could be carried by existing satellite systems, even including the expected incremental growth of those systems over the next ten years; larger numbers of users would require the introduction of new, more cost-efficient satellite systems.
• Satellite may well, however, bring broadband earlier to a greater number of users, as original users may well migrate to alternate technologies once their density makes such alternatives economic, in turn freeing up capacity for subsequent new users.
• The preliminary results of this Cost Benefit Analysis have highlighted that, as anticipated, there remains a sizeable demand for broadband within Europe that is unlikely to be met by market forces in the medium term (mostly in rural areas). A logical next step will be to examine more deeply the extent of this gap in broadband provision, highlight potential solutions to filling the gap which might include demand aggregation and prepare business plans for projects to put the optimal solutions into practice.
(4)

EC/ESA Digital Divide CBA – Final Report 6 October 2004
2 Background and approach
In line with the strategic vision adopted by the European Union, the European society of tomorrow will be a 'knowledge-based society' in which access to knowledge is for all. Information outreach must therefore be considered as a major objective for Europe.
This means extending access to electronic communication services to everyone, notably in those regions of our continent which up until now have been disadvantaged or neglected (rural and mountain areas, islands, far-flung outlying regions). The enlargement of the Union adds a further dimension to the issue of the digital-divide.
The European Space Agency and the European Commission wish to consider the potential of space-based technologies, in conjunction where appropriate with other systems, to bring affordable broadband to such areas. To underpin the policy decisions, the cost benefit of satellite and alternative technologies need to be assessed.
With this as a background, PricewaterhouseCoopers LLP, together with Ovum and Frontier Economics their subcontractors, have been invited by ESA, to prepare a detailed, technology-neutral Cost Benefit Analysis on broadband connectivity for an expanded Europe.
The study’s objectives were:
• Through both primary and secondary research, identify and quantify, where possible, the benefits of providing broadband connectivity across an extended Europe;
• Prepare an objective analysis of the optimal technical solutions for broadband connectivity, region by region;
• Provide an independent perspective on the Cost Benefit ratio for technology-neutral provision of broadband for Europe over a period of 10 years; and
• Clarify the potential role of satellite-based solutions for broadband connectivity and thus bridging the digital divide in an extended Europe.
(5)

EC/ESA Digital Divide CBA – Final Report 6 October 2004
To address these objectives, we grouped the 25 countries of the EU into four country groups2 according to certain criteria, with each group containing countries with similar characteristics when comparing, for example, GDP/capita, number of households, population, current broadband penetration and urban and rural population ratios. A proxy country was selected for each group, and that country was then analysed according to user groups, demand for broadband services at various bandwidths and potential technical solutions in order to ascertain the appropriate cost and benefit data, which in turn was mapped onto the other countries in the group to derive the results for both costs and benefits. This analysis was underpinned by preliminary regional analysis within two countries, Italy and the UK. If the modelling were extended to cover non-EU countries, Switzerland and Norway would come within Country Group 1.
For each country group, a base case and extended case for availability and take-up were analysed. The base case is the situation that may occur under normal market conditions and the extended case is a situation in which higher take-up than that expected in the base case is stimulated by, for example, lower prices, more attractive service packages or higher GDP. The availability of terrestrial broadband services is assumed to be the same between the base case and extended take-up case. It is the result of this analysis that is included in this document. For clarity, the availability as well as the base case and extended case take-up assumptions were as shown in Table 1 below:
Table 1: Broadband connectivity and forecast take-up in Europe
Availability Base Case Extended Case Availability Base Case Extended CaseCountry Group 1
Urban 98% 54% 56% 99% 76% 82%Rural 92% 36% 39% 95% 54% 64%
Country Group 2Urban 97% 37% 41% 97% 74% 81%Rural 62% 19% 20% 78% 39% 42%
Country Group 3Urban 96% 45% 50% 97% 75% 81%Rural 61% 12% 13% 75% 28% 30%
Country Group 4Urban 94% 13% 14% 95% 43% 47%Rural 15% 1% 2% 34% 8% 10%
2008 2013
2 Group 1: Austria, Belgium, Denmark, France, Luxembourg, Malta, Netherlands, Sweden and UK Group 2: Finland, Italy, Ireland and Germany, Group 3: Cyprus, Estonia, Portugal, Slovenia and Spain Group 4: Czech Republic, Greece, Hungary, Latvia, Lithuania, Poland and Slovakia
(6)

EC/ESA Digital Divide CBA – Final Report 6 October 2004
3 Existing level of broadband connectivity and unmet demand in Europe
Availability and take up of terrestrial broadband
The availability of terrestrial broadband services (defined as the proportion of households and businesses that can be served at reasonable cost and within a reasonable time of the customer placing an order) is forecast to exceed 95 per cent in urban areas across virtually the whole of the EU by 2010. Availability in rural areas will generally be much lower. Among the wealthier countries it will typically reach at least 75 per cent by 2013 but in most of the recent accession countries it will still be no more than 35 per cent.
Take up of broadband services, like availability, is expected to be highest in the richest countries and in urban areas; and lowest in poorer countries with large rural areas. The proportion of these potential customers who actually take up broadband services is forecast to be close to 100 per cent for SMEs and Large Enterprises but much lower for SoHos and consumers, especially in rural areas. The take up of services are considered for a Base Case and for an Extended Take-up Case. In the Base Case (the situation that may occur under normal market conditions) take-up among consumer households and SoHos by year 2013 varies from over 50 per cent in most of North West Europe to less than 10 per cent in many recent accession countries. In the Extended Take-up Case these figures exceed 66 per cent and 30 per cent respectively. The eventual ceiling on take-up is higher than these figures (ultimately reaching at least 75 per cent even among consumers in rural areas). It is determined largely by affordability and user willingness to pay, which is itself in part a reflection of perceived value. The speed of take-up is determined in the early years partly by supply constraints but for most of the period price is the key factor.
Currently, the availability of broadband in the EU is dominated by ADSL and cable modem services and this is expected to continue. Cable modem services, built on top of cable TV infrastructure are primarily provided in urban areas and their provision is very varied across the EU. They are rarely cost effective to deploy in isolated urban areas and rural areas. DSL services are provided in urban areas and increasingly in more rural locations. There are currently low levels of availability of fibre to the user / building (FTTU/B), broadband fixed wireless access (BFWA) and WiFi (wireless LAN technology used in the wide area). However, where FTTB is available, it has a dramatic effect on the speed and range of services that can to be offered, as can be seen in Italy and Sweden. In the latter years of the forecast period, when demand for services at above 10Mbps is growing particularly among business users, it is anticipated that deployment of fibre will have started in many countries, but few will have significant FTTB networks, which will be limited to urban areas. However, fibre
(7)

EC/ESA Digital Divide CBA – Final Report 6 October 2004
deployment to street cabinets (FTTC) is expected to be more widely used, taking advantage of high capacity DSL services (e.g. ADSL2+ and VDSL).
The cost of the dominant terrestrial services is forecast to decline rapidly throughout the period of measurement as they benefit from economies of scale. This is offset somewhat in later years by the high cost of rolling out fibre access networks, although this does not affect the cost of lower bandwidth services.
Potential broadband demand remaining unmet
Despite considerable efforts on the part of service providers to deploy services, this study estimates that by 2013, terrestrial broadband services will remain unavailable to some 4.7m would-be broadband users in the EU. About 1.3m of these will be business users (micro-enterprises, SMEs and large enterprises), predominantly micro-enterprises.
The situation varies considerably between different country groups. Rural regions will be less well served during the period to 2013 and the demand remaining unmet in these areas is of most interest. As shown in Figure 3.1, in 2004 there is estimated to be an unserved market of 6.2m households and businesses in Group 1 countries without access to terrestrial broadband services. If the number of would-be users in this group is assumed to be in line with take-up where services are available, then the estimated unmet demand among Group 1 countries is 380,000 would-be users in 2004, rising to 490,000 in 2013.
Figure 3-1: Unmet demand – Country Group 1, rural areas
Group 1 Countries - rural availability and take-up
-
5,000,000
10,000,000
15,000,000
20,000,000
25,000,000
30,000,000
2004 2005 2006 2007 2008 2009 2010 2011 2012 2013
Total Rural Consumers (inc bus.) Rural Availability Rural Take-up
Group 1 Countries - rural unserved market and rural unmet demand
-
5,000,000
10,000,000
15,000,000
20,000,000
25,000,000
30,000,000
2004 2005 2006 2007 2008 2009 2010 2011 2012 2013
Total Rural Consumers (inc bus.) Unserved market Unmet demand
Source: Ovum
Figure 3.2, 3.3 and 3.4 show the Base Case for broadband availability, take-up, unserved users and unmet demand for Country Groups 2, 3 and 4.
As can be seen from the charts, the levels of unmet demand is much lower in Country Group 1 than in the other country groups. This reflects the very high availability of broadband services achieved in Country Group 1, whose member countries are all
(8)

EC/ESA Digital Divide CBA – Final Report 6 October 2004
wealthy and have highly developed telecommunications infrastructures. In contrast, Country Groups 2 and 3 have large rural areas that incorporate Objective 1 regions3, often with low population densities in those areas.
The level of unmet demand peaks in the middle of the study period, reducing progressively thereafter as terrestrial rollouts extend into at least the outer peripheries of these areas. We estimate that by the end of the period of measurement, the unmet demand in Group 2 is forecast to be 2.2m and in Group 3 just over 0.5m would-be users.
Figure 3-2: Unserved demand – Country Group 2, rural area
Group 2 Countries - rural availability and take-up
-
5,000,000
10,000,000
15,000,000
20,000,000
25,000,000
2004 2005 2006 2007 2008 2009 2010 2011 2012 2013
Total Rural Consumers (inc bus.) Rural Availability Rural Take-up
Group 2 Countries - rural unserved market and rural unmet demand
-
5,000,000
10,000,000
15,000,000
20,000,000
25,000,000
2004 2005 2006 2007 2008 2009 2010 2011 2012 2013
Total Rural Consumers (inc bus.) Unserved market Unmet demand
Source: Ovum
Figure 3-3: Unserved demand – Country Group 3, rural areas
Group 3 Countries - rural availability and take-up
-
2,000,000
4,000,000
6,000,000
8,000,000
10,000,000
12,000,000
2004 2005 2006 2007 2008 2009 2010 2011 2012 2013
Total Rural Consumers (inc bus.) Rural Availability Rural Take-up
Group 3 Countries - rural unserved market and rural unmet demand
-
2,000,000
4,000,000
6,000,000
8,000,000
10,000,000
12,000,000
2004 2005 2006 2007 2008 2009 2010 2011 2012 2013
Total Rural Consumers (inc bus.) Unserved market Unmet demand
Source: Ovum
3 A region whose development is lagging behind others in the EU is given Objective 1 status to promote its development and structural adjustment. Objective 1 areas may be urban as well as rural. http://europa.eu.int/scadplus/leg/en/lvb/g24203.htm defines Objective 1 regions for the period 2000-2006.
(9)

EC/ESA Digital Divide CBA – Final Report 6 October 2004
Figure 3-4: Unserved demand – Country Group 4, rural areas
Group 4 Countries - rural availability and take-up
-
2,000,000
4,000,000
6,000,000
8,000,000
10,000,000
12,000,000
14,000,000
16,000,000
2004 2005 2006 2007 2008 2009 2010 2011 2012 2013
Total Rural Consumers (inc bus.) Rural Availability Rural Take-up
Group 4 Countries - rural unserved market and rural unmet demand
-
2,000,000
4,000,000
6,000,000
8,000,000
10,000,000
12,000,000
14,000,000
16,000,000
2004 2005 2006 2007 2008 2009 2010 2011 2012 2013
Total Rural Consumers (inc bus.) Unserved market Unmet demand
Source: Ovum
Country Group 4, which includes the larger accession countries and also Greece has a high level of unmet demand. In total by end of the period there are estimated to be over 1.5 million would-be users in the unserved areas of these countries, reflecting the large proportions of their total landmass that remains outside of terrestrial broadband coverage even in 2013.
The Extended Take-up Case might be expected to show a lower level of unmet demand. Yet in fact the opposite is true. This is because availability of broadband services is unchanged between the two cases, with only the level of take-up varying. It is assumed that the potential demand for broadband will be the same whether it is available or not. Consequently, lower cost of the Extended Take-up Case produces both a higher level of take-up in areas with broadband availability and a higher level of unmet demand where it is not available. The analysis indicates a potential of about 7m users (including 2m business users) with a requirement for broadband services that cannot be met by the anticipated market-driven rollout of terrestrial networks.
(10)

EC/ESA Digital Divide CBA – Final Report 6 October 2004
4 Combined system and user costs
Affordability and users’ willingness to pay Capacity and service availability are irrelevant unless potential users consider the services to be affordable and are willing to pay for them. Moreover, there is strong evidence from the marketplace that price is not currently the main driver to broadband take-up. For example, France and the UK have very similar take-up rates for terrestrial broadband services (about 12% and 13% of households respectively), yet average monthly charges in France are less than half those in the UK (19 Euros versus 41 Euros for 512kbps residential services and 71 Euros versus 170 Euros for 2Mbps business services). It seems that take-up is to date constrained more by supply or availability than by price or affordability.
This is reinforced by several of the recent accession countries, notably Poland and Slovenia, which have remarkably similar price levels but radically different take-up rates (under 2% versus 8%). To complete the picture, Greece, which has lower prices than any of the other countries mentioned except France, has the lowest take-up of all the EU25.
Affordability and willingness to pay are expected to become progressively more important as rollout and take-up increase to true mass-market levels. This is because an increasing proportion of users are then price-sensitive consumers rather than enterprises whose demand is driven by business needs. The Extended Take-up Case in particular reflects this, with higher take-up stimulated by lower prices. A similar situation exists with respect to satellite services. Although the highest take-up is in the country with the lowest prices (Italy), the picture elsewhere shows little discernible connection between the two. Indeed, the ubiquitous availability of satellite services means that national pricing is less clearly definable than with terrestrial equivalents: yet take-up varies wildly across the EU. In the UK, where direct grants to users in Objective 1 areas have made satellite user terminal equipment virtually free, take-up has been no higher than in France where grants are available, if at all, only indirectly through local authorities. In Germany, where users generally pay the full market price, take-up has been much higher than in either France or the UK.
It is not even possible to say with confidence that affordability is a major constraint on the take-up of satellite services in the less wealthy accession countries, since penetration levels are currently too low to judge this. The most important factor appears to be the presence or absence of effective distribution channels, although other considerations such as ease of licensing are also significant. It is probable, though it cannot be proved, that a major element in users’ willingness to pay the higher prices for satellite services is their perception of whether or not terrestrial rollout will reach
(11)

EC/ESA Digital Divide CBA – Final Report 6 October 2004
them within a year or two, coupled with an expectation that terrestrial services will remain much cheaper.
Cost comparisons for service delivery The study indicates that in 2004 there is a significant cost differential between satellite and terrestrial services. It also shows that this differential will not really improve by 2013. In fact, although this differential is forecast to reduce in absolute terms, in relative terms the opposite is true. The annual cost, including user equipment, of delivering a 512kbps satellite service to a rural region in a Group 2 country is forecast to fall from 1,351 Euros to 665 Euros over the decade to 2013. The equivalent ADSL service is expected to fall from 447 Euros to 185 Euros and a BFWA equivalent from 445 Euros to 169 Euros. Thus although the satellite service falls in cost by more than half, relatively speaking it goes from being 3 times more expensive than ADSL and BFWA, to being respectively 3.6 and 3.9 times more expensive. Therefore, as Figure 4-1 shows for rural services in Group 2 countries, satellite services will become much more affordable for users in areas not covered by terrestrial services but will not be price competitive in areas that are.
Figure 4-1: Relative costs of terrestrial and satellite services
Base Case Annual Costs, Euros/UserRural <512kbps, Group 2
0
200
400
600
800
1000
1200
1400
1600
ADSL BFWA 1-way Sat 2-way Sat
20042013
Source: Ovum
It is arguable that the latest designs for advanced broadband satellites, coupled with mass-procurement of satellite terminals, will produce much steeper cost reductions than those noted above. To some extent this is captured in the Extended Take-up Case but the study has taken a conservative approach, rather than assuming the full
(12)

EC/ESA Digital Divide CBA – Final Report 6 October 2004
realisation of these hoped-for improvements. Moreover, similar if not greater advances in terrestrial technologies must be considered at least equally likely, given their greater and more certain economies of scale.
However, a sensitivity analysis has been conducted to assess the possible impact of mass-produced satellite terminals and more cost-efficient satellite capacity. The results are shown graphically in Figure 4-2. The sensitivity scenario described as Case 1 assumes procurement of at least 100,000 user terminals from a single manufacturer, to achieve a price of Euros 500 per unit. It also assumes that advanced satellites achieve a reduction in bandwidth price to one third of current levels by 2013, with the more efficient capacity coming on line progressively from 2009. Case 2 assumes even larger procurements, achieving a unit price for satellite terminals of Euros 300, with satellite design efficiencies achieving the maximum potential currently planned by manufacturers, reducing bandwidth prices to one fifth of current levels.
Figure 4-2: High level sensitivity analysis of product volume on satellite terminal costs
Extended Take-up Case Annual Costs Rural <512kbps, Group 2, Euros/User
0
500
1000
1500
ADSL BFWA 2-way Sat Sat(Case 1)
Sat(Case 2)
2004 2013
Satellite Cost SensitivityAnnualised Costs in Euros/User
0
500
1000
1500
2004Base Case
2013Base Case
2013Ext. Takeup
2013Case 1
2013Case 2
CPE Space & Ground Segment OPEX & Retail
Source: Ovum
As the graphs show, this would reduce the cost of satellite solutions to levels just below current costs for ADSL and BFWA services. However, satellite would still be roughly twice the cost of those terrestrial services, since they also reduce dramatically in price over the study period.
The ability for terrestrial systems to serve unmet demand The EU faces a challenge in meeting the needs of several million would-be broadband users in rural areas who are forecast to be beyond the market-driven reach of terrestrial broadband services. The boundary of this market-driven reach of terrestrial services will vary depending on local market conditions. As the number of would-be users increases and the costs of broadband provision decrease, so the boundary will be pushed back over the forecast period as it becomes increasingly commercially viable
(13)

EC/ESA Digital Divide CBA – Final Report 6 October 2004
to deploy terrestrial services. It is expected that ADSL (and variants) and BFWA will dominate the terrestrial service market, with ADSL being able to be cost-effectively deployed in smaller packages and BFWA being used to serve more sparsely populated areas and those beyond the reach of ADSL.
Demand aggregation solutions The cost of terrestrial services has two major components:
• access – the connection between the consumer and the service provider’s network point of presence (PoP)
• backhaul – the cost of the connecting the PoP to the core backbone network.
If the backhaul cost component is significant, then demand aggregation may be a viable option. Many demand aggregation regional programmes have been established in Europe and trials are underway. The range of projects is wide ranging. In some cases a small community may be provided with WLAN broadband by a local entrepreneur, in others, regional government has established a private WAN to deliver broadband to regional offices. Detailed cost analysis is very project dependent.
Demand aggregation can thus allow broadband services to be delivered to sparsely populated rural areas. This makes satellite backhaul an attractive option as the high customer acquisition and support costs are shared over a larger number of users. This has been factored into the cost model, weighting satellite services to reflect that they are often a more difficult and labour-intensive sale than terrestrial equivalents. If, however, customer demand is aggregated into a smaller number of entities such as local authorities, then customer acquisition becomes more affordable. In effect the demand aggregators form a free local distribution network for the service providers.
Demand aggregation can be facilitated by the use of hybrid solutions that combine satellite backbone links with local service delivery through terrestrial infrastructure. Growth in bandwidth demand, however, may eventually necessitate more expensive satellite terminals and dedicated high bandwidth capacity leases, rather than less expensive shared bandwidth. Ultimately growth in demand may make it economical to replace the satellite links by terrestrial links.
The ability for satellite systems to serve unmet demand The study has assessed the ability of satellite systems to serve the unmet demand noted in Section 3 above. Yet there is no single, easy answer to the question “how many broadband users can be supported on satellite systems?” It depends upon many factors, among the most important of which are average bandwidth per user, maximum bandwidth per satellite and total available spectrum.
(14)
EC/ESA Digital Divide CBA – Final Report 6 October 2004
The study has assumed that average bandwidth demand per user will double over the next decade, despite a doubling in the efficiency of data transmission protocols. (The assumed average service profile in 2013 is a 1Mbps uplink and 4Mbps downlink, four times more than at present but below the service levels likely to be available in urban areas.) An average contention ratio of 20:1 has been assumed, giving 3,000 users per 36MHz transponder or equivalent. The number of users that can be carried on existing satellite systems is greatly restricted by the fact that most of them are focused on other markets and cannot readily be optimised for broadband access. This is offset to some extent by the ongoing addition of new satellite capacity to the existing fleets.
In the Base Case, just over 1m broadband users are forecast to be served by existing satellite systems, supplemented by new satellites with Ka-band capacity that are added incrementally to the fleets of existing satellite operators. This assumes normal, commercially-driven growth in the satellite business.
In the Extended Take-up Case, we forecast that totally new Ka-band satellite systems are introduced, specifically designed for interactive broadband access services. These systems, with much greater capacity and potentially much lower costs per user, are variously estimated at being able to support between 0.2m and 0.5m users per satellite, depending upon the assumptions used for satellite design and user profiles. They are assumed to expand the broadband satellite market to 2 million users, of which a few hundred thousand would remain on the existing satellite fleets (thus freeing up capacity on those fleets for other new services such as High Definition Television).
The forecasts therefore imply that between 2.7m and 6m potential users, who would adopt terrestrial broadband services were they available, will remain unserved by market forces despite the theoretical possibility of fulfilling their demand through satellite broadband services. The total capacity of satellite systems to support broadband access services over Europe has been estimated at between 2m and 4m users by 2013. The lower figure assumes at least two and possibly as many as four new advanced Ka-band satellites, plus the use of all or part of the capacity on several less advanced satellites at Ku-band and/or Ka-band. The higher figure of 4m users would require several additional advanced satellites but is still considered to be feasible within the constraints on orbital slots and spectrum. The study thus suggests that although satellite services could make a vital contribution to filling the broadband gap in rural areas, they will probably lack the capacity to fill it entirely even if new satellites were procured for this purpose.
(15)
EC/ESA Digital Divide CBA – Final Report 6 October 2004
5 Optimal technical solution
The “optimal mix” of technologies is the combination of broadband access technologies which: makes broadband services available to a large proportion of the potential user base at an affordable price; provides a range of access service rates through a competitive market; and allows service providers to benefit from economies of scale, with lower systems costs and efficient operations. Determining the optimal mix of technologies is complex. Many factors have to be considered particularly when assessing the technologies that have the greatest capability to serve rural and remote areas.
In urban areas across the whole of Europe, the optimal mix of technologies for the delivery of broadband access services is quite clear, as detailed below.
• For services below 10Mbit/s: HFC where CATV networks already exist and ADSL where they do not. In practice this means that ADSL gains around 65% market share everywhere except Country Group 2, where in the virtual absence of established CATV networks it gains nearly 90%. Both of these technologies will achieve levels of affordability in urban areas that enable them to penetrate consumer as well as business markets. They will also be able to efficiently deliver services in the 2-5 Mbit/s range, making them optimum for a wide range of consumer and business applications.
• For services above 10Mbit/s: FTTB is overwhelmingly dominant, with between 70% and 90% market share. In Country Groups 1 and 2 only ADSL will provide a complement to fill in gaps in coverage by FTTB. In Country Groups 3 and 4 ADSL, HFC and BFWA will each take about 10% of the market, primarily as a result of providing lower cost alternatives from a wide range of service providers.
For rural areas the picture is more complex, with a larger range of technologies taking significant market share and greater variation between Country Groups.
In the highly developed, relatively wealthy and comparatively densely populated rural areas that are typical of Country Group 1, ADSL will completely dominate services below 10Mbit/s and will be the only technology to significantly complement FTTB for services above 10Mbit/s. The most sparsely populated and remote areas will mostly be served by BFWA but these amount to no more than 5% of rural users, typically in Objective 1 regions, with very little use of HFC and negligible use of satellite.
Rural areas in Country Group 2 will differ from those in Country Group 1 in having no use for HFC, whilst BFWA and satellite together will account for about 10% of rural users, mostly in sparsely populated or mountainous regions and those with
(16)

EC/ESA Digital Divide CBA – Final Report 6 October 2004
Objective 1 status. Their primary target markets in these areas will be SoHos and SMEs, whereas ADSL will also be serving large numbers of consumers.
Country Groups 3 and 4 are likely to see the lowest levels of rural ADSL take-up (though still at around 70% for services below 10Mbit/s), with BFWA taking around 15% of the market. Satellite will be the third ranking technology, well ahead of HFC which is limited to a few pockets. The primary markets for non-ADSL technologies will be SoHos and SMEs, although the low costs of BFWA will allow some penetration of consumer markets also. This profile reflects the large extent of the rural areas in these countries and the low population densities and affordability levels within them, which will tend to sharply curtail the expansion of most terrestrial technologies outside of the urban and suburban areas. For the same reason services above 10Mbit/s will see BFWA taking a major role, with around 30% of the market compared to 55% for FTTB and 15% for ADSL.
Conclusions on Optimal Technology Mix
Overall, most urban users, whether business or consumers, will be served by ADSL and HFC (where available) as equally optimal solutions for low to medium speed services. As the infrastructure becomes established, FTTB and fibre-served remote cabinets will be the optimal solutions for higher speed services. Where urban users have affordability issues or experience slow or patchy rollout of these services (both of which will occur mostly in recent accession countries), BFWA services may be provided instead.
Whilst Power Line Communication (PLC) has also been considered as a possible solution, and is under trial in certain European countries, the nascent nature of its development and the level of uncertainty over its future success have led us to exclude this technology from our final conclusions.
ADSL will be the only truly optimal solution to serve most rural consumers and will also be popular among rural businesses. Some consumers in difficult topographical environments or areas that are remote and sparsely populated will adopt BFWA but for the most part this solution will be limited to rural businesses who have a more absolute need for broadband. Thus BFWA services will be optimal for business users in rural areas where the topography is undramatic and ADSL has not yet been rolled out; for rural users who require very high data speeds; and in remote areas where there are so few potential users that even BFWA is viable only with demand aggregation schemes, typically administered by local authorities. These may involve either self-backhaul or satellite backhaul.
Satellite broadband services are also likely to be taken up predominantly by business users in rural areas. Most of these will be micro-enterprises, including many
(17)

EC/ESA Digital Divide CBA – Final Report 6 October 2004
“prosumers” (self-employed individuals who are generally categorised as consumers rather than as part of the SoHo enterprise category). Satellite services are likely to be optimal in the following cases:
• very thin-route markets, ranging from isolated users to small groups of up to around 20 users in a hamlet or village, especially where there is a requirement for long distance backhaul and where local authorities act as demand aggregators
• locations where the topography increases the costs of terrestrial networks by several times the average deployment cost for those technologies
• interim service provision for a few months to meet urgent demand (especially from SMEs and SoHos) in advance of known terrestrial rollouts
• medium-term service provision (especially for SMEs and SoHos) where terrestrial rollouts are very uncertain or known to be several years off
• provision of service to large, multi-site enterprises requiring a uniform solution, typically involving integrated VPN services.
In conclusion, the EU faces a challenge in meeting the needs of several million would-be broadband users in rural areas forecast to be beyond the market-driven reach of terrestrial services. Satellite systems could support a substantial proportion of these potential users but probably not all. Furthermore the cost of satellite solutions will remain greater than those of equivalent terrestrial services, where available, although this gap will reduce in absolute terms. Bridging the digital divide in such areas will therefore require the deployment of more than one technology. ADSL, BFWA and satellite services offer the potential to bridge this gap, by extending the reach of broadband services into environments that offer progressively lower revenues per square kilometre
The total costs estimated over the period of measurement, assuming the utilisation of the optimal technical solution for each country group, are shown in the table below.
Table 2: NPV of Total Capital and Operating Costs 2004-13
Costs €bn (nominal) Base Case Extended Take-Up
Urban 112.0 118.8
Rural 41.8 44.6
Total 153.7 163.4
Source:Ovum
(18)

EC/ESA Digital Divide CBA – Final Report 6 October 2004
6 Estimation of Benefits
The approach to estimating economic benefits arising from broadband focused on the development of quantitative estimates of the benefits of widespread broadband in each European country. A range of types of economic benefit was considered and a detailed model was developed for each one. Throughout the study, the economic benefits were estimated in as objective a way as possible. However, in all cases, a conservative approach was adopted to ensure that the benefits have not been overstated.
The economic benefit of broadband is the sum of three components:
• The direct benefits accruing to broadband subscribers;
• The benefits to providers of services; and
• The indirect benefits arising to other people as a result of the use of broadband.
Direct benefits The value to customers of broadband access arises from the applications for which it is used. These applications range from simple internet browsing and email through to more complex applications such as video-downloads, remote network access, real-time video links etc. Subscribers pay individually for some of these applications (e.g. video downloads) while others may be free (e.g. internet browsing). Subscribers receive benefit from the package of applications that they consume over their broadband connection. The net economic benefit is the difference between the total benefit that subscribers receive from these applications and the amount they pay for them.
Evaluating these direct benefits is difficult because subscribers do not pay directly for many of them. However, subscribers do pay a fixed charge for broadband access. Clearly, any person who chooses to pay for a broadband subscription must regard the value of the applications which they use over the connection as greater than the subscription charge. The amount paid in subscription charges therefore provides an indication of the value of broadband to consumers. It is, in fact, a minimum estimate of the benefits accruing to subscribers from broadband since, for the majority of subscribers, the benefits they receive will exceed the amount they pay in access charges.
In this study, the economic benefit to subscribers of specific applications was also calculated. These benefits are not additional to those reflected in subscription revenues. Instead, they are used to illustrate the value of broadband, as estimated using the value of subscription revenues.
(19)
EC/ESA Digital Divide CBA – Final Report 6 October 2004
Benefits to providers of services When people subscribe to broadband, the suppliers of some services (to those subscribers) are able to provide these services to these subscribers in a more efficient way than using conventional means. They therefore receive benefit from an increase in broadband subscriptions. This is an example of a network externality. The magnitude of this benefit can be estimated by measuring the costs that are saved when people choose to receive these services via broadband connections instead of via conventional means.
In the case of goods and services provided on a commercial basis, it is expected that some of the cost savings arising from more efficient delivery channels would be passed on to consumers through lower prices. This would be reflected in the lower price paid by consumers for goods and services, ordered over the internet compared with those that they purchase through conventional retail channels. The benefit that subscribers obtain from being able to access these lower prices would be included in subscribers’ direct valuation of broadband access. However, the benefits that are retained by the suppliers of services would be additional. It is not possible to determine in advance how the process of competition will allocate these benefits between suppliers and consumers.
In the case of public sector services, citizens might benefit from being able to obtain public sector services online but the providers of public sector services clearly also benefit from the lower costs of providing these services to customers. This benefit is additional to the direct benefits received by subscribers.
Indirect benefits There are a number of indirect benefits arising from an increased use of broadband. Some of these benefits are quantifiable while some are more difficult or impossible to quantify. The benefit that is the most straightforward to quantify is the reduction in pollution that comes from a reduced need to travel when services are provided over broadband connections instead of through conventional means.
There may also be additional indirect benefits which arise through increased educational attainment, reduction in illiteracy, reduced crime rates, increased incomes in poor and/or rural areas etc. In addition, therefore, to the obvious benefits to rural areas which may encourage population stability and provide impetus for alternative employment providers to agriculture, the above additional indirect benefits may be material. It is clear that these additional benefits do exist and it is possible to illustrate them with case studies but it is difficult to quantify or evaluate them.
(20)

EC/ESA Digital Divide CBA – Final Report 6 October 2004
Estimation of the value of economic benefits
We have used the amount paid by subscribers in regular fixed charges as an indication of the direct benefits of broadband. This is a minimum estimate of the benefits accruing to subscribers from broadband since, for the majority of subscribers, the benefits they receive will exceed the amount they pay in access charges.
In addition to this general estimate of the direct benefits to broadband subscribers, we have also estimated the benefits to subscribers of particular private applications – teleworking, home shopping and e-commerce. These provide an illustration of the direct benefits of broadband to subscribers. They also provide an estimation of the indirect benefits associated with the use of broadband.
Widespread broadband access also brings benefits to the providers of public services. These arise from a reduction in costs when these services are provided via broadband instead of through conventional channels. We have calculated the benefits of e-government, e-health and e-education across Europe. These benefits are additional to the direct benefits accruing to broadband subscribers. We have also provided a discussion of specific public sector applications of broadband access which exist but are not widespread. We have provided a summary of the evidence on the costs and benefits associated with these applications which are, typically, high-bandwidth applications which can only be provided over broadband connections.
Conclusions on benefits
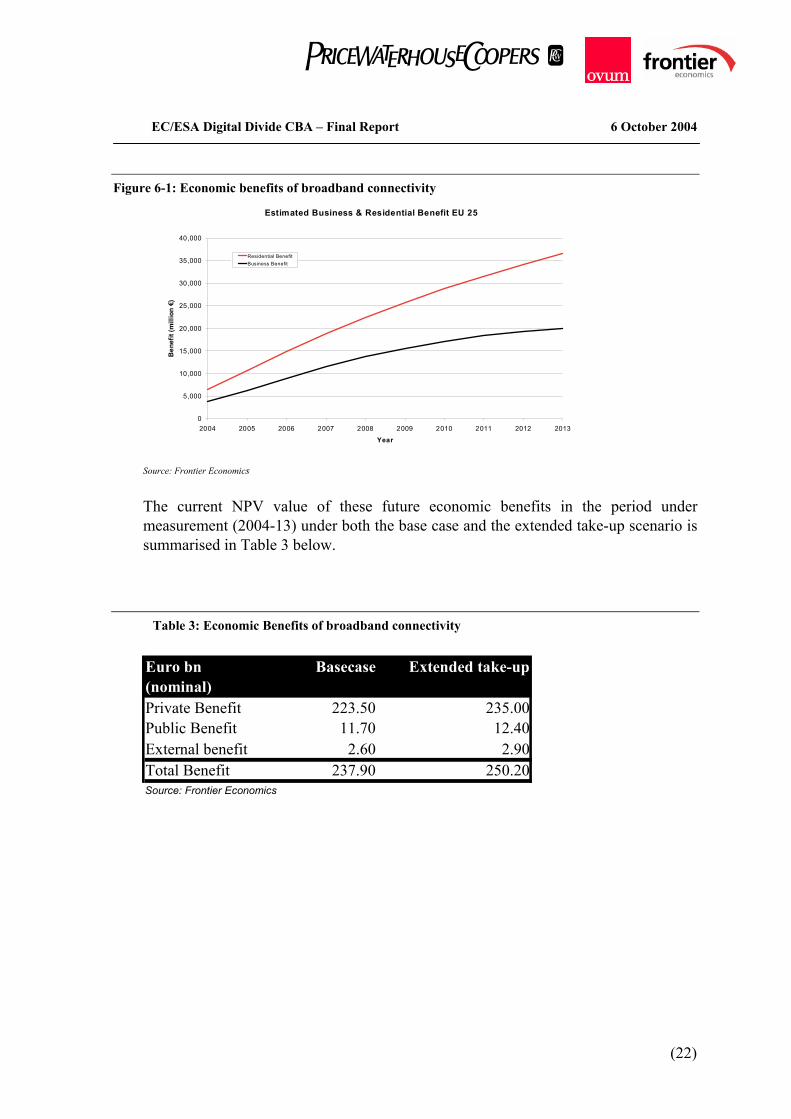
The modelling indicated that the benefits of widespread adoption of broadband in Europe will have significant economic benefits. The growth in these benefits as broadband networks in Europe expand under the base case is illustrated in figure 6-1 below.
(21)
EC/ESA Digital Divide CBA – Final Report 6 October 2004
Figure 6-1: Economic benefits of broadband connectivity
Estimated Business & Residential Benefit EU 25
0
5,000
10,000
15,000
20,000
25,000
30,000
35,000
40,000
2004 2005 2006 2007 2008 2009 2010 2011 2012 2013
Year
Ben
efit
(mill
ion
€)
Residential BenefitBusiness Benefit
Source: Frontier Economics
The current NPV value of these future economic benefits in the period under measurement (2004-13) under both the base case and the extended take-up scenario is summarised in Table 3 below.
Table 3: Economic Benefits of broadband connectivity Euro bn (nominal)
Basecase Extended take-up
Private Benefit 223.50 235.00Public Benefit 11.70 12.40External benefit 2.60 2.90Total Benefit 237.90 250.20Source: Frontier Economics
(22)

EC/ESA Digital Divide CBA – Final Report 6 October 2004
7 Conclusions on Cost Benefit
To make conclusions on Cost Benefit, the cost and benefit forecasts derived from the study for the period of measurement have been combined into one financial model, which also incorporates the financing costs of the rollout of the required infrastructure.
In order to recognise that the value of costs and benefits today are worth more now than at some future date, the analysis of the true cost benefit must include the calculation of the Net Present Value (“NPV”) of the forecast costs and benefits – the value of future flows discounted back to the value of today. The NPV of any project in which costs and benefits are spread over a long period will be fairly sensitive to the discount rate chosen as the costs and benefits of implementing this project accrue over a period of more than ten years, but the majority of costs occur at the beginning of the period and the benefits come later and grow over time. The discount rate has a greater effect the further into the future it is applied.
For the purpose of our calculating NPV, we have assumed a base case discount rate (or Weighted Average Cost of Capital) of 7.07%. This takes into account the average cost of debt and equity across Europe today, and incorporates an element of risk derived from current average industry and country-specific characteristics.
In this Cost Benefit Analysis we have estimated the total benefits (urban and rural) and the total costs arising from widespread broadband access, with the broad conclusion that the total benefits outweigh the total costs. However, as might have been anticipated, we have noted significant differences between urban and rural areas.
We have calculated in our report the potential NPV’s of the net benefits and benefit: cost ratios separated into rural and urban areas with the following results:
Table 4: Benefit: Cost Ratio (including estimates after 2013)
NPV Ratios Rural Urban TotalBase Case 1.32 1.83 1.69Extended Take-up 1.29 1.83 1.68
Our analysis indicates a total general benefit: cost ratio of 1.69x for the provision of digital services across the European Union, taking into account the more material net benefits estimated to arise in the period after 2013. This implies that the NPV of the benefits is 69% larger than that of the costs and should be regarded as a strongly positive ratio. It suggest that the rewards of rolling out infrastructure to bridge the digital divide in Europe are likely to be substantially greater than the investment
(23)

EC/ESA Digital Divide CBA – Final Report 6 October 2004
required to do so. The lower ratios evident in the extended take-up scenario are reflective of the higher costs of providing connectivity to the additional users in rural areas, compared with the incremental benefits experienced from the increased take-up.
This benefit ratio is however significantly lower in rural areas compared to urban. In fact it is only 1.32x, even including the more material net benefits estimated to arise in the period after 2013. This implies a much more marginal case for market forces providing broadband in rural areas. If the benefits arising after 2013 are excluded, then the ratio in rural areas for the period between 2004-2013 falls to 1.13x. It is therefore to be expected that rollout of terrestrial broadband services will slow to a natural halt once the levels of availability and take-up indicated in the study have been achieved, leaving a substantial number of would-be users unserved. This supports the case for public sector funding in these areas, if the objective of offering up to 100% availability is to be achieved.
Table 5: NPV of Net Benefits (including estimates after 2013)
Total NPV Rural Urban TotalEuro billionBase Case 37 260 297
tended Take-up 37 275 312Ex
Table 5 above shows the total Net Present Value of the net benefits achieved from the combined urban and rural regions in the base case, including a value for future costs and benefits after 2013, is estimated at €297bn, or approximately €66 per annum for each head of population in the newly extended Europe.
(24)

EC/ESA Digital Divide CBA – Final Report 6 October 2004
(25)
8 Next steps
The major challenge for Europe is to roll out broadband as quickly as the other competitive world economies. Although market forces can mostly be relied upon to achieve this in urban areas, Europe faces particular challenges in sustaining the economic viability of its rural areas. Any solution for these areas will take time, coordinated policy, and possibly state aid or incentives. The danger for solutions that require time to plan and implement is that they may be displaced by less competitive economic solutions if timescale becomes the driver. A delay in the implementation could also cause migration of businesses as well as people from rural areas towards the well-connected urban areas. It is therefore likely that satellite will have an important role to play in the mix of technologies that will be a part in bridging the digital divide in rural or less privileged areas of Europe.
The preliminary results of this Cost Benefit Analysis have highlighted that, as anticipated, there remains a sizeable demand for broadband within Europe that is unlikely to be met by market forces in the medium term (mostly in rural areas). A logical next step will be to examine in more detail the extent of this gap in broadband provision, highlight potential solutions to fill the gap and prepare a business plan for a project to put an optimal solution into practice.