example - lori's web
TRANSCRIPT
217
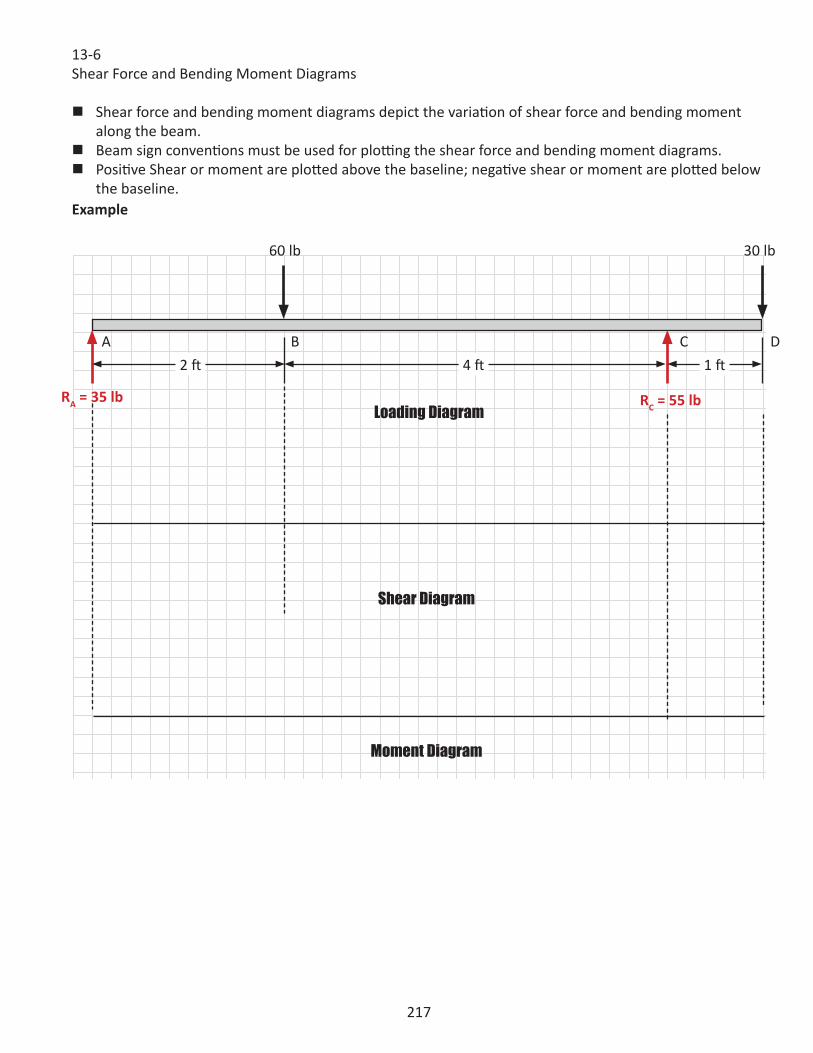
13-6Shear Force and Bending Moment Diagrams
� Shear force and bending moment diagrams depict the variation of shear force and bending moment along the beam.
� Beam sign conventions must be used for plotting the shear force and bending moment diagrams. � Positive Shear or moment are plotted above the baseline; negative shear or moment are plotted below
the baseline.
A B C D
RA = 35 lb RC = 55 lb
60 lb 30 lb
2 ft 4 ft 1 ft
Shear Diagram
Moment Diagram
Example
Loading Diagram
218
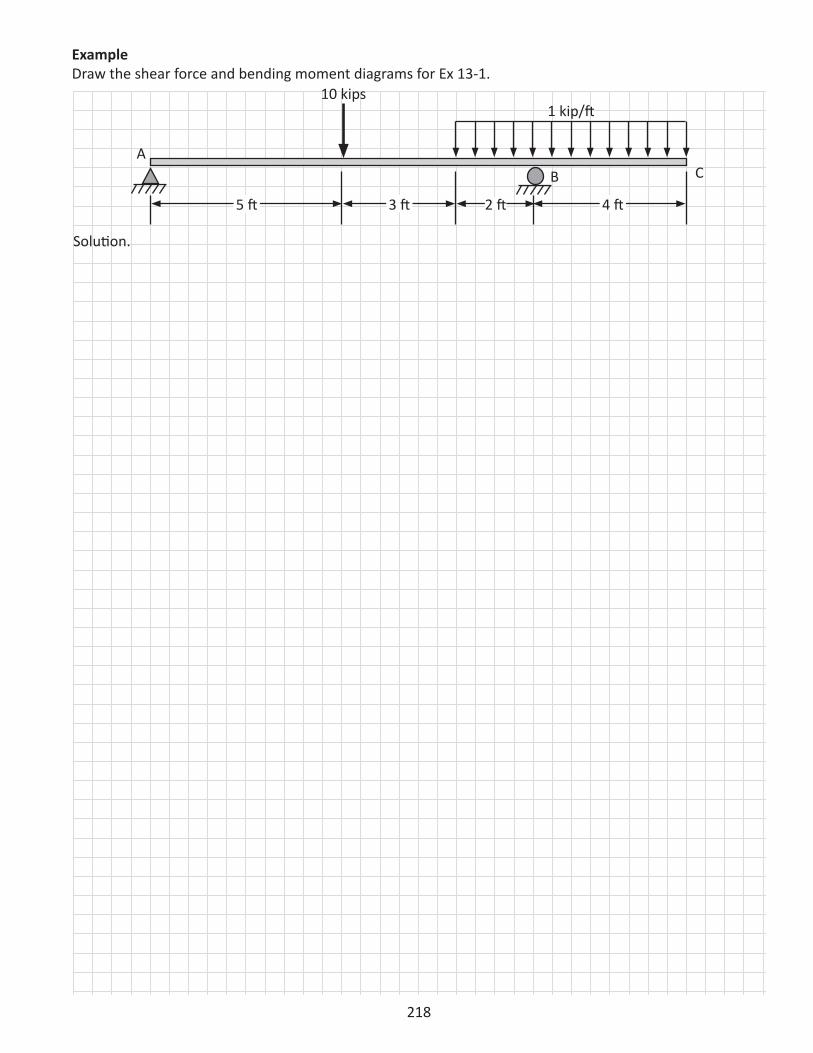
Solution.
AB C
1 kip/ft
5 ft 3 ft 4 ft2 ft
10 kips
ExampleDraw the shear force and bending moment diagrams for Ex 13-1.
219
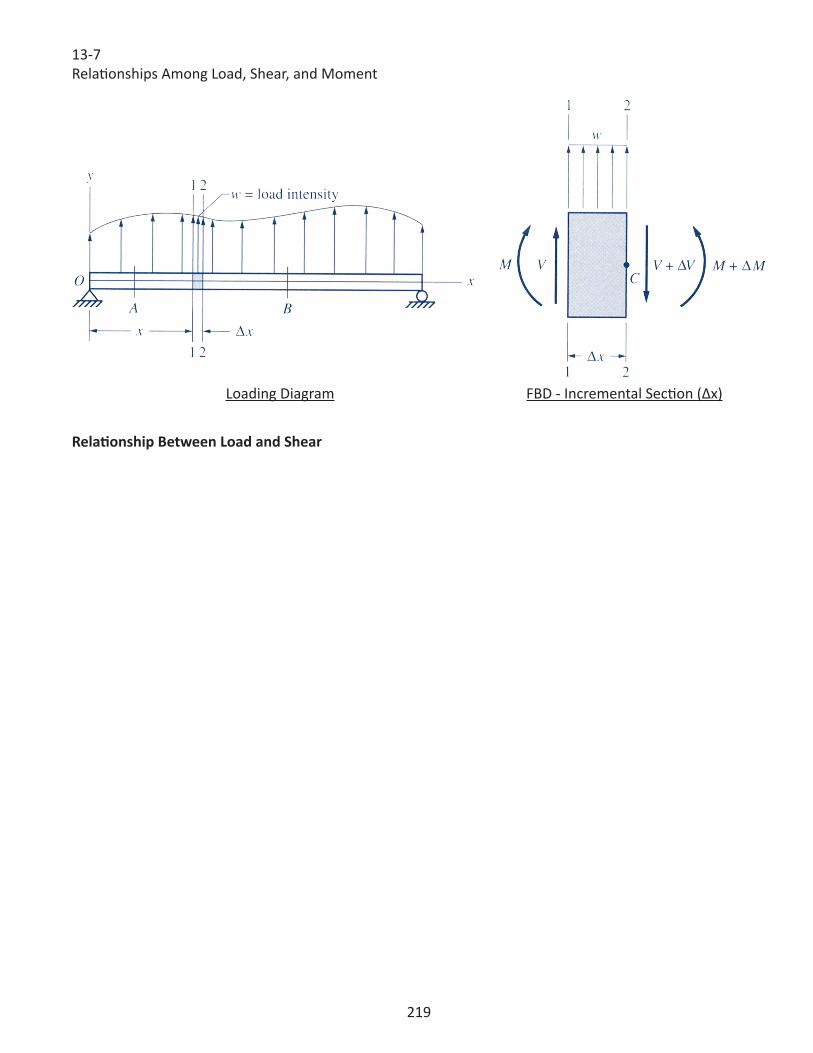
13-7Relationships Among Load, Shear, and Moment
Relationship Between Load and Shear
FBD - Incremental Section (Δx)Loading Diagram

220
Relationship between Shear and Moment
221
13-8Sketching Shear and Moment Diagrams Using Their Relationships
The relationships established in the previous section may be used to facilitate the sketching of shear force and bending moment diagrams.
Loading Diagram. Show all the applied forces and reactions on the beam, including all the relevant dimensions along the beam. Never replace a distributed load by its equivalent concentrated force.
Shear Diagram. The following procedure may be followed for sketch ing the shear diagram: 1. For convenience and clarity, the shear diagram should be drawn directly below the loading diagram.
A horizontal baseline for the shear diagram is drawn at a proper location below the loading dia gram. Draw lines vertically downward from controlling sections, including the sections at the supports, sections at the concentrated forces, and the beginning and end of a distributed load.
2. Starting at the left end, compute the shear at the controlling sections using Equation 13-5. Note that at the section where a concentrated force is applied, the shear force diagram has an abrupt change of val ues equal to the concentrated load. An upward concentrated load causes an abrupt increase; a downward load causes an abrupt decrease.
3. Plot points on the shear diagram using the shear force of each con trolling section as the ordinate. A positive value is plotted above the baseline; a negative value is plotted below the baseline.
4. Connect the adjacent points plotted, and keep in mind that the slope of the shear diagram is equal to the load intensity. The shear diagram is horizontal for the segment of the beam that is not loaded. At the segment of the beam where a downward uniform load is applied, the shear diagram is an inclined line with a downward slope. If the inclined line intersects the baseline, the shear force at the point is zero. Find the location of this point.
Moment Diagram. The following procedure may be followed for sketching the moment diagram:1. The moment diagram is usually drawn directly under the shear dia gram using the same horizontal
scale. A horizontal baseline for the moment diagram is drawn at a proper location below the shear dia gram. The controlling sections for the moment diagram include those used in sketching the shear diagram plus the section where the shear is zero or where the shear changes sign.
2. Calculate all the areas under the shear diagram between the adjacent controlling sections.3. Note that the moments at the free end or the ends of a simple beam are always equal to zero. Starting
at the left end, compute the moment at the controlling sections using Equation 13-7.

222
Solution.
AB C
1 kip/ft
5 ft 3 ft 4 ft2 ft
10 kips
ExampleDraw the shear force and bending moment diagrams for Ex 13-1.
223
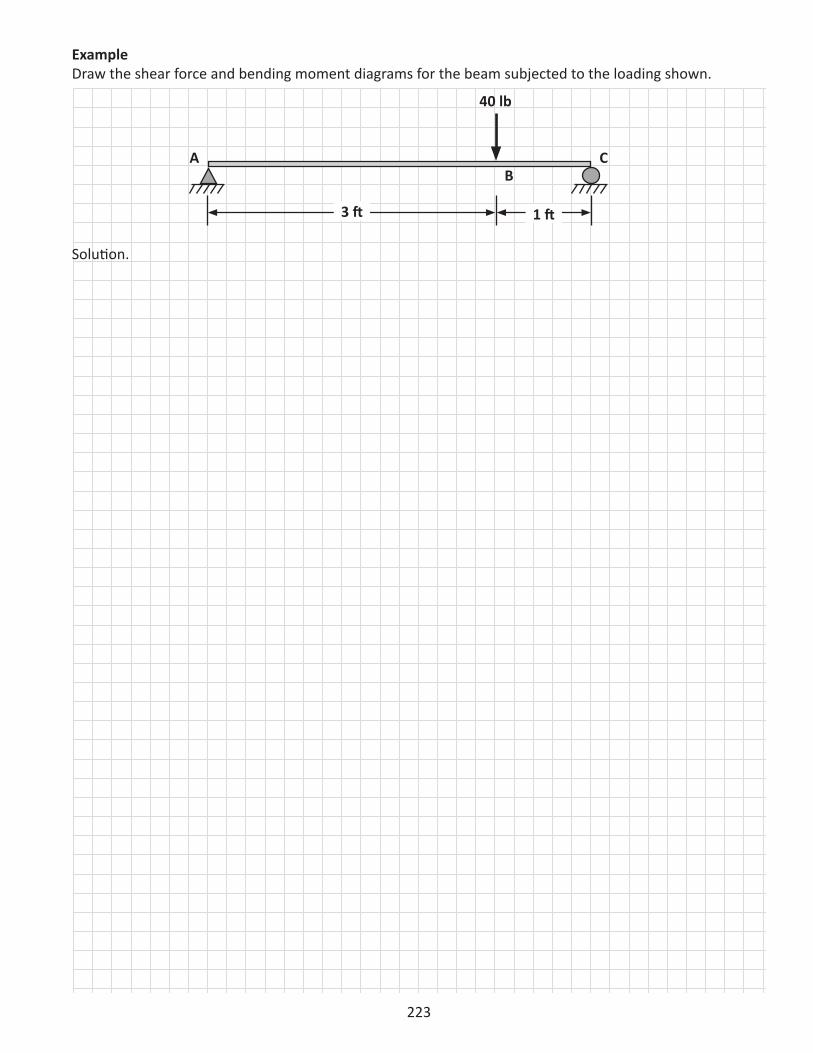
ExampleDraw the shear force and bending moment diagrams for the beam subjected to the loading shown.
40 lb
AB
C
1 ft3 ft
Solution.
224
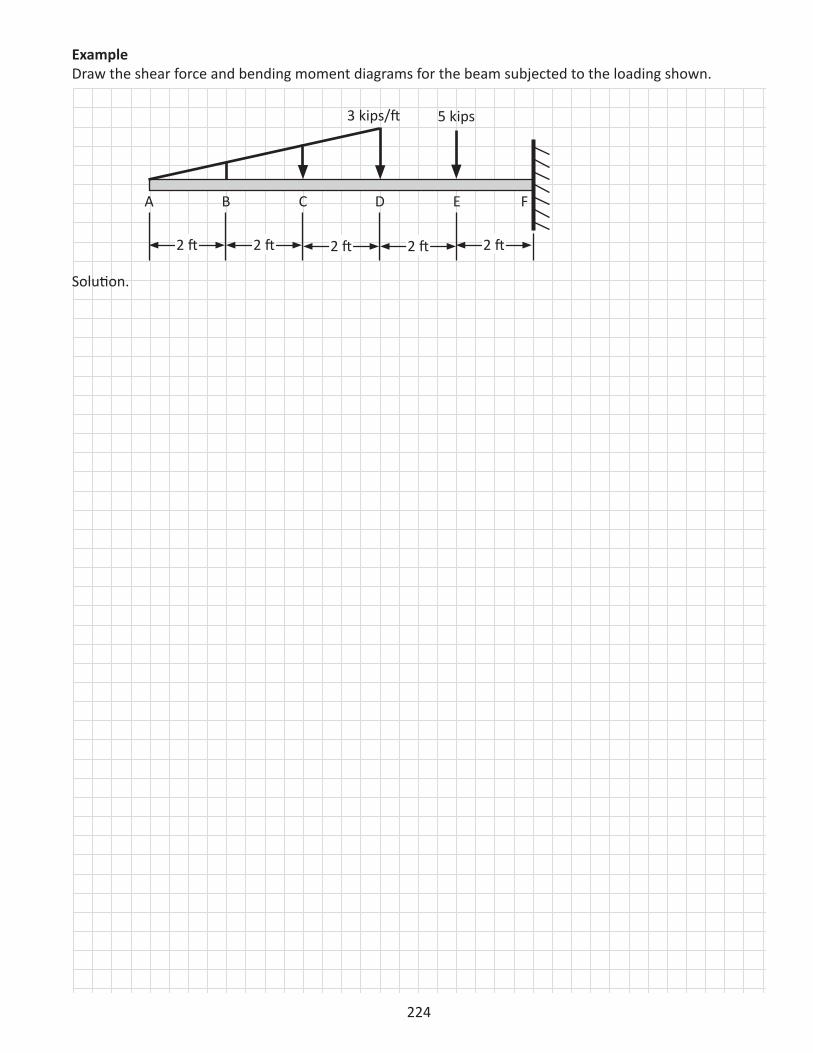
ExampleDraw the shear force and bending moment diagrams for the beam subjected to the loading shown.
3 kips/ft 5 kips
A FB C ED
2 ft 2 ft 2 ft 2 ft 2 ft
Solution.
225

226
227
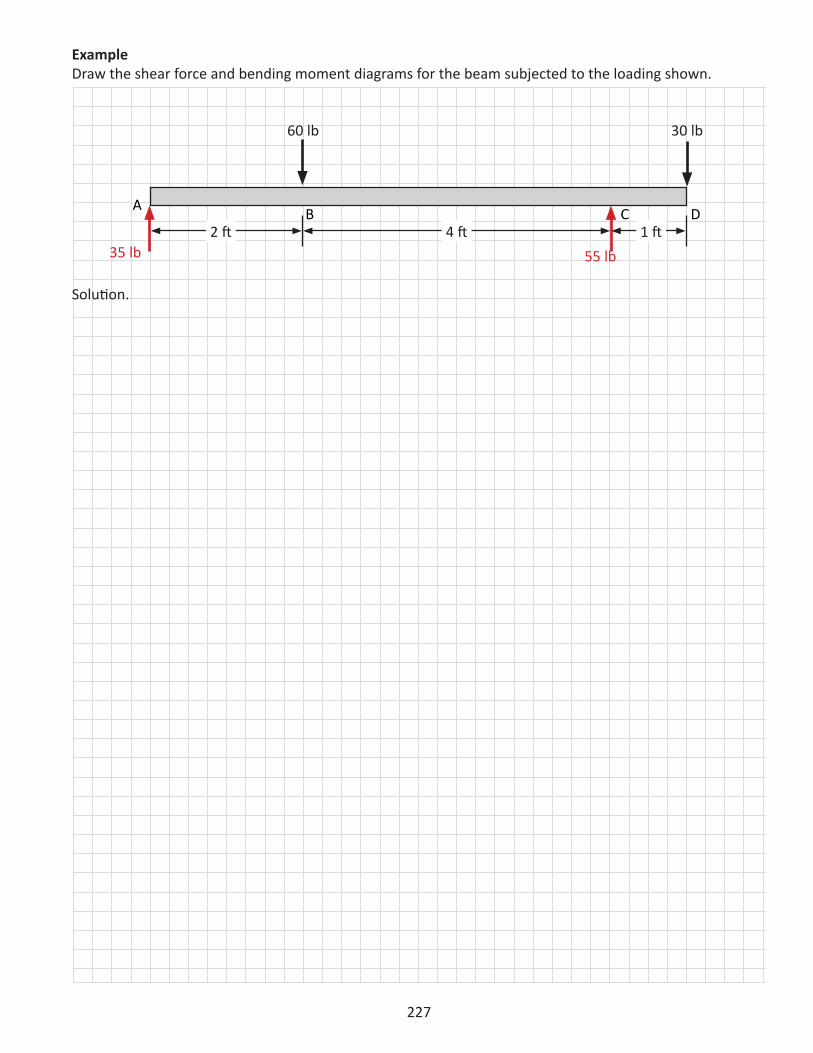
ExampleDraw the shear force and bending moment diagrams for the beam subjected to the loading shown.
2 ft 4 ft 1 ft
60 lb 30 lb
35 lb 55 lb
A B C D
Solution.
228
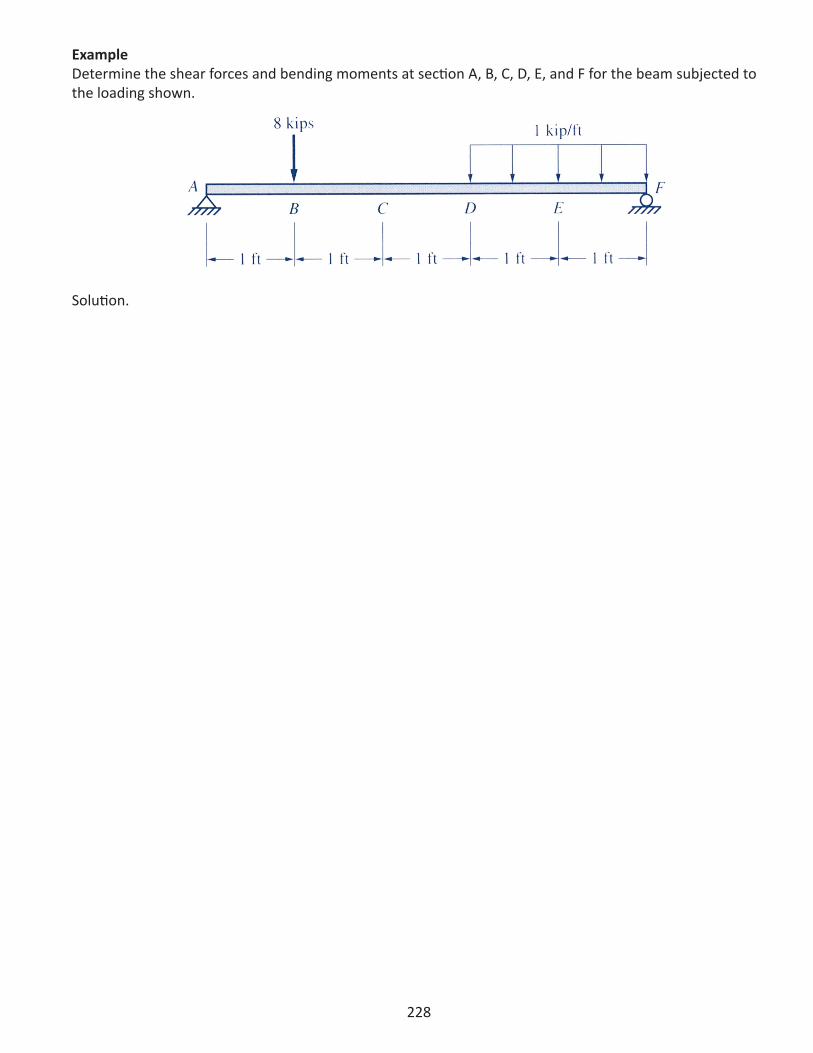
ExampleDetermine the shear forces and bending moments at section A, B, C, D, E, and F for the beam subjected to the loading shown.
Solution.

229
230
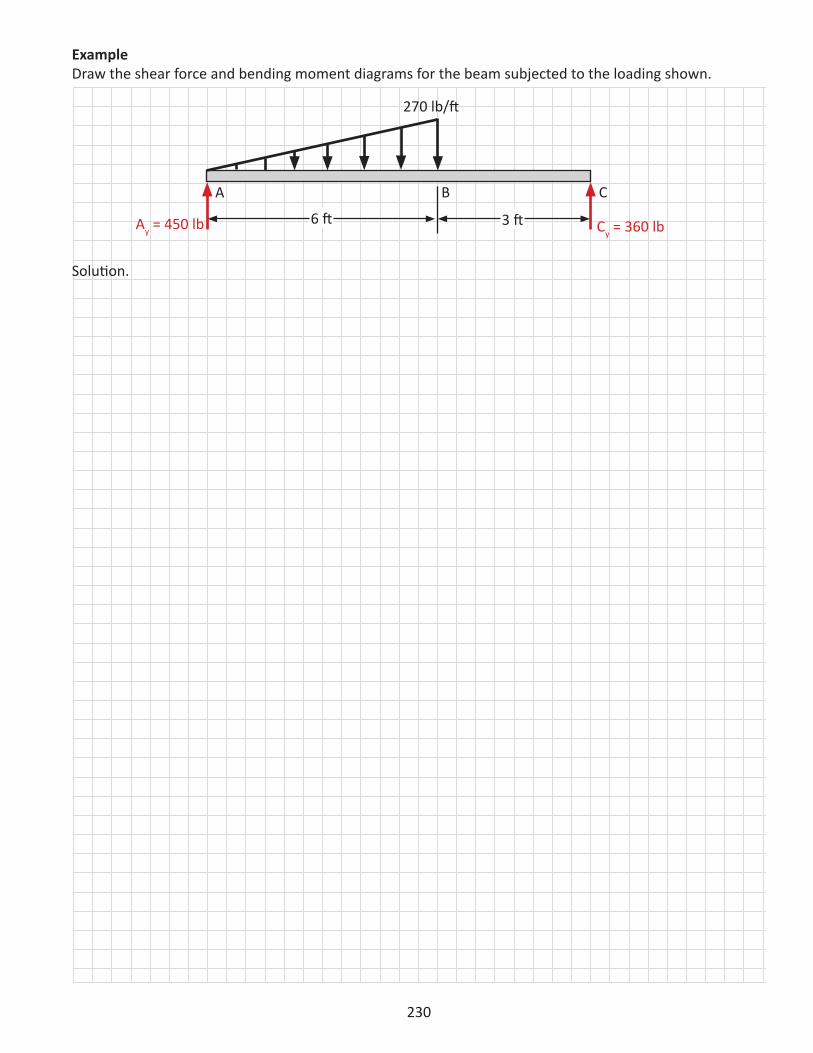
ExampleDraw the shear force and bending moment diagrams for the beam subjected to the loading shown.
270 lb/ft
A B
6 ft 3 ft
C
Ay = 450 lb Cy = 360 lb
Solution.
231
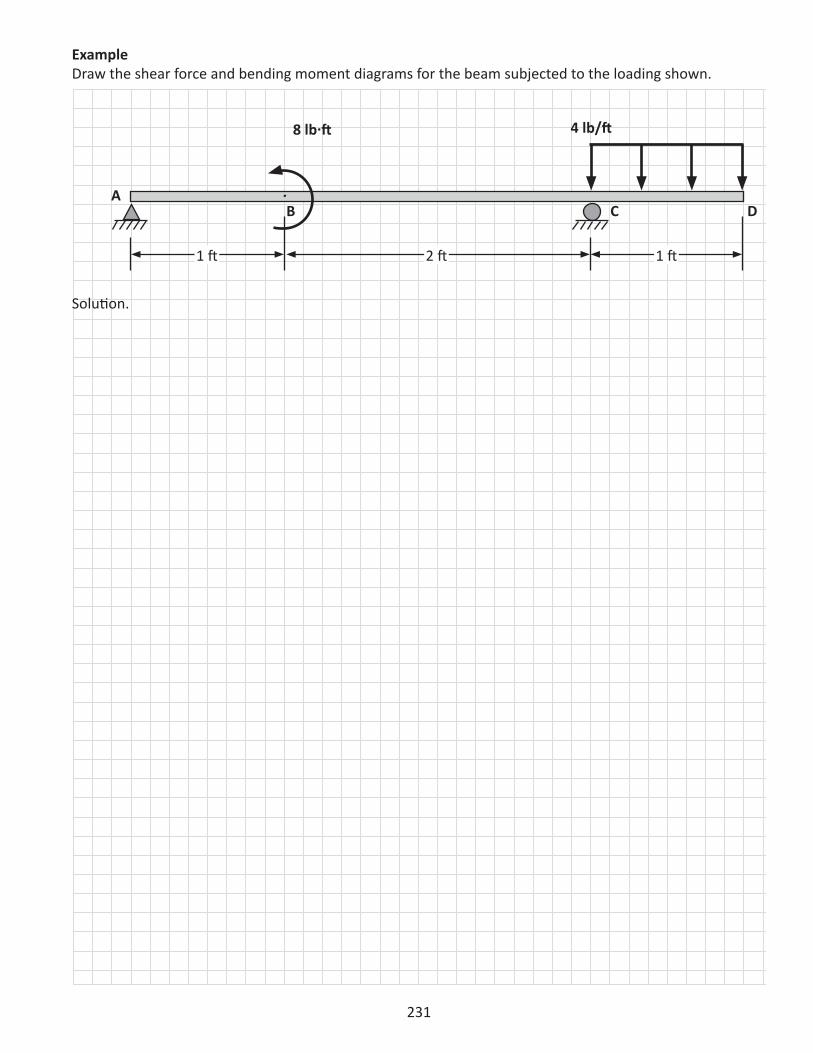
ExampleDraw the shear force and bending moment diagrams for the beam subjected to the loading shown.
Solution.
4 lb/ft
AB C D
1 ft 1 ft2 ft
8 lb·ft
232
233
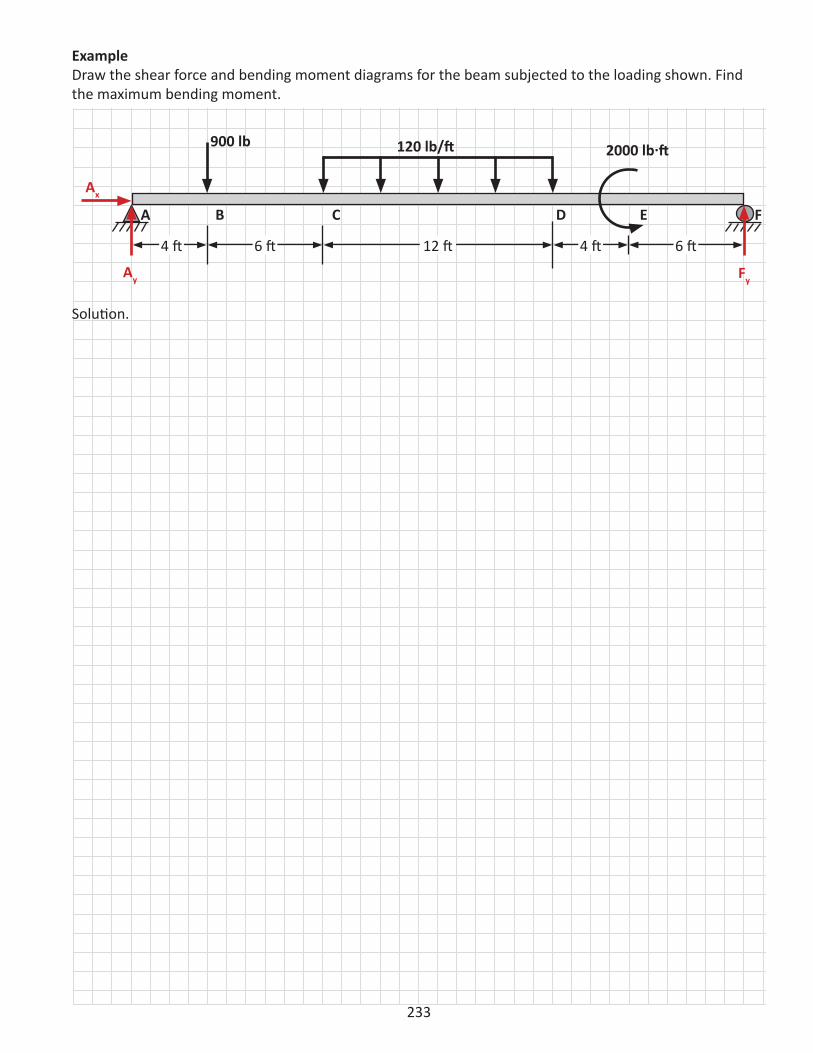
ExampleDraw the shear force and bending moment diagrams for the beam subjected to the loading shown. Find the maximum bending moment.
A B C D E F
120 lb/ft 2000 lb·ft900 lb
Ay Fy
12 ft6 ft4 ft 4 ft 6 ft
Ax
Solution.

234
235
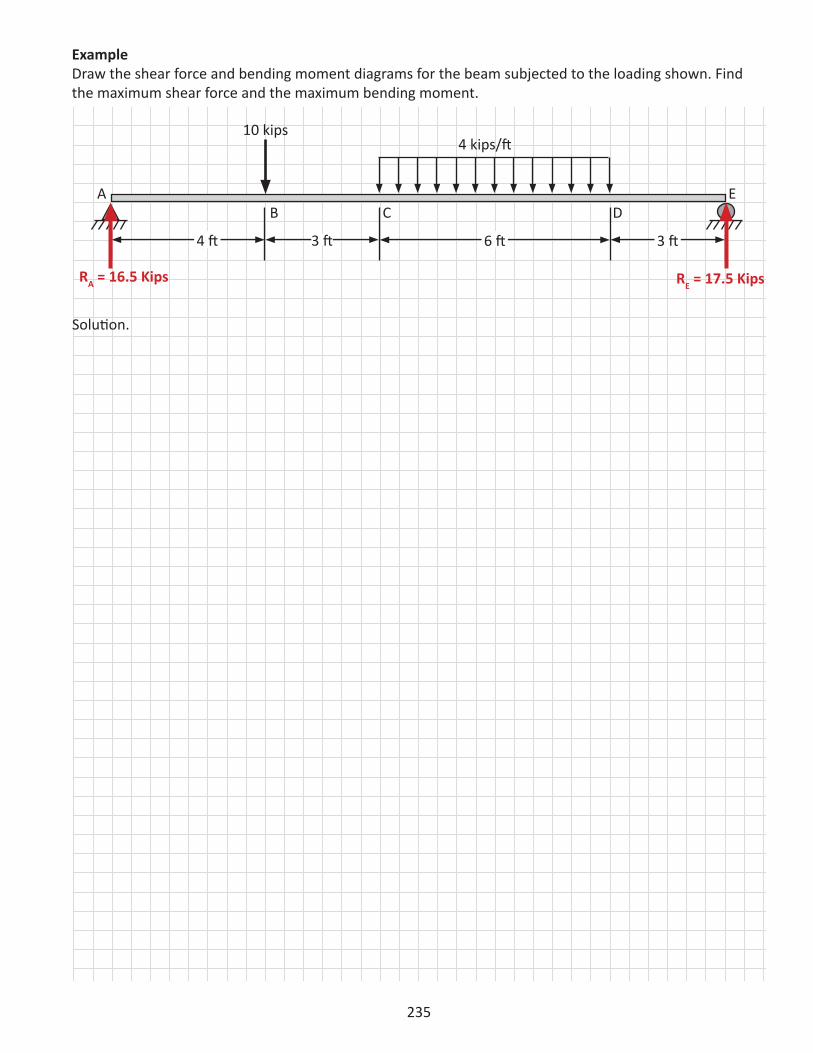
AD
E
4 kips/ft
4 ft 3 ft3 ft
10 kips
6 ft
B C
RA = 16.5 Kips RE = 17.5 Kips
ExampleDraw the shear force and bending moment diagrams for the beam subjected to the loading shown. Find the maximum shear force and the maximum bending moment.
Solution.