examining the impact of visa restrictions on international ... · 1 examining the impact of visa...
TRANSCRIPT

1
Examining the impact of visa restrictions on international
tourist flows using panel data
Andrés Artal-Tur a,b
, Vicente J. Pallardó-López b, Francisco Requena-Silvente
b, 1
a Department of Economics, Technical University of Cartagena, C\ Real 3, 30201,
Cartagena, Spain b Institute of International Economics (IEI-UV), Avda dels Tarongers s/n, 46022,
Valencia, Spain
Abstract
Tourism has become a major global industry, with world arrivals reaching 1 billion
numbers in 2012. However, important barriers to travel still exist internationally. Using
newly panel data we explore the effects of visa restrictions on international tourist
flows in a theory-grounded gravity model. We find a robust, causal negative impact of
visa restrictions on international flows, improving accuracy of estimates in the
literature. By destination, the detrimental impact of this type of barrier is observed for
tourists going to developing countries, but not for those to developed ones. By country
of origin, the impact of visa restrictions appears to be the same for tourists coming
from developed and developing countries. These findings have important
consequences in policy terms for tourism management at a regional level.
Keywords: international tourism, visa restrictions, panel data, gravity model,
developing countries.
Acknowledgements: This document has been produced with the financial assistance of the European Union within the context of the FEMISE program (FEM35-04-CP2011). The contents of this document are the sole responsibility of the authors and can under no circumstances be regarded as reflecting the position of the European Union. The authors also acknowledge financial support from the Spanish Ministry of Science and Innovation (project ECO 2011-27619/ECON) and Generalitat Valenciana (project Prometeo/2011/098). 1 Corresponding author. Institute of International Economics (IEI-UV), University of Valencia, Avda dels
Tarongers s/n, 46022, Valencia, Spain. Tel: +34 963 828 851; fax: +34 963 828 354.
E-Mail address: [email protected]

2
Examining the impact of visa restrictions on international tourist flows using panel data
1. Introduction
Many countries use visa restrictions as a mechanism to prevent entry to
unwelcome travellers. The cost and hassle of obtaining a visa represent an important
hurdle for many travellers, as it forces them to submit an application to the consular
office of their intended destination, which can ask for processing fees, impose long
waiting times, and possibly deny the visa with or without giving any reasons. Political,
economic, and security matters use to lie behind entry restrictions of people at
country borders (US Office of Immigration Statistics, 2010). However, all these
regulations present indirect, but clear effects on other people (and economic) flows,
as, for example, the arrival of tourists. Along the most recent Olympic Games in China
(2008) and the UK (2012), important number of tourists from several countries
complained about the tight restrictions on travel and visa requirements hitting the
tourism industry hard, since many travelers decided to spend their holidays elsewhere
(Songa et al., 2012; Thomas, 2012). As a result, The British Office for National Statistics
reported that foreign tourists visiting the UK during August 2012, while the Olympic
Games reached its momentum, fell 5 per cent compared to the same time on previous
year, a drop which is being blamed on arduous visa restrictions encountered (UK Visa
Bureau website). In a world where tourist arrivals have surpassed 1 billion of travels
along the past year, ignoring the impact of visa restrictions on international travel
could have serious effects on economic receipts of nations (UNWTO, 2012a).
While general opinion agrees that visa restrictions actually reduce the flow of
people, and related economic flows, it remains an empirical question to evaluate how
much. A scarce number of contributions have been recently addressing such an issue.
Neumayer (2006) started by developing an ambitious database on bilateral visa
restrictions in year 2004. His main focus was in understanding how states regulate
human mobility across territories by employing visa restrictions. Building on this
dataset, Neumayer (2010) found that countries with visa restrictions reduce on
average the bilateral flow of travellers by around 60 percent. More generally, and
employing the same data on visa restrictions, Neumayer (2011) and Bertoli &
Fernández-Huertas (2012) found that countries with visa restrictions reduce on
average the bilateral flow of exports and foreign direct investment by about 25
percent, and the bilateral flow of immigrants by around 40 percent, respectively. In
this paper we concentrate on exploring the effects of visa restrictions in tourist
arrivals.2 The novel feature of our approach lies in the use of a two-year panel data
2 According to UNWTO, a visitor is a traveller taking a trip to a main destination outside his/her usual
environment, for less than a year, for any main purpose other than to be employed by a resident entity

3
structure in order to introduce controls for country pair fixed effects when estimating
the effect of visa restrictions on international tourism. For that purpose, we have
constructed a new database of bilateral visa policies for the years 1999 and 2009 that
will be used to estimate the determinants of bilateral travel between 2000 and 2010.
As we will see, such an approach improves the accuracy of estimation of visa effects on
flows of travellers.
Most papers on the determinants of international tourist flows use either total
number of arrivals to a country over a period of time (Zhang and Jensen, 2007) or a
pooled of annual origin-to-destination arrivals (Eilat and Einav, 2004; Gil-Pareja et al.,
2008; Neumayer, 2010) as their dependent variable. Baltagi et al (2003) and Chen and
Wall (2005) show that a standard gravity model of trade with cross-section of data or
pooled data tends to be biased because of unobserved or incorrectly specified
heterogeneity issues. In the context of flows of travellers and visa restrictions, such
bias could arise if there were, e.g., historical reasons for a low level of any type of
bilateral exchange, included travellers, as well as for low level of political and
diplomatic relationship between the two countries. It might also be that the measures
of physical or cultural distance used in standard gravity models were biased measures
of distance-related transaction costs. If unobserved components of political, historical,
cultural and geographical proximity positively affect visa policy and international
travel, OLS estimates would suffer from endogeneity bias and overestimate the true
effect of visa restrictions on international travel.
We include visa restrictions into a theory-grounded gravity equation. The data
has a time dimension that we exploit in order to take into account unobserved
heterogeneity by differencing out unobserved country-pair specific characteristics. The
advantages of this approach in the gravity context have been corroborated, among
others, by Baier and Bergstrand (2007) and Head et al (2010). Moreover, we are able
to perform a regression-based test for strict exogeneity (Wooldridge, 2002).
We report three major results. First, failing to control for observed time variant
heterogeneity and unobserved heterogeneity indeed leads to overestimation. When
the estimation control for country pair fixed effects, the OLS estimate of the coefficient
of visa restriction falls by more than 60 percent (from 0.61 to 0.23). Second, visa
restrictions deter tourists going to developing countries, in particular to Eastern
Europe, Central Asia, Africa and Middle East, but not those going to developed
countries. Finally, the detrimental impact of visa restrictions is similar for tourists from
both developed and developing countries.
in the country or place visited. A visitor is classified as a tourist (or overnight visitor), if the trip includes an overnight stay at the destination country (IRTS, 2008). In this paper we employ data on international tourist arrivals taken from UNWTO database, although not being able to distinguish the purpose of the visit (leisure, business or personal). In this context, the subject of our study will be that of the “international tourist”, ruling out domestic trips.

4
2. Methods
2.1 Econometric specification
A conventional fixed-effects gravity model estimating the link between NTAodt, the
annual number of tourists (arrivals) from origin country o to destination country d at
time t, and VISAodt, a binary dummy variable that takes value of one if citizens from
country o need a visa to visit country d at time t, might be presented as follows:
(1)
where the vector collects time-invariant dyadic indicators of geographic and
cultural proximity, which can influence bilateral travel costs; and the vector
collects time-variant dyadic measures of economic, political or historical links that
stimulate the exchange of people between countries, such as diplomatic
representation, migrant networks or the intensity of trade relations. We include a
comprehensive set of country-and-time effects and to control for all origin and
destination specific determinants, in particular for multilateral resistance terms. Finally
we impose the error structure where is a dyad-effect and
the usual idiosyncratic error term. In the presence of unobserved confounding factors,
explanatory variables will be correlated with the error term so that OLS is invalid.
In order to control for we can proceed by estimating equation (1) including
country pair dummies to eliminate .
2.2 Data collection and analysis
Data for annual bilateral tourist arrivals (by country of origin and destination)
are taken from the United Nations World Tourism Organization database (UNWTO,
2012b) and cover the years 2000 and 2010.
[INSERT TABLE 1 AROUND HERE]
Table 1 describes the geographical pattern and recent evolution of the total
number of arrivals and departures. In 2000 there were 681.1 million people traveling
from one country to another; ten years later, the number was 941.6 million, which
implies an average annual growth around 3.2 percent. Whereas it is a positive trend,
this rate shows a lower dynamism than that of international trade (5.1%) for the same
period. In both cases, the so-called Great Recession (i.e., the current economic crisis
which started in the summer of 2007 and had its main impact for 2008 and 2009)
caused a serious slowdown in these international flows.
High income countries represented in 2010 almost 60 percent of the
destination of total international tourists, mostly concentrated in Western Europe (43
percent). However, on average the number of travelers grew at faster rate in non-high

5
income countries- the exception being the high income countries in the East and
Pacific region. The region with the highest annual growth rate of arrivals between 2000
and 2010 was Middle East and Northern Africa (8.8 percent), followed by Eastern
Europe and Central Asia (6.9 percent). In contrast, arrivals to countries in North
America only grew on average 0.6 percent per annum. Both the current distribution
and the recent trend in the flows of people reflected in Table 1 are notoriously similar
to those of international trade.
Information on bilateral visa policies is obtained from the Travel Information
Manual, a monthly publication of the International Air Transport Association, IATA. We
expand the Neumayer (2006) dataset, which refers to November 2004. Our data refers
to September 1999 and September 2009, so we can track changes in visa restrictions
over time. We built a dichotomous variable signaling whether the citizens of one
country are requested to have a visa for entering into another country or they benefit
from a visa waiver. Visas upon arrival are considered as visa waivers because they need
not to be requested before traveling. The dataset contains 179 countries of destination
and 188 countries of origin. Graphic 1 offers a global landscape, grouped by main
geographical areas, of visa restrictions and its evolution for the 2000-2010 period, both
from the perspective of visa imposed to visitors to a particular region (Panel A) and
from that of the number of countries which set visa to the citizens of that region (Panel
B).
[INSERT FIGURE 1 AROUND HERE]
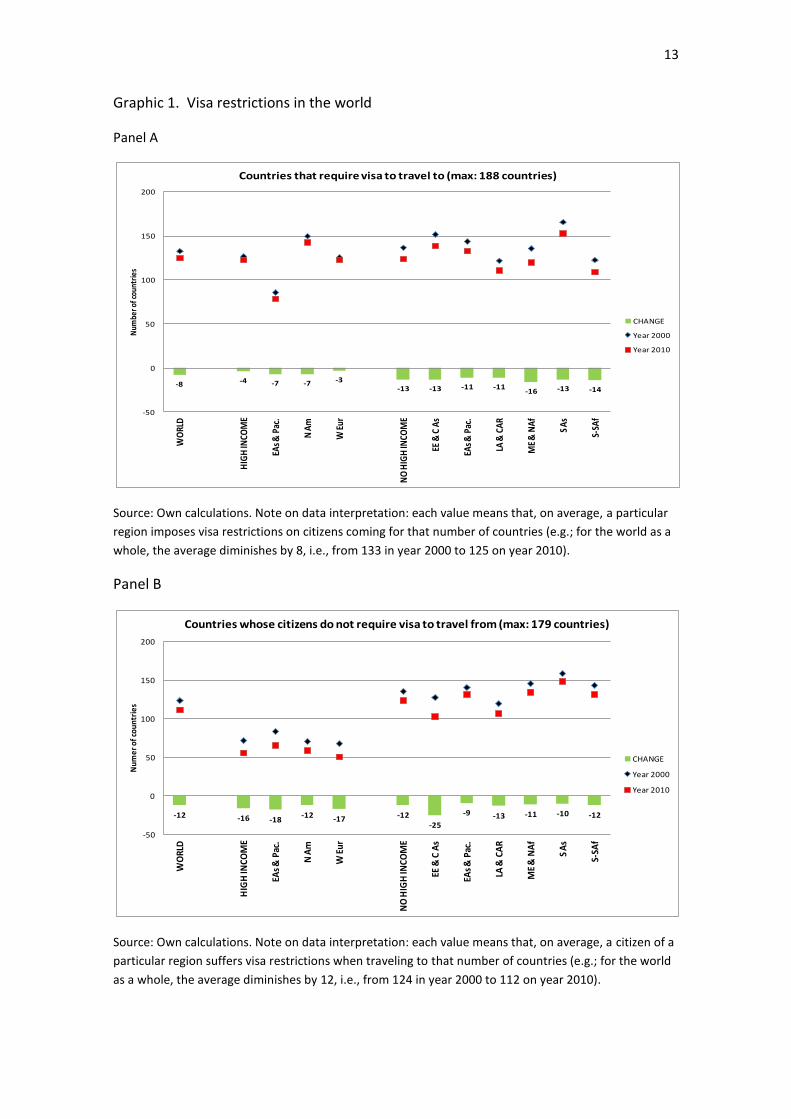
The number of changes to visa restrictions is relatively small compared to the
total number of restrictions in place. However, data show a unanimous trend towards
the reduction of visa requirements, whatever the region considered3. This general
pattern stands, for the average country in any area, both for the number of restrictions
imposed to foreign visitors and for the quantity of visas limiting that average country´s
citizen freedom to travel abroad.
Taking into account the countries where information is available for the 2000-
2010 period, the net reduction in the number of visa restrictions is slightly lower than
10 percent (from the initial level in 2000), and that trend towards a cut in this kind of
barrier sped up between 2005 and 2010 with respect to the previous five-year period.
A stronger path towards more flexibility appears among non-high income countries
3 Several examples proving this trend, among many others and coming from countries in different
continents and with an uneven degree of development could be underlined: since 2001, EU citizens except from the UK and Ireland are exempted from the visa requirement when travelling to Albania. Since 2007, Cambodia allows all foreign visitors to obtain a tourist visa upon arrival at the airport. Also since 2007, Philippines granted visa free to Indians nationals. Since 2008, Ecuador allows tourists from all countries but 10 to stay for up to 90 days without a visa on their arrival. However, that is not a unanimous trend, and there are cases of stricter visa policy. For example, in application of the Schengen visa policy, Spain recently introduced a tourist visa to Colombia (2002), Ecuador (2004), Chile, Peru, Argentina and Bolivia (2007), and the rest of Latin America (2009).

6
than among high income ones. The reduction in the average number of visa
restrictions in the first set of countries tripled that in the rich countries. As a result, at
the end of the period, the number of countries under visa requirements set by the
average developed country (123) was essentially equal to the number of those
affected by restrictions set by the average non-high income economy (124).
On the other hand, the high income countries enjoyed a larger decrease in the
number of visa imposed to their citizens, even if the reduction was also visible for less
developed and emerging countries4. Indeed, in 2010, an average high income country´s
citizen had to deal with less than half of visa restrictions than an average non-high
income country´s one.
Finally, reciprocity has been a common feature in the global process of cutting
the number of visa restrictions (i.e., a more liberal approach by a country with respect
to travelers coming from another country is answered with a similar change by the
partner), since about half of the total number of cuts are reciprocal.
Data on income and population in 2000 and 2010 are taken from World Bank
(2012). Time-invariant dyadic explanatory variable such as distance, contiguity,
common language, colonial relationship and same continent are obtained from Head
et al (2010). We draw on several sources for the time-variant dyadic variables: the sum
of bilateral migration stocks in 1990 and 2000 are from Ozden et al (2011); the sum of
bilateral trade flows in 1995 and 2005 are from Head et al (2010) CEPII gravity
database; the sum of the sending diplomatic contacts and receiving diplomatic
contacts in 1995 and 2005 is obtained from Rahmet et al (2010) Diplomatic Contacts
(DIPCON) database; the common membership in a economic integration agreement
(EIA) in 1995 and 2005 is obtained from Baier and Bergstrand (2007).5
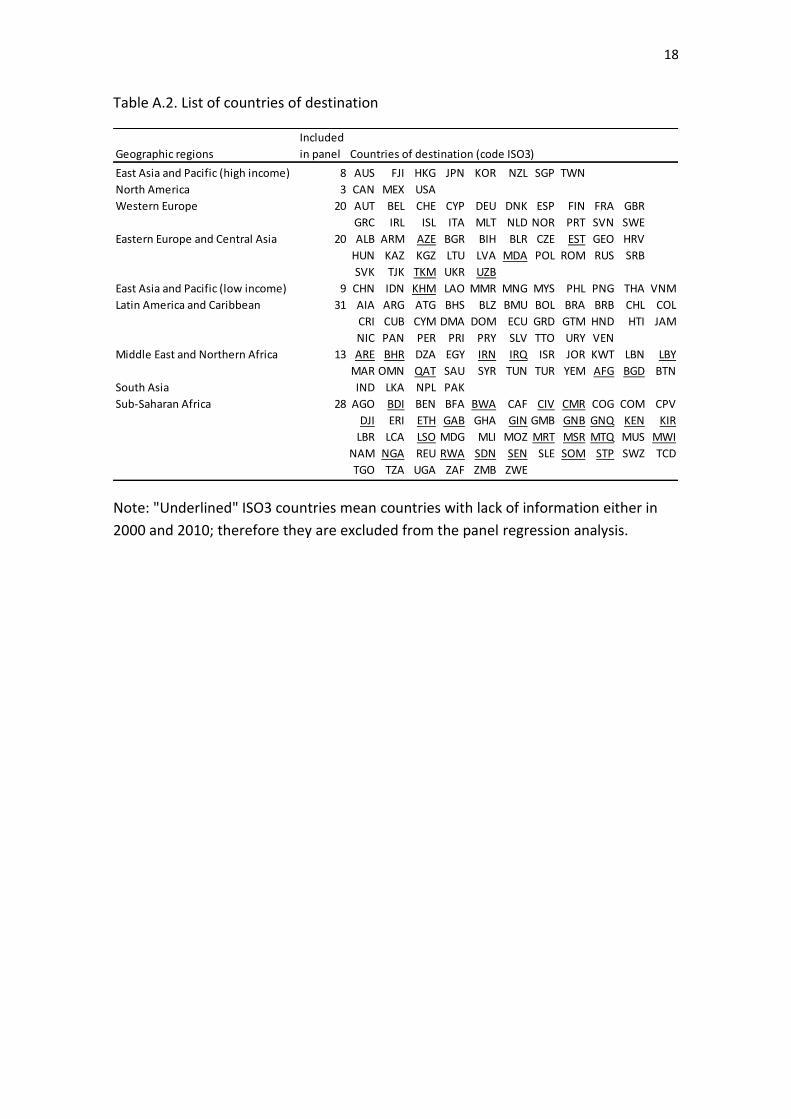
Summary statistics of the variables are displayed in Appendix Table A.1, and a
list of the countries of destination included in the analysis is displayed in Appendix
Table A.2.
3. Results
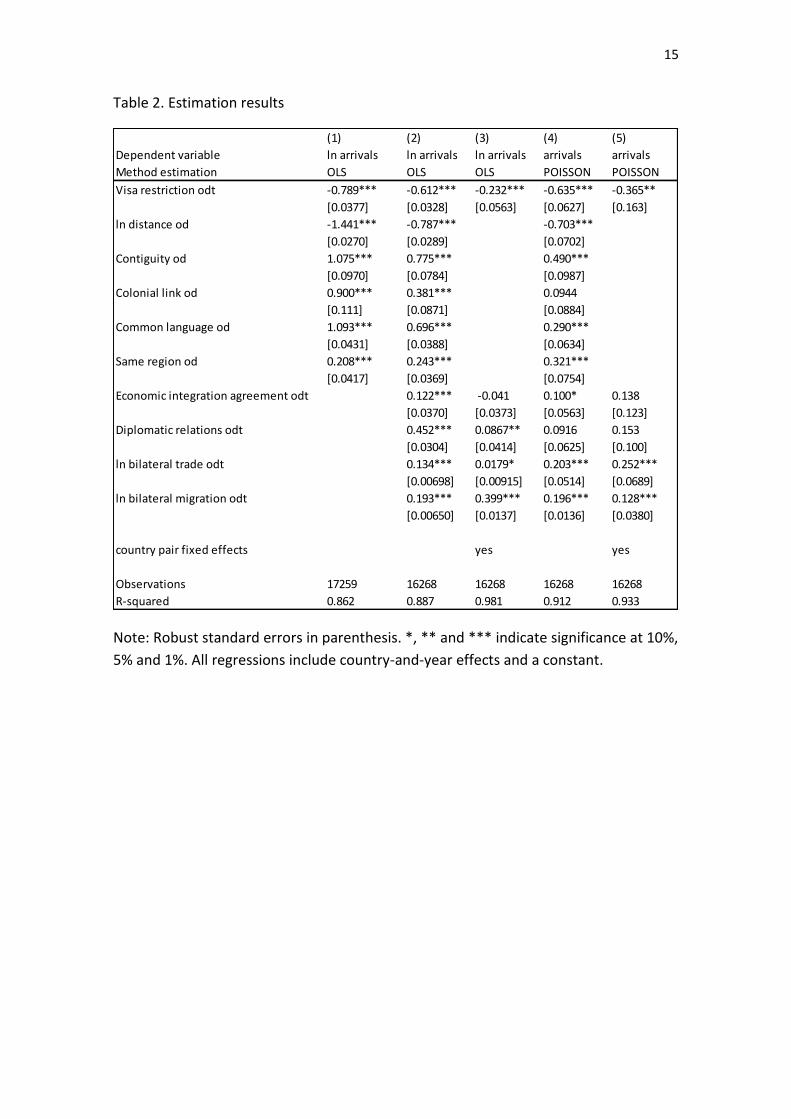
Table 2 contains the estimation results. To start with, all the estimations
include year-specific country dummies so we control for all possible observable and
unobservable country-specific characteristics. Column (1) replicates the preferred
specification of Neumayer (2010) paper using data for the years 2000 and 2010. The
estimation excludes time-variant explanatory variables ( ) in equation (1). All
the time-invariant dyadic control variables ( exhibit the expected sign and
4 The reduction in the number of visa requirements was distinctively intense for the Eastern Europe and
Central Asia region, mainly as a result of the accession of several Eastern Europe countries to the European Union during this period. 5 The web link for publicly available databases are: DIPCON database: http://www.u.arizona.edu/~volgy;
EIA database: http://kellogg.nd.edu/faculty/fellows/bergstrand.shtml;WB-GBM database: http://data.worldbank.org/data-catalog/global-bilateral-migration-database; CEPII gravity dataset: http://www.cepii.fr/anglaisgraph/bdd/gravity.asp

7
are statistically significant at conventional levels. Geographical and cultural proximity
demonstrate a very strong effect on international tourism. For example, pairs of
countries that share a common border or speak the same language on average exhibit
bilateral tourist flows three times greater than pairs of countries that do not. Turning
to the variable of interest, visa restrictions, the estimated coefficient suggest that the
existence of a visa requirement reduces the bilateral flows of tourists by 55 percent,
close to impact that Neumayer (2010) found using data for travellers in year 2005
(between 60 and 63 percent).
[INSERT TABLE 2 AROUND HERE]
In the second column of Table 2 we introduce a vector of time-variant
explanatory variables ( ). The new variables measuring economic and
political links exhibit the expected sign and are statistically significant at conventional
levels. The impact of diplomatic relations on international flows of tourists is positive:
the presence of an embassy in the country of destination of visitors increases arrivals
by 57 percent. In a similar way, if both countries are members of a regional economic
agreement, arrivals increase by 13 percent. Moreover, the higher the intensity of
exchanges of goods and migrants in the past, the larger the impact on international
travel: bilateral travel flows increase by more than 1 percent when either bilateral
trade or bilateral migration increases by 10 percent.
In addition to their own explicative role, the inclusion of time-variant control
variables, , have relevant implications on the estimated magnitude of the
coefficients of the rest of variables, included our variable of interest. All the
coefficients but one (the one of same region) are much smaller than those reported in
Column (1). For example, the coefficient on distance falls by nearly half (from -1.44 to
-.787) and the one on colonial link falls by nearly two-thirds (from 0.90 to 0.38). With
respect to our variable of interest, the existence of a visa requirement reduces the
bilateral flows of visitors by 46 percent.
The third column of Table 2 presents our preferred specification. When the
estimation controls for country pair fixed effects, a key ingredient in our analysis, the
estimate of visa restrictions dummy falls by nearly two-thirds (from 0.61 to 0.23). The
effect of visa restrictions is estimated at 20 percent, i.e. a much smaller impact than
the one reported by Neumayer (2010) or our previous estimates. In the same line of
argument, after controlling for dyad fixed effects, the positive impact of embassies on
international travel flows is approximately 8 percent, i.e. much smaller than the one
found without controlling for dyad fixed effects in this paper (column 2: 56 percent) or
in Gil-Pareja et al (2007) (table 1, column 4: 29 percent).
As robustness check we estimate equation (1) using a Poisson estimator with
clustered standard errors (Santos Silva and Teneyro, 2006). The results are presented
in columns 4 and 5 in Table 2. Results are very similar for our variable of interest: once

8
we control for country pair fixed effects, the detrimental impact of visa restrictions is
about 30 percent 6. Overall we can conclude that the lack of control for country pair
fixed effects introduces a severe upward bias in the impact of visa restrictions on
international tourist (and travel) flows.
[INSERT TABLE 3 AROUND HERE]
Next we analyze whether the effect of visa restrictions differs across groups of
countries. To test for this, we have interacted the visa restrictions variable with various
dummy variables for country groups. The results are displayed in Table 3. To start with,
visa restrictions have a more damaging effect on bilateral arrivals to developing
countries than to developed countries. Whereas such restrictions reduce bilateral
tourist flows by approximately 20 percent to developing countries, the effect is
statistically not significantly different from zero on flows to developed countries. The
reason is more likely that traveling to developed countries on average is more
beneficial for potential tourists than doing it to developing countries (cities,
monuments, cultural supplies, entertainment, nightlife, business opportunities, etc.);
as a consequence, the existence of visa restrictions does not constitute an impediment
to travel to developed countries. Among the more advanced economies, we find that
visa restrictions have statistically not significant impact to travel to any of the high-
income countries located in East Asia and Pacific (Japan, Australia, New Zealand),
North America (Canada and USA) and Western Europe. Among the developing
countries, visa restrictions have the largest effect on flows to countries in Eastern
Europe and Central Asia (-29 percent), followed by Middle East and Northern Africa (-
23 percent), Latin America and the Caribbean (-21 percent) and Sub-Saharan Africa (-
20 percent). The effect on travel to low or middle-income eastern Asia and the Pacific,
and to South Asia is negative but statistically insignificant. Note that these areas
enjoyed the highest level of economic growth in the decade under consideration,
which could make more profitable (on average) visiting those countries for business
purposes for example (India, Vietnam, Singapore, Malaysia), also being important
destinations for leisure tourism (Thailand, Nepal, Maldives). Again, if it was the case, it
may explain the lower impact of visa restrictions on tourist arrivals with respect to the
rest of less developed and emerging world.
Testing conversely for differential effects of visa restrictions on tourists coming
from certain groups of countries, we find that such restrictions have the same effect
on those coming from developed (-19 percent) and from developing countries (-20
percent). This result suggest that after controlling for unobserved time-invariant dyad
6 As a final robustness check we also took first differences of equation (1). As suggested by Wooldridge
(2002; page 285), in a two-period framework we can test whether the difference version of equation (1) satisfies the assumption of strict exogeneity E[∆u|∆X ]=0 where ∆X is the vector of first differences of all time-variant explanatory variables. When we implemented the differenced version of equation (1) and perform a F-test for joint significance, in all the specifications we could not reject strict exogeneity.
9
factors, the level of income of the countries does not matter in order to overcome the
hassle and economic costs of obtaining a visa for tourists. Nevertheless, we have large
heterogeneity in the impact of visa restrictions by geographic regions. Among
developed countries, the most strongly affected tourists are those from Western
Europe (-26 percent) and North America (-21 percent), whereas flows from East Asia
and the Pacific are not statistically affected. Among the various regions of the
developing world, visa restrictions have the strongest negative effect on international
arrivals from Sub-Saharan Africa (-34 percent) and Eastern European and Central Asia
(-21 percent). International tourists coming from low-income countries of Latin
America, East Asia, South Asia and Northern Africa not appear to be statistically
significantly affected.
As a whole, and apart from the referred differences among particular regions,
the results showed in Table 3 strengthen the main message coming from the main
estimation (Table 2): visa restrictions have a relevant impact on the number of tourist
flows around the world, with potential serious implications in terms of receipts and
related economic activity.
4. Conclusions
In this paper, we have shown that visa restrictions have a remarkable impact in
international tourist flows. However, this effect is much lower (slightly over 20%) than
suggested by previous estimations. The main reason for that difference lies in
controlling for country pair fixed effects to overcome an estimation limitation
commonly present in this literature (i.e. lack of control for unobservable heterogeneity
across pairs of countries). But, even taking into account this caution, relevant costs in
terms of economic activity still arise for tourism because of visa restrictions.
In particular, when analyzing the origin of tourists, we find evidence of a
negative and quantitatively similar impact of visa restrictions on people coming from
developed and from developing and emerging countries. Further, when studying the
effects on tourism destinations, the detrimental impact of this type of restriction
appears to be really significant for arrivals to non-high income countries, with the
exception of East and South Asia. On the contrary, no relevant effect is detected for
tourists going to rich countries. From these results, first, it could be suggested that
economic areas with a higher level (developed countries) or a higher growth (East and
South Asia) of economic activity, as well as tourism attractiveness, maintain the flow of
visitors even when visa restrictions exist, since there are larger business and leisure
opportunities. Not surprisingly these are the main world tourism destinations. And
second, it is clear that some developing regions are affected by visa restrictions in
terms of limitation of tourist arrivals, with evident impact on income generation and
development opportunities. Some of these regions have been also experiencing a
boost in tourist arrivals in the past decade as emerging destinations, i.e. Eastern
Europe and MENA region. In this way, every action directed to reduce visa restrictions
10
could become a prominent policy fostering socio-economic development in these
emerging economies.
Another interesting result of the study, although of secondary relevance given
our present focus, has been the importance shown by cultural and social proximity
issues in promoting bilateral tourist flows. Political and economic linkages as the
presence of diplomatic relations, or migration flows between countries, appear to
benefit bilateral arrivals too. Those results highlight the role of “distance”
(geographical, cultural, political) in driving tourism flows, as in the case of other type of
economic and people flows (trade, FDI, migration). Beside this, the effect of visa
restrictions appears quantitatively as a primary factor influencing international tourist
flows.
Finally, the current growing concern about terrorism and national security,
particularly intense among developed countries, is providing a basis for an increase in
entry requirements, in terms of both the number and the severity of these barriers,
including visa restrictions (US Office of Immigration Statistics, 2010). This process,
which is working even for pairs of countries not particularly associated with the origin
or the main focus of international terrorism, runs against a clear and global – even if
slow – path towards the reduction in the number of visa requirements during the last
decades. In this context, the noteworthy difference among regions we find in this
paper may support the idea that the new set of visa – and other types of – restrictions
set by the most developed countries as a result of national security concerns could
cause a limited damage in terms of decreasing economic activity. However, if the
general trend (towards less visa restrictions) turned around and the number of these
kinds of limitations grew worldwide, it could be particularly negative for most of the
less developed and emerging countries. In this way, economic effects of visa
restrictions become a central concern for tourism managers and for economic agents
in general, with particular relevance in this time of crisis.
References
Baier S.L., & Bergstrand, J.H. (2007). Do free trade agreements actually increase
members' international trade?. Journal of International Economics, 71, 72–95.
Baltagi, B.H., Egger, P., & Pfaffermayr, M. (2003). A generalized design for bilateral
trade from models. Economic Letters, 80(3), 391-397.
Bertolia, S., & Fernández-Huertas, J. (2012). Visa Policies, Networks and the Cliff at the
Border. mimeo, http://www.fedea.es/ 033_Publicaciones_VerMas.asp?id=960.
Chen, I-H., & Wall, H.J. (2005). Controlling for heterogeneity in gravity models of trade
and integration. Federal Reserve Bank of St. Louis Review, 87(1), 49-63.
11
Eliat, Y., & Einav, L. (2004). The determinants of international tourism: A three
dimensional panel data analysis. Applied Economics, 36, 1315-1328.
Gil-Pareja, S. Llorca-Vivero, R., & Martínez-Serrano, J.A. (2007). The impact of
embassies and consulates on tourism. Tourism Management, 28 (2), 355–360.
Head, K., Mayer, T., & Ries J. (2010). The erosion of colonial trade linkages after
independence. Journal of International Economics, 81(1), 1-14.
IRTS (2008). International Recommendations for Tourism Statistics 2008 (IRTS 2008).
Madrid: United Nations World Tourism Organization.
Neumayer, E. (2006). Unequal access to foreign spaces: how states use visa restrictions
to regulate mobility in a globalized world. Transactions of the Institute of British
Geographers, 31(1), 72-84.
Neumayer, E. (2010). Visa Restrictions and Bilateral Travel. The Professional
Geographer, 62(2), 171-181.
Neumayer, E. (2011). On the detrimental impact of visa restrictions on bilateral trade
and foreign direct investment. Applied Geography, 31(3), 901-907.
Ozden, C., C. R. Parsons, M. Schiff, & T. L. Walmsley (2011). Where on Earth is
Everybody? The Evolution of Global Bilateral Migration 1960-2000. The World
Bank Economic Review, 25(1), 12-56.
Patrick Rhamey, P. Cline, K. Bodung, S., & Henshaw A. (2010). The Diplomatic Contacts
Data Base. Tucson: School of Government and Public Policy, University of
Arizona (Version 1.1).
Santos Silva, J.M.C., & Teneyro, S. (2006). The log of gravity. The Review of Economics
and Statistics, 88(4), 641-658.
Songa H., Gartnerb W.C., & Tascic A. (2012). Visa restrictions and their adverse
economic and marketing implications – Evidence from China. Tourism
Management, 33(2), 397-412.
Thomas, N. (2012). UK visa system attacked as tourists stay away during Olympics. The
Telegraph, 11 October 2012, downloaded 26th December 2012.
US Office of Immigration Statistics (2010). The 9/11 Terrorist Attack and Overseas
Travel to the United States: Initial Impacts and Longer-Run Recovery. US
Department of Homeland Security WP, March.
12
World Bank (2012). World development indicators on-line. Washington, DC: World
Bank.
Wooldridge, J.M. (2002). Econometric analysis of cross section and panel data.
Cambridge: MIT Press.
UK Visa Bureau website: http://www.visabureau.com/uk/news/12-10-2012/uk-visa-
rate-drop-during-olympics-turns-up-pressure-on-government.aspx
UNWTO (2012a). Tourism Highlights 2012. Madrid: United Nations World Tourism
Organization.
UNWTO (2012b). Statistical information on CD-ROM. Madrid: United Nations World
Tourism Organization (UNWTO).
Zhang, J. , & Jensen, C. (2007). Comparative advantage explaining tourism flows.
Annals of Tourism Research, 34(1), 223-243.
13
Graphic 1. Visa restrictions in the world
Panel A
Source: Own calculations. Note on data interpretation: each value means that, on average, a particular
region imposes visa restrictions on citizens coming for that number of countries (e.g.; for the world as a
whole, the average diminishes by 8, i.e., from 133 in year 2000 to 125 on year 2010).
Panel B
Source: Own calculations. Note on data interpretation: each value means that, on average, a citizen of a
particular region suffers visa restrictions when traveling to that number of countries (e.g.; for the world
as a whole, the average diminishes by 12, i.e., from 124 in year 2000 to 112 on year 2010).
-8 -4 -7 -7 -3-13 -13 -11 -11
-16 -13 -14
-50
0
50
100
150
200
WO
RLD
HIG
H IN
COM
E
EAs &
Pac
.
N A
m
W E
ur
NO
HIG
H IN
COM
E
EE &
C A
s
EAs &
Pac
.
LA &
CA
R
ME
& N
Af
S A
s
S-SA
f
Num
ber o
f cou
ntri
es
Countries that require visa to travel to (max: 188 countries)
CHANGE
Year 2000
Year 2010
-12 -16 -18-12 -17 -12
-25
-9 -13 -11 -10 -12
-50
0
50
100
150
200
WO
RLD
HIG
H IN
COM
E
EAs &
Pac
.
N A
m
W E
ur
NO
HIG
H IN
COM
E
EE &
C A
s
EAs &
Pac
.
LA &
CA
R
ME
& N
Af
S A
s
S-SA
f
Nu
me
r o
f co
un
trie
s
Countries whose citizens do not require visa to travel from (max: 179 countries)
CHANGE
Year 2000
Year 2010

14
Table 1. World tourist arrivals and departures
Source: Own elaboration using World Bank, World Development Indicators (WDI).
Note: "na" means not available. Data on departures are not yet available for year 2010
in WDI.
Arrivals Annual avg Departures Annual avg
in 2010 Share growth rate in 2009 Share growth rate
(millions) (%) 2000-2010 (%) (millions) (%) 2000-2009 (%)
WORLD 941,6 100 3,24 922,1 100 2,32
HIGH-INCOME COUNTRIES 558,6 59,3 1,72 532,2 57,7 1,00
East Asia and Pacific (EAs&Pac) 75,6 8,0 5,83 62,8 6,8 3,74
North America (N Am) 76,1 8,1 0,67 87,8 9,5 1,36
Western Europe (W Eur) 406,9 43,2 1,32 381,6 41,4 1,01
NO-HIGH INCOME COUNTRIES 383,0 40,7 6,15 409,0 44,4 7,33
Eastern Europe and Central Asia (EE&C As) 106,1 11,3 6,98 104,7 11,4 5,70
East Asia and Pacific (EAs&Pac) 117,8 12,5 6,31 na na na
Latin America and Caribbean (LA&CAR) 64,2 6,8 3,10 41,2 4,5 3,34
Middle East and Northern Africa (ME&N Af) 53,1 5,6 8,83 25,3 2,7 3,13
South Asia (S As) 9,4 1,0 6,68 20,1 2,2 10,41
Sub-Saharan Africa (S-SAf) 31,7 3,4 5,82 na na na
15
Table 2. Estimation results
Note: Robust standard errors in parenthesis. *, ** and *** indicate significance at 10%,
5% and 1%. All regressions include country-and-year effects and a constant.
(1) (2) (3) (4) (5)
Dependent variable ln arrivals ln arrivals ln arrivals arrivals arrivals
Method estimation OLS OLS OLS POISSON POISSON
Visa restriction odt -0.789*** -0.612*** -0.232*** -0.635*** -0.365**
[0.0377] [0.0328] [0.0563] [0.0627] [0.163]
ln distance od -1.441*** -0.787*** -0.703***
[0.0270] [0.0289] [0.0702]
Contiguity od 1.075*** 0.775*** 0.490***
[0.0970] [0.0784] [0.0987]
Colonial link od 0.900*** 0.381*** 0.0944
[0.111] [0.0871] [0.0884]
Common language od 1.093*** 0.696*** 0.290***
[0.0431] [0.0388] [0.0634]
Same region od 0.208*** 0.243*** 0.321***
[0.0417] [0.0369] [0.0754]
Economic integration agreement odt 0.122*** -0.041 0.100* 0.138
[0.0370] [0.0373] [0.0563] [0.123]
Diplomatic relations odt 0.452*** 0.0867** 0.0916 0.153
[0.0304] [0.0414] [0.0625] [0.100]
ln bilateral trade odt 0.134*** 0.0179* 0.203*** 0.252***
[0.00698] [0.00915] [0.0514] [0.0689]
ln bilateral migration odt 0.193*** 0.399*** 0.196*** 0.128***
[0.00650] [0.0137] [0.0136] [0.0380]
country pair fixed effects yes yes
Observations 17259 16268 16268 16268 16268
R-squared 0.862 0.887 0.981 0.912 0.933

16
Table 3. Impact of visa restrictions on international tourist flows by groups of countries
Note: Robust standard errors in parenthesis. *, ** and *** indicate significance at 10%,
5% and 1%. All regressions include country-and-year effects and a constant.
(1) (2) (3) (4)
Tourists to Tourists to Tourists from Tourists from
(income group) (region group) (income group) (region group)
VISA * Dummy (origin or destination country group)
High income countries -0.0885 -0.238***
[0.0912] [0.0777]
East Asia and Pacific -0.0829 -0.171
[0.169] [0.133]
North America 0.187 -0.239**
[0.142] [0.121]
Western Europe -0.371 -0.304***
[0.279] [0.0624]
Non-high income countries -0.227*** -0.206***
[0.0728] [0.0689]
Eastern Europe and Central Asia -0.347** -0.245**
[0.140] [0.114]
East Asia and Pacific -0.111 -.0401
[0.168] [0.178]
Latin America and Caribbean -0.242** -0.228
[0.0972] [0.152]
Middle East and Northern Africa -0.262** -0.108
[0.126] [0.149]
South Asia -0.0693 0.104
[0.161] [0.232]
Sub-Saharan Africa -0.226** -0.420*
[0.116] [0.221]
Economic integration agreement odt -0.0403 -0.0386 -0.0409 -0.0372
[0.0499] [0.0499] [0.0499] [0.0500]
Diplomatic relations odt 0.0862** 0.0871** 0.0866** 0.0873**
[0.0414] [0.0415] [0.0414] [0.0414]
ln bilateral trade odt 0.0176* 0.0174* 0.0178* 0.0179**
[0.00913] [0.00917] [0.00915] [0.00913]
ln bilateral migration odt 0.0394*** 0.0391*** 0.0396*** 0.0389***
[0.0137] [0.0138] [0.0137] [0.0138]
country pair fixed effects yes yes yes yes
Number of observations 16292 16292 16292 16292
R squared 0.981 0.981 0.981 0.981

17
Appendix
Table A.1. Data descriptives
Data for year 2000 Number Mean s.d. min max
ln arrivals 9010 6,86 3,44 0 17,89
visa restriction dummy 8643 0,55 0,50 0 1
lndistance od 8984 8,48 0,94 4,29 9,89
contiguity od 9010 0,04 0,20 0 1
colonial link od 9010 0,02 0,15 0 1
common language od 9010 0,20 0,40 0 1
same region od 9010 0,36 0,48 0 1
regional economic agreement od 1995 9010 0,14 0,34 0 1
diplomatic relations od 1995 8461 0,44 0,50 0 1
ln bilateral trade od 1995 8726 9,31 4,22 0 19,74
ln bilateral migration od 1990 8881 5,21 3,48 0 16,10
Data for year 2010 Number Mean s.d. min max
ln arrivals 9010 7,53 3,09 0,69 18,19
visa restriction dummy 8648 0,48 0,50 0 1
lndistance od 8984 8,79 0,94 4,29 9,89
contiguity od 9010 0,04 0,20 0 1
colonial link od 9010 0,20 0,40 0 1
common language od 9010 0,02 0,15 0 1
same region od 9010 0,36 0,48 0 1
regional economic agreement od 2005 9010 0,14 0,35 0 1
diplomatic relations od 2005 8461 0,50 0,50 0 1
ln bilateral trade od 2005 8726 10,24 4,51 0 19,97
ln bilateral migration od 2000 8881 5,69 3,47 0 16,09
18
Table A.2. List of countries of destination
Note: "Underlined" ISO3 countries mean countries with lack of information either in
2000 and 2010; therefore they are excluded from the panel regression analysis.
Included
Geographic regions in panel Countries of destination (code ISO3)
East Asia and Pacific (high income) 8 AUS FJI HKG JPN KOR NZL SGP TWN
North America 3 CAN MEX USA
Western Europe 20 AUT BEL CHE CYP DEU DNK ESP FIN FRA GBR
GRC IRL ISL ITA MLT NLD NOR PRT SVN SWE
Eastern Europe and Central Asia 20 ALB ARM AZE BGR BIH BLR CZE EST GEO HRV
HUN KAZ KGZ LTU LVA MDA POL ROM RUS SRB
SVK TJK TKM UKR UZB
East Asia and Pacific (low income) 9 CHN IDN KHM LAO MMR MNG MYS PHL PNG THA VNM
Latin America and Caribbean 31 AIA ARG ATG BHS BLZ BMU BOL BRA BRB CHL COL
CRI CUB CYM DMA DOM ECU GRD GTM HND HTI JAM
NIC PAN PER PRI PRY SLV TTO URY VEN
Middle East and Northern Africa 13 ARE BHR DZA EGY IRN IRQ ISR JOR KWT LBN LBY
MAR OMN QAT SAU SYR TUN TUR YEM AFG BGD BTN
South Asia IND LKA NPL PAK
Sub-Saharan Africa 28 AGO BDI BEN BFA BWA CAF CIV CMR COG COM CPV
DJI ERI ETH GAB GHA GIN GMB GNB GNQ KEN KIR
LBR LCA LSO MDG MLI MOZ MRT MSR MTQ MUS MWI
NAM NGA REU RWA SDN SEN SLE SOM STP SWZ TCD
TGO TZA UGA ZAF ZMB ZWE