examining stock market dynamic linkage of bric countries · apart from bombay stock exchange,...
TRANSCRIPT
www.indiastat.com February - March, 2016 1 socio - economic voices
Examining Stock Market Dynamic Linkage of BRIC Countries (Dr. Anubha Srivastava, Assistant Professor (Finance), Amity Business School, AUUP, Noida)
Introduction Presently, the fluctuations in the Indian market are attributed heavily to cross border capital flows in the form of FDI,
FII and to reaction of Indian market to global market cues. Thus, it is becoming increasingly important to
understand the relationship and influence of various exchanges on each other. This study compares global
exchanges which are from different geopolitical-socio-economic areas. With the cross border movements of capital
like never before in the form of FDI and FII, coupled with the easing of restrictions bringing various stock exchanges
at par in terms of systems and regulations, it can be assumed reasonably that a particular stock exchange will have
some impact on other exchanges. Companies raise funds to finance their projects through various methods. The
promoters can bring their own money or borrow from the financial institutions or mobilize capital by issuing
securities. The funds may be raised through issue of fresh shares at par or premium, preference shares,
debentures or global depository receipts. The main objectives of a capital issue include promoting a new company,
expanding an existing company, diversifying the production, meeting the regular working capital requirements &
capitalizing the reserves. The capital market is a market where buyers and sellers engage in trade of financial
securities like bonds, stocks, etc. The buying and selling is undertaken by participants such as individuals and
institutions. Capital markets help channelize surplus funds from savers which may be households to institutions
which then invest them into productive use. Generally, this market trades mostly in long-term securities.
Capital market consists of primary markets and secondary markets. Primary markets deal with trade of new issues
of stocks and other securities, whereas secondary market deals with the exchange of existing or previously-issued
securities. Thus, the secondary market is a market for second-hand securities i.e. a market for securities that have
already been issued in the primary market whereas primary market also known as New Issue Market is a market
for stocks available for the first time. The issuer may be a new company or an existing company. These issues may
be of a new type or the security used in the past. In the new issue market, the issuer can be considered as a
manufacturer. The issuing houses, investment bankers and brokers act as the channel of distribution for the new
issues. They take the responsibility of selling the stocks to the public. Another important division in the capital
market is made on the basis of the nature of security traded, i.e. stock market and bond market.
Capital markets serve two purposes. Firstly, they bring together investors holding capital and companies seeking
capital on a common platform through equity and debt instruments. Secondly, and almost more importantly, they
provide a secondary market where holders of these securities can exchange them with one another at market
prices. Without the liquidity created by a secondary market, investors would be less inclined to purchase equity and
debt instruments for fear of being unable to unload them in the future. In many countries, Capital market is an
engine of economic growth and development. A capital market is a market for long-term debt and equity securities,
where business enterprises (companies) and governments can raise funds for long-term investment. It is normally
divided into two broad categories - the stock market and the bond market. The stock market is the market where
the equity securities such as stocks representing ownership shares in particular corporations issuing the securities
www.indiastat.com February - March, 2016 2 socio - economic voices
are traded. Equity shares are also commonly known as common stock or ordinary shares. These instruments are
usually issued by big corporations and promise a return (in the form of dividends) based solely on the performance
of the issuing corporation. In addition, investors can gain from appreciation of stock prices. Thus, gains from equity
stocks may take two forms - Capital Appreciation & Dividends. In a limited company, the equity shareholders are
liable to pay the company’s debt only to the extent of their share in the paid up capital. The main advantages of
equity shares include capital appreciation, limited liability, free tradeability, tax advantages (in certain cases) and as
a hedge against inflation. The origin of the stock exchanges in India can be traced back to the later half of 19th
century. After the American Civil War (1860-61) due to the share mania of the public, the number of brokers dealing
in shares increased. The brokers organized an informal association in Mumbai named “The Native Stock and Share
Brokers Association” in 1875. Increased activity in trade and commerce during the First World War and Second
World War resulted in an increase in the stock trading. Stock exchanges were established in different centres like
Chennai, Delhi, Nagpur, Kanpur, Hyderabad and Bangalore. The growth of stock exchanges suffered a setback
after the end of World War. Worldwide depression affected them. Most of the stock exchanges in the early stages
had a speculative nature of working without technical strength. Securities and Contract Regulation Act, 1956 gave
powers to the central government to regulate the stock exchanges. The stock exchanges in Mumbai, Calcutta,
Chennai, Ahmedabad, Delhi, Hyderabad and Indore were recognized by the SCR Act. The Bangalore stock
exchange was recognized only in 1963. At present, India has 23 stock exchanges and 21 of them had the hardware
and software compliant to solve Y2K problem. Earlier, floor trading used to take place in all the stock exchanges. In
the floor trading system, the trade takes place through open outcry system during the official trading hours. Trading
posts are assigned to different securities where buy and sell activities of securities took place. This system needed
a face to face contact among the traders and restricted the trading volume. The speed of the new information
reflected on the prices was rather slow. The deals were also not transparent and the system favored the brokers
rather than the investors. The setting up of NSE and OTCEI with the screen based trading facility resulted in more
and more stock exchanges turning towards the computer based trading. Bombay stock exchange introduced the
screen based trading system in 1995, which is known as BOLT (Bombay On-line Trading System). Madras stock
exchange introduced Automated Network Trading System (MANTRA) on Oct 7th 1996. Apart from Bombay stock
exchange, Vadodara, Delhi, Pune, Bangalore, Calcutta and Ahmedabad stock exchanges have introduced screen
based trading. Other exchanges are also planning to shift to the screen based trading. There is a close relationship
between the primary and secondary market. The new issue market cannot function without the secondary market.
The secondary market or the stock market provides liquidity for the issued securities. The issued securities are
traded in the secondary market offering liquidity to the stocks at a fair price. Moreover, the stock exchanges through
their listing requirements, exercise control over the primary market. The company seeking for listing on the
respective stock exchange has to comply with all the rules and regulations given by the stock exchange. Also, the
primary market provides a direct link between the prospective investors and the company. By providing liquidity and
safety, the stock markets encourage the public to subscribe to the new issues. The marketability and the capital
appreciation provided in the stock market are the major factors that attract the investing public towards the stock
market. Thus, it provides an indirect link between the savers and the company. Even though these two markets are
www.indiastat.com February - March, 2016 3 socio - economic voices
complementary to each other, their functions and the organizational set up are different from each other. It may be
concluded that the health of the primary market depends on the secondary market and vice-versa. The main
service functions of the primary market include origination, underwriting and distribution. Origination deals with the
origin of the new issue. The proposal is analyzed in terms of the nature of the security, the size of the issue, the
timing of the issue and the floatation method of the issue. Underwriting contract makes the share predictable and
removes the element of uncertainty in the subscription. Distribution refers to the sale of securities to the investors.
This is carried out with the help of the lead managers and brokers to the issue. The stock market securities are
usually listed and traded on stock exchanges which may be corporations or mutual organizations which provide
trading facilities for stock brokers and traders. Stock exchanges provide facilities for the issue and redemption of
securities as well as other financial instruments and capital events including the payment of income and dividends.
They are also sometimes referred to as securities exchange to reflect these broad functions. Securities that are
traded on a stock exchange include: shares issued by companies, unit trusts, derivatives, pooled investment
products and bonds. To be able to trade a security on a certain stock exchange, it has to be listed there. Well
regulated and active stock market promotes capital formation. Growth of the primary market depends on the
secondary market. The health of the economy is reflected by the growth of the stock market. The stock market
helps in maintaining active trading, fixing of prices, ensuring safe and fair dealing, financing the industry,
dissemination of industry, reflecting the performance of the traded companies, monitoring the integrity of members
and settling the disputes between member brokers, investors & brokers. Also, an Index of a particular country may
also be considered as one of the indicators for the proof of economic growth and their financial structure. An index
is a benchmark which is used to compare performance from a base value in the base year. Stock market indices
are the barometers of the stock market. They mirror the stock market behavior. The indices give a broad outline of
the market movement and represent the market. The indices help to recognize the broad trends in the market. The
index can be used as a benchmark for evaluating the investor's portfolio. Indices function as a status report on the
general economy. Impacts of the various economic policies are reflected on the stock market. The investor can use
the indices to allocate funds rationally among stocks. To earn returns on par with the market returns, he can choose
the stocks that reflect the market movement. Index funds and futures are formulated with the help of the indices.
Usually, fund managers construct portfolios to emulate any one of the major stock market indices. For example, in
India, ICICI has floated ICICI index bonds. The return of the bond is linked with the index movement. Technical
analysis studying the historical performance of the indices helps in predicting the future movement of the stock
market. The relationship between the individual stock and index predicts the individual share price movement.
Bric Countries Stock Market a) Brazilian Stock Exchange-BM&FBOVESPA is a company that manages the organized securities and
derivatives markets, providing registration, clearing and settlement services. It acts as central counterparty,
guaranteeing financial liquidity for the trades executed in its environments. Founded on August 23, 1890, the
Exchange offers a wide range of products and services such as spot FX, equities and fixed-income securities
trading, as well as trading in derivatives contracts based among other things on equities, financial securities,
indices, rates, commodities and currencies. It lists companies and other issuers, is a securities depository, has
www.indiastat.com February - March, 2016 4 socio - economic voices
a securities lending service and licenses software. BM&FBOVESPA is the largest exchange in Latin America
& has a diversified and integrated trading model offering a complete custody system. Trading takes place in an
exclusively electronic environment. The Exchange enables customers to trade equities, to hedge and to
execute arbitrage, investment diversification, allocation and the leveraging of positions.
b) Russian Stock Exchange-The MICEX is a major stock market index which tracks the performance of 30
largest and most liquid Russian companies from 10 main economy sectors, listed on The Moscow Stock
Exchange. It is a capitalization-weighted composite index. The MICEX has a base value of 100 as of
September 22, 1997. OJSC "Moscow Exchange MICEX-RTS" is the largest Russian exchange both in terms
of turnover and the extensive client base. The main goal of the exchange is to provide Russian and foreign
market participants and investors with a safe and effective access to the booming Russian market. MICEX-
RTS offers accessible technology, sound clearing and guarantee functions and flexible operational structures.
Moscow Exchange plays a key role in the development of the Russian financial sector. The Exchange
provides a transparent process for determining fair market values of Russian assets. It offers a full range of
competitive trading and post trading services. MICEX-RTS provides a wide range of opportunities to investors,
professional institutions and their Russian and foreign clients for equities, bonds, currencies as well as
derivatives trading. MICEX-RTS’s market data is accessible worldwide through a range of all major vendor
distribution channels.
c) National Stock Exchange (India) - The National Stock Exchange (NSE) is India's leading stock exchange
covering various cities and towns across the country. NSE was set up by leading institutions to provide a
modern, fully automated screen-based trading system with national reach. The Exchange has brought about
unparalleled transparency, speed & efficiency, safety and market integrity. It has set up facilities that serve as
a model for the securities industry in terms of systems, practices and procedures. NSE has played a catalytic
role in reforming the Indian securities market in terms of microstructure, market practices and trading volumes.
The market uses state-of-art information technology to provide an efficient and transparent trading, clearing
and settlement mechanism, and has witnessed several innovations in products & services viz. demutualisation
of stock exchange governance, screen based trading, compression of settlement cycles, dematerialisation and
electronic transfer of securities, securities lending and borrowing, professionalization of trading members, fine-
tuned risk management systems, emergence of clearing corporations to assume counterparty risks, market of
debt and derivative instruments and intensive use of information technology.
d) Shanghai Stock Exchange(China)- The Shanghai Stock Exchange (SSE) was founded on Nov. 26th, 1990
and came in operation on December 19th the same year. It is a membership institution directly governed by
the China Securities Regulatory Commission (CSRC). After several years' operation, the SSE has become the most preeminent stock market in Mainland China
in terms of number of listed companies, number of shares listed, total market value, tradable market value,
securities turnover in value, stock turnover in value and the T-bond turnover in value.
www.indiastat.com February - March, 2016 5 socio - economic voices
The stock market is witnessing heightened activities and is increasingly gaining importance which is reflected
through its increasing reach, daily turnover & market capitalization. In the current context of globalization and the
subsequent integration of the global markets this study will capture the trends, similarities and patterns in the
activities and movements of the Indian Stock Market in comparison to its international counterparts. This study
covers the Brazilian Stock Exchange (BM&FBOVESPA), Russian Stock exchange (RSE), Indian Stock exchange
(NSE & BSE ) & Chinese Stock exchange (SSE) from various socio- political-economic backgrounds. The time
period has been divided into various eras to test the correlation between the various exchanges to prove that the
Indian markets have become more integrated with its global counterparts and its reaction are in tandem with that
are seen globally.
Review of the Literature Mash, M.M. Abul and Masih, Rumi (1997), they examined the dynamic linkage patterns among national stock
exchange prices of four Asian newly industrializing countries - Taiwan, South Korea, Singapore and Hong Kong.
The sample used comprised end-of-the-month closing share price indices of the four NIC stock markets from
January 1982 to June 1994. They concluded that the study of these markets are not mutually exclusive of each
other and significant short-run linkages appear to run among them. Lau, S T and Diltz, J.D. (1994), they studied
the transfer of information among Tokyo and New York stock exchanges. Agarwal, R N (2000) examined the
financial integration of capital markets in developing nations gave insight with regards to the methodology and the
area of study followed. Bae, K, Cha, B, and Cheung, Y (1999), they tried to show the information transmission
mechanism that operates for stocks which are dually listed. This has helped in understanding the channel of
transmission of information that makes the exchanges dependent on each other. Masih and Masih (1999), they
found a high level of interdependence among markets in Thailand, Malaysia, the U.S., Japan, Hong Kong, and
Singapore from 1992 to 1997. Maghyereh (2006), he investigated the interdependence among the daily equity
market returns for four major Middle Eastern and North African (MENA) emerging markets, Jordanian, Egyptian,
Moroccan and Turkish markets. Evidence indicated that none of the MENA markets are completely isolated and
independent. Mukherjee and Mishra (2007), they analyzed markets of 23 different countries & identified increasing
tendency of integration among the markets and further, discovered that countries of the same region are found to
be more integrated than others. Poshakwale, Sunil (2002), they examined the random walk hypothesis in the
emerging Indian stock market by testing for the non-linear dependence using a large disaggregated daily data from
the Indian stock market. The sample used was 38 actively traded stocks in the BSE National Index. They found that
the daily returns from the Indian market do not conform to a random walk. Daily returns from most individual stocks
and the equally weighted portfolio exhibit significant non-linear dependence. This is largely consistent with previous
research that has shown evidence of non-linear dependence in returns from the stock market indexes and
individual stocks in the US and the UK. Noor, Azuddin Yakob, Diana Beal and Delpachitra, Sarath (2006), they
studied the stock market seasonality in terms of day-of-the-week, month-of-the year, monthly and holiday effects in
ten Asian stock markets, namely, Australia, China, Hong Kong, Japan, India, Indonesia, Malaysia, Singapore,
South Korea and Taiwan. They concluded that the existence of seasonality in stock markets and also suggested
that this is a global phenomenon.
www.indiastat.com February - March, 2016 6 socio - economic voices
Research Methods and Procedures
Statement of the Problem- The dynamics of Indian stock market is strongly influenced by domestic and
international event and happenings. Moreover the Volatility of international stock exchanges also motivates and
encourages the investors and speculators to withdraw or invest their investments in high return and more stable
market. Since the fluctuations in the Indian market are attributed heavily to cross border capital flows in the form of
FDI, FII and to reaction of Indian market to global market cues Therefore it becomes necessary to find out the
linkage among all these stock exchanges. Understanding the relationship and influence of various exchanges on
each other is very important. This study compares global exchanges which are from different geopolitical-socio-
economic areas. With the cross border movements of capital like never before in the form of FDI and FII, coupled
with the easing of restrictions bringing various stock exchanges at par in terms of systems and regulations, it can
be assumed reasonably that a particular stock exchange will have some impact on other exchanges.
Objective of the Study Primary Purpose:
1. To analyze the performance of Indian capital markets compared with other BRIC countries Secondary Purpose:
1. To know the risk and returns of BRIC capital markets 2. To correlate the performance and to know the degree of impact and interdependence among BRIC capital
markets
Research Design-The research design followed was “Exploratory” research design. Capital markets of BRIC
countries i.e. Brazil, Russia, India & China were included in this research. This report has been compiled by tapping
on secondary sources of information. The secondary information has been sourced from the websites, business
related magazines, newspapers, journals & research papers. For the comparative analysis of the different stock
exchanges, the period chosen is from 1st January 2009 to 31st July, 2013. The economic situation changes during
different times. Stock exchanges representing various regions used in this study include BM&FBOVESPA (Brazil),
Russian Stock Exchange (Russia), NSE & BSE (India) and SSE COMPOSITE (China). The number of sample units
included in this study is four.
Sampling Plan Universe: All The Capital Markets Of The World. Population: All The Emerging Capital Markets Of The World. Sampling Unit: Capital Markets Of BRIC Countries, I.E. Brazil, Russia, India & China.
Significane of the study
This study can help policy makers and practitioners.
This study will help the investors (current and potential) in understanding the impact of important
happenings on the Indian Stock exchange by capturing the trends, similarities and patterns in the activities
and movements of the Indian Stock Market in comparison to its BRIC counterparts.

www.indiastat.com February - March, 2016 7 socio - economic voices
This study is especially relevant in the current scenario when the financial markets across the globe are
getting integrated into one big market and the impact of one exchange on the other exchanges is even
more than before.
Results and Discussion The hypothesis that the exchanges impact each other has been tested through various statistical methods with data
on price, returns collected from the exchanges. Mainly the correlation analysis, exponential trend analysis and the
risk-return analysis has been used to validate the hypothesis.
a) Price Relationship-Correlation is a numerical summary measure that indicates the strength of relationships
between the pairs of variables. A correlation is very useful but it has its limitations. That is, it can only measure
the strength of a linear relationship. The numerator of the above formula is also a measure of association
between two variables X and Y which is called the covariance between X and Y. Similar to correlation, a
covariance is a single number that measures the strength of the linear relationship between the two variables. It
is by looking at the sign of the correlation or the covariance, i.e. positive or negative, that we can tell whether
the two variables are positively or negatively related. The formula is
Therefore the correlation is better because, unlike the covariance, the correlations are not affected by the units in
which the variables are measured. All the correlations are between +1 and -1, inclusive. The sign determines
whether the relationship is positive or negative. The strength of the relationship is measured by the absolute value
or the magnitude of the correlation. The closer it is to +1 the stronger the relationship is and the closer to zero
indicates that there is practically no linear relationship. At the extreme a correlation equal to -1 or +1 occurs only
when the linear relationship is perfect.
www.indiastat.com February - March, 2016 8 socio - economic voices
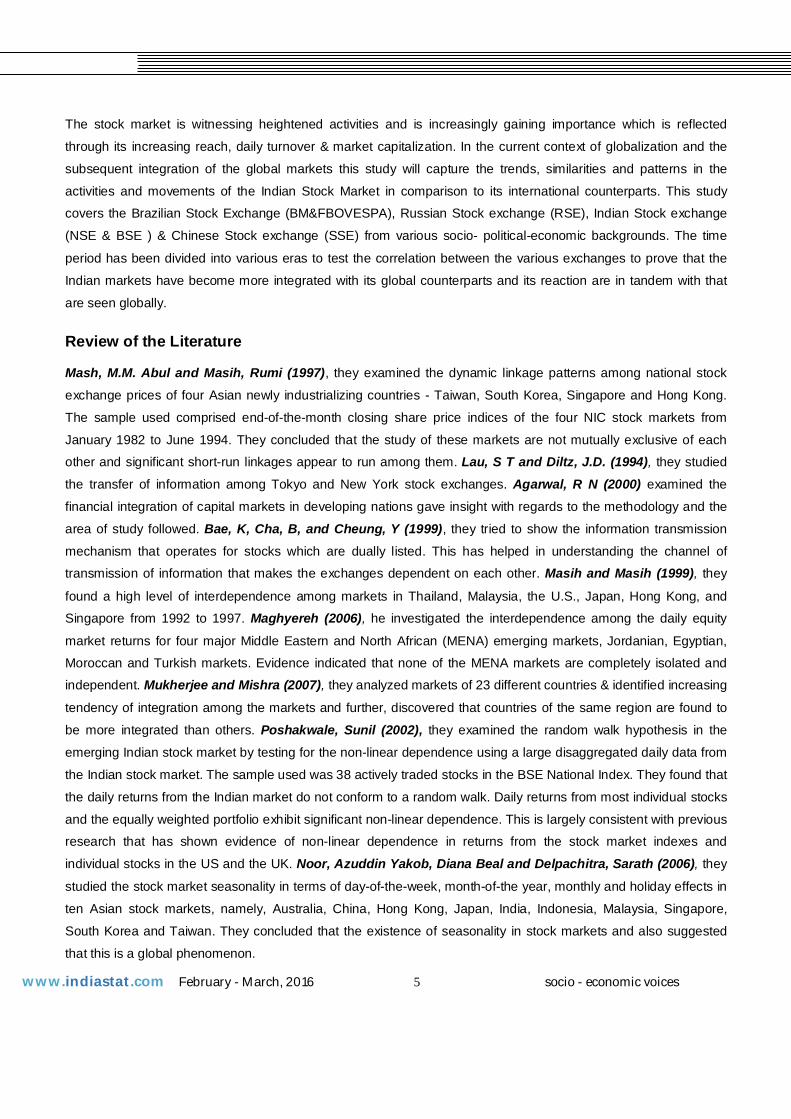
i) NSE vs. Brazilian Stock Exchange
Figure- 1 In the above figure, the volatility is much higher in Brazilian Stock Exchange than in Indian Stock Exchange.
BOVESPA showed a highly bullish pattern on the charts post the subprime crisis, giving higher returns than the
BSE SENSEX in 2009 but then has given negative returns to the investors post 2009 as against the Indian Stock
Exchange, which has given negative returns only in 2011 out of the period taken into consideration and has
exhibited a bullish pattern on the charts. BOVESPA has performed poorly among the emerging markets post 2009
by seeing its peak in 2010 & then also a very heavy drop post that period. The two markets have shown very strong
signs of de-coupling by exhibiting negative correlation since 2012 and thus, have become less integrated over the
past two years.
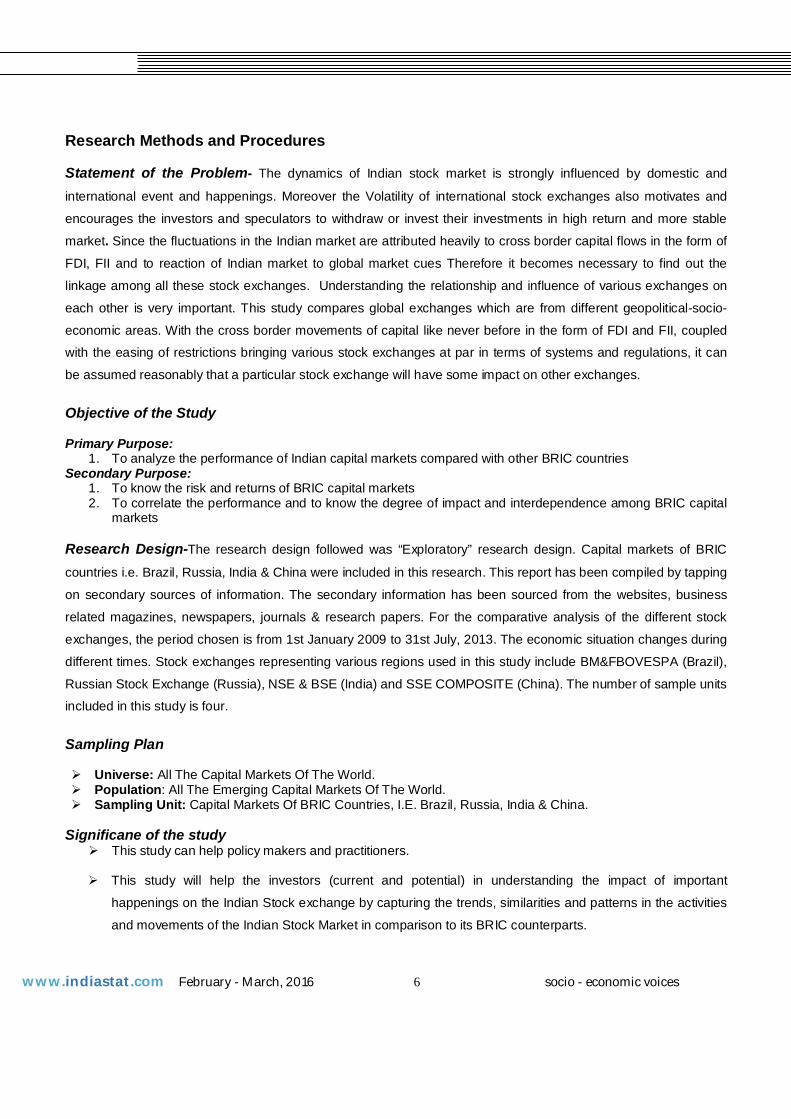
ii) NSE vs. Russia Stock Exchange
Figure 2 In the above figure, the volatility is much higher in BSE SENSEX than in the Russian Stock Exchange. The Russian
Stock Exchange tripled itself from 2009 to 2011 but then lost its momentum post 2011. Both the markets have
shown a high degree of correlation up to 2011 but after that period, the two economies have shown strong signs of
de-coupling. In the last 3 years, the Russian Stock Exchange has shown a declining trend & has exhibited bearish
formation on the charts giving negative returns for the last 3 consecutive years as against the BSE SENSEX, which
www.indiastat.com February - March, 2016 9 socio - economic voices
has given negative returns only in 2011 out of the period which was taken into consideration and has resumed its
upward trend by exhibiting bullish formation on the charts post 2011
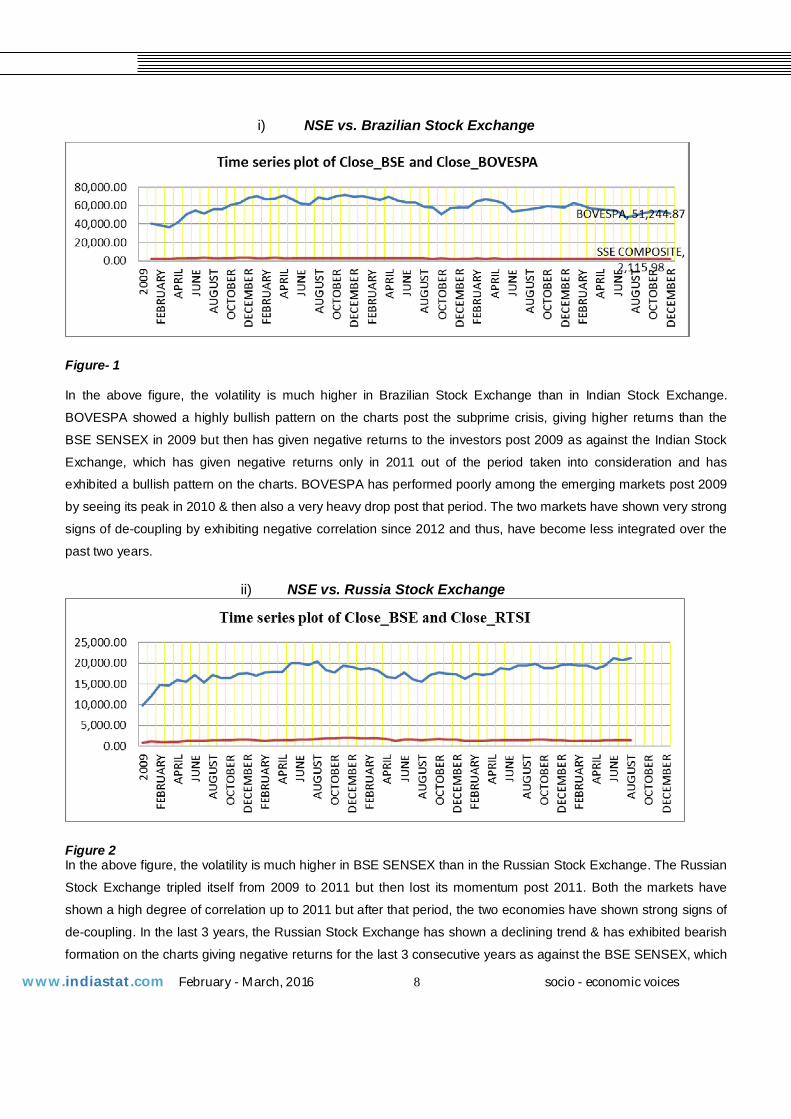
iii) NSE vs. China’s Stock Exchange
Figure- 3 In the above figure, the volatility is much higher in BSE SENSEX than in China’s Stock Exchange. SSE
COMPOSITE has moved in a very narrow range and the market has suffered from the period of stagnation post
2010. BSE SENSEX has more than doubled itself in the period of study by exhibiting a bullish pattern on the charts
and by giving positive returns to the investors in all the years except in 2011 as against SSE COMPOSITE which
has given negative returns in the last consecutive four years by exhibiting a bearish pattern on the charts and by
severely under-performing the emerging markets. The two markets have shown very strong signs of de-coupling by
exhibiting negative correlation since 2012 and thus, have become less integrated over the past two years.
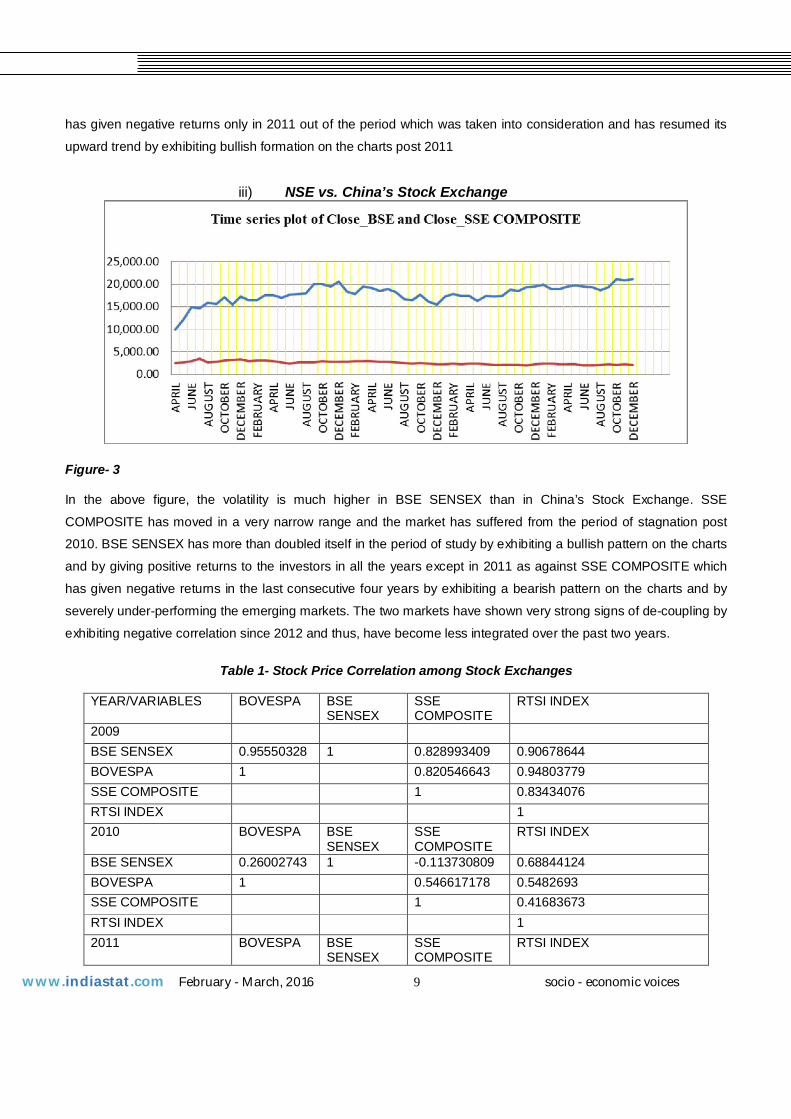
Table 1- Stock Price Correlation among Stock Exchanges
YEAR/VARIABLES BOVESPA BSE
SENSEX SSE COMPOSITE
RTSI INDEX
2009 BSE SENSEX 0.95550328 1 0.828993409 0.90678644 BOVESPA 1 0.820546643 0.94803779 SSE COMPOSITE 1 0.83434076 RTSI INDEX 1 2010 BOVESPA BSE
SENSEX SSE COMPOSITE
RTSI INDEX
BSE SENSEX 0.26002743 1 -0.113730809 0.68844124 BOVESPA 1 0.546617178 0.5482693 SSE COMPOSITE 1 0.41683673 RTSI INDEX 1 2011 BOVESPA BSE
SENSEX SSE COMPOSITE
RTSI INDEX
www.indiastat.com February - March, 2016 10 socio - economic voices
BSE SENSEX 0.64927003 1 0.909502932 0.88530039 BOVESPA 1 0.814597247 0.78735319 SSE COMPOSITE 1 0.95848534 RTSI INDEX 1 2012 BOVESPA BSE
SENSEX SSE COMPOSITE
RTSI INDEX
BSE SENSEX -0.2038982 1 -0.494971841 0.20312249 BOVESPA 1 0.605099906 0.58438898 SSE COMPOSITE 1 0.42977192 RTSI INDEX 1 2013 BOVESPA BSE
SENSEX SSE COMPOSITE
RTSI INDEX
BSE SENSEX -0.0812443 1 -0.037526242 0.22198746 BOVESPA 1 0.830631771 0.75235216 SSE COMPOSITE 1 0.74994296 RTSI INDEX 1
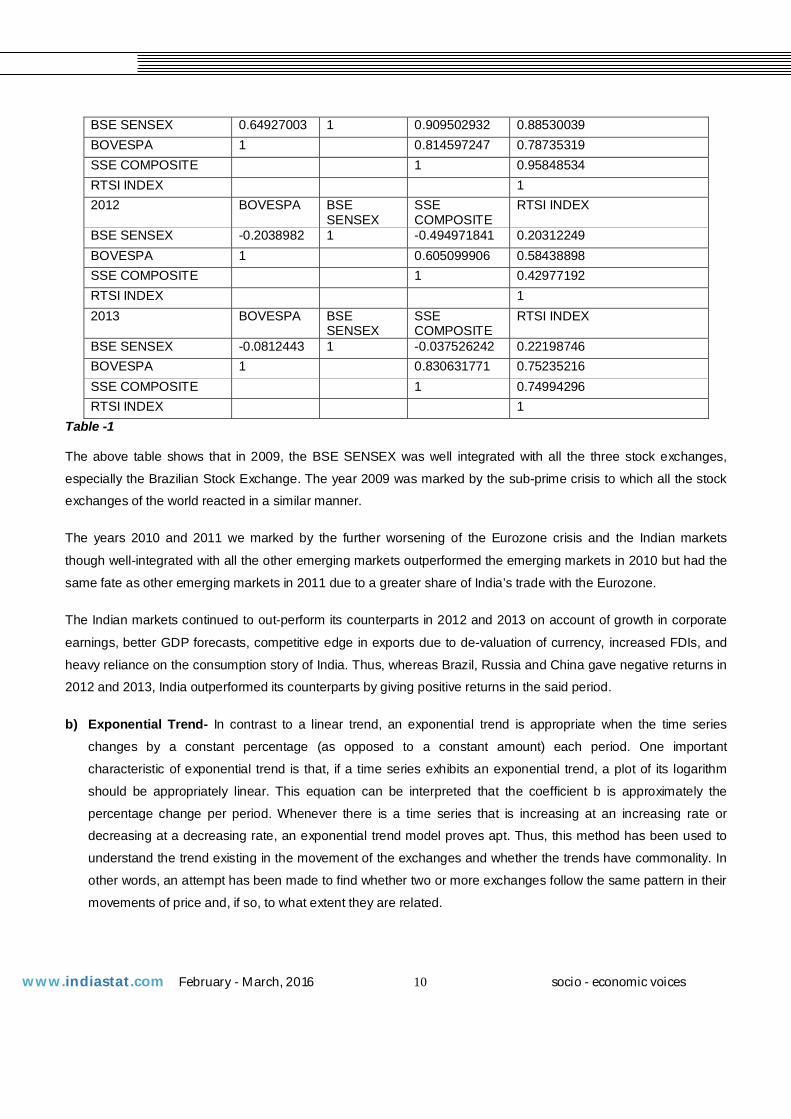
Table -1 The above table shows that in 2009, the BSE SENSEX was well integrated with all the three stock exchanges,
especially the Brazilian Stock Exchange. The year 2009 was marked by the sub-prime crisis to which all the stock
exchanges of the world reacted in a similar manner.
The years 2010 and 2011 we marked by the further worsening of the Eurozone crisis and the Indian markets
though well-integrated with all the other emerging markets outperformed the emerging markets in 2010 but had the
same fate as other emerging markets in 2011 due to a greater share of India’s trade with the Eurozone.
The Indian markets continued to out-perform its counterparts in 2012 and 2013 on account of growth in corporate
earnings, better GDP forecasts, competitive edge in exports due to de-valuation of currency, increased FDIs, and
heavy reliance on the consumption story of India. Thus, whereas Brazil, Russia and China gave negative returns in
2012 and 2013, India outperformed its counterparts by giving positive returns in the said period.
b) Exponential Trend- In contrast to a linear trend, an exponential trend is appropriate when the time series
changes by a constant percentage (as opposed to a constant amount) each period. One important
characteristic of exponential trend is that, if a time series exhibits an exponential trend, a plot of its logarithm
should be appropriately linear. This equation can be interpreted that the coefficient b is approximately the
percentage change per period. Whenever there is a time series that is increasing at an increasing rate or
decreasing at a decreasing rate, an exponential trend model proves apt. Thus, this method has been used to
understand the trend existing in the movement of the exchanges and whether the trends have commonality. In
other words, an attempt has been made to find whether two or more exchanges follow the same pattern in their
movements of price and, if so, to what extent they are related.
www.indiastat.com February - March, 2016 11 socio - economic voices
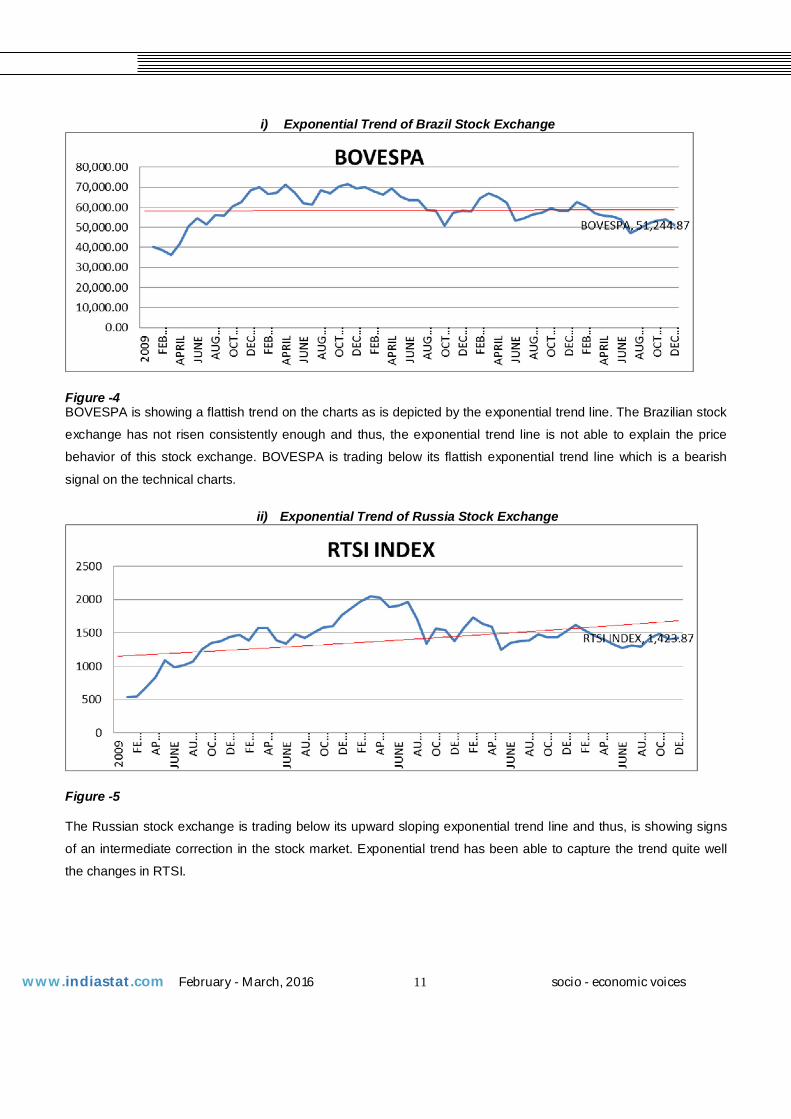
i) Exponential Trend of Brazil Stock Exchange
Figure -4 BOVESPA is showing a flattish trend on the charts as is depicted by the exponential trend line. The Brazilian stock
exchange has not risen consistently enough and thus, the exponential trend line is not able to explain the price
behavior of this stock exchange. BOVESPA is trading below its flattish exponential trend line which is a bearish
signal on the technical charts.
ii) Exponential Trend of Russia Stock Exchange
Figure -5 The Russian stock exchange is trading below its upward sloping exponential trend line and thus, is showing signs
of an intermediate correction in the stock market. Exponential trend has been able to capture the trend quite well
the changes in RTSI.
www.indiastat.com February - March, 2016 12 socio - economic voices
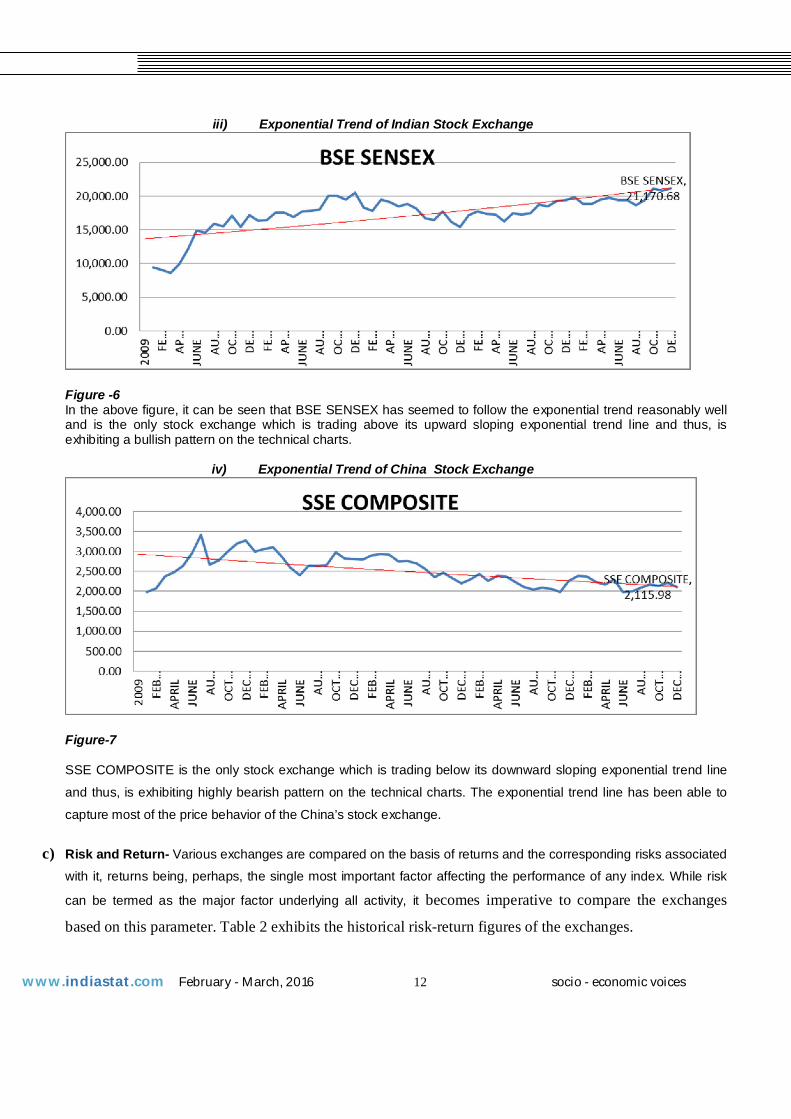
iii) Exponential Trend of Indian Stock Exchange
Figure -6 In the above figure, it can be seen that BSE SENSEX has seemed to follow the exponential trend reasonably well and is the only stock exchange which is trading above its upward sloping exponential trend line and thus, is exhibiting a bullish pattern on the technical charts.
iv) Exponential Trend of China Stock Exchange
Figure-7 SSE COMPOSITE is the only stock exchange which is trading below its downward sloping exponential trend line
and thus, is exhibiting highly bearish pattern on the technical charts. The exponential trend line has been able to
capture most of the price behavior of the China’s stock exchange.
c) Risk and Return- Various exchanges are compared on the basis of returns and the corresponding risks associated
with it, returns being, perhaps, the single most important factor affecting the performance of any index. While risk
can be termed as the major factor underlying all activity, it becomes imperative to compare the exchanges
based on this parameter. Table 2 exhibits the historical risk-return figures of the exchanges.
www.indiastat.com February - March, 2016 13 socio - economic voices
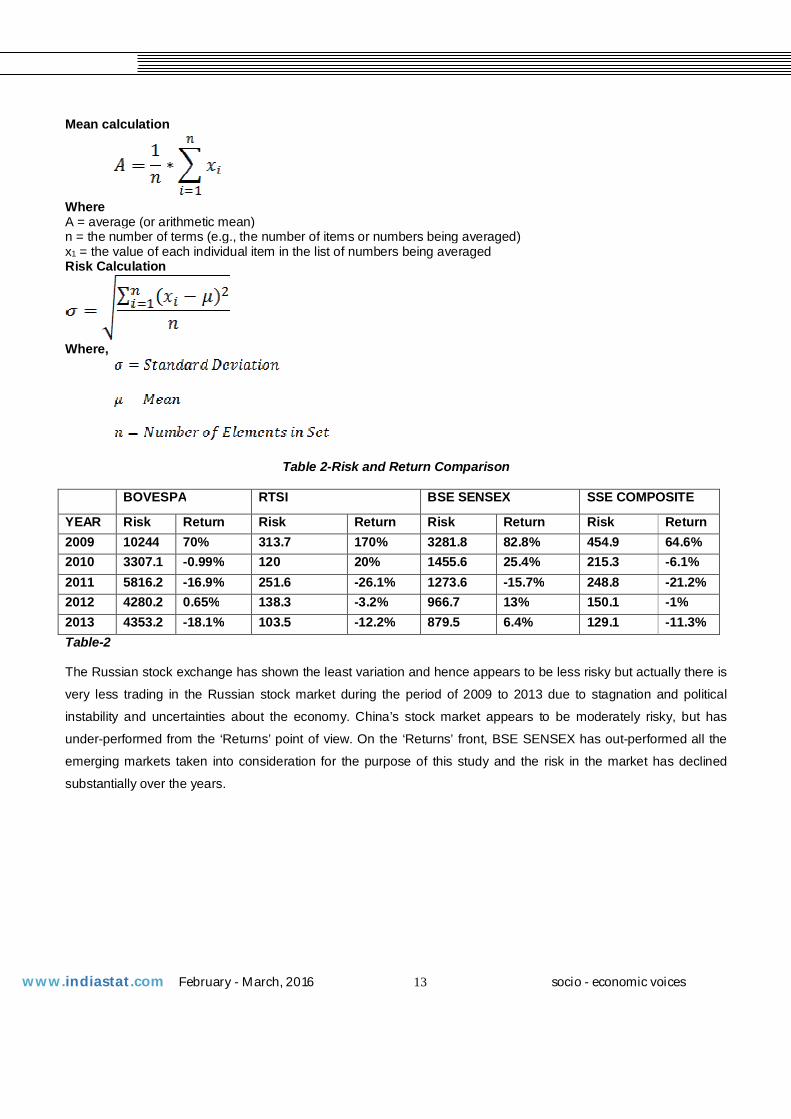
Mean calculation
Where A = average (or arithmetic mean) n = the number of terms (e.g., the number of items or numbers being averaged) x1 = the value of each individual item in the list of numbers being averaged Risk Calculation
Where,
Table 2-Risk and Return Comparison
BOVESPA RTSI BSE SENSEX SSE COMPOSITE
YEAR Risk Return Risk Return Risk Return Risk Return 2009 10244 70% 313.7 170% 3281.8 82.8% 454.9 64.6% 2010 3307.1 -0.99% 120 20% 1455.6 25.4% 215.3 -6.1% 2011 5816.2 -16.9% 251.6 -26.1% 1273.6 -15.7% 248.8 -21.2% 2012 4280.2 0.65% 138.3 -3.2% 966.7 13% 150.1 -1% 2013 4353.2 -18.1% 103.5 -12.2% 879.5 6.4% 129.1 -11.3% Table-2 The Russian stock exchange has shown the least variation and hence appears to be less risky but actually there is
very less trading in the Russian stock market during the period of 2009 to 2013 due to stagnation and political
instability and uncertainties about the economy. China’s stock market appears to be moderately risky, but has
under-performed from the ‘Returns’ point of view. On the ‘Returns’ front, BSE SENSEX has out-performed all the
emerging markets taken into consideration for the purpose of this study and the risk in the market has declined
substantially over the years.
www.indiastat.com February - March, 2016 14 socio - economic voices
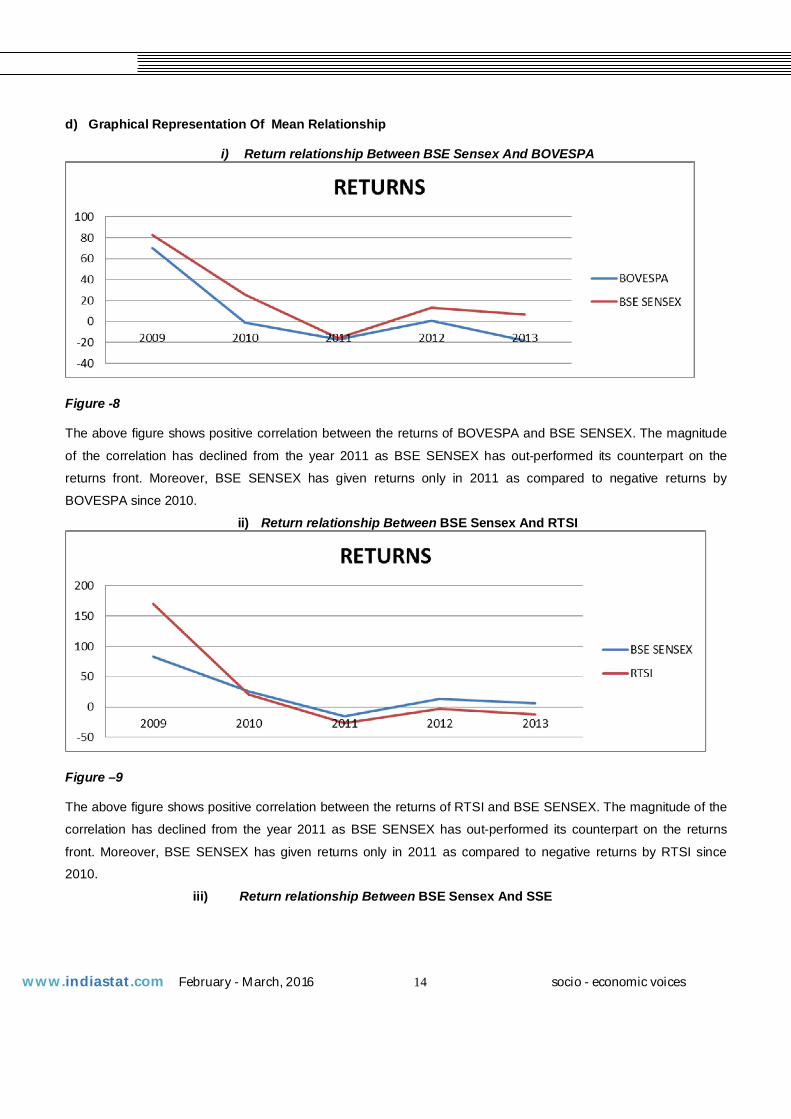
d) Graphical Representation Of Mean Relationship
i) Return relationship Between BSE Sensex And BOVESPA
Figure -8 The above figure shows positive correlation between the returns of BOVESPA and BSE SENSEX. The magnitude
of the correlation has declined from the year 2011 as BSE SENSEX has out-performed its counterpart on the
returns front. Moreover, BSE SENSEX has given returns only in 2011 as compared to negative returns by
BOVESPA since 2010.
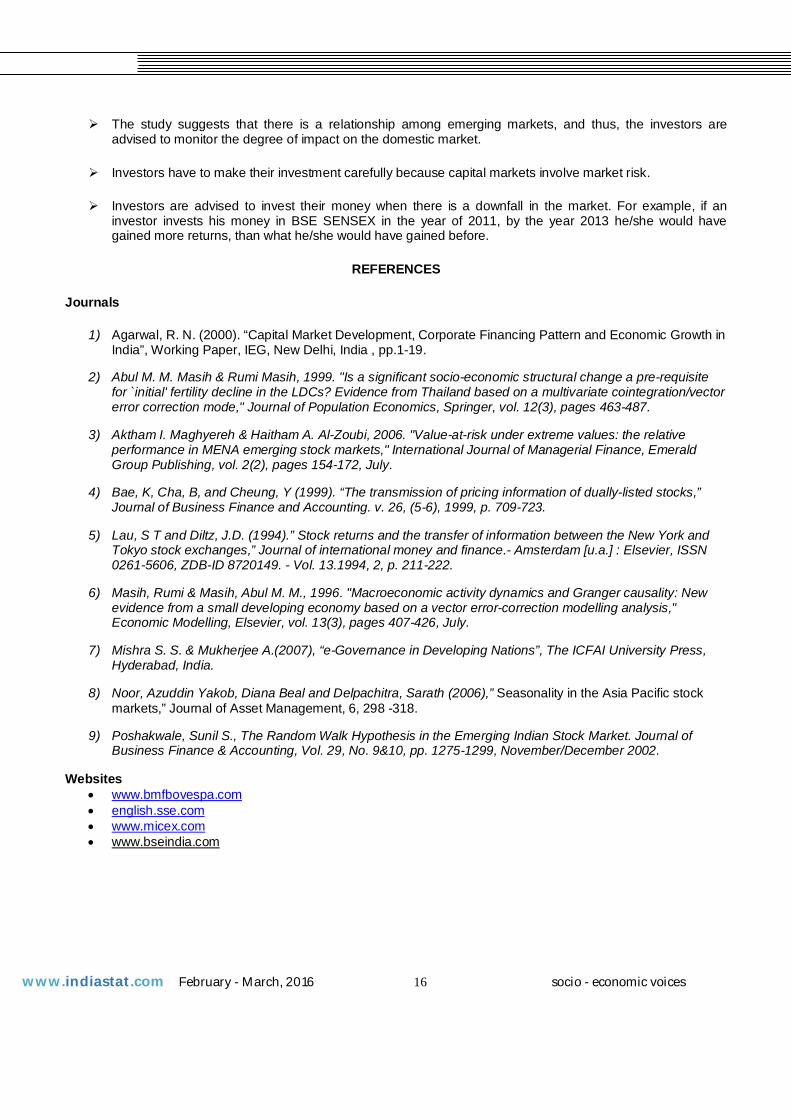
ii) Return relationship Between BSE Sensex And RTSI
Figure –9 The above figure shows positive correlation between the returns of RTSI and BSE SENSEX. The magnitude of the
correlation has declined from the year 2011 as BSE SENSEX has out-performed its counterpart on the returns
front. Moreover, BSE SENSEX has given returns only in 2011 as compared to negative returns by RTSI since
2010. iii) Return relationship Between BSE Sensex And SSE

www.indiastat.com February - March, 2016 15 socio - economic voices
Figure -10 The above figure shows positive correlation between the returns of SSE COMPOSITE and BSE SENSEX. The
magnitude of the correlation has declined from the year 2011 as BSE SENSEX has out-performed its counterpart
on the returns front. Moreover, BSE SENSEX has given returns only in 2011 as compared to negative returns by
SSE COMPOSITE in 2011, 2012 and 2013.
Conclusion and Recommendations
BRIC countries are considered emerging market and their stock markets offer huge and attractive investment
options to all investors across the globe. This study, hence proves that there is a dynamic linkage among the stock
markets of BRIC countries. The entire study reveals that the overall correlation between SENSEX and other
emerging markets is positive till 2011. However, post that period BSE SENSEX has shown a negative correlation
with BOVESPA and SSE COMPOSITE. In the year 2011, every global stock market had given negative returns
due to Eurozone crisis, which has caused the emerging markets indices to face bearish market conditions. From
the year 2011 all the indices have started giving negative returns, except BSE SENSEX, which shows that every
country is not strong enough to face/ overcome bearish conditions, and also investors are not strong enough to
invest their money in stock markets. It can also be analyzed that BSE SENSEX has given superior returns than all
the other emerging markets. The study also reveals that BSE SENSEX is more interdependent on RTSI than other
emerging markets.
Recommendations
Whenever investors want to go for a global diversification they are advised to see the overall performance of global markets.
It is always recommended to analyze the performances of the stock markets based on returns and market capitalization.
www.indiastat.com February - March, 2016 16 socio - economic voices
The study suggests that there is a relationship among emerging markets, and thus, the investors are advised to monitor the degree of impact on the domestic market.
Investors have to make their investment carefully because capital markets involve market risk.
Investors are advised to invest their money when there is a downfall in the market. For example, if an investor invests his money in BSE SENSEX in the year of 2011, by the year 2013 he/she would have gained more returns, than what he/she would have gained before.
REFERENCES
Journals
1) Agarwal, R. N. (2000). “Capital Market Development, Corporate Financing Pattern and Economic Growth in India”, Working Paper, IEG, New Delhi, India , pp.1-19.
2) Abul M. M. Masih & Rumi Masih, 1999. "Is a significant socio-economic structural change a pre-requisite for `initial' fertility decline in the LDCs? Evidence from Thailand based on a multivariate cointegration/vector error correction mode," Journal of Population Economics, Springer, vol. 12(3), pages 463-487.
3) Aktham I. Maghyereh & Haitham A. Al-Zoubi, 2006. "Value-at-risk under extreme values: the relative performance in MENA emerging stock markets," International Journal of Managerial Finance, Emerald Group Publishing, vol. 2(2), pages 154-172, July.
4) Bae, K, Cha, B, and Cheung, Y (1999). “The transmission of pricing information of dually-listed stocks,” Journal of Business Finance and Accounting. v. 26, (5-6), 1999, p. 709-723.
5) Lau, S T and Diltz, J.D. (1994).” Stock returns and the transfer of information between the New York and Tokyo stock exchanges,” Journal of international money and finance.- Amsterdam [u.a.] : Elsevier, ISSN 0261-5606, ZDB-ID 8720149. - Vol. 13.1994, 2, p. 211-222.
6) Masih, Rumi & Masih, Abul M. M., 1996. "Macroeconomic activity dynamics and Granger causality: New evidence from a small developing economy based on a vector error-correction modelling analysis," Economic Modelling, Elsevier, vol. 13(3), pages 407-426, July.
7) Mishra S. S. & Mukherjee A.(2007), “e-Governance in Developing Nations”, The ICFAI University Press, Hyderabad, India.
8) Noor, Azuddin Yakob, Diana Beal and Delpachitra, Sarath (2006),” Seasonality in the Asia Pacific stock markets,” Journal of Asset Management, 6, 298 -318.
9) Poshakwale, Sunil S., The Random Walk Hypothesis in the Emerging Indian Stock Market. Journal of Business Finance & Accounting, Vol. 29, No. 9&10, pp. 1275-1299, November/December 2002.
Websites www.bmfbovespa.com english.sse.com www.micex.com www.bseindia.com