examining infant health outcomes impacted by south
TRANSCRIPT
University of South CarolinaScholar Commons
Theses and Dissertations
6-30-2016
Examining Infant Health Outcomes Impacted BySouth Carolina's Regionalized System of PerinatalCareMichael Grady SmithUniversity of South Carolina
Follow this and additional works at: https://scholarcommons.sc.edu/etd
Part of the Public Health Commons
This Open Access Dissertation is brought to you by Scholar Commons. It has been accepted for inclusion in Theses and Dissertations by an authorizedadministrator of Scholar Commons. For more information, please contact [email protected].
Recommended CitationSmith, M. G.(2016). Examining Infant Health Outcomes Impacted By South Carolina's Regionalized System of Perinatal Care. (Doctoraldissertation). Retrieved from https://scholarcommons.sc.edu/etd/3521

EXAMINING INFANT HEALTH OUTCOMES IMPACTED BY SOUTH CAROLINA’S
REGIONALIZED SYSTEM OF PERINATAL CARE
by
Michael Grady Smith
Bachelor of Science
Presbyterian College, 2005
Master of Science in Public Health
University of South Carolina, 2008
Submitted in Partial Fulfillment of the Requirements
For the Degree of Doctor of Public Health in
Biostatistics
Norman J. Arnold School of Public Health
University of South Carolina
2016
Accepted by:
James W. Hardin, Major Professor
Marco Geraci, Committee Member
Nancy L. Fleischer, Committee Member
Nathan L. Hale, Committee Member
Lacy Ford, Senior Vice Provost and Dean of Graduate Studies

ii
© Copyright by Michael Grady Smith, 2016
All Rights Reserved.

iii
DEDICATION
This work is dedicated to my wife, Arika. I could never completely express how
grateful I am to you for your support, encouragement, affection, and demands that I get
back to work. I am continually inspired by your work ethic and strength of spirit.

iv
ACKNOWLEDGEMENTS
I sincerely appreciate all of the work that my major professor, Dr. James Hardin,
has put not only into this work, but also into my development as a researcher and
professional. Dr. Hardin, I appreciate your support, continual honest feedback, and lent
expertise. Most of all, I thank you for your time, mentorship, and investment in this
work. I am also grateful to the remaining members of my committee, Drs. Marco Geraci,
Nancy Fleischer, and Nathan Hale. Thank you for your careful reviews of my drafts and
for your timely and insightful feedback. You are all tremendous examples of the
professionalism and expertise in public health research that I aspire to reach.
I could not have completed this endeavor without the steadfast support of my
family. To my wife, Arika, who has been by my side since we were in high school, I
could never repay you for all that you’ve given me. Your support in everything I have
ever wanted to accomplish has strengthened and energized me. Thank you for your
patience, your sacrifices, your hard work, and your macaroni and cheese. To my
daughter, Catherine, who has given me applied experience in maternal and child health,
thank you for loving me so much. Your smiles, hugs, and kisses have filled me with joy
and purpose. To my parents, Garry and Brenda Smith, who have worked hard to give me
every advantage they could afford and many that they could not, thank you for believing
in me. I am so proud to be your son. You all have made me happier than any person
deserves to be and I could not love you more.
v
ABSTRACT
Perinatal regionalization systems have been shown to reduce the risk of neonatal
mortality when very low birth weight infants are delivered in Level III hospitals with
neonatal intensive care units, sub-specialist staffing, and adequate experience caring for
high-risk pregnancies and neonates. However, studies to date examining the association
between delivery in Level III hospitals and neonatal mortality have not accounted for
censoring due to fetal deaths. Furthermore, studies of perinatal regionalization to date
have not adequately assessed the association between delivery hospital level of care and
the infant’s hospital length of stay. This dissertation examined 8,594 very low birth
weight live births and fetal deaths occurring in South Carolina hospitals from 2004-2013
to assess the association between birth in a non-Level III hospital and neonatal mortality
accounting for censoring due to fetal death through the use of marginal structural models.
Subsequently, a simulation study was conducted to identify the most appropriate
statistical regression models to analyze highly skewed outcomes such as hospital length
of stay. Finally, Laplace regression was used to assess the association between delivery
hospital level of care and hospital length of stay among 6,301 live born very low birth
weight infants delivered in South Carolina hospitals from 2004-2013. These analyses
found that very low birth weight infants delivered in a non-Level III hospital had a
statistically significantly greater risk of neonatal death than similar infants delivered in a
Level III hospital (aRR=1.81, 95% CI: 1.52, 2.15). Furthermore, Laplace regression was
determined to be the most effective method for analyzing highly skewed outcomes when

vi
the underlying distribution giving rise to the outcome is not confidently known. Finally,
hospital length of stay was found to be statistically significantly shorter for very low birth
weight infants delivered at Level I or Level II hospitals than similar infants born in Level
III hospitals for relatively short lengths of stay (5th and 10th conditional centiles);
significantly shorter for very low birth weight infants delivered at Level II hospitals than
similar infants born in Level III hospitals for relatively central lengths of stay (25th, 50th,
and 75th conditional quantiles); but no statistically significantly different hospital lengths
of stay were observed across levels of care for relatively long lengths of stay (90th and
95th conditional centiles). The potential cost savings due to shorter hospital stays among
relatively short and central hospital lengths of stay do not outweigh the increased risk of
neonatal mortality when very low birth weight infants are delivered in non-Level III
hospitals. Therefore, it is recommended that South Carolina maintain the perinatal
regionalization system and seek to ensure that every possible high-risk pregnancy has the
opportunity to deliver at a hospital with a neonatal intensive care unit.

vii
TABLE OF CONTENTS
DEDICATION ....................................................................................................................... iii
ACKNOWLEDGEMENTS ........................................................................................................ iv
ABSTRACT ............................................................................................................................v
LIST OF TABLES ................................................................................................................ viii
LIST OF FIGURES ...................................................................................................................x
LIST OF ABBREVIATIONS ..................................................................................................... xi
CHAPTER 1: INTRODUCTION ..................................................................................................1
CHAPTER 2: LITERATURE REVIEW ........................................................................................9
CHAPTER 3: METHODS ........................................................................................................13
CHAPTER 4: ASSESSING THE ROLE OF CENSORING DUE TO FETAL
DEATHS ON THE ASSOCIATION BETWEEN DELIVERY
HOSPITAL LEVEL AND NEONATAL MORTALITY IN A
REGIONALIZED SYSTEM OF PERINATAL CARE ........................................................21
CHAPTER 5: TESTING STATISTICAL MODELS FOR ANALYZING
SIMULATED HIGHLY SKEWED OUTCOMES ..............................................................47
CHAPTER 6: DELIVERY HOSPITAL LEVEL OF CARE AND LENGTH OF
STAY AMONG VERY LOW BIRTH WEIGHT INFANTS IN
SOUTH CAROLINA ...................................................................................................66
CHAPTER 7: CONCLUSIONS .................................................................................................88
REFERENCES .......................................................................................................................93

viii
LIST OF TABLES
Table 4.1 Bivariate associations between delivery characteristics
and neonatal mortality among live births (n=6,726) occurring
in SC hospitals, 2004-2013 ....................................................................................37
Table 4.2 Bivariate associations between delivery characteristics
and fetal deaths (n=8,594) occurring in SC hospitals, 2004-2013 .........................38
Table 4.3 Relative risk of neonatal death for delivery in a non-Level III
hospital, compared to deliveries in a Level III hospital, from
marginal structural models with and without consideration
of censoring due to fetal deaths .............................................................................39
Table 4.4 Relative risk of neonatal and perinatal death for delivery
in a non-Level III hospital, compared to delivery in a
Level III hospital, from log-binomial regression ...................................................40
Table 4.5 Relative risk of neonatal death for delivery in a non-Level III
hospital, compared to deliveries in a Level III hospital, from
marginal-structural models with and without consideration
of censoring due to fetal deaths. Sensitivity analysis including
continuous gestational age variable ......................................................................41
Table 4.6 Relative risk of neonatal death for delivery in a non-Level III
Hospital, compared to deliveries in a Level III hospital, from
marginal-structural models with and without consideration
of censoring due to fetal deaths. Sensitivity analysis including
a three-category gestational age variable (10-31 weeks, 32-36
weeks, 37+ weeks) .................................................................................................42
Table 4.7 Relative risk of neonatal death for delivery in a non-Level III
hospital, compared to deliveries in a Level III hospital, from
marginal-structural models with and without consideration
of censoring due to fetal deaths. Sensitivity analysis including
a two-category gestational age variable (10-31 weeks, 32+ weeks) ......................43
Table 4.8 Relative risk of neonatal death for delivery in a non-Level III
hospital, compared to deliveries in a Level III hospital, from
marginal-structural models with and without consideration
of censoring due to fetal deaths. Sensitivity analysis including

ix
live births <500 grams, with neonatal deaths among live-born
infants weighing <500 grams censored..................................................................44
Table 5.1 Summary of analysis results with approximately 8% of the
observations censored. 1,000 replications with β0=1 and β1=-1 ............................58
Table 5.2 Summary of analysis results with approximately 20% of the
observations censored. 1,000 replications with β0=1 and β1=-1 ............................60
Table 5.3 Summary of analysis results with approximately 50% of the
observations censored. 1,000 replications with β0=1 and β1=-1 ............................62
Table 5.4 Estimated impact of neonatal intensive care unit admission
on hospital length of stay among very low birth weight infants
in SC, 2004-2013 ...................................................................................................64
Table 6.1 Descriptive summary of length of hospital stay by censoring
variables among live births occurring in SC hospitals, 2004-2013 .......................82
Table 6.2 Descriptive summary of length of hospital stay by delivery
characteristics among live births occurring in SC hospital,
2004-2013. Censored observations excluded ........................................................83
Table 6.3 Adjusted difference in length of hospital stay by hospital
level of care at the 5th, 10th, 25th, 50th, 75th, 90th, and 95th
quantiles. Results from Laplace regression among live
births in SC hospitals, 2004-2013 (n=6,301) .........................................................85
x
LIST OF FIGURES
Figure 1.1 Map of SC’s perinatal regions and Regional Periantal
Centers .....................................................................................................................8
Figure 3.1 Directed acyclic graph (DAG) for the relationship
between level of perinatal care for the hospital of
delivery and neonatal mortality .............................................................................18
Figure 3.2 Distribution of total days until neonatal intensive care
unit discharge among 2013 SC neonatal infant care unit
admissions ..............................................................................................................19
Figure 3.3 Directed acyclic graph (DAG) for the relationship
between level of perinatal care for the hospital of
delivery and length of hospital stay .......................................................................20
Figure 4.1 Directed acyclic graph (DAG) for the relationship
between level of perinatal care for the hospital of
delivery and neonatal mortality (outcome of interest)
and fetal mortality (censoring event) .....................................................................45
Figure 4.2 Sample size and exclusions for final set of deliveries
included in analyses ...............................................................................................46
Figure 5.1 Distribution of hospital length of stay among 7,252
singleton infants with a birth weight from 500-1,499 grams
who did not have a birth defect reported on the birth
certificate in SC, 2004-2013 ..................................................................................65
Figure 6.1 Sample size and exclusions for final set of deliveries
included in analyses ...............................................................................................86
Figure 6.2 Directed acyclic graph (DAG) for the relationship
between level of perinatal care for the hospital of
delivery and length of hospital stay .......................................................................87

xi
LIST OF ABBREVIATIONS
AFT ............................................................................................... Accelerated Failure Time
ARR ................................................................................................. Adjusted Relative Risk
BMI ........................................................................................................... Body Mass Index
CI............................................................................................................ Confidence Interval
CON ........................................................................................................ Certificate of Need
DAG ................................................................................................ Directed Acyclic Graph
DHEC ..................................................... Department of Health and Environmental Control
HLS ................................................................................................. Hospital Length of Stay
NICU ....................................................................................... Neonatal Intensive Care Unit
OLS .................................................................................................. Ordinary Least Squares
QR ......................................................................................................... Quantile Regression
RPC .............................................................................................. Regional Perinatal Center
RR .................................................................................................................... Relative Risk
SC .................................................................................................................. South Carolina
US .................................................................................................................... United States
VLBW ............................................................................................. Very Low Birth Weight

1
CHAPTER 1
INTRODUCTION
The purpose of this chapter is to provide background information about infant mortality
and perinatal regionalization in South Carolina. Additionally, this chapter will establish
the format and structure of this dissertation.
Infant Mortality
Infant mortality is a major public health outcome used in South Carolina (SC), the
United States (US), and across the world as an indicator of overall population health1 and,
in particular, the health of the women of reproductive age2,3. In the US, infant mortality
has decreased from 9.81 deaths per 1,000 live births in 1989 to 5.98 deaths per 1,000 live
births in 20124. However, despite these decreases in infant mortality, the US continues to
have substantially higher infant mortality rates than many other developed nations,
particularly due to a higher prevalence of preterm births5. Among US states, those in the
Southeast have substantially higher infant mortality rates, with 1.18 excess infant deaths
for every 1,000 live births than other US regions6.
South Carolina’s infant mortality rate has decreased substantially over the past
decade, from 9.3 deaths per 1,000 live births in 2004 to 6.9 deaths per 1,000 live births in
20137. Disorders related to low birth weight or short gestation are consistently the first or
second leading cause of infant death annually in SC. Compared to normal birth weight
infants, infants born with a very low birth weight (VLBW; <1,500 grams) are
2
substantially more likely to die in the first year of life, with most of these deaths
occurring during the neonatal period (first 27 days of life). Very low birth weight
deliveries made up 1.8% of all live births in SC in 2013, but comprised 54.5% of all
infant deaths in 2013. Among these deaths to VLBW infants, 86.3% occurred during the
neonatal period. Therefore, any system or intervention that effectively prevents VLBW
births or reduces the risk of neonatal death among VLBW births has the potential to
substantially impact the overall infant mortality rate.
Components of Perinatal Regionalization
Perinatal regionalization is a system of care that seeks to ensure that women with
high-risk pregnancies receive care and deliver at facilities with the technology, sub-
specialty staff, and experience to provide care for those high-risk pregnancies and
resulting infants. This is often referred to as a system of risk-appropriate care. Perinatal
regionalization systems are often statewide and classify hospitals into different levels of
care based on factors such as specialist and sub-specialist staffing (e.g. maternal-fetal
medicine specialists, neonatologists), technological capability to provide infant care (e.g.
special care nurseries, neonatal intensive care units [NICUs]), and capability to perform
complex cardiac surgeries on newborns. Each state (or other geographic area) is divided
into regions with at least one delivering hospital with a NICU and sub-specialist staff in
each region. These hospitals are referred to as Regional Perinatal Centers (RPCs) and
provide the following services within their region:
1. Act as the designated consultation and referral center for all high-risk
pregnancies in the region,
3
2. Provide transportation for high-risk patients to get from community hospitals or
midsize hospitals to the RPC,
3. Provide clinician education programs through outreach educators, and
4. Monitor the operation and effectiveness of the system within their region.
All of these services are supported and facilitated by a series of contracts between
hospitals in each region and the RPCs and between the RPCs and a funding agency,
usually a state health department. Perinatal regionalization systems have been shown to
reduce the risk of neonatal mortality among VLBW infants8–13. However, not all US
states have perinatal regionalization systems and there are many differences in the way
these systems operate among states that do have systems14.
Perinatal Regionalization in South Carolina
In SC, hospitals licensed to care for pregnant women and deliver infants are
currently divided into the following levels: Level I, Level II, Level II Enhanced
(commonly referred to as Level IIE), Level III, and RPCs. Level I hospitals are small
community hospitals that provide care for uncomplicated pregnancies expected to result
in normal birth weight births (≥2,500 grams). Level II hospitals are larger hospitals with
special care nurseries which provide appropriate care for some complex pregnancies
expected to result in a normal birth weight or moderately low birth weight births (1,500 -
2,499 gram). Level IIE hospitals have special care nurseries with some additional
capabilities to care for infants with a birth weight down to 1,250 grams. Level III
hospitals have 24 hour coverage by both maternal-fetal medicine specialists and
neonatologists as well as NICUs that are equipped to provide appropriate care to normal

4
or complex pregnancies and infants of any birth weight. Regional Perinatal Centers are
Level III hospitals that accept high-risk pregnancies referred by other hospitals in their
region, provide transportation for these women and infants, and provide educational
programs to the other hospitals in their region.
In SC, the criteria for hospitals to operate at each level of care are codified in SC
State Regulation 61-16 and approved by the SC General Assembly. Each hospital must
apply to the SC Department of Health and Environmental Control (DHEC) Bureau of
Health Facilities Licensing for licensure at a specified level before being approved to
establish a maternity program. South Carolina has four perinatal regions with at least at
least one RPC in each region. These perinatal regions and RPCs are identified in Figure
1.1.
The national conversation about perinatal regionalization began in 1976 when the
March of Dimes Committee on Perinatal Health published Toward Improving the
Outcome of Pregnancy: Recommendations for the Regional Development of Maternal
and Perinatal Health Services15. This document outlined a recommended structure for a
regionalized system of perinatal care for the first time. However, South Carolina had one
of the three highest infant mortality rates in the US at this time, and a regionalized system
of perinatal care was already being discussed among state health leaders. In 1974 the SC
Board of Health and Environment approved the South Carolina Regionalization of
Perinatal Health Care Plan to allow for the voluntary review and designation of
delivering hospitals in SC as Level I, Level II, or Level III care centers. This plan also
called for public funds for educational systems among health care providers.

5
In 1984, the Governor’s Perinatal Plan of Action was released by the
administration of SC Governor Richard Riley. This document, compiled by a multi-
agency work group, required DHEC to use its Certificate of Need (CON) process to
develop standards and requirements for a hospital to have NICU beds, develop a
licensure process for Level III hospitals, and develop and implement a transportation
system to allow women with high-risk pregnancies to receive care at Level III facilities.
This laid the foundation for the establishment of a formal, regulated perinatal
regionalization system in SC. This system has changed slightly in SC in the intervening
years, with licensing standards allowing for the addition of Level IIE hospitals, as long as
there was not a Level III facility within 90 miles, in 2002.
In 2012, the American College of Obstetricians and Gynecologists and the
American Academy of Pediatrics released the Guidelines for Perinatal Care, 7th Edition,
which provided updated recommendations for the regionalization of perinatal care16.
Strong perinatal regionalization systems continued to be recommended, but a Level IV
designation was recommended for hospitals able to perform complex cardiac surgery in
addition to the staffing and NICU requirements of Level III hospitals. Additionally, the
7th edition of the Guidelines of Perinatal Care recommended that Level III hospitals
maintain a “high volume” of VLBW deliveries. Given this new recommendation and the
fact that a Level IIE designation has never been part of a national recommendation for
perinatal regionalization systems, in 2014 DHEC drafted a revision of the perinatal
section of SC State Regulation 61-16 to govern the SC perinatal regionalization system.
This draft regulation eliminates the Level IIE designation; adds a Level IV designation;
and implements a required volume of at least 100 VLBW admissions, infants on assisted

6
ventilation for more than 24 hours, or infant surgeries for hospitals to become Level III,
RPC, or Level IV facilities. These drafted regulations were approved by the SC Board of
Health and Environment, the SC House of Representatives, and the SC Senate and were
implemented as part of the SC State Hospital Regulations on June 26, 2015.
Format and Structure of Dissertation
This dissertation will be formatted using the manuscript style with three academic
papers making up chapters 4-6. Each of these academic papers will answer research
questions as follows:
o Manuscript 1 (chapter 4):
Research Question 1: Does hospital level of perinatal care impact neonatal
deaths in South Carolina?
Research Question 2: Does “censoring” due to in-hospital fetal deaths
introduce selection bias in assessments of the association between hospital
level of perinatal care and neonatal mortality17?
o Manuscript 2 (chapter 5):
Research Question 1: Should a hospital length of stay outcome be analyzed as
a count outcome (zero-inflated poisson regression, negative binomial
regression, quantile regression), a continuous outcome (linear regression,
quantile regression), or a time-to-event outcome (accelerated failure time
regression, Laplace regression)? What situations (tail length, censoring
percentage, etc.) impact optimization of each analysis method?

7
o Manuscript 3 (chapter 6):
Research Question 1: Does delivery in a level III hospital impact hospital
length of stay among VLBW infants (maternal transport vs. neonatal or no
transport)?
Chapter 7 will include an overall conclusion that summarizes the results of the three
papers presented in chapters 4-6.

8
Figure 1.1: Map of SC’s perinatal regions and Regional Perinatal Centers.
9
CHAPTER 2
LITERATURE REVIEW
The purpose of this chapter is to provide a summary of the existing literature on perinatal
regionalization and highlight the current research gaps.
As mentioned above, the national conversation regarding perinatal regionalization began
in earnest in 1976 with the publication of Toward Improving the Outcome of Pregnancy:
Recommendations for the Regional Development of Maternal and Perinatal Health
Services by the March of Dimes Committee on Perinatal Health. After the release of this
document demonstration projects were established to document the impact of
regionalized systems of perinatal care in applied settings18. In the years that followed,
observational studies in states establishing perinatal regionalization systems began to
consistently demonstrate positive impacts on neonatal mortality among VLBW infants8–
11, including studies specific to SC12,13.
Political environments, enabling legislation, and numbers of hospitals with
existing NICUs vary from state to state, which has led to a lack of consistency in the way
that regionalized systems of perinatal care are implemented among states that have some
form of regionalization14,19. Currently, some states have regulated perinatal
regionalization systems supported by legislation, some states have systems supported by
voluntary agreements among hospitals, and some states have no system of regionalized
perinatal care. At least one study examining the policy environments of states with
10
regulated perinatal regionalization systems compared to states with no perinatal
regionalization has determined that states with CON programs are a major supporting
factor for perinatal regionalization20. CON programs require hospitals to demonstrate a
need in their service area before being approved to add or increase offerings in specified
services. Since the repeal of Federal legislation requiring CON programs in 1986, at least
20 states have abolished CON requirements for health facility construction and
expansion. This has led to “de-regionalization” of perinatal systems in some states and
allowed for NICUs to open in hospitals that have a low volume of VLBW deliveries.
Multiple studies have shown NICUs with a low volume of VLBW deliveries (<100
VLBW deliveries per year) have significantly increased risk of neonatal mortality among
VLBW infants than NICUs with a high-volume of VLBW deliveries11,17,21–28.
Additionally, the Patient Protection and Affordable Care Act has had unintended
consequences that increase the incentive to “de-regionalize,” emphasizing a need for
current, relevant studies to assess the effectiveness on perinatal regionalization systems29–
31.
The vast majority of studies on perinatal regionalization have focused on the
impact of these coordinated systems of care on neonatal mortality among VLBW infants
as a proxy for high-risk pregnancies. While neonatal mortality is an outcome of great
importance, there is also a need for studies on other important outcomes32. Outcomes
that have a clearly defined financial impact on health care payers are of particular
relevance to the ongoing policy discussion around perinatal regionalization. Recent
studies have examined outcomes such as necrotizing enterocolitis, neurological
impairments, gastroschisis, and Medicaid reimbursement, comparing outcomes when
11
deliveries occur in hospitals with NICUs compared to when deliveries occur in smaller
hospitals and were transferred to hospitals with NICUs31,33,34. Emerging issues that are
impacting the implementation, effectiveness, and assessment of perinatal regionalization
include the increasing use of telemedicine and emerging data analysis methodologies
such as instrumental variable analysis17,27,35.
Current gaps in perinatal regionalization literature include assessing the impact of
in-hospital fetal deaths on outcomes such as neonatal mortality and assessments of the
impact of birth in a Level III or higher hospital on NICU length of stay and overall
hospital length of stay. Phibbs et al. noted that in-hospital fetal deaths may result in bias
of the true impact of VLBW deliveries occurring in Level III or higher hospitals on
neonatal mortality in 200717. Instances where high-risk pregnancies that end in fetal
deaths are being cared for in Level III or higher hospitals are also products of perinatal
regionalization systems and, therefore should be included in analyses. There may be
little etiologic difference between many in-hospital fetal deaths and VLBW infants that
die in the neonatal period. However, fetal deaths have not been included in most studies
of perinatal regionalization to date because these studies are often based on data from
birth certificates, which are only filed in the event of a live birth. According to SC
hospital discharge data, there were 300 in-hospital fetal deaths in 2014. Annually there
are roughly 420 total infant deaths and 190 neonatal deaths among VLBW deliveries.
These fetal deaths should be considered lost-to-follow up, or censored outcomes. If the
primary outcome of interest is neonatal death, assessing hospital level of care without
considering fetal deaths could result in selection bias. Therefore, fetal deaths likely

12
should be accounted for in analyses, as there are a substantial number of these outcomes
and adjusting for them may substantially impact study results and implications.
One study to date assessed the association of hospital of birth and hospital length
of stay in the context of a regionalized system of perinatal care13. This study, published
by Sanderson et al. in 2000 evaluated length of stay as a continuous outcome using linear
regression with a log-transformed outcome to account for the lack of normality in the
length of stay variable. A variety of analysis methods are now available and used for
assessing length of stay outcomes. Therefore, the most appropriate analysis method for
assessing the impact on NICU length of stay and overall hospital length of stay for
VLBW infants delivered in Level III or higher hospital compared to those delivered in
smaller facilities warrants additional consideration.
13
CHAPTER 3
METHODS
The purpose of this chapter is to describe the methods that will be used for the analyses in
each of the three manuscripts presented in chapters four through six.
Manuscript 1
This study seeks to assess the association between hospital level of perinatal care and
neonatal mortality among VLBW infants and to quantify the impact on inference of
analyses of considering in-hospital fetal deaths as censored observations. Marginal
structural modelling will be used to assess the relative risk of neonatal mortality among
VLBW infants delivered in Level III hospitals compared to VLBW infants born in
hospitals with a lower perinatal care designation. This analysis will be conducted using a
linked data file that includes data on live births and fetal deaths occurring to SC residents
from 2008-2013. This linked file will include data on fetal deaths reported on the SC
Report of Fetal Death vital records certificate, live births from birth certificate data linked
to infant deaths from death certificate data, and hospital discharge uniform billing (UB-
04) data for all live births and fetal deaths occurring in a hospital.
Marginal structural modelling estimates counterfactual contrasts using stabilized
inverse probability weighting to create a pseudo-population to account for potential

14
confounders by balancing those confounders across levels of the independent variable of
primary interest (delivery in a Level III hospital in this analysis for the present analysis).
Marginal structural models also account for censoring (in-hospital fetal deaths in this
analysis) by including a component in the stabilized inverse probability weight that
accounts for censoring by modeling the predictors of censored values. Therefore a
marginal structural model accounting for censoring can be estimated with the results
compared to those from a marginal structural model that does not account for censoring,
with the divisor of the relative risks indicating the impact of censoring.
The analyses presented in this manuscript will be restricted to fetal deaths and
VLBW deliveries occurring in SC hospitals. The outcome variable will be neonatal
mortality, defined as death from a live birth through the 27th day of life occurring in any
location. This outcome variable will be assessed from birth certificate and death
certificate data. The independent variable of primary interest will be the level of perinatal
care of the hospital of delivery. This variable will be coded as delivery or fetal death in a
Level III hospital compared to delivery or fetal death in a hospital with a lower
designation and will be assessed from birth certificate data. Illustrated in the directed
acyclic graph (DAG) in Figure 3.1 the following variables will be included as
confounders: maternal age (continuous; birth certificate data), maternal race (non-
Hispanic white, non-Hispanic African American, Hispanic and other; birth certificate
data), maternal education (less than high school, high school graduate, more than high
school; birth certificate data), initiation of prenatal care in the first trimester of pregnancy
(yes, no; birth certificate data), method of delivery payment (private insurance, Medicaid,
self-pay or other; birth certificate data), pre-pregnancy body mass index (obese,
15
overweight, or normal/underweight; birth certificate data), gestational diabetes (yes, no;
birth certificate data), gestational hypertension or pre-eclampsia (yes, no; birth certificate
data), surfactant replacement therapy during pregnancy (yes, no; birth certificate data),
corticosteroid use during pregnancy (yes, no; birth certificate data), and assisted
ventilation for newborn (yes, no; birth certificate data). Furthermore, data will be
restricted to only singleton deliveries without indication of birth defects on the associated
birth certificate.
The DAG in Figure 3.1 indicates that fetal death is a common effect of several
variables that confound the association between hospital level of perinatal care and
neonatal mortality. This, along with the fact that fetal deaths occur before neonatal
deaths might occur (that is, fetal deaths are a competing risk for neonatal death), indicate
that fetal death is a suitable candidate for consideration as a censoring event.
Manuscript 2
A variety of statistical approaches have been used to analyze inpatient length of hospital
stay as an outcome of interest. The only study to date to analyze length of hospital stay
to assess the impact of delivery in a Level III hospital within a regionalized system of
perinatal care used linear regression with a log-transformed outcome variable to account
for the non-normal distribution of the length of stay13. Linear regression with a log-
transformed outcome approach has also been used to assess the impact of a variety of
characteristics associated with length of hospital stay36–39, however most of the studies
using this method were published prior to 2001.

16
Studies have also considered length of hospital inpatient stay to be a count
outcome and have applied Poisson regression and negative binomial regression models in
these analyses40–43. A few studies have used survival analysis to examine length of
hospital stay as an outcome using both semi-parametric (Cox proportional hazards
regression)44–46 and parametric (accelerated failure time regression) models45,47,48. Some
recent studies used quantile regression models for which the length of hospital stay was
considered a continuous variable49–52 and have used other quantile regression models
extended for modeling count data53. Finally, at least one study used Laplace regression to
model hospital length of stay as a survival outcome for quantiles of interest54.
In this manuscript, data with a variety of potential length of stay distributions will
be generated with analysis conducted considering length of hospital stay as continuous
outcome (using linear regression and quantile regression), a count outcome (using
Poisson regression, negative binomial regression, and quantile regression), and a survival
outcome (using Cox proportional hazards regression, accelerated failure time regression,
and Laplace regression). The distribution of the simulated hospital length of stay
distributions will be varied by the location of the peak, length of the tail, and percentage
of censored data. Each distribution will be simulated and analyzed with each method
1,000 times with results evaluated based on the percentage of time that the true
association between the simulated length of stay outcome and the independent variable is
captured within the 95% confidence interval for each model.
17
Manuscript 3
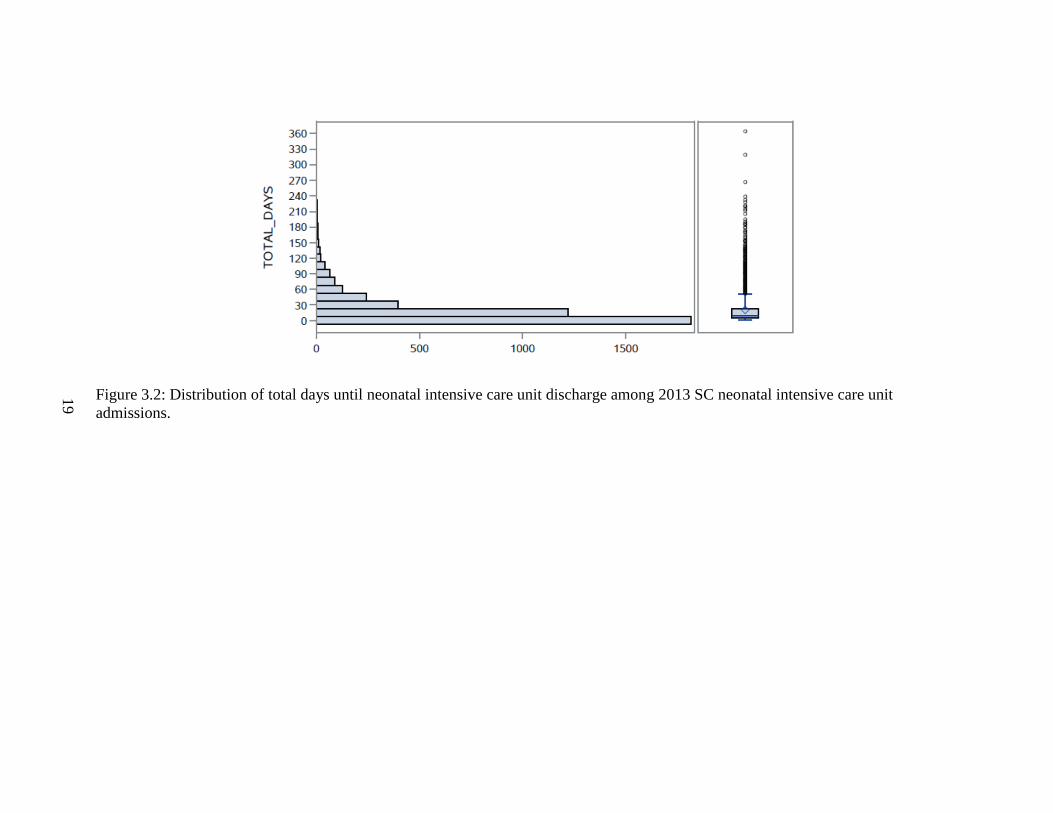
The distribution of the length of NICU stay among VLBW infants born in SC in 2013 is
presented in Figure 3.2. The analysis method that is identified as the most appropriate to
analyze the length of stay distribution observed in this population in manuscript 2 will be
applied to SC live births occurring from 2008 to 2013. Data for this analysis will include
birth certificate data linked to hospital discharge data.
Data for this analysis will be restricted to singleton live births occurring in SC
hospitals without congenital anomalies reported in birth certificate data. The outcome
variable will be length of NICU stay in days from hospital discharge data and the
independent variable of primary interest will be level of perinatal care of the delivery
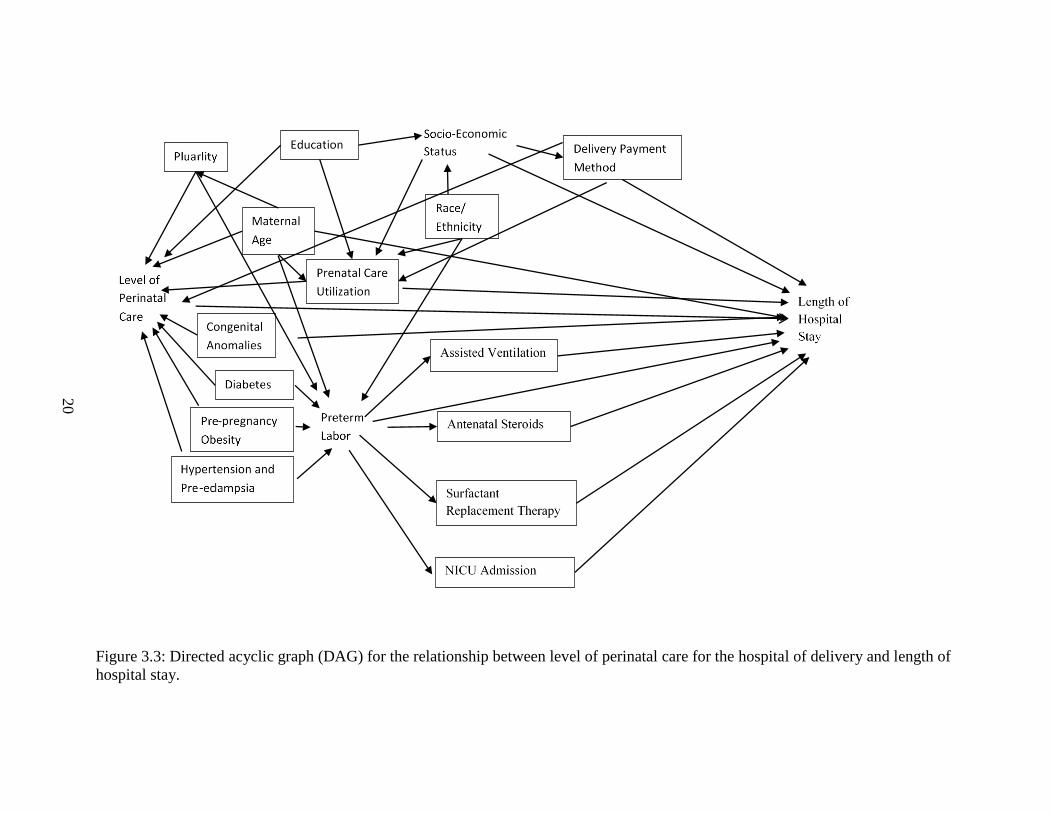
hospital from birth certificate data. As illustrated in the DAG presented in Figure 3.3, the
following potential confounding variables will be included from birth certificate data:
maternal age (continuous), maternal race (non-Hispanic white, non-Hispanic African
American, Hispanic and other), maternal education (less than high school, high school
graduate, more than high school), initiation of prenatal care in the first trimester of
pregnancy (yes, no), method of delivery payment (private insurance, Medicaid, self-pay
or other), surfactant replacement therapy during pregnancy (yes, no), corticosteroid use
during pregnancy (yes, no), and assisted ventilation for newborn (yes, no).

18
Figure 3.1: Directed acyclic graph (DAG) for the relationship between level of perinatal care for the hospital of delivery and neonatal
mortality.
19
Figure 3.2: Distribution of total days until neonatal intensive care unit discharge among 2013 SC neonatal intensive care unit
admissions.
20
Figure 3.3: Directed acyclic graph (DAG) for the relationship between level of perinatal care for the hospital of delivery and length of
hospital stay.
21
CHAPTER 4
ASSESSING THE ROLE OF CENSORING DUE TO FETAL DEATHS
ON THE ASSOCIATION BETWEEN DELIVERY HOSPITAL LEVEL
AND NEONATAL MORTALITY IN A REGIONALIZED SYSTEM OF
PERINATAL CARE1
1 Smith M.G., Fleischer N., Geraci M., Hale N., Hardin J. Submitted to American
Journal of Epidemiology, 02/20/2016
22
The purpose of this chapter is to describe the motivation, methods, results, and
implications of an analysis examining the impact of the level of care of the hospital of
birth on neonatal mortality among very low birth weight deliveries in South Carolina.
Introduction
Perinatal regionalization is a system of care that seeks to ensure that women with high-
risk pregnancies receive care and deliver at facilities with the appropriate technology,
sub-specialty staff, and experience to provide care for those high-risk pregnancies and
resulting infants16. This system is often referred to as a system of risk-appropriate care.
Perinatal regionalization systems are often statewide and classify hospitals into different
levels of care based on factors such as specialist and sub-specialist staffing, technological
capability to provide infant care, and capability to perform complex cardiac surgeries on
newborns. These systems provide mechanisms to transfer the care of high-risk
pregnancies to appropriate hospitals equipped with the staffing, technology, and
experience to provide optimal care for the mother and fetus. Perinatal regionalization
systems have been shown to reduce the risk of neonatal mortality among very low birth
weight (VLBW; <1,500 grams) infants8–13. However, not all US states have perinatal
regionalization systems and there are many differences in the way these systems operate
among states that do have systems14.
In South Carolina (SC), hospitals licensed to care for pregnant women and deliver
infants were divided into the following levels from 2004-2013: Level I, Level II, Level II
Enhanced (commonly referred to as Level IIE), Level III, and Regional Perinatal Centers
(RPCs). Level I hospitals are small community hospitals that provide care for
23
uncomplicated pregnancies expected to result in normal birth weight births (≥2,500
grams). Level II hospitals are larger hospitals with special care nurseries which provide
appropriate care for some complex pregnancies expected to result in a normal birth
weight or moderately low birth weight births (1,500 - 2,499 grams). Level IIE hospitals
have special care nurseries with some additional capabilities to care for infants with a
birth weight down to 1,250 grams. Level III hospitals have 24-hour coverage by both
maternal-fetal medicine specialists and neonatologists as well as NICUs that are equipped
to provide appropriate care to normal or complex pregnancies and infants of any birth
weight. RPCs are Level III hospitals that accept high-risk pregnancies referred by other
hospitals in their region, provide transportation for these women and infants, and provide
educational programs to the other hospitals in their region. In SC, the criteria for hospitals
to operate at each level of care are codified in SC State Regulation 61-16 and approved
by the SC General Assembly55. In 2013 there were 17 Level I hospitals, 21 Level II
hospitals, one Level IIE hospital, and seven Level III hospitals. Five of the seven Level
III hospital were RPCs. These seven Level III hospitals delivered 35.8% of all live births
occurring in SC.
The majority of studies on perinatal regionalization have focused on the impact of
regionalization on neonatal mortality among VLBW infants as a proxy for high-risk
pregnancies8–13. Neonatal mortality is defined as the death of a live-born infant in the
first 27 days of life occurring in any location. However, high-risk pregnancies that are
transferred to Level III hospitals and end in fetal deaths (the death of a fetus prior to
delivery, also known as stillbirth) also represent instances of a perinatal regionalization
system providing risk-appropriate care. Therefore, a comprehensive analysis of a
24
perinatal regionalization system should also take the impact of fetal deaths occurring
inside and outside Level III hospitals into consideration. There may be little etiologic
difference between many in-hospital fetal deaths and VLBW infants that die in the
neonatal period. However, fetal deaths are rarely (for exceptions, see references 11,17)
included in many studies of perinatal regionalization to date because these studies are
often based on data from birth certificates, which are only filed in the event of a live
birth.
This paper assesses the association between the level of perinatal care of the
delivery hospital and neonatal mortality among high-risk deliveries in order to evaluate
the impact of SC’s perinatal regionalization system. Furthermore, our investigation
explores whether treating fetal deaths as censored observations impacts the association
between the delivering hospital level of perinatal care and neonatal mortality among
VLBW live births.
Methods
Data
This analysis utilizes a linked data file that includes data on live births and fetal deaths
occurring among SC residents delivering in SC from 2004-2013. This linked file
includes data on fetal deaths reported on the SC Report of Fetal Death vital records
certificate, live births from the SC Certificate of Live Birth (2003 US Standard revision),
infant deaths from the SC Certificate of Death, and hospital discharge uniform billing
(UB-04) data for all live births and fetal deaths occurring in a hospital.
25
The primary outcome of interest in these analyses is neonatal mortality, which is
assessed from death certificate data. The primary independent variable of interest is the
level of perinatal care of the hospital of delivery. This variable is coded as delivery in a
Level III hospital (including RPCs as Level III hospitals) compared to delivery in a
hospital with a lower designation and is assessed from birth certificate data or report of
fetal death data, as applicable. The following variables are included as confounders, with
hypothesized associations with neonatal mortality and fetal mortality illustrated in the
directed acyclic graph (DAG) in Figure 4.1: maternal age (continuous; birth certificate
data, fetal death data), maternal race (non-Hispanic White, non-Hispanic Black, Hispanic
and other; birth certificate data, fetal death data), initiation of prenatal care in the first
trimester of pregnancy (yes, no; birth certificate data, fetal death data), method of
delivery payment (private insurance, Medicaid, self-pay or other; birth certificate data),
pre-pregnancy obesity status (obese [BMI≥30 kg/m2], overweight [25≤BMI<30 kg/m2, or
normal/underweight [BMI<25 kg/m2]; birth certificate data [height and weight for birth
and fetal death data are self-reported on the mother’s worksheet]), gestational diabetes
(yes, no; birth certificate data, fetal death data), gestational hypertension or pre-eclampsia
(yes, no; birth certificate data, fetal death data), surfactant replacement therapy during
pregnancy (yes, no; birth certificate data), corticosteroid use during pregnancy (yes, no;
birth certificate data), and assisted ventilation for newborn (yes, no; birth certificate data).
Gestational age at delivery was not included as a covariate because nearly all of
the live births and fetal deaths included in this study were delivered preterm with over
80% of all deliveries being early preterm (<32 weeks of gestation). However, sensitivity
analyses including gestational age as a continuous variable, a three-level categorical
26
variable (10-31 weeks, 32-36 weeks, ≥37 weeks), and a two-level categorical variable
(10-31 weeks, ≥32 weeks) were conducted.
The DAG in Figure 4.1 indicates that fetal death is a common effect of several
variables that confound the association between hospital level of perinatal care and
neonatal mortality. This, along with the fact that fetal deaths occur before neonatal
deaths might occur (that is, fetal deaths are a competing risk for neonatal death), indicate
that fetal death is a suitable candidate for consideration as a censoring event56.
Population
The analyses presented in this manuscript are restricted to fetal deaths and VLBW
deliveries occurring in SC hospitals between 2004 and 2013. Live births with a birth
weight less than 500 grams have been removed from all analyses so that these results are
comparable to other studies of perinatal regionalization and neonatal mortality, as these
births are generally considered to be non-viable and would likely result in neonatal death
no matter where they were delivered. Furthermore, data are restricted to singleton
deliveries without a birth defect indicated in birth certificate or fetal death data. For
multivariate analyses, only records without missing data on all covariates of interest were
included (a total of 353 records with missing pre-pregnancy height or weight). Figure 4.2
depicts the number of observations excluded due to each criteria and the composition of
the final analysis dataset (N=8,594).
A sensitivity analysis including deliveries weighing less than 500 grams was also
conducted with neonatal deaths occurring to infants born weighing less than 500 grams
included as censored outcomes.
27
Statistical Analysis
Each characteristic hypothesized to be associated with fetal death and/or neonatal death
was assessed by first examining the variable’s bivariate association with neonatal death
and fetal death (where appropriate). Bivariate associations were assessed for maternal
age as a continuous variable using F tests while bivariate associations with categorical
variables are assessed using χ2 tests.
Marginal structural modelling was used to assess the relative risk of neonatal
mortality among VLBW infants delivered in Level III hospitals compared to VLBW
infants born in hospitals with a lower perinatal care designation. Marginal structural
modelling estimates counterfactual contrasts using stabilized inverse probability
weighting to create a pseudo-population to account for potential confounders by
balancing those confounders across levels of the independent variable of primary interest
(delivery in a Level III hospital for the present analysis). Marginal structural models (see
Hernan and Robins (2015)57) also account for censoring (in-hospital fetal deaths in this
analysis) by including a component in the stabilized inverse probability weight that
accounts for censoring by modeling the predictors of censored values. The marginal
structural model that accounted for censoring due to fetal deaths was compared to the
marginal structural model that did not account for censoring, with the divisor of the
relative risks indicating the impact of censoring.
For the marginal structural models used in this analysis, stabilized inverse
probability weights (SWA) were developed based on the probability of being born in a
Level III hospital both with and without accounting for the covariates of interest. This
derivation of weights is as depicted in equations (1), (2), and (3) below. Equation (1) is a

28
logistic regression model with hospital level of care as the outcome variable and all of the
covariates as independent variables. The results from equation (1) were used to derive
the denominator of the stabilized inverse probability weights. Equation (2) is the null
logistic regression model with hospital level of care as the outcome and no independent
variables. The results from equation (2) were used to derive the denominator of the
stabilized inverse probability weights. Equation (3) demonstrates how the results from
equation (1) and equation (2) were used to calculate the confounding component of the
stabilized inverse probability weights.
Equation 1:
𝑃(𝐴|𝐿) = 𝑃(𝑙𝑒𝑣𝑒𝑙3 = 1)
= 𝐿𝑜𝑔𝑖𝑡(𝛽0 + 𝛽1𝑎𝑔𝑒 + 𝛽2𝑟𝑎𝑐𝑒 + 𝛽3𝑝𝑟𝑒𝑛𝑎𝑡𝑎𝑙𝑐𝑎𝑟𝑒 + 𝛽4𝑜𝑏𝑒𝑠𝑖𝑡𝑦
+ 𝛽5𝑑𝑖𝑎𝑏𝑒𝑡𝑒𝑠 + 𝛽6ℎ𝑦𝑝𝑡𝑒𝑟𝑡𝑒𝑛𝑠𝑖𝑜𝑛 + 𝛽7𝑑𝑒𝑙𝑖𝑣𝑒𝑟𝑦𝑝𝑚𝑡 + 𝛽8𝑠𝑢𝑟𝑓𝑎𝑐𝑡𝑎𝑛𝑡
+ 𝛽9𝑠𝑡𝑒𝑟𝑜𝑖𝑑𝑠 + 𝛽10𝑣𝑒𝑛𝑡𝑖𝑙𝑖𝑎𝑡𝑖𝑜𝑛),
where A = independent variable of primary interest
L = the set of additional independent variables
Equation 2:
𝑃(𝐴) = 𝑃(𝑙𝑒𝑣𝑒𝑙3 = 1) = 𝐿𝑜𝑔𝑖𝑡(𝛽0)
Equation 3:
𝑆𝑊𝐴 =𝑃(𝐴)
𝑃(𝐴|𝐿), 𝑤ℎ𝑒𝑟𝑒 𝑙𝑒𝑣𝑒𝑙3 = 1 𝑜𝑟
𝑆𝑊𝐴 =1 − 𝑃(𝐴)
1 − 𝑃(𝐴|𝐿), 𝑤ℎ𝑒𝑟𝑒 𝑙𝑒𝑣𝑒𝑙3 = 0

29
To account for censoring due to fetal deaths, a similar stabilized inverse-
probability weight balanced confounders across the censoring variable (fetal death).
Equations (4), (5), and (6) demonstrate the calculation used for the censoring stabilized
inverse-probability weight. Equation (4) is a logistic regression model where fetal death
(the censoring variable) is the outcome variable and the available covariates are included
as independent variables. Equation (5) is the null logistic regression model where fetal
death is the outcome variable and no independent variables are included. Similar to
equation (3) above, equation (6) demonstrates how the results from equations (4) and (5)
were used to calculate the censoring component of the stabilized inverse probability
weights.
Equation 4:
𝑃(𝐶|𝐿) = 𝑃(𝑓𝑒𝑡𝑎𝑙𝑑𝑒𝑎𝑡ℎ = 1) = 𝐿𝑜𝑔𝑖𝑡(𝛽0 + 𝛽1𝑎𝑔𝑒 + 𝛽2𝑟𝑎𝑐𝑒 + 𝛽3𝑝𝑟𝑒𝑛𝑎𝑡𝑎𝑙𝑐𝑎𝑟𝑒 +
𝛽4𝑏𝑚𝑖 + 𝛽5𝑑𝑖𝑎𝑏𝑒𝑡𝑒𝑠 + 𝛽6ℎ𝑦𝑝𝑡𝑒𝑟𝑡𝑒𝑛𝑠𝑖𝑜𝑛 + 𝛽7𝑙𝑒𝑣𝑒𝑙3),
where C = censoring variable
Equation 5:
𝑃(𝐶) = 𝑃(𝑓𝑒𝑡𝑎𝑙𝑑𝑒𝑎𝑡ℎ = 1) = 𝐿𝑜𝑔𝑖𝑡(𝛽0 + 𝛽1𝑙𝑒𝑣𝑒𝑙3)
Equation 6:
𝑆𝑊𝐶 =𝑃(𝐶)
𝑃(𝐶|𝐿), 𝑤ℎ𝑒𝑟𝑒 𝑓𝑒𝑡𝑎𝑙𝑑𝑒𝑎𝑡ℎ = 1 𝑜𝑟
𝑆𝑊𝐶 =1 − 𝑃(𝐶)
1 − 𝑃(𝐶|𝐿), 𝑤ℎ𝑒𝑟𝑒 𝑓𝑒𝑡𝑎𝑙𝑑𝑒𝑎𝑡ℎ = 0
30
Lastly, the final stabilized inverse probability weight was constructed using
equation (7) by multiplying the confounding component weights and censoring
component weight and then plugged into a log-binomial regression model to predict
neonatal deaths from hospital level of perinatal care. All stabilized inverse probability
weights (including SWA, SWC, and SW) should have a mean at or near one as an
indication of appropriate model fit and specification. This criterion was checked for all
stabilized inverse probability weights used in the analysis.
Equation 7:
𝑆𝑊 = 𝑆𝑊𝐴 ∗ 𝑆𝑊𝐶
A sensitivity analysis was conducted to examine the impact of SWA and SWC
being constructed using the same predictors, which were restricted to variables available
from both birth certificates and fetal death reports. These results were compared to those
obtained from the primary analysis to investigate any meaningful differences in
interpretation. Results from the marginal structural models were also compared to
standard log-binomial regression results using neonatal mortality as the outcome
(excluding fetal deaths) and also using perinatal mortality as the outcome (including in-
hospital fetal deaths and neonatal deaths).
All data management and analyses were conducted in SAS 9.3 (Cary, NC). The
significance level was set at 5%.
31
Results
Bivariate Results
Table 4.1 displays the bivariate associations between characteristics of interest and
neonatal mortality. Among VLBW deliveries in Level I or Level II hospitals, 15%
resulted in neonatal deaths, almost twice the percentage of neonatal death among VLBW
deliveries in Level III hospitals (p<0.0001). Furthermore, maternal age, gestational
diabetes, gestational hypertension, use of antenatal steroids, surfactant replacement
therapy for infants, and assisted ventilation for infants were also associated with
increased neonatal mortality. Many of these characteristics are related to very high risk
pregnancies and deliveries.
Table 4.2 displays the bivariate associations between characteristics of interest
and fetal mortality. Several variables available on the birth certificate are not available
on the report of fetal death certificate. These variables include method of delivery
payment, surfactant replacement therapy for infants, assisted ventilation for infants, and
antenatal steroids. Delivery in a Level III hospital, maternal age, maternal race/ethnicity,
receipt of prenatal care in the first trimester, pre-pregnancy obesity status, gestational
diabetes, and gestational hypertension were significantly associated with fetal mortality.
Multivariate Results
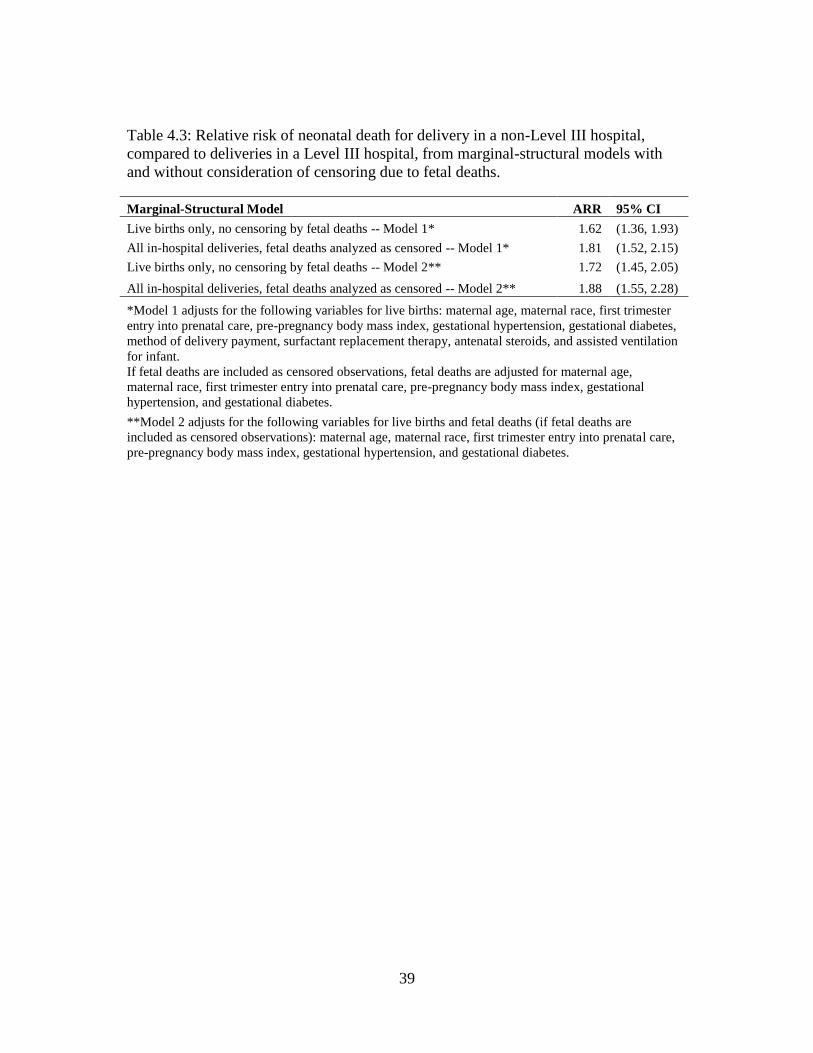
The results of the marginal structural models are displayed in Table 4.3. Model 1 utilizes
all of the available covariates to calculate the stabilized inverse probability weights.
When using model 1 without accounting for censoring due to fetal deaths, VLBW infants
32
born in non-Level III hospitals had 1.62 (95% confidence interval [CI]: 1.36 – 1.93)
times the risk of neonatal death compared to VLBW infants born in Level III hospitals.
When using model 1 to account for censoring due to fetal deaths, VLBW infants
born in non-Level III hospitals were again at increased risk of neonatal death.
Specifically, VLBW infants born in non-Level III hospitals had 1.81 (95% CI: 1.52 –
2.15) times the risk of neonatal death compared to VLBW infants born in Level III
hospitals. This indicates that accounting for censoring due to fetal deaths increases the
relative risk of neonatal deaths among VLBW infant born in non-Level III hospitals by
11.7%.
A sensitivity analysis in which only variables available on both the birth
certificate and the report of fetal death certificate were included in the calculation of the
stabilized inverse probability weights to ensure that the same covariates were used to
create the weight for the independent variable of primary interest (birth in a Level III
hospital) and the censoring variable (fetal death). This was done because many of the
variables that were excluded due to a lack of availability for fetal deaths were also
significantly associated with neonatal mortality in the bivariate analyses. Therefore, not
accounting for these variables may substantially influence the association between
hospital level of care and neonatal mortality. However, as shown in Table 4.3, the
direction and significance of the relative risks was found to be the same for model 2 as
for model 1 with the results from model 2 indicating slightly greater risk of neonatal
mortality for VLBW deliveries in non-Level III hospitals. This suggests that including
the additional variables available on the birth certificate but not the fetal death report to
33
calculate the weight for delivery hospital level of care does impact the results, but makes
them slightly more conservative.
Table 4.4 presents the results from log-binomial regression models to estimate the
adjusted relative risk of neonatal mortality and perinatal mortality (combining in-hospital
fetal deaths and neonatal deaths into a single outcome). Based on the log-binomial
model, the risk of neonatal death among VLBW infants born in a non-Level III hospital is
1.71 (95% CI: 1.44, 2.04) times the risk of neonatal death among VLBW infants born in a
Level III hospital. This estimated relative risk is similar, though slightly larger than the
model 1 estimate for neonatal mortality using marginal structural modelling without
accounting for censoring due to fetal deaths. However, based on the log-binomial model,
the risk of perinatal death among VLBW deliveries in a non-Level III hospital is 2.63
(95% CI: 2.47, 2.79) times the risk of perinatal death among VLBW deliveries in Level
III hospitals. This estimated relative risk is substantially larger than the estimated risk of
neonatal death from the marginal structural model accounting for censoring due to fetal
deaths.
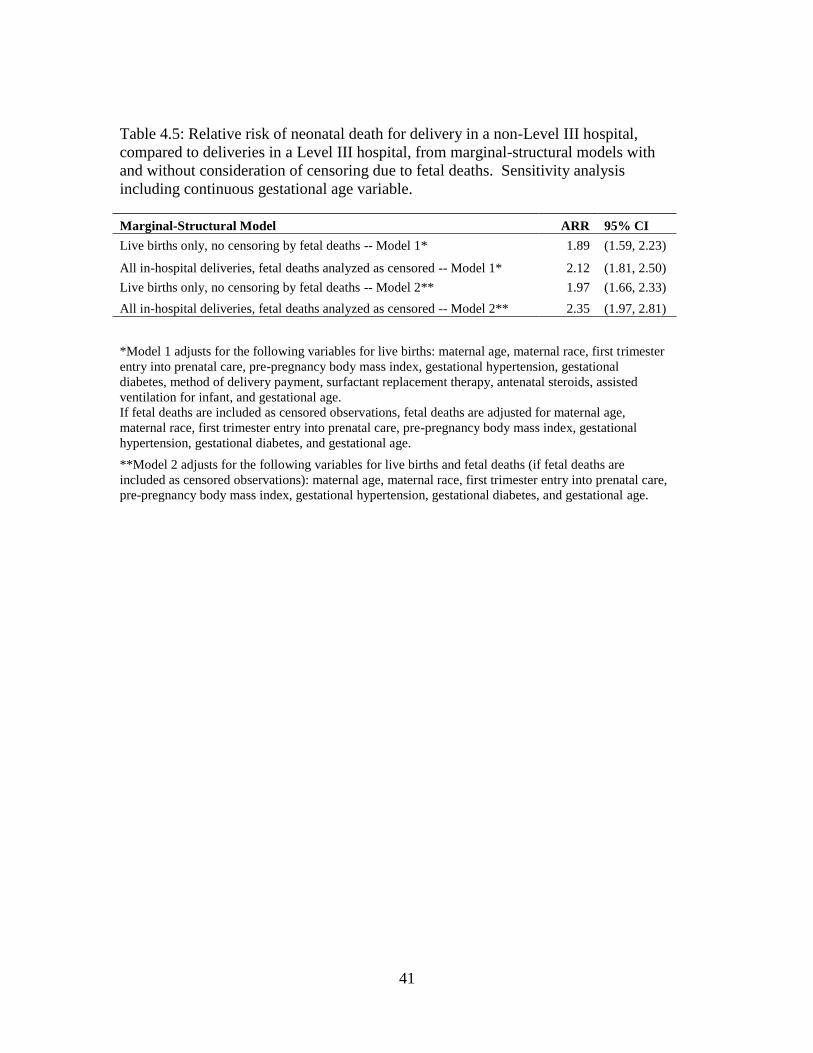
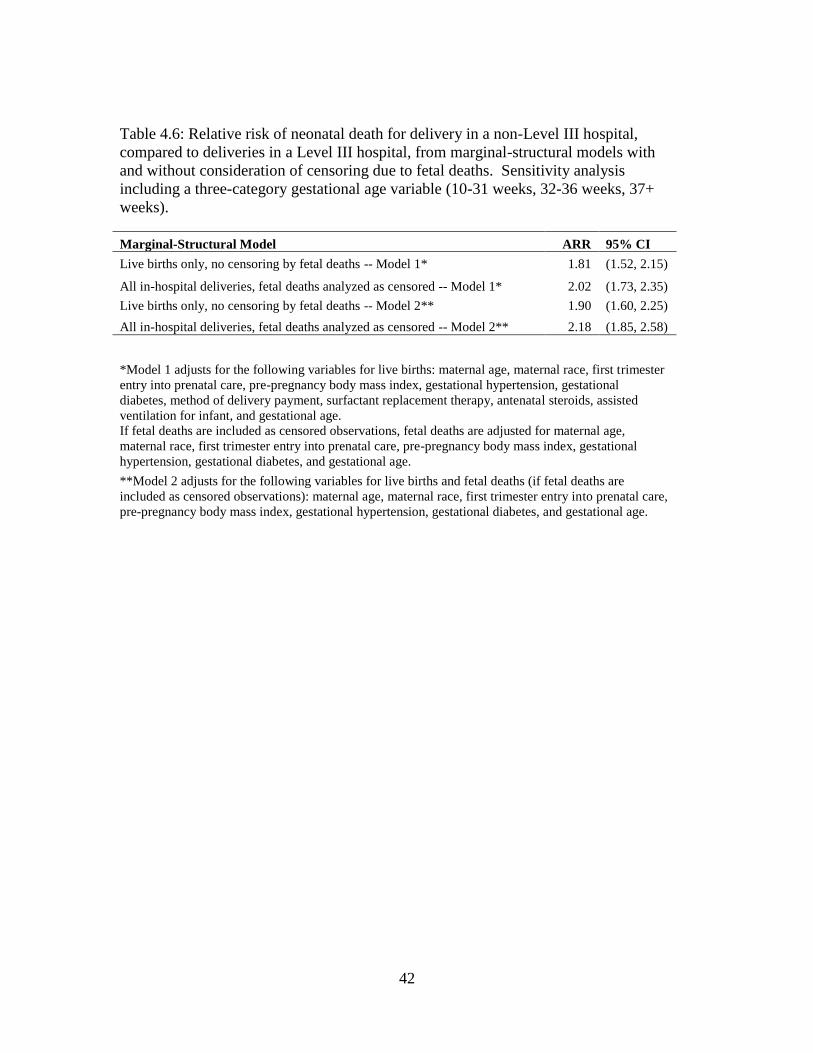
Sensitivity analyses including gestational age as a covariate produced relative risk
estimates slightly greater in magnitude, but did not impact our interpretations or
conclusions. Results of these sensitivity analyses are available in Table 4.5 (continuous
gestational age variable included), Table 4.6 (three-level categorical gestational age
variable included), and Table 4.7 (two-level categorical gestational age variable
included). Additionally, a sensitivity analysis including all deliveries weighing less than
500 grams resulted in similar relative risk estimates that also did not impact our
interpretational or conclusions (Table 4.8).

34
Discussion
This study estimates that VLBW deliveries occurring in non-Level III hospitals in SC
have 81% greater risk of neonatal death when compared to VLBW deliveries occurring in
Level III hospitals when accounting for pregnancies that ended in fetal death. This
indicates that the SC system of perinatal regionalization is working effectively and that
every effort should be made to assure that high-risk pregnancies are receiving care at
Level III hospitals at delivery. Failing to account for pregnancies that did not reach live
birth (i.e., fetal deaths as censoring events) may result in an underestimate of the true risk
of neonatal death.
The relative risk estimates for the association between delivery in a non-Level III
hospital and neonatal death using marginal structural models but without accounting for
censoring due to fetal mortality are in the same direction as those observed in other
studies using neonatal death as an outcome8,9,11. Although the magnitude of the
association varies across studies10, the estimated relative risk of neonatal death found in
our study without accounting for censoring due to fetal mortality is similar to that
observed in other studies conducted in SC12,13. However, the nearly 12% increase in the
magnitude of the relative risk when accounting for censoring due to fetal deaths indicates
that not accounting for fetal deaths as censored events when the event of interest is the
neonatal death of live born infants produces an underestimate of the true impact of the
effectiveness of perinatal regionalization. Furthermore, the large difference in the
magnitude of the relative risk estimates between considering fetal deaths as part of the
perinatal death outcome variable (RR=2.63 from the log-binomial regression models) and
considering fetal deaths as censored observations for an outcome of neonatal death
35
(RR=1.81 from the marginal structural models) may indicate that neonatal death and in-
hospital fetal death have different magnitudes of risk given the level of prenatal care of
the delivering hospital.
It could be that VLBW infants delivered in non-Level III hospitals are
systematically different from those delivered in Level III hospitals with respect to risk
status. For example, the highest-risk pregnancies resulting in VLBW deliveries may be
more likely to be transferred to a Level III hospital prior to delivery, making Level III
deliveries systematically more high-risk. Alternatively, VLBW deliveries at non-Level
III hospitals may be more likely to be the result of emergency situations that prevent the
safe transport to a Level III hospital for delivery, making non-Level III deliveries
systematically more high-risk. Some studies have used instrumental variable analysis to
account for this unmeasured difference in risk status11,27. This paper accounts for
potential differences in the risk status of deliveries at hospitals with different levels of
perinatal care by restricting analyses to deliveries without reported congenital anomalies
and by adjusting for treatments associated with high-risk pregnancies, including assisted
ventilation for the infant, surfactant replacement therapy for the infant, and antenatal
steroid use.
This study is subject to several limitations. First, as with any observational study,
there may be uncontrolled confounding that could change the nature of the observed
association if appropriately considered. Only variables included on birth certificates,
fetal death reports, death certificates, and hospital discharge data were available. Since
neonatal death is a relatively rare outcome, we are limited by the number of variables that
can be included in the model without resulting in combinations of covariate levels with

36
zero observations in the dataset. An additional limitation is that most of the variables
used in this study are based on vital records data, primarily from birth certificates and
reports of fetal death. Data from birth certificates in SC have been shown to have low
sensitivity for some variables when compared to medical records; however, most of the
variables used in this study have been shown to have substantial or high sensitivity58.
This study assumes that the quality of data on report of fetal death certificates is similar
to that of corresponding variables from birth certificates.
South Carolina is a state with a regulated perinatal regionalization system that
defines the requirements for designation at the different perinatal levels of care and
licenses hospitals to function within the parameters of their perinatal level of care
designation. This makes the policy and practice environment with respect to the delivery
of VLBW infants within SC different than many other states14,19. Examining the
difference in perinatal outcomes among high-risk deliveries among different levels of
perinatal care in a state with a strong perinatal regionalization system is essential to
helping to inform whether perinatal regionalization systems are effectively preventing
poor birth outcomes such as neonatal mortality.

37
Table 4.1: Bivariate associations between delivery characteristics and neonatal mortality
among live births (n=6,726) occurring in SC hospitals, 2004-2013.
Characteristic
No Neonatal Death Neonatal Death
p-
value* Mean/
Numbe
r
Standard
Deviation
/
Percent
Mean/
Numbe
r
Standard
Deviation
/
Percent
Maternal Age (years)^ 26.20 6.33 25.51 6.52 0.01
Delivered in a Level III Facility
No 868 85.00 153 15.00 <0.000
1 Yes 5,258 92.16 447 7.84
Maternal Race/Ethnicity
Non-Hispanic White 2,087 90.35 223 9.65
0.30 Non-Hispanic Black 3,615 91.43 339 8.57
Hispanic/Other 424 91.77 38 8.23
Prenatal Care in the First Trimester
No 2,048 91.55 189 8.45 0.34
Yes 4,078 90.84 411 9.16
Method of Delivery Payment
Medicaid 3,741 91.36 354 8.64
0.50 Private Insurance 1,599 90.90 160 9.10
Self-pay/Other 786 91.14 86 9.86
Body Mass Index Classification
Underweight/Normal Weight 2,469 91.01 244 8.99
0.96 Overweight 1,404 90.99 139 9.01
Obese 2,253 91.21 217 9.79
Gestational Diabetes
No 5,856 90.83 591 9.17 0.0007
Yes 270 96.77 9 3.23
Gestational Hypertension
No 4,952 89.71 568 10.29 <0.000
1 Yes 1,174 97.35 32 2.65
Surfactant Replacement Therapy
No 4,699 90.52 492 9.48 0.003
Yes 1,427 92.96 108 7.04
Antenatal Steroids
No 5,081 90.46 536 9.54 <0.000
1 Yes 1,045 94.23 64 5.77
Assisted Ventilation for Infant
No 3,520 90.44 372 9.56 0.03
Yes 2,606 91.95 228 8.05
Total 6,126 600
*P-value for the continuous maternal age variable comes from the F test.
**P-values for categorical variables come from Chi-Squared tests.
^Indicates a continuous variable

38
Table 4.2: Bivariate associations between delivery characteristics and fetal deaths
(n=8,594) occurring in SC hospitals, 2004-2013.
Characteristic
No Fetal Death Fetal Death
p-value* Mean/
Numbe
r
Standard
Deviation
/
Percent
Mean/
Numbe
r
Standard
Deviation
/
Percent
Maternal Age (years)^ 26.13 6.35 26.65 6.51 0.0009
Delivered in a Level III Facility
No 1,021 51.05 979 48.95 <0.0001
Yes 5,705 86.52 889 13.48
Maternal Race/Ethnicity
Non-Hispanic White 2,310 75.91 733 24.09
0.0001 Non-Hispanic Black 3,954 79.88 996 20.12
Hispanic/Other 462 76.87 139 23.13
Prenatal Care in the First Trimester
No 2,237 82.15 486 17.85 <0.0001
Yes 4,489 76.46 1,382 23.54
Method of Delivery Payment
Medicaid
Private Insurance
Self-pay/Other
Body Mass Index Classification
Underweight/Normal Weight 2,713 80.03 677 19.97
0.006 Overweight 1,543 77.27 454 22.73
Obese 2,470 77.02 737 22.98
Gestational Diabetes
No 6,447 78.44 1,772 21.56 0.06
Yes 279 74.40 96 25.60
Gestational Hypertension
No 5,520 76.00 1,723 24.00 <0.0001
Yes 1,206 90.61 125 9.39
Surfactant Replacement Therapy
No
Yes
Antenatal Steroids
No
Yes
Assisted Ventilation for Infant
No
Yes
Total 6,726 1,868
*P-value for the continuous maternal age variable comes from the F test.
**P-values for categorical variables come from Chi-Squared tests.
^Indicates a continuous variable.
39
Table 4.3: Relative risk of neonatal death for delivery in a non-Level III hospital,
compared to deliveries in a Level III hospital, from marginal-structural models with
and without consideration of censoring due to fetal deaths.
Marginal-Structural Model ARR 95% CI
Live births only, no censoring by fetal deaths -- Model 1* 1.62 (1.36, 1.93)
All in-hospital deliveries, fetal deaths analyzed as censored -- Model 1* 1.81 (1.52, 2.15)
Live births only, no censoring by fetal deaths -- Model 2** 1.72 (1.45, 2.05)
All in-hospital deliveries, fetal deaths analyzed as censored -- Model 2** 1.88 (1.55, 2.28)
*Model 1 adjusts for the following variables for live births: maternal age, maternal race, first trimester
entry into prenatal care, pre-pregnancy body mass index, gestational hypertension, gestational diabetes,
method of delivery payment, surfactant replacement therapy, antenatal steroids, and assisted ventilation
for infant.
If fetal deaths are included as censored observations, fetal deaths are adjusted for maternal age,
maternal race, first trimester entry into prenatal care, pre-pregnancy body mass index, gestational
hypertension, and gestational diabetes.
**Model 2 adjusts for the following variables for live births and fetal deaths (if fetal deaths are
included as censored observations): maternal age, maternal race, first trimester entry into prenatal care,
pre-pregnancy body mass index, gestational hypertension, and gestational diabetes.

40
Table 4.4: Relative risk of neonatal and
perinatal death for delivery in a non-Level
III hospital, compared to delivery in a
Level III hospital, from log-binomial
regression.
Outcome Variable ARR 95% CI
Neonatal death* 1.71 (1.44, 2.04)
Perinatal death** 2.63 (2.47, 2.79)
*Neonatal death model adjusts for the
following variables for live births:
maternal age, maternal race, first trimester
entry into prenatal care, pre-pregnancy
body mass index, gestational
hypertension, gestational diabetes,
method of delivery payment, surfactant
replacement therapy, antenatal steroids,
and assisted ventilation for infant.
**Perinatal death model adjusts for the
following variables for live births and
fetal deaths (if fetal deaths are included as
censored observations): maternal age,
maternal race, first trimester entry into
prenatal care, pre-pregnancy body mass
index, gestational hypertension, and
gestational diabetes.
41
Table 4.5: Relative risk of neonatal death for delivery in a non-Level III hospital,
compared to deliveries in a Level III hospital, from marginal-structural models with
and without consideration of censoring due to fetal deaths. Sensitivity analysis
including continuous gestational age variable.
Marginal-Structural Model ARR 95% CI
Live births only, no censoring by fetal deaths -- Model 1* 1.89 (1.59, 2.23)
All in-hospital deliveries, fetal deaths analyzed as censored -- Model 1* 2.12 (1.81, 2.50)
Live births only, no censoring by fetal deaths -- Model 2** 1.97 (1.66, 2.33)
All in-hospital deliveries, fetal deaths analyzed as censored -- Model 2** 2.35 (1.97, 2.81)
*Model 1 adjusts for the following variables for live births: maternal age, maternal race, first trimester
entry into prenatal care, pre-pregnancy body mass index, gestational hypertension, gestational
diabetes, method of delivery payment, surfactant replacement therapy, antenatal steroids, assisted
ventilation for infant, and gestational age.
If fetal deaths are included as censored observations, fetal deaths are adjusted for maternal age,
maternal race, first trimester entry into prenatal care, pre-pregnancy body mass index, gestational
hypertension, gestational diabetes, and gestational age.
**Model 2 adjusts for the following variables for live births and fetal deaths (if fetal deaths are
included as censored observations): maternal age, maternal race, first trimester entry into prenatal care,
pre-pregnancy body mass index, gestational hypertension, gestational diabetes, and gestational age.
42
Table 4.6: Relative risk of neonatal death for delivery in a non-Level III hospital,
compared to deliveries in a Level III hospital, from marginal-structural models with
and without consideration of censoring due to fetal deaths. Sensitivity analysis
including a three-category gestational age variable (10-31 weeks, 32-36 weeks, 37+
weeks).
Marginal-Structural Model ARR 95% CI
Live births only, no censoring by fetal deaths -- Model 1* 1.81 (1.52, 2.15)
All in-hospital deliveries, fetal deaths analyzed as censored -- Model 1* 2.02 (1.73, 2.35)
Live births only, no censoring by fetal deaths -- Model 2** 1.90 (1.60, 2.25)
All in-hospital deliveries, fetal deaths analyzed as censored -- Model 2** 2.18 (1.85, 2.58)
*Model 1 adjusts for the following variables for live births: maternal age, maternal race, first trimester
entry into prenatal care, pre-pregnancy body mass index, gestational hypertension, gestational
diabetes, method of delivery payment, surfactant replacement therapy, antenatal steroids, assisted
ventilation for infant, and gestational age.
If fetal deaths are included as censored observations, fetal deaths are adjusted for maternal age,
maternal race, first trimester entry into prenatal care, pre-pregnancy body mass index, gestational
hypertension, gestational diabetes, and gestational age.
**Model 2 adjusts for the following variables for live births and fetal deaths (if fetal deaths are
included as censored observations): maternal age, maternal race, first trimester entry into prenatal care,
pre-pregnancy body mass index, gestational hypertension, gestational diabetes, and gestational age.
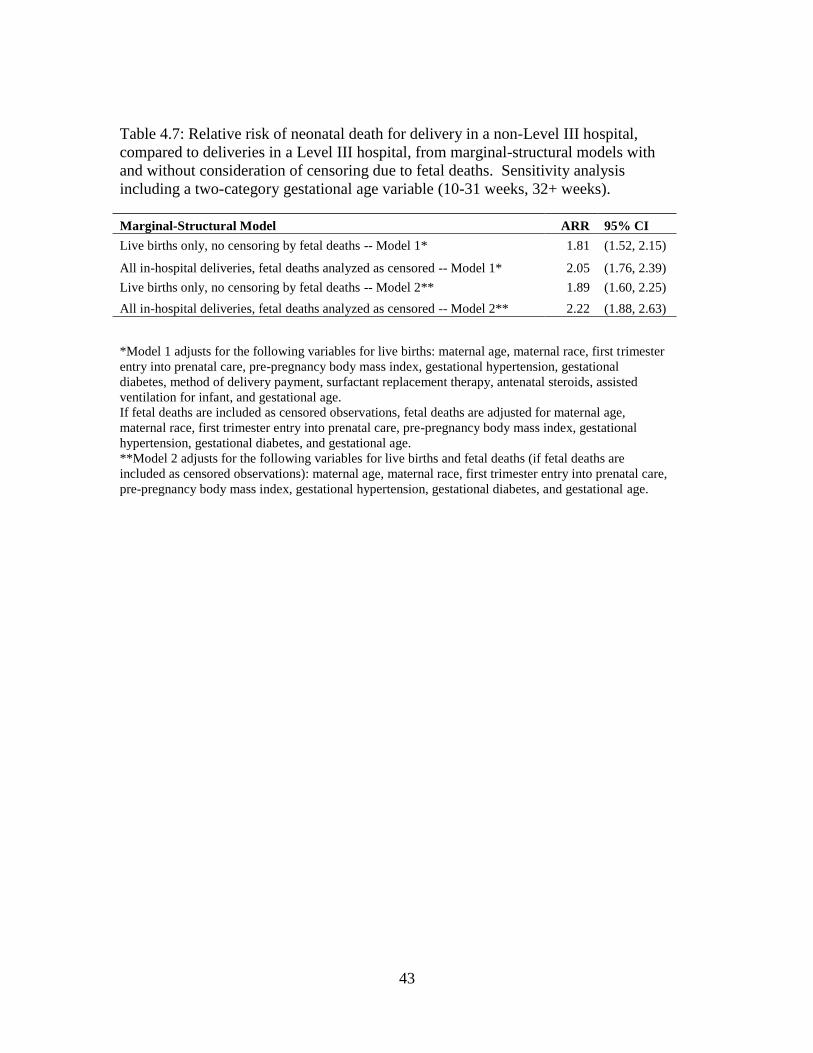
43
Table 4.7: Relative risk of neonatal death for delivery in a non-Level III hospital,
compared to deliveries in a Level III hospital, from marginal-structural models with
and without consideration of censoring due to fetal deaths. Sensitivity analysis
including a two-category gestational age variable (10-31 weeks, 32+ weeks).
Marginal-Structural Model ARR 95% CI
Live births only, no censoring by fetal deaths -- Model 1* 1.81 (1.52, 2.15)
All in-hospital deliveries, fetal deaths analyzed as censored -- Model 1* 2.05 (1.76, 2.39)
Live births only, no censoring by fetal deaths -- Model 2** 1.89 (1.60, 2.25)
All in-hospital deliveries, fetal deaths analyzed as censored -- Model 2** 2.22 (1.88, 2.63)
*Model 1 adjusts for the following variables for live births: maternal age, maternal race, first trimester
entry into prenatal care, pre-pregnancy body mass index, gestational hypertension, gestational
diabetes, method of delivery payment, surfactant replacement therapy, antenatal steroids, assisted
ventilation for infant, and gestational age.
If fetal deaths are included as censored observations, fetal deaths are adjusted for maternal age,
maternal race, first trimester entry into prenatal care, pre-pregnancy body mass index, gestational
hypertension, gestational diabetes, and gestational age.
**Model 2 adjusts for the following variables for live births and fetal deaths (if fetal deaths are
included as censored observations): maternal age, maternal race, first trimester entry into prenatal care,
pre-pregnancy body mass index, gestational hypertension, gestational diabetes, and gestational age.

44
Table 4.8: Relative risk of neonatal death for delivery in a non-Level III hospital,
compared to deliveries in a Level III hospital, from marginal-structural models with
and without consideration of censoring due to fetal deaths. Sensitivity analysis
including live births <500 grams, with neonatal deaths among live-born infants
weighing <500 grams censored.
Marginal-Structural Model ARR 95% CI
Live births only, no censoring by fetal deaths -- Model 1* 1.56 (1.31, 1.87)
All in-hospital deliveries, fetal deaths analyzed as censored -- Model 1* 1.73 (1.46, 2.05)
Live births only, no censoring by fetal deaths -- Model 2** 1.68 (1.41, 2.00)
All in-hospital deliveries, fetal deaths analyzed as censored -- Model 2** 1.79 (1.48, 2.18)
*Model 1 adjusts for the following variables for live births: maternal age, maternal race, first trimester
entry into prenatal care, pre-pregnancy body mass index, gestational hypertension, gestational
diabetes, method of delivery payment, surfactant replacement therapy, antenatal steroids, and assisted
ventilation for infant.
If fetal deaths are included as censored observations, fetal deaths are adjusted for maternal age,
maternal race, first trimester entry into prenatal care, pre-pregnancy body mass index, gestational
hypertension, and gestational diabetes.
**Model 2 adjusts for the following variables for live births and fetal deaths (if fetal deaths are
included as censored observations): maternal age, maternal race, first trimester entry into prenatal care,
pre-pregnancy body mass index, gestational hypertension, and gestational diabetes.
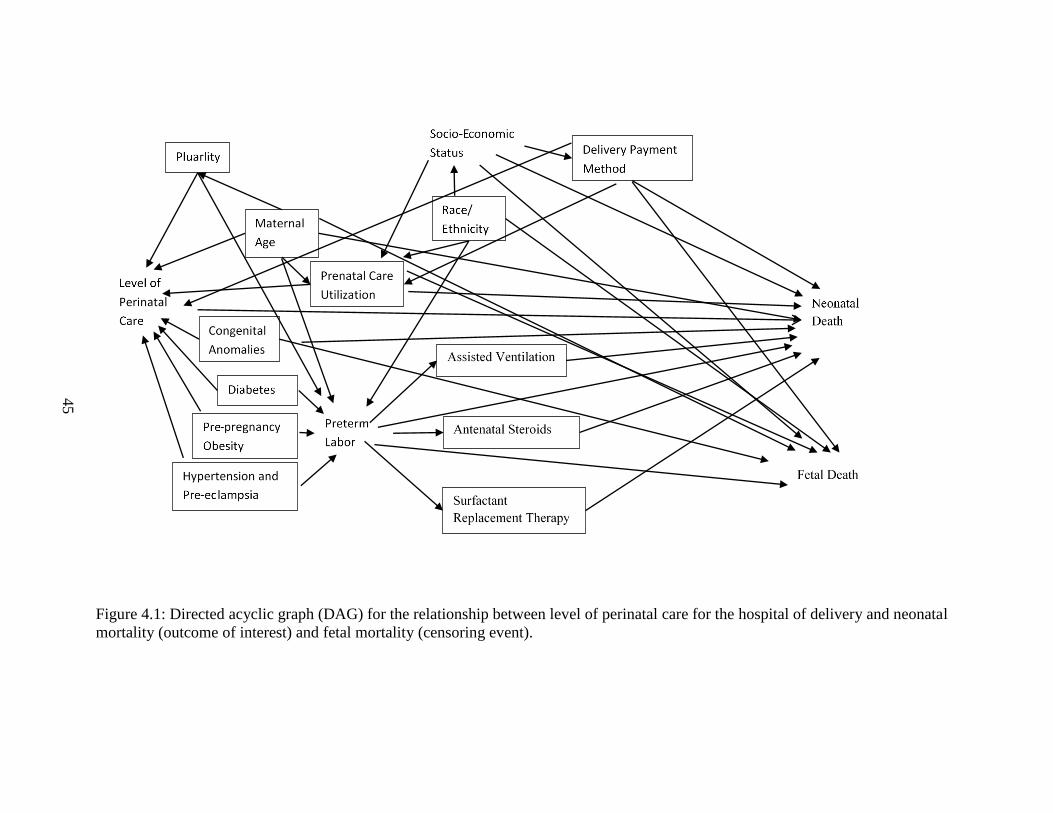
45
Figure 4.1: Directed acyclic graph (DAG) for the relationship between level of perinatal care for the hospital of delivery and neonatal
mortality (outcome of interest) and fetal mortality (censoring event).

46
Figure 4.2: Sample size and exclusions for final set of deliveries included in analyses.
16,062 live births <1,500g or fetal deaths
(10,820 live births, of which 1,664 were neonatal deaths, and 5,242 fetal deaths)
1,154 live births <500g
14,908 live births 500-1,500g or fetal deaths
(9,666 live births, of which 868 were neonatal deaths, and 5,242 fetal deaths)
1,188 fetal deaths and 526 live
births occurring outside a SC
hospital
13,194 in-hospital live births 500-1,500g or fetal deaths
(9,140 live births, of which 824 were neonatal deaths, and 4,054 fetal deaths)
2,472 twins or higher order
multiples
10,722 in-hospital live births 500-1,500g or fetal deaths
(7,030 live births, of which 654 were neonatal deaths, and 3,692 fetal deaths)
1,775 reported congenital
anomalies
8,947 in-hospital live births 500-1,500g or fetal deaths
(6,933 live births, of which 624 were neonatal deaths, and 2,014 fetal deaths)
353 with missing values for
pre-pregnancy BMI
8,594 in-hospital live births 500-1,500g or fetal deaths
(6,726 live births, of which 600 were neonatal deaths, and 1,868 fetal deaths)

47
CHAPTER 5
TESTING STATISTICAL MODELS FOR ANALYZING SIMULATED
HIGHLY SKEWED OUTCOMES2
2 Smith M.G., Geraci M., Fleischer N., Hale N., Hardin J. To be submitted to
Computational Statistics and Data Analysis.
48
The purpose of this chapter is to examine the performance of several statistical regression
models when analyzing an outcome that is highly skewed.
Introduction
Reducing the length of a patient’s hospital stay to the minimum appropriate duration has
long been a goal for clinicians, hospitals, and insurance companies. The release of the
Institute for Healthcare Improvement’s Triple Aim to improve health, improve care, and
reduce cost in 2008 has served to further crystalize focus on health services outcomes
including hospital length of stay (HLS)59. This focus has resulted in hospital systems and
insurance providers increasing efforts to ensure that quality care is provided to patients in
an effort to efficiently aid in their recovery to prevent costly additional days of
admission, while minimizing subsequent re-admissions.
HLS data generally have several defining characteristics. The data are usually
highly skewed with a peak early in the distribution and a long tail. A hospital stay can
end in discharge, or can be censored by death or transfer to another facility. In fact, there
is potential for a wide range in the percentage of observations that are censored when
hospital discharge is the outcome of interest. This paper will focus on HLS among high-
risk infants immediately postpartum. This population generally has two main censoring
events: hospital stays that end in a transfer and hospital stays that end in death. Among
very low birth weight births occurring in South Carolina from 2004-2013, roughly 4% of
hospital stays ended in a transfer without readmission in the state and 11% ended in in-
hospital infant death (based on analysis done by authors). Furthermore, while deaths
occur across the HLS distribution, many of them occur in the first few days of stay.
49
A variety of statistical approaches have been used to analyze HLS as an outcome
of interest. These approaches analyze HLS as a continuous outcome, a count outcome, or
a survival outcome. In particular, linear regression with a log-transformed continuous
HLS variable has been used to assess the impact of a variety of characteristics associated
with HLS36–39, although most of the studies using this method were published prior to
2001. Studies have also considered HLS to be a count outcome and have thus applied
Poisson regression and negative binomial regression models in these analyses40–43. A few
studies have used survival analysis to examine HLS as an outcome using both semi-
parametric (Cox proportional hazards regression)44–46 and parametric (accelerated failure
time regression) models45,47,48. Some recent studies used quantile regression models for
which the HLS was considered a continuous variable49–52, while others have applied
count data to quantile regression models 53. Finally, at least one study used Laplace
regression to model hospital HLS as a survival outcome for quantiles of interest54.
Statistical Models
In this paper, data with a variety of potential HLS distributions were generated, and
analyses were conducted considering HLS as continuous outcome, a count outcome, and
a survival outcome. The simulated hospital HLS distributions were varied by sample size
and percentage of censored data. Each distribution was simulated and analyzed with each
method 1,000 times, with results evaluated based on the mean of the parameter estimates
of interest across analyses of simulated datasets. Additionally, the 5th and 95th centiles of
the parameter estimates were considered to aid in assessing the accuracy of the analysis
method for estimation. Each analysis method was evaluated based on the proximity of
50
the parameter estimates to the true parameter value and whether the true parameter value
fell within the 5th and 95th centiles of the parameter estimates.
Though HLS data are generally no longer analyzed as a continuous variable, two
models for continuous outcomes were explored for the sake of performance comparison:
ordinary least squares (OLS) linear regression with a log-transformed outcome to account
for the skewed distribution, and quantile regression with a log-transformed outcome. For
simplicity, the following quantile regression model was used to assess the median:
𝑄𝑦𝑖|𝑥𝑖(𝜏) = 𝑥𝑖
′𝛽𝜏, 𝑤ℎ𝑒𝑟𝑒 𝜏 = 0.5.
Additional details about quantile regression are available elsewhere60.
A HLS variable may also be considered a count outcome: the number of days
until a discharge. Using simulated HLS data, our research compared the performance of
count outcome models to each other and to the performance of the continuous outcome
models. The count outcome models that were considered in our simulation study
included Poisson regression, negative binomial regression, and a quantile regression
model extended for count data. While Poisson regression is often used to model count
outcomes, negative binomial regression includes one additional parameter to more
effectively measure highly skewed distributions. Because many of the outcomes values
in count data are tied (e.g., many observations with one day or two day HLS values), the
outcome is modified slightly for quantile regression using a process known as jittering.
Jittering adds a small uniform random decimal value to the outcome to greatly reduce or
eliminate ties. After a jittering process was applied to the outcome, the quantile model
referenced above was fitted.

51
Finally, a HLS may be considered a survival outcome: the amount of time
(usually in days) until hospital discharge. Considering HLS as a survival outcome may
be especially attractive if there is a substantial amount of censoring in the outcome (e.g.,
due to death and/or transfer, as mentioned above). In the event of censoring, the outcome
under study is
𝑌 = min(𝑇, 𝐶),
where T is the true time until hospital discharge (unknown in the event of censoring) and
C is the time until the observation is censored. Given this outcome, the effect of the
predictor of interest on Y was estimated using (1) an accelerated failure time (AFT)
model with the correct distribution of T specified, (2) an AFT model with the incorrect
distribution of T specified, and (3) a Laplace regression model. The Cox proportional
hazards model was not included because it models hazard rather than survival.
Laplace regression is an extension of quantile regression to censored data.
Laplace regression uses the quantile regression model given above, but assumes that the
error term follows an asymmetric Laplace distribution. Therefore,
𝑄𝑦𝑖|𝑥𝑖(𝜏) = 𝑥𝑖
′𝛽𝜏 + 𝜀𝑖𝜏𝑢𝑖, where
𝑢~𝜏(1 − 𝜏)𝑒𝐼𝑢≤0−𝜏𝑢.
Additional details of Laplace regression are available elsewhere61. The results from the
survival models were compared to those from the count outcome models and the
continuous outcome models.

52
Simulation
Highly skewed data to approximate a HLS distribution were simulated from a log-normal
distribution with μ = 1 – 1xi and σ2 = 1.3. Censoring data were also simulated from a
log-normal distribution with varying values of μ to produce different amounts of
censoring. To produce data with roughly 8% of the observations censored, μ = 4 and σ2
= 1.5 were specified; to produce data with roughly 20% of the observations censored, μ =
2.75 and σ2 = 1.5 were specified; and to produce data with roughly 50% of the
observations censored, μ = 1 and σ2 = 1.5 were specified. Each dataset was simulated to
have 100, 1,000, and 10,000 observations and was replicated 1,000 times. Each
replicated dataset was analyzed with the statistical models mentioned above for
continuous outcomes, count outcomes, and survival outcomes. Censored observations
were removed from analyses for continuous and count outcomes. Data simulation and
analyses were done using Stata 13 (College Station, TX) and data management was done
using SAS 9.3 (Cary, NC).
Tables 5.1, 5.2, and 5.3 provide the results from each analysis when 8% of the
data are censored, 20% of the data are censored, and 50% of the data are censored,
respectively. Analyzing the highly skewed outcome as a continuous variable with log-
transformed linear and quantile regression at the median produced consistent
underestimates of the true associations; the underestimate increased in magnitude as the
percent of censored observations increased. When analyzing the outcome as a count
variable using Poisson regression and negative binomial regression, the β1 parameter
estimate was consistently underestimated, with the magnitude of the underestimation also
increasing as the percentage of censored observations increased. Poisson and negative
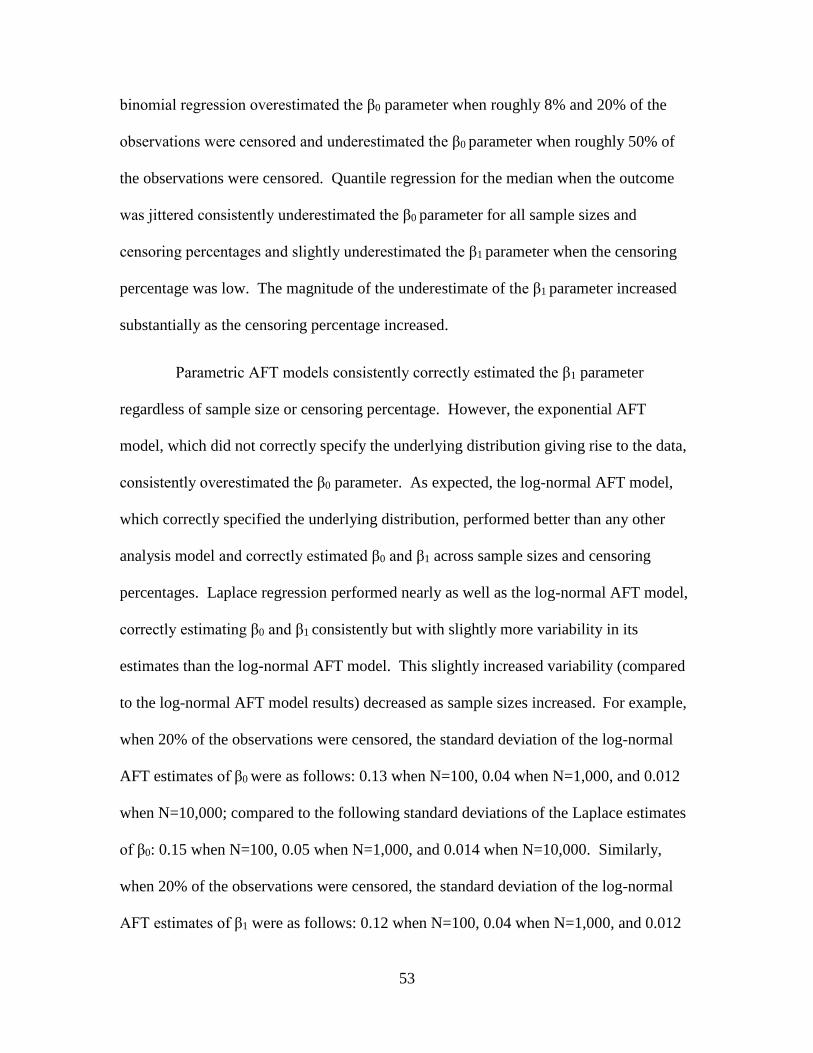
53
binomial regression overestimated the β0 parameter when roughly 8% and 20% of the
observations were censored and underestimated the β0 parameter when roughly 50% of
the observations were censored. Quantile regression for the median when the outcome
was jittered consistently underestimated the β0 parameter for all sample sizes and
censoring percentages and slightly underestimated the β1 parameter when the censoring
percentage was low. The magnitude of the underestimate of the β1 parameter increased
substantially as the censoring percentage increased.
Parametric AFT models consistently correctly estimated the β1 parameter
regardless of sample size or censoring percentage. However, the exponential AFT
model, which did not correctly specify the underlying distribution giving rise to the data,
consistently overestimated the β0 parameter. As expected, the log-normal AFT model,
which correctly specified the underlying distribution, performed better than any other
analysis model and correctly estimated β0 and β1 across sample sizes and censoring
percentages. Laplace regression performed nearly as well as the log-normal AFT model,
correctly estimating β0 and β1 consistently but with slightly more variability in its
estimates than the log-normal AFT model. This slightly increased variability (compared
to the log-normal AFT model results) decreased as sample sizes increased. For example,
when 20% of the observations were censored, the standard deviation of the log-normal
AFT estimates of β0 were as follows: 0.13 when N=100, 0.04 when N=1,000, and 0.012
when N=10,000; compared to the following standard deviations of the Laplace estimates
of β0: 0.15 when N=100, 0.05 when N=1,000, and 0.014 when N=10,000. Similarly,
when 20% of the observations were censored, the standard deviation of the log-normal
AFT estimates of β1 were as follows: 0.12 when N=100, 0.04 when N=1,000, and 0.012
54
when N=10,000; compared to the following standard deviations of the Laplace estimates
of β1: 0.15 when N=100, 0.05 when N=1,000, and 0.015 when N=10,000.
When the data arise from a log-normal distribution, analyzing the data with a log-
normal AFT model results in accurate parameter estimation. However, when the
exponential AFT model is used, miss-specifying the underlying distribution of the data,
biased parameter estimates are observed, especially for the β0 parameter. In comparison,
using a Laplace model does not require that the correct underlying distribution of the data
be specified and is, therefore, not subject to the potential miss-specified distribution bias
observed with AFT models. Therefore, in practice, if the distribution giving rise to the
data is unknown, analyzing the data with Laplace regression is recommended. The
modest loss of precision described above is preferable to the potential bias introduced by
incorrectly specifying the underlying distribution.
Example
In this section we present an example of the methods above used to analyze HLS data for
very low birth weight newborns in SC from 2004-2013. Data are from linked birth
certificate and hospital discharge uniform billing databases. For these analyses one HLS
outcome measure is used for each infant by summing the HLS values from successive
hospital transfers, if applicable. The primary interest in this example is whether neonatal
intensive care unit (NICU) admission is significantly associated with HLS.
The following regression models were used to investigate the association between
NICU admission and HLS: log-transformed linear regression, log-transformed quantile
regression modeling the median, Poisson regression, negative binomial regression,

55
quantile regression with a jittered HLS outcome modeling the median, Cox proportional
hazards regression, accelerated failure time regression assuming a log-normal
distribution, accelerated failure time assuming an exponential distribution, and Laplace
regression modeling the median. Each model is restricted to singleton live births with a
birth weight from 500-1,499g and no birth defects reported on the birth certificate. Each
regression model was adjusted for maternal age (<18, 18-24, 25-34, ≥35), maternal race
(non-Hispanic white, non-Hispanic black, or other), prenatal initiation in the first
trimester of pregnancy (yes or no), method of delivery payment (private insurance,
Medicaid, or other), and obesity status (underweight/normal weight, overweight, obese).
The purpose of this analysis is not to assess the association between NICU admission and
HLS, but rather to demonstrate the variation in results when different methods are used to
analyze real world birth outcome data. Therefore, these covariates may not be the most
appropriate characteristics to include to critically assess the relationship. Results in this
section should be considered for example purposes only and should be interpreted with
caution.
There were a total of 7,252 infants that met the inclusion criteria, of which 14.3%
had a censored HLS outcome. The distribution of the HLS variable is displayed in Figure
5.1. Of the infants included, 6,185 were admitted to a NICU and 1,067 were not admitted
to a NICU. Infants who were admitted to a NICU and were not censored had a mean
HLS of 58.15 days (median=51 days) while infants who were not admitted to a NICU
and were not censored had a mean HLS of 37.78 days (median=33 days).
Table 5.4 displays the estimated adjusted association between NICU admission
and HLS using each analysis method. Log-transformed linear and quantile regression

56
estimate an intercept of 3.06 and 3.45 days of hospital stay, respectively, with 0.76 and
0.43 day median increases in HLS for NICU admission. Poisson and negative binomial
regression models both resulted in a 3.6 day HLS intercept with a median of 0.43 day
increase in HLS for NICU admission. Log-normal AFT and exponential AFT models
resulted in an intercept of 3.12 and 3.68 days of HLS intercepts and 0.77 and 0.45 days
median increases in HLS for NICU admission. All of these estimates are substantially
lower than the unadjusted median HLS for NICU and non-NICU admitted VLBW
infants. The results from the jittered quantile regression model estimated the intercept at
30.32 days HLS with an increased median HLS of 17.88 days for NICU admission, a
much more reasonable result given the unadjusted median HLS values presented above.
Based on the results explored in the Simulation section above, the results from the
Laplace regression model are the most appropriate to use for inference because the
distribution that produced the HLS data in this example is unknown. Furthermore, the
results from the Laplace regression fit well with the unadjusted HLS data by NICU
admission status discussed above. Therefore, we conclude that being admitted to a NICU
increases the median HLS by 18 days among this study population.
Conclusions
Analyzing highly skewed data such as HLS as a continuous or count outcome can
produce biased results. Analyzing the highly skewed data simulated for this study as a
survival outcome produced the most consistently accurate results. If the correct
distribution giving rise to the data is specified then AFT models work quite well.
However, if the underlying distribution is mis-specified the estimated β0 parameter is
consistently overestimated. Laplace regression correctly estimated all parameters and is

57
recommended for analyzing highly skewed outcomes unless the underlying distribution
of the data is known with a high degree of confidence.

58
Table 5.1: Summary of analysis results with approximately 8% of the
observations censored. 1,000 replications with β0=1 and β1=-1.
Sample size=100; 8.00% censored
Treatment of Outcome Variable
Mean
β0
(5% of
estimates,
95% of
estimates)
Mean
β1
(5% of
estimates,
95% of
estimates)
Analyzed as a continuous outcome
Log-transformed linear regression 0.90 (0.72, 1.10) -0.92 (-1.11, -0.73)
Log-transformed median
regression 0.91 (0.69, 1.15) -0.93 (-1.17, -0.73)
Analyzed as a count outcome
Poisson regression 1.47 (1.21, 1.74) -0.85 (-1.21, -0.58)
Negative binomial regression 1.47 (1.23, 1.73) -0.89 (-1.12, -0.64)
Median regression with jittered
outcome 0.66 (0.43, 0.89) -0.93 (-1.17, -0.68)
Analyzed as a survival outcome
Accelerated failure time model
(lognormal) 1.00 (0.81, 1.20) -1.00 (-1.20, -0.81)
Accelerated failure time model
(exponential) 1.59 (1.34, 1.84) -0.97 (-1.21, -0.72)
Median survival model (Laplace
regression) 1.00 (0.78, 1.23) -1.00 (-1.23, -0.75)
Sample size=1,000; 7.98% censored
Treatment of Outcome Variable
Mean
β0
(5% of
estimates,
95% of
estimates)
Mean
β1
(5% of
estimates,
95% of
estimates)
Analyzed as a continuous outcome
Log-transformed linear regression 0.90 (0.83, 0.96) -0.92 (-0.99, -0.86)
Log-transformed median
regression 0.91 (0.83, 0.98) -0.93 (-1.00, -0.85)
Analyzed as a count outcome
Poisson regression 1.49 (1.41, 1.58) -0.85 (-0.97, -0.75)
Negative binomial regression 1.48 (1.41, 1.56) -0.88 (-0.96, -0.80)
Median regression with jittered
outcome 0.66 (0.58, 0.73) -0.93 (-1.00, -0.85)
Analyzed as a survival outcome
Accelerated failure time model
(lognormal) 1.00 (0.94, 1.06) -1.00 (-1.06, -0.94)
Accelerated failure time model
(exponential) 1.60 (1.52, 1.68) -0.97 (-1.05, -0.89)

59
Median survival model (Laplace
regression) 1.00 (0.92, 1.07) -1.00 (-1.07, -0.92)
Sample size=10,000; 7.97% censored
Treatment of Outcome Variable
Mean
β0
(5% of
estimates,
95% of
estimates)
Mean
β1
(5% of
estimates,
95% of
estimates)
Analyzed as a continuous outcome
Log-transformed linear regression 0.90 (0.88, 0.92) -0.92 (-0.94, -0.90)
Log-transformed median
regression 0.91 (0.88, 0.93) -0.93 (-0.95, -0.90)
Analyzed as a count outcome
Poisson regression 1.49 (1.47, 1.52) -0.85 (-0.89, -0.81)
Negative binomial regression 1.48 (1.46, 1.51) -0.88 (-0.91, -0.86)
Median regression with jittered
outcome 0.66 (0.63, 0.68) -0.93 (-0.95, -0.90)
Analyzed as a survival outcome
Accelerated failure time model
(lognormal) 1.00 (0.98, 1.02) -1.00 (-1.02, -0.98)
Accelerated failure time model
(exponential) 1.60 (1.58, 1.62) -0.97 (-1.00, -0.94)
Median survival model (Laplace
regression) 1.00 (0.97, 1.02) -1.00 (-1.02, -0.97)
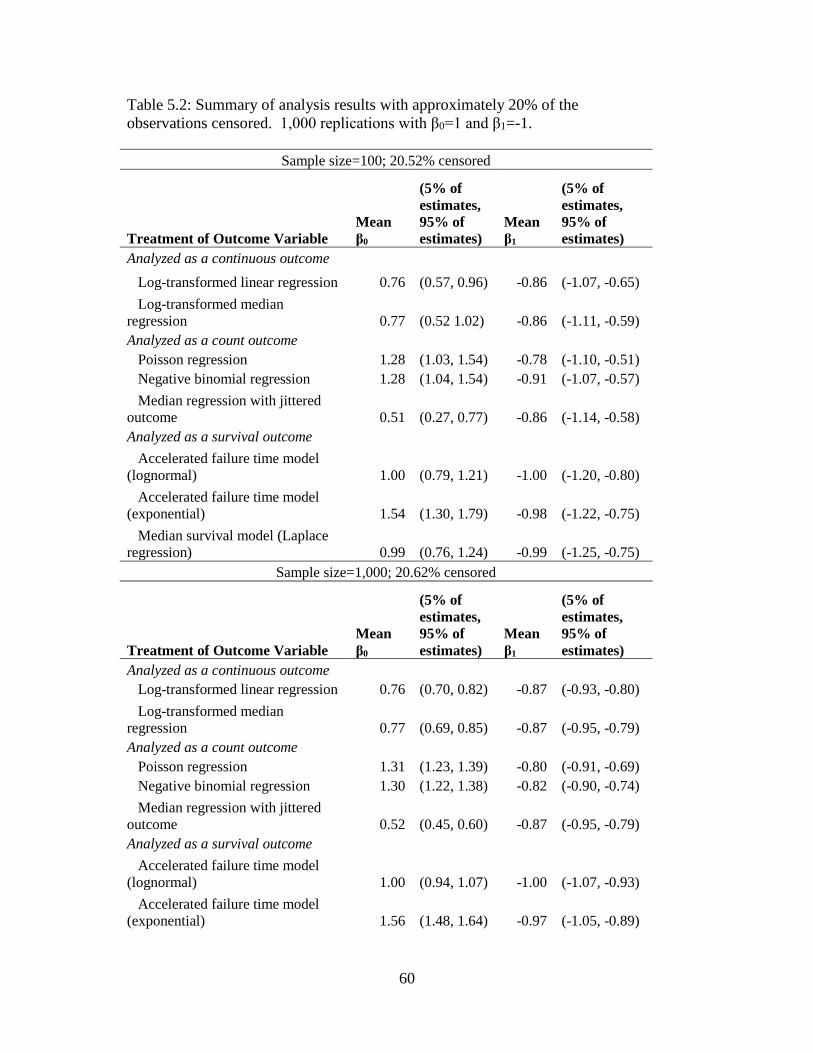
60
Table 5.2: Summary of analysis results with approximately 20% of the
observations censored. 1,000 replications with β0=1 and β1=-1.
Sample size=100; 20.52% censored
Treatment of Outcome Variable
Mean
β0
(5% of
estimates,
95% of
estimates)
Mean
β1
(5% of
estimates,
95% of
estimates)
Analyzed as a continuous outcome
Log-transformed linear regression 0.76 (0.57, 0.96) -0.86 (-1.07, -0.65)
Log-transformed median
regression 0.77 (0.52 1.02) -0.86 (-1.11, -0.59)
Analyzed as a count outcome
Poisson regression 1.28 (1.03, 1.54) -0.78 (-1.10, -0.51)
Negative binomial regression 1.28 (1.04, 1.54) -0.91 (-1.07, -0.57)
Median regression with jittered
outcome 0.51 (0.27, 0.77) -0.86 (-1.14, -0.58)
Analyzed as a survival outcome
Accelerated failure time model
(lognormal) 1.00 (0.79, 1.21) -1.00 (-1.20, -0.80)
Accelerated failure time model
(exponential) 1.54 (1.30, 1.79) -0.98 (-1.22, -0.75)
Median survival model (Laplace
regression) 0.99 (0.76, 1.24) -0.99 (-1.25, -0.75)
Sample size=1,000; 20.62% censored
Treatment of Outcome Variable
Mean
β0
(5% of
estimates,
95% of
estimates)
Mean
β1
(5% of
estimates,
95% of
estimates)
Analyzed as a continuous outcome
Log-transformed linear regression 0.76 (0.70, 0.82) -0.87 (-0.93, -0.80)
Log-transformed median
regression 0.77 (0.69, 0.85) -0.87 (-0.95, -0.79)
Analyzed as a count outcome
Poisson regression 1.31 (1.23, 1.39) -0.80 (-0.91, -0.69)
Negative binomial regression 1.30 (1.22, 1.38) -0.82 (-0.90, -0.74)
Median regression with jittered
outcome 0.52 (0.45, 0.60) -0.87 (-0.95, -0.79)
Analyzed as a survival outcome
Accelerated failure time model
(lognormal) 1.00 (0.94, 1.07) -1.00 (-1.07, -0.93)
Accelerated failure time model
(exponential) 1.56 (1.48, 1.64) -0.97 (-1.05, -0.89)

61
Median survival model (Laplace
regression) 0.99 (0.92, 1.07) -1.00 (-1.08, -0.92)
Sample size=10,000; 20.68% censored
Treatment of Outcome Variable
Mean
β0
(5% of
estimates,
95% of
estimates)
Mean
β1
(5% of
estimates,
95% of
estimates)
Analyzed as a continuous outcome
Log-transformed linear regression 0.76 (0.74, 0.78) -0.87 (-0.89, -0.85)
Log-transformed median
regression 0.77 (0.75, 0.80) -0.87 (-0.89, -0.84)
Analyzed as a count outcome
Poisson regression 1.31 (1.28, 1.33) -0.80 (-0.83, -0.76)
Negative binomial regression 1.30 (1.28, 1.33) -0.82 (-0.85, -0.79)
Median regression with jittered
outcome 0.52 (0.50, 0.55) -0.87 (-0.89, -0.84)
Analyzed as a survival outcome
Accelerated failure time model
(lognormal) 1.00 (0.98, 1.02) -1.00 (-1.02, -0.98)
Accelerated failure time model
(exponential) 1.56 (1.53, 1.58) -0.97 (-0.99, -0.94)
Median survival model (Laplace
regression) 0.99 (0.97, 1.02) -0.99 (-1.02, -0.97)

62
Table 5.3: Summary of analysis results with approximately 50% of the
observations censored. 1,000 replications with β0=1 and β1=-1.
Sample size=100; 49.98% censored
Treatment of Outcome Variable
Mean
β0
(5% of
estimates,
95% of
estimates)
Mean
β1
(5% of
estimates,
95% of
estimates)
Analyzed as a continuous outcome
Log-transformed linear regression 0.44 (0.18, 0.70) -0.78 (-1.05, -0.51)
Log-transformed median
regression 0.45 (0.15, 0.77) -0.78 (-1.12, -0.45)
Analyzed as a count outcome
Poisson regression 0.89 (0.60, 1.21) -0.72 (-1.13, -0.41)
Negative binomial regression 0.89 (0.60, 1.20) -0.74 (-1.09, -0.42)
Median regression with jittered
outcome 0.20 (-0.11, 0.52) -0.78 (-1.11, -0.44)
Analyzed as a survival outcome
Accelerated failure time model
(lognormal) 1.00 (0.75, 1.26) -1.00 (-1.25, -0.76)
Accelerated failure time model
(exponential) 1.51 (1.24, 1.80) -1.01 (-1.29, -0.73)
Median survival model (Laplace
regression) 0.98 (0.70, 1.29) -0.99 (-1.30, 0.70)
Sample size=1,000; 49.98% censored
Treatment of Outcome Variable
Mean
β0
(5% of
estimates,
95% of
estimates)
Mean
β1
(5% of
estimates,
95% of
estimates)
Analyzed as a continuous outcome
Log-transformed linear regression 0.43 (0.36, 0.51) -0.79 (-0.87, -0.71)
Log-transformed median
regression 0.45 (0.35, 0.54) -0.78 (-0.89, -0.68)
Analyzed as a count outcome
Poisson regression 0.92 (0.82, 1.02) -0.73 (-0.87, -0.61)
Negative binomial regression 0.92 (0.82, 1.02) -0.75 (-0.85, -0.64)
Median regression with jittered
outcome 0.20 (0.10, 0.30) -0.78 (-0.88, -0.68)
Analyzed as a survival outcome
Accelerated failure time model
(lognormal) 1.00 (0.93, 1.08) -1.00 (-1.08, -0.92)
Accelerated failure time model
(exponential) 1.52 (1.43, 1.60) -0.99 (-1.08, -0.90)
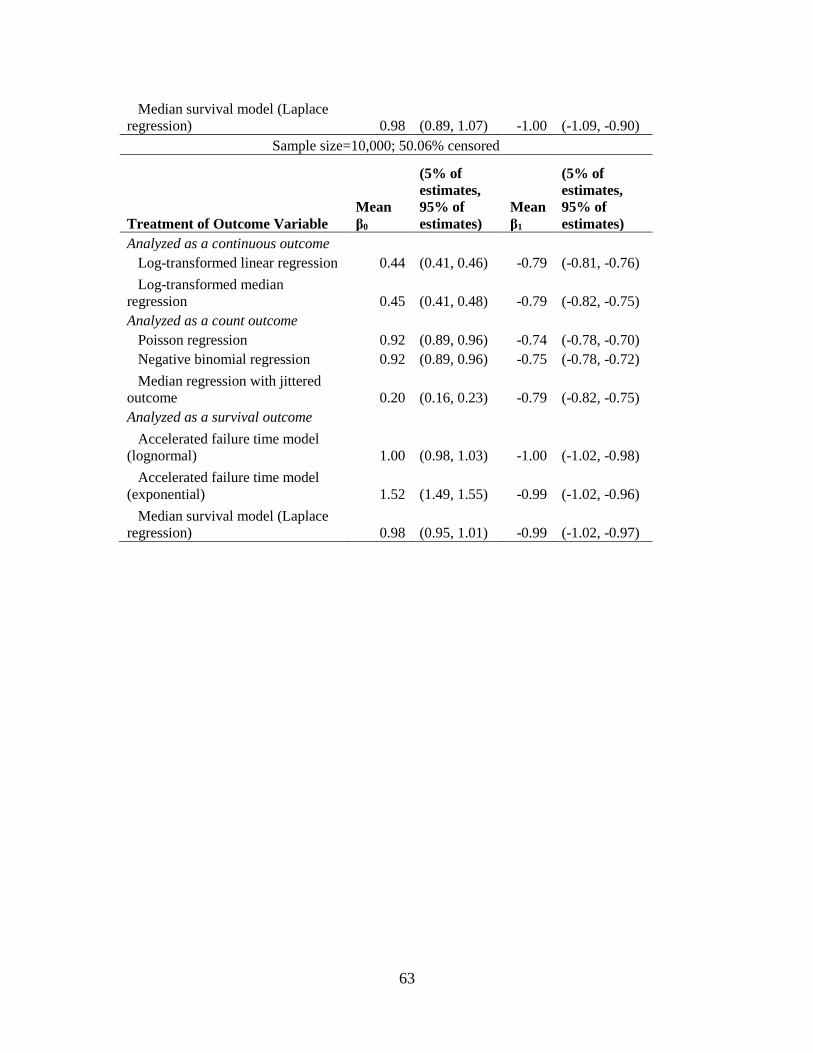
63
Median survival model (Laplace
regression) 0.98 (0.89, 1.07) -1.00 (-1.09, -0.90)
Sample size=10,000; 50.06% censored
Treatment of Outcome Variable
Mean
β0
(5% of
estimates,
95% of
estimates)
Mean
β1
(5% of
estimates,
95% of
estimates)
Analyzed as a continuous outcome
Log-transformed linear regression 0.44 (0.41, 0.46) -0.79 (-0.81, -0.76)
Log-transformed median
regression 0.45 (0.41, 0.48) -0.79 (-0.82, -0.75)
Analyzed as a count outcome
Poisson regression 0.92 (0.89, 0.96) -0.74 (-0.78, -0.70)
Negative binomial regression 0.92 (0.89, 0.96) -0.75 (-0.78, -0.72)
Median regression with jittered
outcome 0.20 (0.16, 0.23) -0.79 (-0.82, -0.75)
Analyzed as a survival outcome
Accelerated failure time model
(lognormal) 1.00 (0.98, 1.03) -1.00 (-1.02, -0.98)
Accelerated failure time model
(exponential) 1.52 (1.49, 1.55) -0.99 (-1.02, -0.96)
Median survival model (Laplace
regression) 0.98 (0.95, 1.01) -0.99 (-1.02, -0.97)
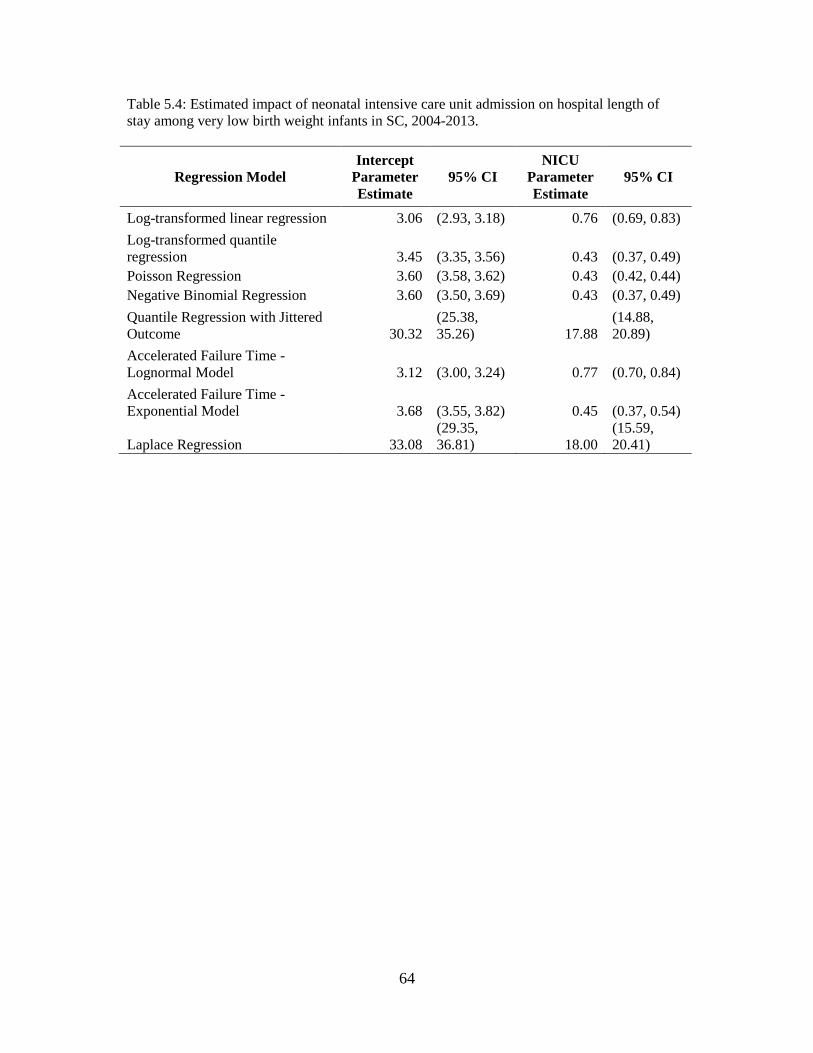
64
Table 5.4: Estimated impact of neonatal intensive care unit admission on hospital length of
stay among very low birth weight infants in SC, 2004-2013.
Regression Model
Intercept
Parameter
Estimate
95% CI
NICU
Parameter
Estimate
95% CI
Log-transformed linear regression 3.06 (2.93, 3.18) 0.76 (0.69, 0.83)
Log-transformed quantile
regression 3.45 (3.35, 3.56) 0.43 (0.37, 0.49)
Poisson Regression 3.60 (3.58, 3.62) 0.43 (0.42, 0.44)
Negative Binomial Regression 3.60 (3.50, 3.69) 0.43 (0.37, 0.49)
Quantile Regression with Jittered
Outcome 30.32
(25.38,
35.26) 17.88
(14.88,
20.89)
Accelerated Failure Time -
Lognormal Model 3.12 (3.00, 3.24) 0.77 (0.70, 0.84)
Accelerated Failure Time -
Exponential Model 3.68 (3.55, 3.82) 0.45 (0.37, 0.54)
Laplace Regression 33.08
(29.35,
36.81) 18.00
(15.59,
20.41)
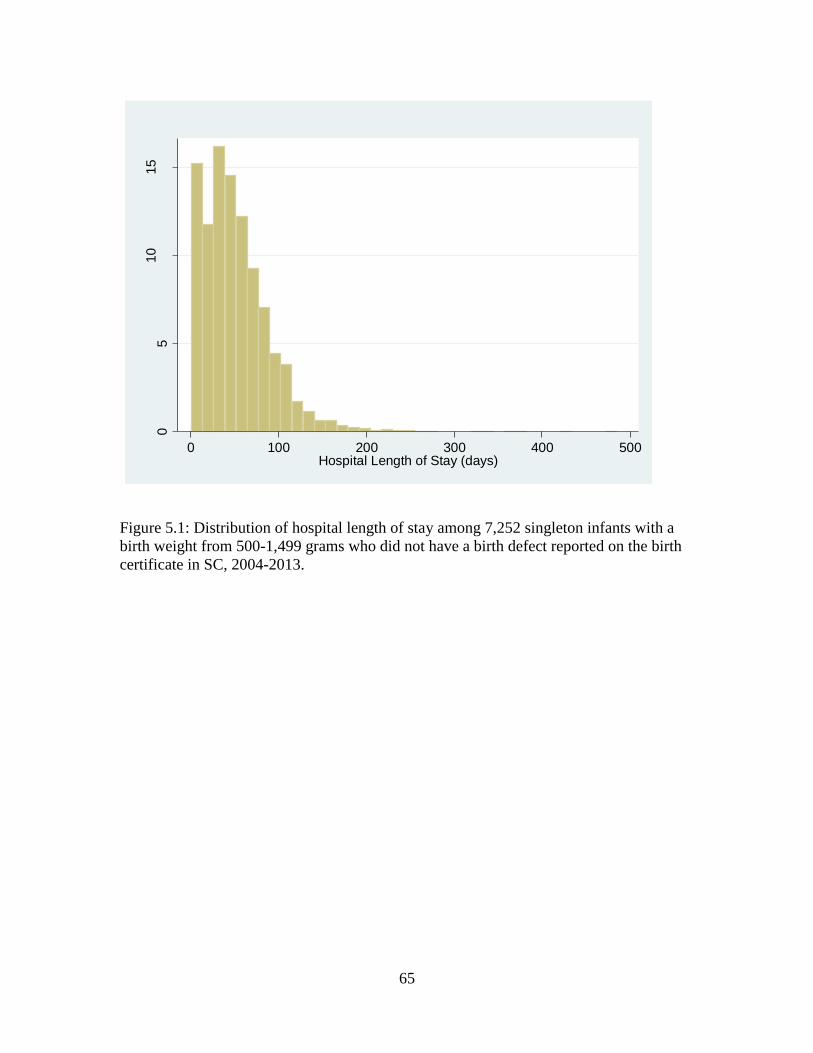
65
Figure 5.1: Distribution of hospital length of stay among 7,252 singleton infants with a
birth weight from 500-1,499 grams who did not have a birth defect reported on the birth
certificate in SC, 2004-2013.
05
10
15
Pe
rcent
0 100 200 300 400 500Hospital Length of Stay (days)
66
CHAPTER 6
DELIVERY HOSPITAL LEVEL OF CARE AND LENGTH OF STAY
AMONG VERY LOW BIRTH WEIGHT INFANTS IN SOUTH
CAROLINA3
3 Smith M.G., Fleischer N., Geraci M., Hale N., Hardin J. To be submitted to Maternal
and Child Health Journal
67
The purpose of this chapter is to examine hospital length of stay for infants in South
Carolina by delivery hospital level of care. As hospital length of stay is a highly skewed
distribution, Laplace regression will be used to analyze this outcome, as determined in
Chapter 5.
Introduction
Perinatal regionalization is a system of risk-appropriate care for women and infants. A
regionalized perinatal system is composed of contractual agreements between hospitals
and health departments to ensure high-risk pregnancies and neonates can be transferred to
facilities with the appropriate technology, sub-specialty staff, and experience to provide
optimal care62. Perinatal regionalization systems are often statewide and classify
hospitals into different levels of care based on factors such as specialist and sub-specialist
staffing, technological capability to provide advanced care, and capability to perform
complex cardiac surgeries on newborns. The overriding objective of perinatal
regionalization is to facilitate the appropriate transfer of women with high-risk
pregnancies to high-level hospitals for delivery regardless of their geographic location,
demographic factors, or ability to pay. Perinatal regionalization systems have been
shown to reduce the risk of neonatal mortality among very low birth weight (VLBW;
<1,500 grams) infants when high-risk pregnancies are delivered at the highest level
facilities8–13. However, not all US states have perinatal regionalization systems and there
are many differences in the way these systems operate among states that do have
systems14,19.
68
In South Carolina (SC), hospitals licensed to care for pregnant women and deliver
infants were divided into the following levels from 2004-2013: Level I, Level II, Level II
Enhanced (commonly referred to as Level IIE), Level III, and Regional Perinatal Centers
(RPCs). Level I hospitals are small community hospitals that provide care for
uncomplicated pregnancies expected to result in normal birth weight births (≥2,500
grams). Level II hospitals are larger hospitals with special care nurseries which provide
appropriate care for uncomplicated pregnancies expected to result in a normal birth
weight or some complicated pregnancies expected to result in a birth weight above 1,500
grams. Level IIE hospitals have special care nurseries with some additional capabilities
to care for infants with a birth weight down to 1,250 grams. Level III hospitals have 24-
hour coverage by both maternal-fetal medicine specialists and neonatologists as well as
neonatal intensive care units (NICUs) that are equipped to provide appropriate care to
normal or complex pregnancies and infants of any birth weight. RPCs are Level III
hospitals that accept high-risk pregnancies referred by other hospitals in their region,
provide transportation for these women and infants as necessary, and provide educational
programs to the other hospitals in their region. In SC, the criteria for hospitals to operate
at each level of care are codified in SC State Regulation 61-16 and approved by the SC
General Assembly55. In 2013 there were 17 Level I hospitals, 21 Level II hospitals, one
Level IIE hospital, and seven Level III hospitals. Five of the seven Level III hospital
were RPCs. These seven Level III hospitals delivered 35.8% of all live births occurring
in SC.
The majority of studies on perinatal regionalization have focused on the impact of
regionalization on neonatal mortality among VLBW infants as a proxy for high-risk
69
pregnancies8–13. Neonatal mortality is defined as the death of a live-born infant in the
first 27 days of life occurring in any location. While neonatal mortality is an outcome of
great importance, there is also a need for studies on other important outcomes32.
Outcomes that have a clearly defined financial impact on health care payers are of
particular relevance to the ongoing policy discussion around perinatal regionalization.
Recent studies have examined outcomes such as necrotizing enterocolitis, neurological
impairments, gastroschisis, and Medicaid reimbursement, comparing outcomes when
deliveries occur in hospitals with NICUs to when deliveries occur in smaller hospitals
and were transferred to hospitals with NICUs31,33,34.
To the best of our knowledge, only one study to date has assessed the association
of hospital of birth and hospital length of stay (HLS) in the context of a regionalized
system of perinatal care13. This study, published by Sanderson et al. in 2000, examined
the association between the level of care of the hospital of delivery and neonatal
mortality, HLS, and Medicaid reimbursement among Medicaid deliveries in SC. This
study evaluated length of stay as a continuous outcome using linear regression with a log-
transformed outcome to account for non-normality in the HLS variable. While this
approach was often used to analyze this type of outcome at the time of its publication, it
does have limitations that could result in biased estimates, especially if a high percentage
of the HLS outcomes are censored due to infant mortality or transfer to facilities not
included in the available data. A variety of additional analysis methods may be applied
in assessing HLS outcomes. Therefore, the most appropriate analytic method for
assessing the impact on HLS for VLBW infants delivered in Level III or higher hospital
warrants additional consideration.

70
A HLS may be appropriately considered a time-to-event outcome that can be
analyzed using survival analysis methods, including Cox proportional hazards regression,
accelerated failure time regression, and Laplace regression. Using a survival analysis
approach to HLS also has the advantage of being able to consider HLS values that do not
end in a discharge as censoring events. Examples of such censoring events could include
hospital stays that end in a transfer to a facility outside the study area or hospital stays
that end in death. A few studies have used survival analysis to examine HLS as an
outcome using both semi-parametric (Cox proportional hazards regression)44–46 and
parametric (accelerated failure time regression) models45,47,48. Some recent studies
applied quantile regression to model HLS either as a continuous variable49–52 or as count
data53. Finally, at least one study used Laplace regression to model HLS among the
elderly in Sweden as a survival outcome for quantiles of interest54. With HLS as a
survival outcome, Cox proportional hazards regression assesses the relative probability of
discharge (hazard) at a given time across levels of a predictor variable. While this is
useful information, we are most interested in the estimated absolute survival times across
levels of a predictor rather than the relative hazard. Using an accelerated failure time
regression analysis would provide the estimated mean time until hospital discharge across
levels of a predictor, but requires the assumption of an underlying distribution giving rise
to the length of stay data. If an incorrect underlying distribution is assumed, substantial
bias may be introduced. Modeling conditional quantiles, using quantile regression or
Laplace regression, provides the opportunity to examine the estimated time until
discharge across levels of a predictor for multiple points across the entire distribution of
71
the outcome, including the tails, not only the central part (e.g., the mean) without
specifying a distributional assumption.
This paper investigates the association between the delivery hospital level of care
(the exposure) and HLS (the outcome) at the left tail (5th and 10th centiles), the center
(25th, 50th and 75th centiles), and the right tail (90th and 95th centiles) of the outcome
distribution using Laplace regression. Using this method, we are able to explore: (1)
whether delivery in a Level III hospital is associated with increased or decreased median
HLS among VLBW infants born in SC as compared to delivery in Level I hospitals and
Level II hospitals, and (2) whether the strength and direction of the association is the
same depending on the length of hospital stays (conditionally based on the covariates
included). We hypothesize that delivery in a Level I or Level II hospital will result in
longer HLS, especially at the central and right-tailed centiles, as suggested by Sanderson
et al13. This analysis will help to inform whether well-regulated regionalized systems of
perinatal care are associated with reduced cost by way of shorter hospital stays among
VLBW infants in addition to reducing the risk of neonatal mortality, which has been
previously established8–13.
Methods
Population
This observational analysis utilizes a linked data file that includes data on live births and
delivery hospital stays among SC residents delivering in SC from 2004-2013. This
linked file includes data from the SC Certificate of Live Birth (2003 US Standard
revision) and hospital discharge uniform billing data for all live births occurring in a SC
72
hospital. The analyses presented in this manuscript are restricted to VLBW deliveries
occurring in SC hospitals. Live births with a birth weight less than 500 grams have been
removed from all analyses so that these results are comparable to other studies of
perinatal regionalization, as these births are generally considered to be non-viable and are
at high risk for in-hospital death no matter where they were delivered. Furthermore, data
are restricted to singleton deliveries without a birth defect indicated in birth certificate
data. For multivariable analyses, only complete records were included (a total of 179
records with missing pre-pregnancy height or weight and 1 record with a missing
maternal age were excluded). Figure 6.1 depicts the number of observations excluded
due to each criteria and the composition of the final analysis dataset (n=6,301).
A sensitivity analysis including deliveries weighing less than 500 grams was also
conducted.
Variables
The outcome of primary interest in these analyses is the HLS immediately following
delivery. This outcome variable is assessed from hospital discharge data. Some infants
were transferred directly from one hospital to another. In the event that an infant was
discharged from one hospital with a discharge disposition that indicated a transfer and the
same infant was admitted to a different hospital on the same date, these values were
summed and considered to be a single HLS. There were three endpoints in the data that
could result in the end of a hospital stay: a discharge disposition indicating that the infant
was discharged from the hospital; a discharge disposition indicating the infant was
transferred, but no record of admission to another hospital in SC; and a discharge
disposition indicating death or a date of death that coincides with end of a hospitalization.
73
The exposure of interest is the level of perinatal care of the hospital of delivery.
This three-level variable was coded as delivery in a Level III hospital (including RPCs as
Level III hospitals), delivery in a Level II hospital, or delivery in a Level I hospital. One
hospital in SC was licensed at the Level IIE designation for the years under study. This
hospital was licensed to deliver infants expected to weigh 1,250g or more. To prevent
identifying a single facility, the hospital level of care was recoded for VLBW infants
born in this hospital with infants weighing 1,250-1,499g (infants this facility was licensed
to deliver) being coded as being born in a Level III hospital and infants weighting less
than 1,250g (infants this facility was not licensed to deliver) being coded as being born in
a Level II facility.
The following variables are included as confounders, with hypothesized
associations with HLS illustrated in the directed acyclic graph in Figure 6.2: maternal age
(<18 years, 18-24 years, 25-34 years, ≥35 years; birth certificate data), maternal race
(non-Hispanic White, non-Hispanic Black, Hispanic, and other; birth certificate data),
initiation of prenatal care in the first trimester of pregnancy (yes, no; birth certificate
data), method of delivery payment (private insurance, Medicaid, self-pay or other; birth
certificate data), pre-pregnancy obesity status (obese [BMI≥30 kg/m2], overweight
[25≤BMI<30 kg/m2], or normal/underweight [BMI<25 kg/m2]; birth certificate data
[height and weight for birth data are self-reported]), gestational diabetes (yes, no; birth
certificate data), gestational hypertension or pre-eclampsia (yes, no; birth certificate
data), surfactant replacement therapy during pregnancy (yes, no; birth certificate data),
corticosteroid use during pregnancy (yes, no; birth certificate data), assisted ventilation
for newborn (yes, no; birth certificate data), and neonatal intensive care unit (NICU)
74
admission (yes, no; birth certificate data). A greater proportion of VLBW infants
delivering at Level III hospitals in the study population were admitted to NICUs (85.7%,
53.5%, and 50.9% of VLBW infants born in Level III, Level II, and Level I hospitals,
respectively) and infants admitted to NICUs tended to have longer HLS (a median of 55
days HLS among VLBW NICU admissions compared to a median of 33 days HLS
among VLBW non-NICU admissions). Therefore, an interaction between hospital level
of care and NICU admission was also assessed.
Gestational age at delivery was not included as a covariate because nearly all of
the live births included in this study were delivered preterm with over 80% of all
deliveries being early preterm (<32 weeks of gestation). However, a sensitivity analysis
including gestational age was conducted.
Statistical analysis
To explore the relationship between each covariate and the time until hospital discharge,
each characteristic hypothesized to be associated with the outcome was assessed by first
examining its pairwise association with HLS, while accounting for censoring due to
transfers without readmissions in SC and in-hospital deaths. The mean and median HLS
for each level of all covariates were considered. Bivariate associations were assessed
using log-rank tests.
Laplace regression was used to assess the difference in HLS in days among
VLBW infants delivered in Level I hospitals and Level II hospitals compared to VLBW
infants delivered in Level III hospitals (reference level). The association of delivery
hospital level of care was examined at the 5th, 10th, 25th, 50th, 75th, 90th, and 95th centiles

75
of the conditional distribution of HLS. We chose these centiles so as to study the central
part of the distribution (25th, 50th and 75th centiles) as well as the observations on the left
(5th and 10th) and right (90th and 95th) tails of the distribution.
The standard linear quantile regression (QR) model60 at probability level p is
defined as
𝑄(𝑝) = 𝛽0(𝑝) + 𝛽1(𝑝)𝑥1 + ⋯ + 𝛽𝑘(𝑝)𝑥𝑘,
where 𝑄(𝑝) denotes the pth quantile of the outcome conditional on the covariates 𝑥1, …,
𝑥𝑘 and 𝛽0(𝑝), …, 𝛽𝑘(𝑝) are regression coefficients specific to the quantile of interest. In
contrast to mean regression, the goal of QR is to predict specific quantiles of the
conditional distribution of the outcome (e.g., the median, 25th percentile, 95th percentile)
rather than the mean. Moreover, inference on conditional quantiles is robust to different
shapes of the error distribution, including skewed and heavy-tailed distributions, while
mean regression relies on normality assumptions. Laplace regression extends the
quantile regression model to censored data where the outcome under study is 𝑌 =
min(𝑇, 𝐶), where T is the time until hospital discharge and C is the time until censoring
due to transfer without readmission within SC or in-hospital death.
Additional details on quantile regression and Laplace regression are available
elsewhere60,61. All data management was conducted in SAS 9.3 (Cary, NC) and all
analyses were conducted in Stata 12 (College Station, TX). Laplace regression was
implemented in Stata using the Laplace package downloaded from
http://www.imm.ki.se/biostatistics/stata. Confidence intervals for Laplace regression

76
coefficients were calculated by bootstrap resampling with 200 replicates. The
significance level was set at 5%.
Results
The distribution of HLS among singleton VLBW infants born in SC hospitals without
reported congenital anomalies is highly skewed to the right (Figure 6.3). As a result of
this skewness, the mean HLS (56 days) is one week longer than the median HLS (49
days) (Table 6.1). Furthermore, there is substantial variability in HLS among VLBW
infants born in SC with a standard deviation of 36.7 days and first and third quartiles
from 32 days to 75 days.
Substantial differences are observed in HLS when stratifying by the two
censoring events: infant death and transfer without readmission (Table 6.1). Infants who
were discharged had substantially longer median HLS (48 days) than infants who died
prior to discharge (10 days) or infants who were transferred without readmission in SC (1
day). Overall, 10.7% of VLBW infants in the study population died prior to hospital
discharge and 3.6% were transferred without readmission in SC.
Bivariate Results
The mean and median lengths of hospital stay by maternal and infant characteristics are
presented in Table 6.2. Statistically significant bivariate associations were observed
between HLS and maternal age, delivery hospital level of care, gestational diabetes,
gestational hypertension, surfactant replacement therapy, assisted infant ventilation, and
NICU admission.
77
For the exposure, delivery hospital level of care, infants born at Level III hospitals
had a longer median HLS (51 days) than infants born in Level II hospitals (41.5 days),
and infants born in Level I hospitals (39 days). Kaplan Meier survival curves depicting
the time until hospital discharge, death, or transfer without readmission in SC is
displayed by hospital level of care in Figure 6.4.
Multivariable Results
Table 6.3 shows estimated 5th, 10th, 25th, 50th, 75th, 90th, and 95th Laplace regression
coefficients and their 95% confidence intervals. Each coefficient can be interpreted as the
difference between the HLS at the specified centile for the given hospital level of care
and HLS for deliveries in Level III hospital, conditional on the covariates. The crude
estimates of the association between hospital level of care and HLS indicate that VLBW
infants born in Level I and II hospitals have shorter HLS at or below the 50th centile when
compared to VLBW infants born in Level III hospitals. Meanwhile, a significant
difference in HLS between Level I or Level II hospitals and Level III hospitals was not
detected at or above the 90th centile. However, the estimated coefficients adjusted for
confounding differed somewhat from the crude estimates, especially at lower centiles.
After adjusting for all confounders as reported in Figure 6.2, VLBW infants born in
Levels I and II hospitals tended to have significantly shorter HLS than VLBW infants
born in Level III hospitals at lower quantiles of their respective HLS distributions (5th and
10th centiles). VLBW infants born in Level II hospitals also had significantly shorter HLS
than those born in Level III hospitals for central conditional quantiles (i.e., 25th, 50th and
75th), although there were no significant differences between conditional HLS in Level I
and Level III hospitals for the central conditional quantiles. There were no significant
78
differences between conditional HLS in Level I or Level II deliveries as compared to
deliveries in Level III hospitals at the 90th or 95th centiles. A test for interaction between
delivery hospital level of care and NICU admission was non-significant (p≥0.6 for all
quantiles modelled) and, therefore, this interaction was dropped from the final model.
Results from sensitivity analyses including VLBW infants with a birth weight less
than 500g and adjusting for gestational age at delivery were similar to the results
presented in Table 6.3.
Discussion
Overall, the delivery hospital level of care was associated with HLS among VLBW
infants born in SC at the shortest and central conditional quantiles. The shortest HLS
among VLBW infants delivered in Level I and Level II hospitals (5th and 10th centiles)
were shorter than the shortest HLS among VLBW infants delivered in Level III hospitals
(5th and 10th centiles). The 25th, 50th, and 75th centiles of HLS were shorter in Level II
hospitals than Level III hospitals, but there were no significant differences in HLS at
these quantiles between Level I and Level III hospitals. The 90th and 95th centiles of HLS
were not significantly different between Level I or Level II hospitals and Level III
hospitals.
There are a few possible explanations for these observed results. Because the
Perinatal Regionalization System in SC was consistent with the Guidelines for Perinatal
Care for the period under study62, with these guidelines codified in state regulation55,
infants born in Level I and Level II hospitals could be a mix of highest and lowest risk
VLBW infants. As shown previously, VLBW infants delivering in Level I and Level II
79
hospitals have greater neonatal mortality8–13, leading to a greater number of censored
observations, usually at short hospital lengths of stay. Level I and Level II hospitals also
consult with Level III hospitals before transferring mothers for delivery and sometimes
decide that the best care could be provided by the Level I or Level II hospital closer to the
patients’ residences. Therefore, Level I and Level II hospitals may be more likely to
keep lower risk VLBW deliveries. This is especially plausible for Level II hospitals, as
they often employ neonatologists and have better capacity to care for infants born near
1,500g than Level I hospitals. The premise that Level I and Level II hospitals have a
greater prevalence of highest and lowest risk VLBW deliveries is supported by the fact
that, when excluding multiple births and congenital anomalies, a greater proportion of
VLBW births in Level I and Level II hospitals are less than 500g (15.3% and 18.2%,
respectively) compared to Level III hospitals (8.6%), and a greater proportion of VLBW
births in Level II hospitals are also between 1,400g and 1,499g (13.7%) than in Level III
hospitals (11.0%; based on analysis of study data).
The results presented here differ from the results observed by Sanderson et al. for
VLBW births from 1991 to 1995 in SC, who found that mean HLS were shorter for
infants born in Level III hospitals13. However, there are some key differences between
our study and the study conducted by Sanderson et al. Sanderson et al’s study was
restricted to infants whose delivery was paid for by Medicaid. Moreover, they applied
linear regression to log-transformed HLS and results were then back-transformed to
predict mean HLS. While this approach is often used with linear regression to account
for skewed outcome variables, back-transformation of parameter estimates via
exponentiation can be misleading because exponentiated estimates are relative to the
80
geometric mean rather than the arithmetic mean as usually intended. Our study included
all live births and used a distribution-robust approach to examine the association of
delivery hospital level of care on the entire distribution of the outcome. This study adds
additional context to the work by Sanderson et al. in that these results indicate that the
association between delivery hospital level of care and HLS differs for the shortest
conditional HLS values, the central HLS values, and the longest HLS values.
Our study is subject to several limitations. First, as with any observational study,
there may be uncontrolled confounding that could change the nature of the observed
association if appropriately considered since only variables included on birth certificates
and hospital discharge data were available. An accurate measure for preterm labor was
not available, as it does not always result in a preterm birth and preterm births do not
always proceed from spontaneous preterm labor. While preterm labor is a potential
unmeasured confounder, adjusting for the variables associated with preterm labor, as
shown in Figure 6.2, results in no hypothesized confounding of the association between
delivery hospital level of care and HLS due to preterm labor. An additional limitation is
that most of the variables used in this study are based on birth certificate data, which have
been shown in SC to have low sensitivity for some variables when compared to medical
records; however, most of the variables used in this study have been shown to have
substantial or high sensitivity58. The quality of HLS assessment in SC hospital discharge
data is unknown.
81
Conclusions
This study demonstrates the additional insight that can be gained by utilizing statistical
methods that examine various points across the outcome distribution. Associations at the
highest and lowest conditional quantiles are often relevant to health policy discussions,
but may be lost because the appropriate statistical methods are not used as frequently.
Taking the results of this study into consideration, while HLS may be shorter in Level I
and Level II hospitals at lower quantiles of the HLS distribution, possibly leading to
lower costs, this does not outweigh the increased risk of neonatal mortality which has
been shown repeatedly in the literature. Cost savings obtained by the marginal reduction
in relatively short HLS values is insufficient justification for recommendations to
discontinue perinatal regionalization systems that have been associated with decreasing
neonatal deaths among some of the highest risk newborns. Therefore, continuing to
support well-regulated systems of perinatal regionalization remains important to ensure
optimal birth outcomes for high-risk pregnancies.

82
Table 6.1: Descriptive summary of length of hospital stay by censoring
variables among live births occurring in SC hospitals, 2004-2013.
Characteristic N Mean (SD*) Median
(Q1,
Q3**)
In-Hospital Infant Death
No 6098 54.1 (37.6) 48 (30, 74)
Yes 773 32.0 (49.5) 10 (1, 40)
Transfer without Readmission within
SC
No 6608 53.0 (39.2) 46 (27, 73)
Yes 263 16.5 (36.1) 1 (1, 20)
Overall 6871 51.6 (39.7) 45 (25, 71)
*Standard deviation
**First (Q1) and third (Q3) quartiles

83
Table 6.2: Descriptive summary of length of hospital stay by delivery characteristics
among live births occurring in SC hospitals, 2004-2013. Censored observations
excluded.
Characteristic N Mean (SD*) Median
(Q1,
Q3**)
P-
Value^
Maternal Age
<18 years 552 56.1 (36.5) 48
(33.5,
74)
0.02 18-24 years 2,109 53.5 (35.6) 47 (30, 71)
25-34 years 2,466 56.8 (37.1) 50 (32, 77)
≥35 years 707 59.2 (38.6) 53 (35, 78)
Hospital Level of Care
Level I 167 49.7 (38.0) 39 (23, 72)
<0.0001 Level II 546 47.1 (37.6) 41.5 (22, 65)
Level III 4,806 58.0 (36.5) 51 (34, 76)
Maternal Race/Ethnicity
Non-Hispanic White 1,965 55.8 (34.5) 51 (32, 75)
0.62 Non-Hispanic Black 3,444 55.7 (38.0) 48 (31, 75)
Hispanic/Other 426 56.8 (36.5) 51 (34, 74)
Prenatal Care in the First
Trimester
No 1,954 54.0 (36.1) 47 (30, 72) 0.21
Yes 3,881 56.7 (37.1) 50 (33, 76)
Method of Delivery Payment
Medicaid 3,635 55.7 (37.8) 48 (32, 74)
0.63 Private Insurance 1,468 56.5 (34.2) 51 (33, 76)
Self-Pay/Other 730 54.9 (36.4) 48.5 (31, 76)
Body Mass Index Classification
Underweight/Normal Weight 2,279 55.1 (36.5) 48 (32, 73)
0.36 Overweight 1,317 55.5 (37.0) 49 (31, 75)
Obese 2,079 57.0 (36.7) 51 (33, 76)
Gestational Diabetes
No 5,568 56.0 (37.0) 49 (32, 75) 0.002
Yes 267 51.1 (30.4) 47 (31, 66)
Gestational Hypertension
No 4,715 57.4 (36.7) 51 (33, 77) <0.0001
Yes 1,120 49.2 (36.0) 41
(27,
61.5)
Surfactant Replacement Therapy
No 4,490 52.8 (35.4) 46 (29, 70) <0.0001
Yes 1,338 66.1 (39.0) 61 (41, 84)
Antenatal Steroids
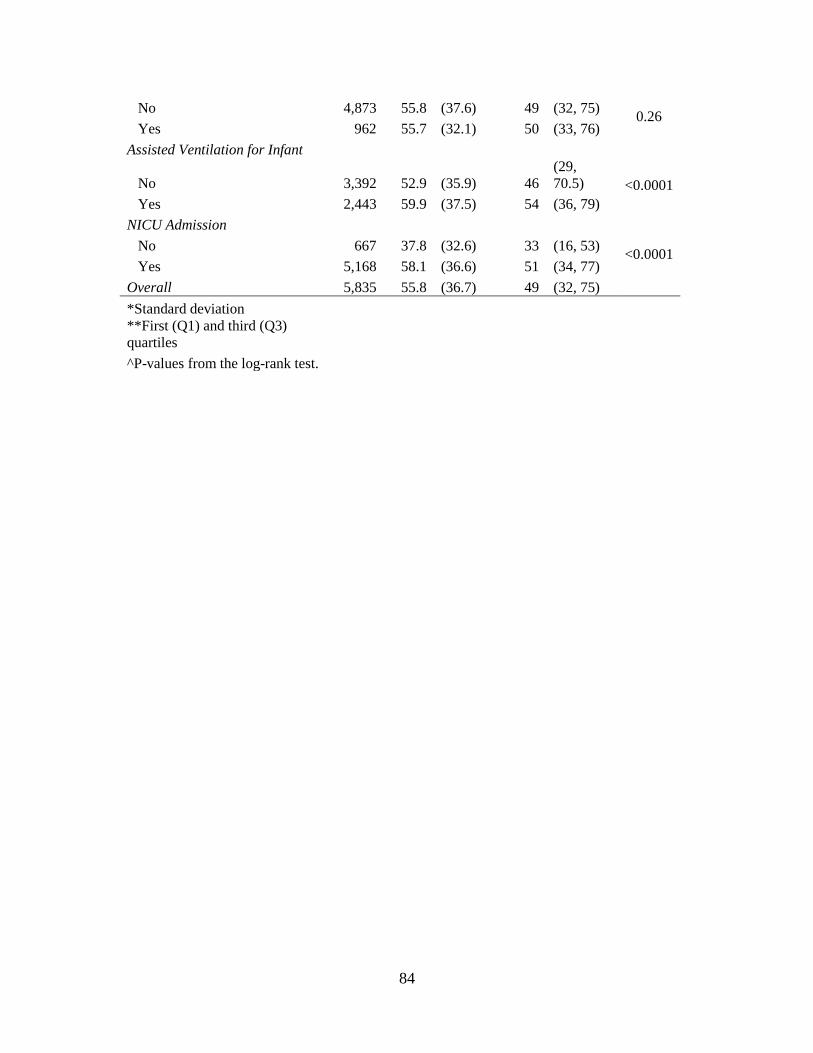
84
No 4,873 55.8 (37.6) 49 (32, 75) 0.26
Yes 962 55.7 (32.1) 50 (33, 76)
Assisted Ventilation for Infant
No 3,392 52.9 (35.9) 46
(29,
70.5) <0.0001
Yes 2,443 59.9 (37.5) 54 (36, 79)
NICU Admission
No 667 37.8 (32.6) 33 (16, 53) <0.0001
Yes 5,168 58.1 (36.6) 51 (34, 77)
Overall 5,835 55.8 (36.7) 49 (32, 75)
*Standard deviation
**First (Q1) and third (Q3)
quartiles
^P-values from the log-rank test.
85
Table 6.3: Adjusted difference in length of hospital stay by hospital level of care at
the 5th, 10th, 25th, 50th, 75th, 90th, and 95th quantiles. Results from Laplace regression
among live births in SC hospitals, 2004-2013 (n=6,301).
Hospital
Level of
Care
Crude Difference in
HLS (Days) 95% CI
Adjusted*
Difference in HLS
(Days)
95% CI
5th Percentile
Level I -11.8 (-14.9, -8.6) -10.5 (-17.6, -3.4)
Level II -13.0 (-14.5, -11.6) -11.1 (-15.3, -6.9)
Level III Ref.
Ref.
10th Percentile
Level I -16.8 (-24.0, -9.6) -8.7 (-13.3, -4.2)
Level II -19.9 (-21.9, -17.9) -9.5 (-12.9, -6.1)
Level III Ref.
Ref.
25th Percentile
Level I -8.0 (-14.6, -1.4) -3.7 (-8.5, 1.2)
Level II -11.8 (-14.3, -9.2) -7.8 (-10.9, -4.7)
Level III Ref.
Ref.
50th Percentile
Level I -9.0 (-14.7, -3.3) -4.8 (-10.8, 1.2)
Level II -9.7 (-12.4, -6.9) -6.9 (-9.5, -4.3)
Level III Ref.
Ref.
75th Percentile
Level I -0.8 (-11.3, 9.7) -3.8 (-14.4, 6.8)
Level II -9.0 (-14.1, -3.9) -5.7 (-11.0, -0.5)
Level III Ref.
Ref.
90th Percentile
Level I 7.6 (-10.1, 25.2) 9.7 (-11.0, 30.3)
Level II -1.6 (-7.5, 4.2) -1.3 (-11.2, 8.7)
Level III Ref.
Ref.
95th Percentile
Level I 16.6 (-7.5, 40.7) 8.1 (-12.4, 28.7)
Level II -3.5 (-16.7, 9.7) 1.8 (-11.9, 15.5)
Level III Ref. Ref.
*Laplace model adjusted for maternal age, maternal race/ethnicity, entry into prenatal care in
the first trimester, method of delivery payment, obesity status, gestational diabetes,
gestational hypertension, surfactant replacement therapy, antenatal steroids, and assisted
ventilation for the infant.
86
Figure 6.1: Sample size and exclusions for final set of deliveries included in analyses.
9,500 live births <1,500g with a hospital stay of at least one night
540 live births <500g
8,960 live births 500-1,499g with a hospital stay of at least one night
470 births occurring outside a
SC hospital
8,490 live births 500-1,500g with a SC hospital stay of at least one night
1,923 twins or higher order
multiples
6,567 singleton live births 500-1,500g with a SC hospital stay of at least one night
86 reported congenital
anomalies
6,481 singleton live births 500-1,500g with a SC hospital stay of at least one night
179 with missing values for
pre-pregnancy BMI, 1 missing
values for maternal age
6,301 singleton live births 500-1,499g with a SC hospital stay of at least one night
(219 hospital stays ending with a transfer without readmission in SC, 709 hospital stays ending with an in-hospital death, and 5,373 hospital stays ending with a discharge event)

87
Figure 6.2: Directed acyclic graph (DAG) for the relationship between level of perinatal care for the hospital of delivery and length of
hospital stay.
88
CHAPTER 7
CONCLUSIONS
The purpose of this chapter is to present overall conclusions in consideration of all
analyses conducted in this dissertation.
Summary
The perinatal regionalization system in SC seeks to provide a series of mechanisms by
which women with high-risk pregnancies can be transferred to a Level III hospital with a
NICU prior to delivery. Hospitals in SC are licensed by the state to provide perinatal
care at a certain level with seven hospitals licensed as Level III hospitals from 2004-
201355. This licensing structure has allowed SC to have a consistent perinatal
regionalization structure for decades, affording adequate sample size to study the impact
of this system in a small population such as VLBW births. This dissertation presents a
series of analyses to assess the impact of perinatal regionalization on birth outcomes of
interest among VLBW infants delivered in SC hospitals from 2004-2013. The birth
outcomes under study in this dissertation were neonatal mortality and HLS.
Chapter 4 of this dissertation assessed the association between delivery in a non-
Level III hospital and neonatal mortality while accounting for fetal deaths as censored
events. This study was based on 8,594 live births and fetal deaths occurring in SC
89
hospitals with a birth weight from 500 to 1,500 grams from 2004-2013. Among this
population, 6,726 observations were live births (of which 600 resulted in a neonatal
death) and 1,868 were fetal deaths. Marginal structural modelling was used to estimate
that VLBW infants delivered in a non-Level III hospital were at 1.81 times the risk of
neonatal mortality than VLBW infants delivered in a Level III hospital when accounting
for fetal deaths as censored observations (Table 4.3). This result is compared to a 1.62
fold increase in risk for VLBW infants delivered in a non-Level III hospital when fetal
deaths were not accounted for as censored observations. Thus, failing to account for
censoring due to fetal death resulted in an estimated risk of neonatal death that was
10.5% below the estimate when fetal deaths were considered censored observations.
Considering fetal deaths to be censored events for the neonatal mortality outcome
is important because fetal death is an outcome that can be caused by many of the risk
factors for neonatal death and also prevents an observation from being a neonatal death
(as shown in Figure 4.1). Therefore, the results of these analyses indicate that failing to
account for fetal deaths as censored events when examining the impact of perinatal
regionalization systems on neonatal mortality may underestimate the strength of the
association.
A birth outcome that may be of interest when examining the impact of many
potential interventions is HLS. This outcome is especially pertinent given the focus of
many health care systems on the Institute for Healthcare Improvement’s Triple Aim to
improve health, improve clinical care, and reduce cost59. However, there is a lack of a
consistent analysis strategy in the current literature for examining highly skewed
outcomes such as HLS. Some studies have analyzed HLS outcomes as continuous

90
variables using linear regression with a log-transformed outcome36–39 and using quantile
regression49–52. Other studies have analyzed HLS as a count outcome with Poisson or
negative binomial regression40–43 or quantile regression extended for count outcomes
using a process called jittering53. Still other studies have analyzed HLS as a time-to-
event (i.e., survival) outcome using Cox proportional hazards regression44–46, AFT
regression45,47,48, or Laplace regression54.
Chapter 5 of this dissertation sought to simulate highly skewed outcomes, similar
to HLS, and apply several of these analysis methods to determine which is the most
effective at correctly estimating the intercept and slope parameters in simple regression
models. The highly skewed outcome was simulated using a log-normal distribution and
separate log-normal distributions were used to censor a subset of the simulated outcomes.
Simulated datasets were generated 1,000 times for nine different scenarios. These
scenarios varied by sample size (100 observations, 1,000 observations, and 10,000
observations) and the prevalence of censoring (roughly 8% of all outcomes censored,
roughly 20% of all outcomes censored, and roughly 50% of all outcomes censored).
When assessing the results of the analyses of these simulated datasets, analyzing
the highly skewed outcome as a time-to-event variable consistently produced the most
accurate estimates. In particular, using an AFT regression model with the correct
underlying distribution specified (log-normal in this case) was the most efficient at
correctly estimating the parameters of interest, with Laplace regression also estimating
the parameters accurately but with slightly less efficiency in terms of observed standard
deviations of the estimates. However, using an AFT regression model with the incorrect
underlying distribution specified (exponential was specified in this case instead of log-
91
normal), the estimate of the intercept parameter was substantially biased while the
estimate of the slope parameter was slightly biased. Therefore, this chapter recommends
using Laplace regression to analyze highly skewed outcomes unless the underlying
distribution giving rise to the outcome is confidently known, in which case using an AFT
regression model with the correct distribution specified would be preferable.
Chapter 6 of this dissertation used Laplace regression to assess HLS for VLBW
infants born in Level I and Level II hospitals compared to infants born in Level III
hospitals for live births occurring in 2004-2013. Laplace regression was used based on
the results of Chapter 5 because the underlying distribution giving rise to HLS data
among VLBW infants born in SC hospitals from 2004-2013 was not confidently known.
An attractive function of Laplace regression is that it allows for the examination of the
association between HLS and hospital level of care across conditional quantiles of the
HLS distribution. The 5th, 10th, 25th, 50th, 75th, 90th, and 95th conditional centiles of HLS
were compared between Level I VLBW births and Level III VLBW births as well as
between Level II VLBW births and Level III VLBW births. This analysis included 6,301
infants born between 500 and 1,500 grams in SC hospitals from 2004-2013. Among
these deliveries, 5,373 ended with a hospital discharge, 709 ended with an in-hospital
death, and 219 ended with a transfer without readmission in SC.
The results of these analyses indicate that the 5th and 10th centiles of HLS among
VLBW infants delivered in Level I and Level II hospitals were shorter than those
delivered in Level III hospitals. Additionally, the 25th, 50th, and 75th centiles of HLS
among VLBW infants delivered in Level II hospitals were shorter than those delivered in
Level III hospitals. Finally, there was no significant difference in HLS between VLBW
92
infants delivered in Level I or Level II hospitals and VLBW infants delivered in Level III
hospitals for the 90th and 95th centiles. These results indicate that HLS is shorter among
VLBW infants born in non-Level III hospitals for shorter lengths of stay and that HLS is
shorter among VLBW infants born in Level II hospitals for central lengths of stay,
compared to VLBW infants born in Level III hospitals, but that no difference in HLS is
observed across levels of perinatal care for longer lengths of stay.
Overall, the results presented in Chapters 4-6 indicate that VLBW infants
delivered in non-Level III hospitals are at increased risk of neonatal death when
accounting for censoring due to fetal deaths, but that those delivered at non-Level III
facilities may have shorter HLS for relatively short or central HLS values. The cost
savings potentially realized by shorter HLS for relatively short or central HLS values do
not outweigh the substantial increase in neonatal mortality observed for VLBW infants
delivered in non-Level III hospitals in SC. Therefore, it is strongly recommended that SC
continue to support the statewide perinatal regionalization system and ensure that every
possible high-risk pregnancy deliver in a Level III hospital.
These results may also hold for other states with hospital levels of prenatal care
criteria outlined in state regulations and tied to hospital licensing. However, these results
could also be compared to similar results from other states with perinatal regionalizataion
systems that are not as strictly regulated to help assess the impact of state perinatal
regulations.
93
REFERENCES
1. Reidpath, D. D. & Allotey, P. Infant mortality rate as an indicator of population
health. J. Epidemiol. Community Health 57, 344–346 (2003).
2. Atrash, H. K., Johnson, K., Adams, M. (Mike), Cordero, J. F. & Howse, J.
Preconception Care for Improving Perinatal Outcomes: The Time to Act. Matern.
Child Health J. 10, 3–11 (2006).
3. Anderson, J. E., Ebrahim, S., Floyd, L. & Atrash, H. Prevalence of Risk Factors for
Adverse Pregnancy Outcomes During Pregnancy and the Preconception Period—
United States, 2002–2004. Matern. Child Health J. 10, 101–106 (2006).
4. NVSR. Deaths: Final Data for 2012. (2014).
5. Mf, M. & Tj, M. Behind international rankings of infant mortality: how the United
States compares with Europe. NCHS Data Brief 1–8 (2009).
6. Hirai, A. H. et al. Contributors to excess infant mortality in the U.S. South. Am. J.
Prev. Med. 46, 219–227 (2014).
7. Office of Public Health Statistics and Information Services. Infant Mortality and
Selected Birth Characteristics: 2013 South Carolina Residence Data. (South
Carolina Department of Health and Environmental Control, 2014).
8. Bode, M. M., O’shea, T. M., Metzguer, K. R. & Stiles, A. D. Perinatal
regionalization and neonatal mortality in North Carolina, 1968-1994. Am. J. Obstet.
Gynecol. 184, 1302–1307 (2001).
94
9. Cifuentes, J. et al. Mortality in low birth weight infants according to level of neonatal
care at hospital of birth. Pediatrics 109, 745–751 (2002).
10. Lasswell, S. M., Barfield, W. D., Rochat, R. W. & Blackmon, L. Perinatal
regionalization for very low-birth-weight and very preterm infants: a meta-analysis.
JAMA 304, 992–1000 (2010).
11. Lorch, S. A., Baiocchi, M., Ahlberg, C. E. & Small, D. S. The differential impact of
delivery hospital on the outcomes of premature infants. Pediatrics 130, 270–278
(2012).
12. Menard, M. K., Liu, Q., Holgren, E. A. & Sappenfield, W. M. Neonatal mortality for
very low birth weight deliveries in South Carolina by level of hospital perinatal
service. Am. J. Obstet. Gynecol. 179, 374–381 (1998).
13. Sanderson, M., Sappenfield, W. M., Jespersen, K. M., Liu, Q. & Baker, S. L.
Association between level of delivery hospital and neonatal outcomes among South
Carolina Medicaid recipients. Am. J. Obstet. Gynecol. 183, 1504–1511 (2000).
14. Nowakowski, L. et al. Assessment of state measures of risk-appropriate care for very
low birth weight infants and recommendations for enhancing regionalized state
systems. Matern. Child Health J. 16, 217–227 (2012).
15. Committee on Perinatal Health. Toward Improving the Outcome of Pregnancy:
Recommendations for the Regional Development of Maternal and Perinatal Health
Services. (The National Foundation - March of Dimes, 1976).
16. Guidelines for Perinatal Care, 7th Edition. (American Academy of Pediatrics, 2012).
17. Phibbs, C. S. et al. Level and volume of neonatal intensive care and mortality in
very-low-birth-weight infants. N. Engl. J. Med. 356, 2165–2175 (2007).

95
18. McCormick, M. C., Shapiro, S. & Starfield, B. H. The regionalization of perinatal
services. Summary of the evaluation of a national demonstration program. JAMA
253, 799–804 (1985).
19. Blackmon, L. R., Barfield, W. D. & Stark, A. R. Hospital neonatal services in the
United States: variation in definitions, criteria, and regulatory status, 2008. J.
Perinatol. Off. J. Calif. Perinat. Assoc. 29, 788–794 (2009).
20. Lorch, S. A., Maheshwari, P. & Even-Shoshan, O. The impact of certificate of need
programs on neonatal intensive care units. J. Perinatol. Off. J. Calif. Perinat. Assoc.
32, 39–44 (2012).
21. Bartels, D. B., Wypij, D., Wenzlaff, P., Dammann, O. & Poets, C. F. Hospital
volume and neonatal mortality among very low birth weight infants. Pediatrics 117,
2206–2214 (2006).
22. Chung, J. H. et al. Examining the effect of hospital-level factors on mortality of very
low birth weight infants using multilevel modeling. J. Perinatol. Off. J. Calif.
Perinat. Assoc. 31, 770–775 (2011).
23. Chung, J. H. et al. The effect of neonatal intensive care level and hospital volume on
mortality of very low birth weight infants. Med. Care 48, 635–644 (2010).
24. Gould, J. B., Marks, A. R. & Chavez, G. Expansion of community-based perinatal
care in California. J. Perinatol. Off. J. Calif. Perinat. Assoc. 22, 630–640 (2002).
25. Mayfield, J. A., Rosenblatt, R. A., Baldwin, L. M., Chu, J. & Logerfo, J. P. The
relation of obstetrical volume and nursery level to perinatal mortality. Am. J. Public
Health 80, 819–823 (1990).

96
26. Moster, D., Lie, R. T. & Markestad, T. Neonatal mortality rates in communities with
small maternity units compared with those having larger maternity units. BJOG Int.
J. Obstet. Gynaecol. 108, 904–909 (2001).
27. Watson, S. I. et al. The effects of designation and volume of neonatal care on
mortality and morbidity outcomes of very preterm infants in England: retrospective
population-based cohort study. BMJ Open 4, e004856 (2014).
28. Wehby, G. L., Ullrich, F. & Xie, Y. Very low birth weight hospital volume and
mortality: an instrumental variables approach. Med. Care 50, 714–721 (2012).
29. Profit, J., Wise, P. H. & Lee, H. C. Consequences of the affordable care act for sick
newborns. Pediatrics 134, e1284–1286 (2014).
30. Lorch, S. A. Ensuring access to the appropriate health care professionals:
regionalization and centralization of care in a new era of health care financing and
delivery. JAMA Pediatr. 169, 11–12 (2015).
31. Kastenberg, Z. J., Lee, H. C., Profit, J., Gould, J. B. & Sylvester, K. G. Effect of
deregionalized care on mortality in very low-birth-weight infants with necrotizing
enterocolitis. JAMA Pediatr. 169, 26–32 (2015).
32. Hulsey, T. The new system of perinatal care. J. Perinatol. Off. J. Calif. Perinat.
Assoc. 22, 628–629 (2002).
33. Kaneko, M. et al. Perinatal morbidity and mortality for extremely low-birthweight
infants: A population-based study of regionalized maternal and neonatal transport. J.
Obstet. Gynaecol. Res. (2015). doi:10.1111/jog.12686
34. Savoie, K. B. et al. Improving gastroschisis outcomes: does birth place matter? J.
Pediatr. Surg. 49, 1771–1775 (2014).
97
35. Kim, E. W. et al. Telemedicine collaboration improves perinatal regionalization and
lowers statewide infant mortality. J. Perinatol. Off. J. Calif. Perinat. Assoc. 33, 725–
730 (2013).
36. Chertow, G. M., Burdick, E., Honour, M., Bonventre, J. V. & Bates, D. W. Acute
Kidney Injury, Mortality, Length of Stay, and Costs in Hospitalized Patients. J. Am.
Soc. Nephrol. 16, 3365–3370 (2005).
37. Partovi, S. N., Nelson, B. K., Bryan, E. D. & Walsh, M. J. Faculty Triage Shortens
Emergency Department Length of Stay. Acad. Emerg. Med. 8, 990–995 (2001).
38. Knaus, W. A., Wagner, D. P., Zimmerman, J. E. & Draper, E. A. Variations in
Mortality and Length of Stay in Intensive Care Units. Ann. Intern. Med. 118, 753–
761 (1993).
39. Herrmann FR, Safran C, Levkoff SE & Minaker KL. SErum albumin level on
admission as a predictor of death, length of stay, and readmission. Arch. Intern. Med.
152, 125–130 (1992).
40. Murrell, Z., Haukoos, J. S., Putnam, B. & Klein, S. R. The Effect of Older Blood on
Mortality, Need for ICU Care, and the Length of ICU Stay After Major Trauma. Am.
Surg. 71, 781–785 (2005).
41. Wang, K., Yau, K. K. W. & Lee, A. H. A hierarchical Poisson mixture regression
model to analyse maternity length of hospital stay. Stat. Med. 21, 3639–3654 (2002).
42. Yau, K. K. W., Wang, K. & Lee, A. H. Zero-Inflated Negative Binomial Mixed
Regression Modeling of Over-Dispersed Count Data with Extra Zeros. Biom. J. 45,
437–452 (2003).

98
43. Korvenranta, E. et al. Differences in the length of initial hospital stay in very preterm
infants. Acta Paediatr. Oslo Nor. 1992 96, 1416–1420 (2007).
44. van Kleef, E. et al. Excess length of stay and mortality due to Clostridium difficile
infection: a multi-state modelling approach. J. Hosp. Infect. 88, 213–217 (2014).
45. Ravangard, R. et al. Comparison of the results of Cox proportional hazards model
and parametric models in the study of length of stay in a tertiary teaching hospital in
Tehran, Iran. Acta Med. Iran. 49, 650–658 (2011).
46. Munthali, T., Jacobs, C., Sitali, L., Dambe, R. & Michelo, C. Mortality and morbidity
patterns in under-five children with severe acute malnutrition (SAM) in Zambia: a
five-year retrospective review of hospital-based records (2009-2013). Arch. Public
Health Arch. Belg. Santé Publique 73, 23 (2015).
47. Ounpraseuth, S. et al. Time trends and payer differences in lengths of initial
hospitalization for preterm infants, Arkansas, 2004 to 2010. Am. J. Perinatol. 32, 33–
42 (2015).
48. Beekmann, S. E., Diekema, D. J., Chapin, K. C. & Doern, G. V. Effects of rapid
detection of bloodstream infections on length of hospitalization and hospital charges.
J. Clin. Microbiol. 41, 3119–3125 (2003).
49. Blumstein, H., Singleton, A. H., Suttenfield, C. W. & Hiestand, B. C. Weekday
psychiatry faculty rounds on emergency department psychiatric patients reduces
length of stay. Acad. Emerg. Med. Off. J. Soc. Acad. Emerg. Med. 20, 498–502
(2013).

99
50. Cheah, A. L. Y. et al. Enterococcal bacteraemia: factors influencing mortality, length
of stay and costs of hospitalization. Clin. Microbiol. Infect. Off. Publ. Eur. Soc. Clin.
Microbiol. Infect. Dis. 19, E181–189 (2013).
51. Siciliani, L., Sivey, P. & Street, A. Differences in length of stay for hip replacement
between public hospitals, specialised treatment centres and private providers:
selection or efficiency? Health Econ. 22, 234–242 (2013).
52. Hauck, K. & Hollingsworth, B. The impact of severe obesity on hospital length of
stay. Med. Care 48, 335–340 (2010).
53. Winkelmann, R. Reforming health care: evidence from quantile regressions for
counts. J. Health Econ. 25, 131–145 (2006).
54. Schön, P., Lagergren, M. & Kåreholt, I. Rapid decrease in length of stay in
institutional care for older people in Sweden between 2006 and 2012: results from a
population-based study. Health Soc. Care Community (2015). doi:10.1111/hsc.12237
55. Department of Health and Environmental Control: Minimum Standards for Licensing
Hospitals and Institutional General Infirmaries. Perinatal Services Chapter 61-16,
540–547 (2012).
56. Rothman, K. J., Greenland, S. & Lash, T. L. Modern Epidemiology. (Lippincott
Williams & Wilkins, 2008).
57. Miguel A. Hernan & James M. Robins. Causal Inference. (Chapman & Hall/CRC,
forthcoming, 2015).
58. Martin, J. A. et al. Assessing the quality of medical and health data from the 2003
birth certificate revision: Results from two states. (National Center for Health
Statistics, 2013).

100
59. Berwick, D. M., Nolan, T. W. & Whittington, J. The triple aim: care, health, and cost.
Health Aff. Proj. Hope 27, 759–769 (2008).
60. Koenker, R. Quantile Regression. (Cambridge University Press, 2005).
61. Bottai, M. & Zhang, J. Laplace regression with censored data. Biom. J. 52, 487–503
(2010).
62. Guidelines for Perinatal Care, 7th Edition. (2012).