examining drivers of consumer returns in e … drivers of consumer returns in e-tailing using real...
TRANSCRIPT

Examining Drivers of Consumer Returns in E-Tailing using Real Shop Data
Björn Asdecker University of Bamberg
David Karl University of Bamberg
Eric Sucky University of Bamberg
Abstract Returns management – an important component of
supply chain management – is a key aspect of online retailers’ business models. Despite increasing interest in this issue, few studies have published empirical results on the drivers of consumer returns in e-tailing. Because this knowledge is essential to enabling better decisions about return flows, we explored an extensive dataset from an online apparel retailer using linear and logistic regression models. This approach distinguishes our study from other empirical work, which is usually based on survey methods. Before the data analysis, previously untested hypotheses were formulated using established theories and anecdotal information. 1. Introduction and motivation
The impact of digitization is particularly significant in retailing. In today’s retailing world, more and more people shop online. This process can be quantified. In the US, for instance, e-commerce revenues more than quadrupled between 2004 and 2014, increasing from 72.7 to 298.6 billion dollars [1]. Most of this growth can be attributed to the cannibalization of other distribution channels, particularly traditional brick-and-mortar retailing. This trend will continue for two main reasons:
1. In contrast to traditional stationary merchants, online retailers (known as e-tailers) do not face shelf space limitations. As a result, online businesses can offer an almost unlimited variety of products, which is becoming more important and valuable in a world in which customer needs are increasingly diverse.
2. Historically, two of the major advantages of brick-and-mortar retailing have been immediate product availability and the opportunity to provide customers with assistance from well-trained employees. However, because logistics service providers can now offer same-day services and information technologies can provide unprecedented customer relationship management capabilities, the
previous selling advantages of traditional retailers have been eroded.
E-tailing fundamentally influences retailers’ business models. First, as mentioned above, distribution channels are changing. Moreover, customer relationships, core activities and cost structures are changing as a result of digitization. While e-tailing clearly offers numerous advantages, there is one major disadvantage: supply and demand are generally geographically separated. Therefore, consumers are unable to touch and try out products before purchase, which leads to higher consumer returns. Thus, returns management – as one of eight major supply chain management processes [2] – is a key activity in e-tailing. It is becoming increasingly important as more people shop online and are more likely to return their purchases.
From a business perspective, consumer returns are a major cost driver and represent a threat to profitability. Stock et al. (2006) estimate such expenditures at $ 30-35 per return [3]. Prior research has shown that returns rates may exceed 60 % for e-commerce fashion retailers [4]. However, it should be noted that e-tailers use different types of returns rates [5]. Asdecker (2015) distinguishes between the α-returns rate and the β-returns rate:
The α-returns rate is the number of returned shipments in relation to the total number of outbound shipments. In contrast, the β-returns rate is the number of returned items in relation to the number of shipped items.
These two key performance indicators may deviate substantially, as the following example illustrates. Imagine three shipments: the first one comprises three articles, of which two are returned; the second one, four articles, of which one is returned; and the third one, a single article that the customer keeps. In this example, the α-returns rate equals 2/3 = 66.7 percent, whereas the β-returns rate equals 3/8 = 37.5 percent.
From a logistical point of view, the α-returns rate is a valuable piece of information for predicting the number of parcels that must be handled. The β-returns
4192
Proceedings of the 50th Hawaii International Conference on System Sciences | 2017
URI: http://hdl.handle.net/10125/41667ISBN: 978-0-9981331-0-2CC-BY-NC-ND
rate is more valuable to marketing and sales because it helps decision makers to evaluate distribution success.
Asdecker (2015) presents a circular model of the sales and returns process, which reveals a disproportionate relationship between the rate of returns and the associated costs [5]. For this reason, many e-tailers emphasize preventive returns management measures as a way of reducing the volume of products sent back. Stock (2009) notes that “[…] the best way of optimizing the product returns process is to not have returns at all […]” [6].
Avoiding returns before they occur requires knowledge of the drivers affecting the returns rate. These drivers may also help retailers to forecast the volume of returned products, which is essential to planning an efficient physical return process. Toktay et al. (2004) indicate that: “[…] there is little research on identifying factors that significantly influence return flow characteristics. Developing a good understanding […] would enable better decision making for influencing return flows” [7]. Although this call for research was issued more than a decade ago, little progress has been made on this topic.
We therefore address the following research-guiding question:
Which drivers influence the flow of returns in e-tailing and to what extent?
The nature of online shopping generates large amounts of data, which e-tailers could profitably analyze using sophisticated big data analytics. To address the research question above, we use actual order and returns data from an online apparel retailer. This approach distinguishes our study from other empirical work, which is usually based on survey methods.
The remainder of this article is structured as follows: the next section provides an overview of the relevant literature and develops the hypotheses to be tested. Then, we introduce the chosen methodology. Next, we present the findings of the empirical models. Finally, we offer a conclusion and an outlook for future research. 2. Selected literature review and development of hypotheses
Interest in the issues of consumer returns and returns management has grown over time, leading to an increase in publications on the subject [6]. This selective literature review focuses on conceptual/theoretical and empirical contributions, allowing us to deduce the hypotheses to be tested.
E-tailers can manage their customers’ expectations by providing detailed product information, high-resolution product photography, videos, and/or balanced customer reviews. However, this addresses only part of the problem. There is also a psychological dimension to returns, which can be explained using the post-purchase dissonance (PPD) theory [8, 9]. Festinger (1957) describes cognitive dissonance as an uncomfortable state of mind that one experiences after choosing among a set of alternatives, each of which has both positive and negative attributes [10]. Cognitive dissonance theory implies that individuals try to maintain a consistent set of beliefs. Any deviation from this consistency causes psychological tension, such as anxiety or uncertainty. Inconsistency may originate from the positive attributes of the rejected alternatives or the negative attributes of the chosen alternative. The theory also holds that people attempt to alleviate these negative psychological states. Lee (2015) notes that “[…] consumers increasingly use product returns to cope with PPD over other actions identified in the literature” [8]. Thus, with regard to online shopping, PPD theory suggests that consumers tend to order more products to eliminate mental discomfort resulting from the rejection of alternatives and, hence, return more to reduce dissonant tension resulting from the chosen alternatives. We therefore assume that additionally ordered items have a positive effect on the returns rate.
H1.1: There is a positive relationship between the number of additional items and the α-/β-returns rate of an order.
The argument above is particularly true for so-called “multiple-item orders”. In these cases, customers purchase multiple items in different styles, sizes, or colors because they are uncertain about which article will best meet their expectations. In the end, the majority of articles are sent back. This phenomenon has been anecdotally reported by several practitioner-oriented outlets: “Paula Cuneo […] recently ordered 10 pairs of corduroy pants in varying sizes and colors […], only to return seven of them. Ms. Cuneo is shopping online for Christmas gifts this year, ordering coats and shoes in a range of sizes and colors. She will let her four children choose the items they want—and return the rest” [11]. Therefore, we specifically hypothesize as follows:
H1.2a: There is a positive relationship between the number of multiple-items regarding size (i.e., same style and same color) and the α-/β-returns rate of an order.
H1.2b: There is a positive relationship between the number of multiple-items regarding color (i.e., same style and same size) and the α-/β-returns rate of an order.
4193

H1.2c: There is a positive relationship between the number of multiple-items regarding style (i.e., same color and same size) and the α-/β-returns rate of an order.
Utility theory suggests that consumers decide to order online when the associated utility exceeds the utility of not ordering [12]. Therefore, the utility of ordering is positively influenced by the customer’s expectations of the product and negatively influenced by the attached uncertainty [13, 14]. To reduce the customer’s perceived risk, many e-tailers offer liberal returns policies that can be considered as insurance against negative experiences [15, 16]. Actively advertising these liberal policies decreases a consumer’s uncertainty, thus increasing his or her overall likelihood of placing an order [17, 18]. However, because customers have only imperfect information about a product’s performance prior to receiving it, these liberal policies also lead to more products being returned when customer expectations are not met. According to Zeithaml et al. (1990), a product’s price can influence a customer’s expectations [19]. Teboul (1991) notes that price determines the level of quality a customer demands [20]. In a recent interview, Mayuki Chou, founder of the Taiwanese fashion e-tailer W-style, notes that consumers have lower expectations of lower-priced items and develop a higher tolerance for disappointment [21]. Accordingly, Hess and Mayhew (1997) argue, “[…] that consumers will be less likely to accept a poor fit as the item becomes more expensive” [22]. They use data from an apparel marketer and find that price is significantly positively correlated with the returns rate. Therefore, we also hypothesize that higher prices lead to higher returns rates.
H2: There is a positive relationship between the mean item price and the α-/β-returns rate of an order.
From an information processing perspective, a customer’s return decision is a mixed one. Lynch and Srull (1982) define a mixed decision as a choice in which some information is physically present, while some is retrieved from memory [23]. Consequently, consumers base their return decision on (1) the newly acquired information after delivery (e.g., testing product performance, other consumer opinions) and (2) the accessible and available information from the pre-order phase. Bechwati and Siegal (2005) show that the number of positive cognitive responses elicited during the pre-order phase strongly determines the ability to defend against disconfirming information that can trigger returns. In other words, e-tailers that want to reduce returns should avoid measures that lead to their customers making careless and hurried order decisions. However, many firms engage in marketing that
encourages the exact opposite behavior by targeting impulse buyers: “Marketers often announce special offers for limited periods of time […]. Our findings suggest that this approach results in high product returns because under these circumstances, customers have little opportunity to generate cognitive responses in favor of the chosen alternative […]” [24]. Bellenger et al. (1978) show that fashion items are frequently purchased on impulse [25]. Dawson and Kim (2009) identify coupons as an external impulse trigger on apparel websites [26]. Therefore, redeeming coupon codes while shopping for apparel on the internet will most likely increase the returns rate.
However, it should be noted that coupons also reduce prices, which lowers expectations and generates a higher tolerance against negative experiences [22]. Consequently, the negative price effect compensates for the positive impulse buying effect with an increasing relative coupon code value. We consequently hypothesize the following:
H3.1: The use of coupons codes has a positive effect on the α-/β-returns rate of an order.
H3.2: There is a negative relationship between the relative value of a coupon and the α-/β-returns rate of an order.
Another external impulse trigger is the offer of free gifts with purchase. Some e-tailers require customers to return any free gift received with a product, while others do not. Assuming that the gift must also be returned, the gift increases the value of the actual ordered product. If consumers may keep the gift, it takes on a psychological dimension. The idea of gifts is based on the concept of reciprocity [27]. It is part of social etiquette that we return not only favors but also gifts. In some cultures, the counter-gift must even exceed the value of the initial gift [28]. Therefore, accepting a gift leads to informal accountability, and the person who receives it is obliged to give back [29]. Thus, keeping the gift without buying something in return leads to psychological pressure, which increases return hassles for the consumer. Davis et al. (1998) show that consumers only choose to return if the purchase price minus transaction costs (e.g., restocking fees, any type of hassle) exceeds the remaining product value [30, 31]. Ceteris paribus, the first option increases the remaining product value, whereas the second option increases transaction costs because it introduces more hassle. Thus, we strongly believe that free gifts reduce the returns rate.
H4: Adding free gifts to an order has a negative effect on the α-/β-returns rate of an order.
Another factor that may enhance careless and hurried order decisions is the payment option. A recent Nielsen (2016) report shows that payment practices vary considerably around the world [32]. In North
4194
America, consumers prefer credit cards over digital payment systems (e.g., PayPal, Alipay) and store-specific gift cards. In India, cash on delivery is the most popular option, followed by debit cards and direct debit. In contrast, the majority (58 %) of German online shoppers, representing the largest e-commerce market in central Europe, prefer to pay by invoice [33]. In other words, customers receive a bill together with the ordered goods that generally needs to be settled within 14 days, which puts the merchant at risk of not receiving payment. While different regions have their preferred payment terms, we may distinguish between pre-delivery options (e.g., digital payment systems, credit cards, cash on delivery) and post-delivery alternatives (e.g., invoice). From the consumer’s perspective, post-payment provides a seamless shopping experience that is both convenient and risk-free. However, several practitioners suggest that it potentially leads to a “[…] higher percentage of returned goods […]” [34] because uncertain, uninformed customers with a high likelihood to return prefer such risk-free payment options. We therefore believe that post-delivery payment options increase the returns rate.
H5: Post-delivery payment options such as invoicing have a positive effect on the α-/β-returns rate of an order.
E-tailers can prevent their customers from forming excessive product expectations and stimulate cognitive processes by providing detailed product descriptions, high-resolution images, videos, and/or balanced customer reviews to help facilitate thoughtful and deliberate order decisions. While these measures may avoid some returns, others are simply inevitable [4]. Each item carries a return probability that is unknown to a retailer prior to its listing. However, as products are sold, e-tailers learn about this inherent returns rate. Thus, we conclude that the aggregated item returns rate observed in the past positively influences the likelihood to return:
H6: There is a positive relationship between the ordered items’ aggregated historical β-returns rate and the α-/β-returns rate of an order.
Finally, we consider general consumer behavior to be a factor. Some media outlets have reported on returnaholics or serial returners. These people have a tendency to abuse liberal policies. As a result, some merchants have changed their policies to prevent damage from this type of behavior [35]. Others have used technology to track down serial returners. An Associated Press report shows that retailers such as Home Depot, Victoria’s Secret, Best Buy, and Nike create customer return profiles [36]. If a customer’s return activity is too high or suggests a questionable pattern, he or she may be banned from future returns.
These approaches are built on the common-sense notion that past behavior predicts future behavior. In other words, returning becomes a habit. This phenomenon is well documented in psychology. Ouellette/Wood (1998) provide a meta-analytic synthesis and show that repeatedly performed tasks in stable contexts become habitual as conscious information processing becomes automatic. In unstable contexts, past behavior contributes to intentions, which guide future behavior. In the latter case, the effect is weaker but still observable [37]. Aarts et al. (1998) examine travel mode choices and come to similar conclusions: “[…] any type of repetitive behavior requires less and less mental effort and conscious attention, and may therefore eventually become habitual. Consequently, these behaviors may no longer be guided by deliberately formed intentions, but are accompanied by a rather limited process of decision making” [38]. The conditions surrounding a return decision may be a mixture of stable and unstable contexts, as the items to be evaluated change, while the process itself remains the same. We therefore hypothesize that past return behavior positively influences the returns rate:
H7: There is a positive relationship between the customer’s historical β-returns rate and the α-/β-returns rate of an order. 3. Methodology
The hypotheses derived above are tested using comprehensive data from a German apparel e-tailer that operates exclusively online and specifically targets women. The company requested confidentiality concerning its name. On its website, the merchant employs several stimuli that increase the consumers’ likelihood of placing an order, such as coupon codes, free gifts, and invoicing as a post-delivery payment option. The company offers free returns within 14 days after delivery with no questions asked [39]. The database contains sale and returns information over 18 months (from April 2014 to December 2015). During that time, the e-tailer served almost 300,000 customers who chose from approximately 3,300 articles and placed almost 650,000 orders. Net sales totaled 30.28 million Euro. The average shopping basket contained 3.15 items, of which 1.64 were returned. On average, the shipped merchandise was worth 108.95 Euro, and returns were valued at 62.49 Euro. In sum, the retailer shipped 2,049,853 items, of which 1,069,008 were returned. This corresponds to a β-returns rate of 52.15 %. Because the merchant has an order consolidation policy in place, it can be assumed that each order was delivered in one shipment. Cases in
4195

which orders must be split due to significantly different delivery times may be a problem in product categories other than apparel. In the fashion industry, goods are ordered at the beginning of a selling season and put on display until they are sold out. According to the data, 651,658 outbound shipments resulted in 412,584 returns. That is, the α-returns rate was 63.31 %. The dataset provided by the merchant contained the information documented in Table 1.
In general, missing values were not an issue, except for the historic β-returns rate of new customers. In these cases, we inserted the average customer returns rate observed in the first quarter of 2014 (47.52 %), which is the period before the dataset starts. This procedure was applied by the merchant when calculating the variable “HistBetaItemsOrd” just in case recently listed articles with no historical data were part of that order.
We use regression models as our data analysis method because they are easy to interpret and are therefore most suitable for this contribution. Herein, the α-/β-returns rate of an order serves as the regressand. As the α-returns rate of an entire order can take only two values (0 % if the consumer keeps the entire order or 100 % if the consumer returns one or more items), we refer to a binary logistic regression, whereas traditional multivariate linear regression is used to explain the β-returns rate. Before performing the calculations using SPSS 23, the data were visualized to check for U-shaped or curvilinear relationships. We recognized a conspicuous relation between the regressand and the variables “HistBetaCust” and “HistBetaItemsOrd” but attribute this to the regressor’s learning character; this leads to some distortion.
Table 1. Description of the dataset variables
Variable (Mean / SD)
Description
OrderID Unique identification number of an order.
OrderDate Date of the order. CustomerID Unique identification number of
the customer placing the order. AddItems (2.15 / 2.53)
Total number of additionally ordered items (=Total number of ordered items–1).
OrderValue (110.43 / 92.31)
Total retail price of all the items ordered in Euro.
Coupon (.14 / .35)
Dummy variable indicating whether a coupon code has been used (=1) or not (=0).
CouponValueAbs (1.48 / 4.08)
Absolute value of the coupon code in Euro.
CouponValueRel (.02 / .05)
Relative value of the coupon in percent (=CouponValAbs/ OrderValue).
MeanPrice (39.10 / 22.61)
Mean retail price of the ordered items (=OrderValue/AddItems+1) in Euro.
FreeGift (.02 / .14)
Dummy variable indicating whether the customer received a free gift (=1) or not (0).
MultItemsSize (.15 / .36)
Number of multiple items with different size but same color and same style.
MultItemsColor (.24 / .52)
Number of multiple items with different color but same size and same style.
MultItemsStyle (.19 / .49)
Number of multiple items with different style but same color and same size.
PayByInvoice (.74 / .43)
Dummy variable indicating whether the customer paid by invoice (=1) or by another payment method (=0).
Return (.63 / .48)
Dummy variable indicating whether a return was made (=1) or not (=0).
ItemsReturned (1.6 / 2.10)
Total number of items returned.
RefundValue (62.49 / 82.29)
Total value of the returned items in Euro.
HistNrOrders (4.06 / 11.33)
Number of total order the customer has placed before.
HistBetaCust (47.73 / 17.47)
The customer’s historic β-returns rate up to this order in percent.
HistBetaItemsOrd (80.71 / 17.58)
Aggregated historic β-returns rate of the items ordered in percent.
4. Findings
We first estimate the linear regression model with the β-returns rate as the dependent variable. The independent variables include the total number of additionally ordered items (AddItems), the number of multiple-items concerning size (MultItemsSize), color (MultItemsColor) and style (MultItemsStyle), the average retail price (MeanPrice), the use of a coupon (Coupon), the relative coupon value (CouponValRel), the addition of a free gift (FreeGift), the payment method (PayByInvoice), the customer’s historic β-returns rate (HistBetaCust), and the aggregated historic β-returns rate of all the items ordered (HistBetaItemsOrd). The predictors “PayByInvoice”, “Coupon”, and “FreeGift” are modeled as dummy variables. It should be noted that the p-values should not be misinterpreted in a way that smaller values indicate more relevant results [40]. In our model, even small effects become highly significant due to the large sample size. Instead, the reported standardized
4196

coefficients are more suitable to assess the relative importance of an effect.
In general, the model is significant (p=.000, F=14764.970, R=.447, R-squared=.200) and includes all exogenous variables mentioned above. Concerning the quality of the model, a large R-squared indicates a good fit. In this case, the employed independent variables explain 20.0 % of the response variable variance. This seems acceptable for a complex behavioral problem with many other dimensions (e.g., customer demographics, logistical performance) that are not part of this analysis [41]. Table 2 shows the results in detail.
The findings support most of the hypotheses, except for H1.1 and H1.2b. This is notable because it indicates that, in fashion retailing, ordering more does not automatically result in more items being returned. The effect is small (b(AddItems)=-.004, p=.000), but based on these findings, e-tailers trying to reduce returns may be ill-advised to limit the maximum number of items a customer can order, as stipulated by some e-commerce solutions [42].
Even more striking is the fact that, if customers purchase the same items in different colors, their returns rate decreases (b(MultItemsColor)=-.012, p=.000). That is, the majority of customers are not ordering multiple colors due to uncertainty but for the sake of owning different variants of the product. Consequently, category managers should not shy away from increasing the number of color variants out of fear of higher returns. However, if consumers order a product in multiple sizes (b(MultItemsSize)=.141, p=.000) and styles (b(MultItemsStyle)=.026, p=.000), the likelihood of returns increases. The effect of size exceeds the effect of style. This observation supports some of the actions taken by the German fashion shoe retailer Mirapodo (www.mirapodo.de). If a customer orders an item in different sizes, a note is displayed at the beginning of the checkout procedure that says: “Do you really need multiple sizes? Please note: Any return generates costs and pollutes the environment.”
Price (b(MeanPrice)=.002, p=.000) is also a significant factor. The results indicate that the likelihood of returns increases with the mean price of the ordered items. This replicates the results of Hess and Mayhew (1997), who perform their study using data from a fashion mail-order company [22]. Our study complements their findings in the sense that the observed price effect has entered into e-commerce. Consequently, e-tailers with a high-priced product range face higher costs of product returns. This reality should be considered when making listing and pricing decisions.
As hypothesized, the results suggest that coupons cause two opposing effects. In general, coupon codes trigger impulse buyers to order, leading to higher returns. The coefficient of the dummy variable (b(Coupon)=.012, p=.000) indicates that the β-returns rate of an order is 1.2 percentage points higher than it is when a coupon code is not redeemed during checkout. However, this effect is mitigated by the costs savings the coupon provides, which reduces the price to be paid (b(CouponValRel)=-.003, p=.000). In other words, as the relative value of a coupon increases, the likelihood of returning an ordered item decreases. Within the examined data, the negative price effect compensates for the positive impulse-buying effect if the relative value of the coupon exceeds 4 percent. While previous studies have addressed only the sales-promoting effect of coupon codes [43], our study is the first to include the impact on product returns. The findings suggest that rebate coupons are an appropriate marketing instrument when merchants are interested not only in boosting sales but also in avoiding returns. This may be particularly true at the end of selling seasons, when it becomes harder to resell potentially returned products. Other coupons with a low relative value, e.g., codes that only compensate for shipping costs, may increase the probability of orders, but the overall financial effect remains unclear. Because returns incur significant costs, e-tailers should weigh the pros and cons of such coupons thoroughly.
Variable Coefficient b Standard error Stand. coefficient Beta T-value Sig. Constant -.432 .003 -148,986 .000 AddItems -.004 .000 -.028 -14,782 .000 MultItemsSize .141 .001 .127 105,240 .000 MultItemsColor -.012 .001 -.016 -12,266 .000 MultItemsStyle .026 .001 .032 23,867 .000 MeanPrice .002 .000 .130 112,527 .000 Coupon .012 .002 .011 5,388 .000 CouponValRel -.003 .000 -.036 -18,295 .000 FreeGift -.081 .003 -.028 -25,120 .000 PayByInvoice .100 .001 .108 95,601 .000 HistBetaItemsOrd .006 .000 .258 172,487 .000 HistBetaCust .005 .000 .211 187,845 .000
Table 1. Results of the linear regression model
4197
Another marketing measure is free gifts. We hypothesized that free gifts would increase the perceived order value or increase psychological hassle, both of which reduce the likelihood of returns. The regression coefficient of the dummy variable supports this point of view (b(FreeGift)=-.081, p=.000). The β-returns rates of orders accompanied by a gift were 8.1 percentage points lower than those without a freebie. If these results can be confirmed by other studies, e-tailers should look into providing small gifts with their deliveries, such as small product samples or small packages of candy, because they may not only help build a sustainable customer relationship but also reduce consumer returns.
Additionally, the influence of the payment option should not be underestimated. In this study, we specifically looked into the impact of invoicing as a post-delivery payment option. So far, invoicing is a German peculiarity, but emerging service providers such as Klarna are currently trying to make it available internationally. Such service providers attempt to eliminate this risk by paying the retailer immediately and taking over the debt collection for a percentage fee. Their main argument is that invoices notably decrease barriers to ordering and, thus, increase sales. The business news network CNBC calls Klarna one of the world’s most disruptive companies and predicts that it will be highly successful [44]. However, post-delivery payment options seem to be a mixed blessing, according to the present study. Compared with the pre-delivery alternatives (b(PayByInvoice)=.100, p=.000), invoicing increases the β-returns rate by 10.0 percentage points. Therefore, before buying into the promising sales effects of invoicing, e-tailers should seriously evaluate the negative cost effects of invoicing that result from higher returns rates. Introducing invoicing should be considered only if the overall financial impact is positive. In addition, these results provide e-tailers that have introduced invoicing and that are trying to cut back on returns with a viable strategy: they might restrict the payment options
available to those customers with histories of conspicuous or unethical returns behavior.
Finally, we examined the influence of item characteristics and past customer behavior, both of which are described by the order and return history. Our results suggest that the historical returns rate of the ordered articles (b(HistBetaItemsOrd)=.006, p=.000) and the historical customer returns rate (b(HistBetaCust)=.005, p=.000) positively influence the returns rate. In fact, the standardized coefficients (b’(HistBetaItemsOrd)=.258, b’(HistBetaCust)=.211) show that the historical return rates have the greatest relative effect on the dependent variable. These results lead to an important managerial implication. E-tailers should collect and use returns data to learn from the past. Items with returns rates so high that they may not be profitably distributed should be discontinued. Moreover, it can be beneficial to segment customers based on their past returns behavior and to close unprofitable accounts. Amazon is known for such measures. They justify their actions with the following explanation: “[…] a careful review of this account and related ones shows you've requested refunds and replacements on a majority of your orders for a variety of reasons. In the normal course of business, we expect there may be occasional problems. However, the rate at which such problems have occurred on your account is extraordinary, and it cannot continue. Your Amazon.com account has been closed, and you will no longer be able to shop in our store” [45].
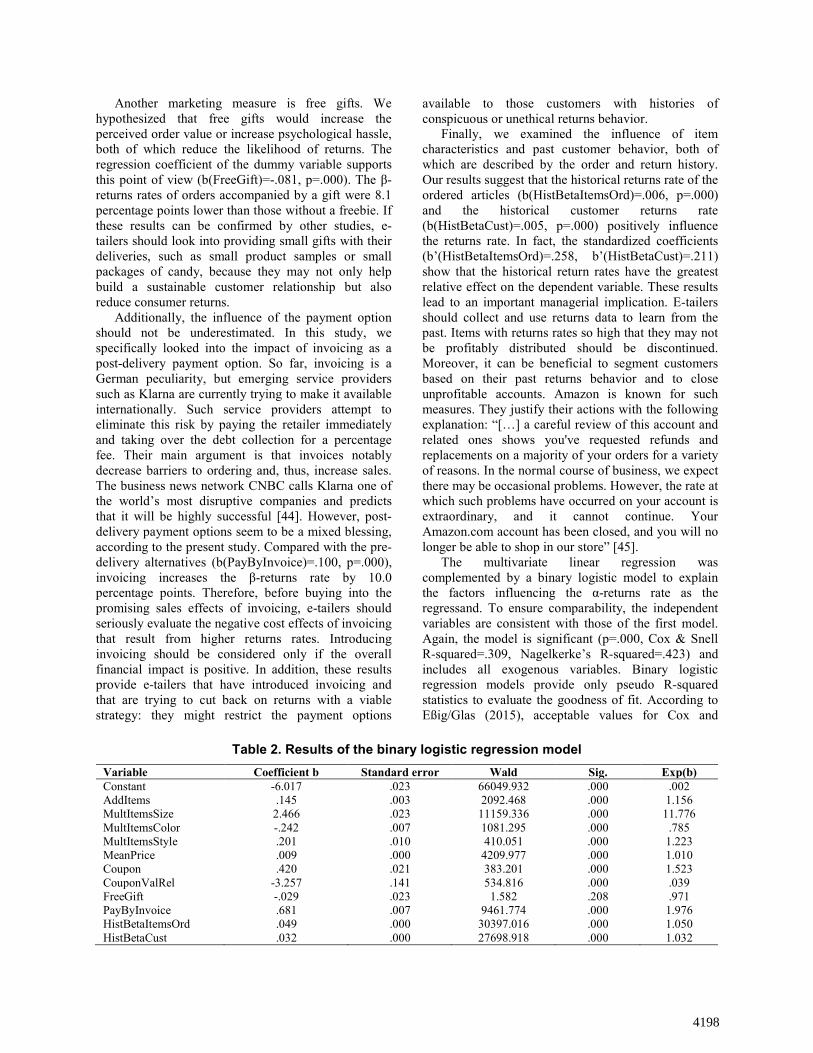
The multivariate linear regression was complemented by a binary logistic model to explain the factors influencing the α-returns rate as the regressand. To ensure comparability, the independent variables are consistent with those of the first model. Again, the model is significant (p=.000, Cox & Snell R-squared=.309, Nagelkerke’s R-squared=.423) and includes all exogenous variables. Binary logistic regression models provide only pseudo R-squared statistics to evaluate the goodness of fit. According to Eßig/Glas (2015), acceptable values for Cox and
Variable Coefficient b Standard error Wald Sig. Exp(b) Constant -6.017 .023 66049.932 .000 .002 AddItems .145 .003 2092.468 .000 1.156 MultItemsSize 2.466 .023 11159.336 .000 11.776 MultItemsColor -.242 .007 1081.295 .000 .785 MultItemsStyle .201 .010 410.051 .000 1.223 MeanPrice .009 .000 4209.977 .000 1.010 Coupon .420 .021 383.201 .000 1.523 CouponValRel -3.257 .141 534.816 .000 .039 FreeGift -.029 .023 1.582 .208 .971 PayByInvoice .681 .007 9461.774 .000 1.976 HistBetaItemsOrd .049 .000 30397.016 .000 1.050 HistBetaCust .032 .000 27698.918 .000 1.032
Table 2. Results of the binary logistic regression model
4198

Snell’s R-squared and for Nagelkerke’s R-squared are greater than .2, while good values start at .4 [46]. Thus, the model’s fit is acceptable-to-good, depending on the measure applied. Table 3 presents the detailed results.
The binary logistic regression strongly supports the findings of the linear regression analysis, with two exceptions. First, the sign of b(AddItems) changed to positive. This indicates that, while ordering more does not automatically result in more items being returned, it obviously leads to more return shipments that must be transported and handled. Second, the influence of b(FreeGift) is no longer significant (p=.208). That is, the psychological effects of free gifts are strong enough to reduce the number of items being returned but are insufficient to prevent additional return shipments.
In conclusion, it should be noted that the more-than-acceptable goodness of fit indicators show that using data analysis techniques not only may help in identifying influencing factors but also may be used to predict future return shipments, which helps the returns department with better capacity planning. This shows that data mining and big data analytics support better decision making and create value in returns management. 5. Summary and future research
Returns management – as an important component of supply chain management – is a key activity in an online retailer’s business model. Prior research has shown that fashion e-tailers experience returns rates of up to 60 % [4]. While successful returns may stimulate customer satisfaction and retention, they also incur costs [5]. It is therefore essential to understand the drivers influencing the flow of returns. Only with these insights can consumer returns be effectively managed.
Prior empirical research in this area is usually based on survey data. This paper contributes to the literature by testing several hypotheses using real shop data from an apparel e-tailer. This type of study is rare because many merchants consider order and returns data as proprietary and are usually unwilling to share this information [6].
The hypotheses were formulated based on several established theories – such as post-purchase dissonance theory – and anecdotal information. Methodologically, we used linear and logistic regression models to analyze the data at hand. The results supported most of the hypotheses. Table 4 provides a summary.
The findings enable better decision making by identifying several factors that significantly influence the returns rate. We distinguish between shopping basket-related (H1-H1.2c), sales/marketing-related
(H2-H5), product-related (H6), and customer-related factors (H7).
Table 4. Summary of hypotheses test results Hypothesis Results H1.1 There is a positive relationship
between the number of additional items and the α-/β-returns rate of an order.
α: Supported β: Not supported
H1.2a T There is a positive relationship between the number of multiple-items regarding size (i.e., same style and same color) and the α-/β-returns rate of an order.
α: Supported β: Supported
H1.2b There is a positive relationship between the number of multiple-items regarding color (i.e. same style and same size) and the α-/β-returns rate of an order.
α: Not supported β: Not supported
H1.2c There is a positive relationship between the number of multiple-items regarding style (i.e. color and same size) and the α-/β-returns rate of an order.
α: Supported β: Supported
H2 There is a positive relationship between the mean item price and the α-/β-returns rate of an order.
α: Supported β: Supported
H3.1 The use of coupons codes has a positive effect on the α-/β-returns rate of an order.
α: Supported β: Supported
H3.2 There is a negative relationship between the relative value of a coupon and the α-/β-returns rate of an order.
α: Supported β: Supported
H4 Adding free gifts to an order has a negative effect on the α-/β-returns rate of an order.
α: Not supported β: Supported
H5 Post-delivery payment options such as invoicing have a positive effect on the α-/β-returns rate of an order.
α: Supported β: Supported
H6 There is a positive relationship between the ordered items’ aggregated historical β-returns rate and the α-/β-returns rate of an order.
α: Supported β: Supported
H7 There is a positive relationship between the customer’s historical α-/β-returns rate and the α-/β-returns rate of an order.
α: Supported β: Supported
Our results indicate that the composition of the
customer’s shopping basket influences the returns rate. It should be noted that more ordered items do not necessarily lead to more returned items. Moreover, it is interesting to see that multiple-item orders regarding color have a negative effect on the returns rate. Consequently, product returns should not be an issue when deciding on additional color variations. In
4199

contrast, multiple-item orders in terms of size and style significantly increase the returns rate.
This article also investigates the effects of sales stimuli (such as coupon codes, free gifts, and payment methods) on product returns. We find that coupons increase the returns rate in general. However, this effect is reversed in conjunction with increasing relative coupon value. Moreover, free gifts may reduce the likelihood of returning an item. Nonetheless, this finding may not be applied to return shipments. It seems as if free gifts contribute to a customer’s bad conscience if the entire order is supposed to be sent back. In other words, freebies increase the likelihood that a customer will keep at least one item. The data also indicate that allowing customers to pay after delivery influences the returns rate. It shows that adding invoicing to the existing slate of payment options is a double-edged sword. Decision makers have to carefully balance revenue against cost effects to ensure a positive financial outcome.
On the product and customer end, we find that it can be beneficial for e-tailers to perform big data analytics on their order and return histories because analyzing the past may help to predict future behavior. Such analyses may show that it is better to close customer accounts and discontinue products with extremely high returns rates, true to the motto that “better an end with pain, than pain without end”.
The present study uses data from a single e-tailer. Although an extensive dataset with more than 650,000 orders over the course of 18 months was used, the generalizability of the presented findings is limited. Therefore, this publication should be complemented by additional future research. To gain a more accurate picture, we call for similar studies using data from e-tailers with different target groups (e.g., apparel for men or other age groups) or product groups (e.g., consumer electronics, books). There are also concerns regarding endogeneity [47]. While trying to provide strong theoretical arguments when deducing the hypotheses, it must be acknowledged that the secondary data provided did not allow for the development and testing of potential instrumental variables. We therefore call for complementary experimental research to establish causality.
Moreover, it would be interesting to compare gender-specific results. Other factors, such as age or location, could also be taken into account. An international comparison of identified factors would also be a valuable contribution to the literature. Furthermore, in the context of controversial same-day delivery and anticipatory shipping services [48], returns rates need to be more closely investigated in terms of delivery modes and times.
6. References [1] United States Census Bureau, “U.S. Retail Trade Sales
- Total and E-commerce (1998-2014)”, 2016, available from http://www2.census.gov/retail/releases/current/ arts/ecommerce.xls, accessed 29 May 2016.
[2] Croxton, K.L., S.J. García‐Dastugue, D.M. Lambert, D.S. Rogers, “The Supply Chain Management Processes”, The International Journal of Logistics Management, 2001, 12(2), pp. 13-36.
[3] Stock, J.R., T. Speh, and H. Shear, “Managing Product Returns for Competitive Advantage”, MIT Sloan Management Review, 2006, 48(1), pp. 57-62.
[4] Foscht, T., K. Ernstreiter, C. Maloles III, I. Sinha, and B. Swoboda, “Retaining or Returning?”, in: International Journal of Retail & Distribution Management, 2013, 41(2), pp. 113-134.
[5] Asdecker, B., “Returning Mail-Order Goods: Analyzing the Relationship Between the Rate of Returns and the Associated Costs”. Logistics Research, 2015, 8(3), pp. 1-12.
[6] Stock, J.R., and J.P. Mulki, “Product Returns Processing: an Examination of Practices of Manu-facturers, Wholesalers/Distributors, and Retailers”, Journal of Business Logistics, 2009, 30(1), pp. 33-62.
[7] Toktay, L.B., E.A. van der Laan, and M.P. de Brito, “Managing Product Returns: The Role of Forecasting”, in: Dekker, R., M. Fleischmann, K. Inderfurth, and L.N. Van Wassenhove (eds.): Reverse Logistics, Springer Berlin Heidelberg, 2004, pp. 45-64.
[8] Lee, D.H., “An Alternative Explanation of Consumer Product Returns from the Postpurchase Dissonance and Ecological Marketing Perspectives”, Psychology & Marketing, 2015, 32(1), pp. 49-64.
[9] Powers, T.L., and E.P. Jack, “The influence of Cognitive Dissonance on Retail Product Returns”, Psychology & Marketing, 2013, 30(8), pp. 724-735.
[10] Festinger, L., “A Theory of Cognitive Dissonance”, Stanford University Press, 1957.
[11] Banjo, S., “Rampant Returns Plague E-Retailers”, The Wall Street Journal, 2013, available from: http://www.wsj.com/articles/SB10001424052702304773104579270260683155216, accessed 07 May 2016.
[12] McFadden, D., “The Measurement of Urban Travel Demand”, Journal of Public Economics, 1974, 3(4), pp. 303-328.
[13] Rust, R.T., J.J. Inman, J. Jia, A. Zahorik, “What You Don’t Know About Customer-Perceived Quality: The Role of Customer Expectation Distribution”, Marketing Science, 1999, 18(1), pp. 77-92.
[14] Minnema, A., T.H.A. Bijmolt, S. Gensler, and T. Wiesel, “To Keep or Not to Keep: Effects of Online Customer Reviews on Product Returns”, Journal of Retailing, 2016, in press.
[15] Padmanabhan, V., and I.P.L. Png, “Returns Policies: Make Money By Making Good”, Sloan Management Review, 1995, 37(1), pp. 65-72.
[16] Mollenkopf, D.A., E. Rabinovich, T.M. Laseter, and K.K. Boyer, “Managing Internet Product Returns: A Focus on Effective Service Operations”, Decision Sciences, 2007, 38(2), pp. 213-250.
4200

[17] Kirmani, A., and A.R. Rao, “No Pain, No Gain: A Critical Review of the Literature on Signaling Unobservable Product Quality”, Journal of Marketing, 2000, 64(2), pp. 66-79.
[18] Wood, S.L., “Remote Purchase Environments: The Influence of Return Policy Leniency on Two-Stage Decision Processes”, Journal of Marketing Research, 2001, 38(2), pp. 157-169.
[19] Zeithaml, V.A., A. Parasuraman, and L.L. Berry, “Delivering Quality Service: Balancing Customer Perceptions and Expectations”, Simon and Schuster, 1990.
[20] Teboul, J., “Managing Quality Dynamics”, Prentice Hall London, 1991.
[21] E27.co, “5 Factors Behind High E-Commerce Return Rate”, 2015, available from: https://e27.co/5-factors-behind-high-e-commerce-return-rate-20150721/, accessed 02 May 2016.
[22] Hess, J.D., and G.E. Mayhew, “Modeling Merchandise Returns in Direct Marketing”, Journal of Direct Marketing, 1997, 11(2), pp. 20-35.
[23] Lynch, J.G., and T.K. Srull, “Memory and Attentional Factors in Consumer Choice: Concepts and Research Methods”, Journal of Consumer Research, 1982, 9(1), pp. 18-37.
[24] Bechwati, N.N., and W.S. Siegal, “The Impact of the Prechoice Process on Product Returns”, Journal of Marketing Research, 2005, 42(3), pp. 358-367.
[25] Bellenger, D.N., D.H. Robertson, and E.C. Hirschman, “Impulse Buying Varies by Product”, Journal of Advertising Research, 1978, 18(6), pp. 15-18.
[26] Dawson, S., and M. Kim, “External and Internal Trigger Cues of Impulse Buying Online”, Direct Marketing: An International Journal, 2009, 3(1), pp. 20-34.
[27] Schwartz, B., “The Social Psychology of the Gift”, American Journal of Sociology, 1967, 73(1), pp. 1-11.
[28] McVeigh, B., “Interpreting Japan - Approaches and Applications for the Classroom”, Routledge, 2014.
[29] Ferrary, M., “The Gift Exchange in the Social Networks of Silicon Valley”, California Management Review, 2003, 45(4), pp. 120-138.
[30] Davis, S., M. Hagerty, and E. Gerstner, “Return Policies and the Optimal Level of ‘Hassle’”, Journal of Economics and Business, 1998, 50(5), pp. 445-460.
[31] Davis, S., E. Gerstner, and M. Hagerty, “Money Back Guarantees in Retailing: Matching Products to Consumer Tastes”, Journal of Retailing, 1995, 71(1), pp. 7-22.
[32] Nielsen, “Global Connected Commerce”, 2016, available from: http://www.nielsen.com/content/dam/ corporate/us/en/reports-downloads/2016-reports/ connected-commerce-report-jan-2016.pdf, accessed 25 May 2016.
[33] Budde, L., K. Hampe, M. Puppe, and M. Shahd, “Trends im E-Commerce”, Bitkom, 2013, available from: https://www.bitkom.org/Publikationen/ 2013/Studien/Trends-im-ECommerce/BITKOM-E-Commerce-Studienbericht.pdf, accessed 01 June 2016.
[34] About Payments, “Germany. E-Commerce Market Profile”, 2016, available from: https://www.about-
payments.com/knowledge-base/market/germany, accessed 7 June 2016.
[35] Tuttle, B., “Shoppers Face End of Generous Retailer Return Policies”, 2013, available from: http://business.time.com/2013/09/19/shoppers-face-end-of-generous-retailer-return-policies/, accessed 11 June 2016.
[36] Kerr, J.C., “Serial Returners, Beware: Retailers are Tracking You”, Today, 2013, available from: http://www.today.com/money/serial-returners-beware-retailers-are-tracking-you-6C10900265, accessed 17 May 2016.
[37] Ouellette, J.A., and W. Wood, “Habit and Intention in Everyday Life: The Multiple Processes by Which Past Behavior Predicts Future Behavior”, Psychological Bulletin, 1998, 124(1), pp. 54-74.
[38] Aarts, H., B. Verplanken, and A. van Knippenberg, “Predicting Behavior From Actions in the Past: Repeated Decision Making or a Matter of Habit?”, Journal of Applied Social Psychology, 1998, 28(15), pp. 1355-1374.
[39] European Union, “Directive 2011/83/EU of the European Parliament and of the Council”, 2011, available from: http://eur-lex.europa.eu/LexUriServ/ LexUriServ.do?uri=OJ:L:2011:304:0064:0088:en:PDF, accessed 04 June 2016.
[40] Wasserstein, R.L., and N.A. Lazar, “The ASA’s Statement on p-Values: Context, Process, and Purpose”, The American Statistician, 2016, 70(2), pp. 129-133.
[41] Cohen, J., “A Power Primer”, Psychological Bulletin, 1992, 112(1), pp. 155-159.
[42] Shopify, “Limiting Purchase Quantities”, 2016, available from: https://help.shopify.com/manual/ products/inventory/limiting-purchase-quantities, accessed 13 June 2016.
[43] Edelmann, B., S. Jaffe, and S.D. Kominers, “To Groupon or Not to Groupon: The Profitability of Deep Discounts”, Marketing Letters, 2016, 27(1), pp. 39-53.
[44] CNBC, “Klarna. No Sale Left Behind”, 2016, available from: http://www.cnbc.com/2016/06/07/klarna-2016-disruptor-50.html, accessed 24 May 2016.
[45] Amazon, “Amazon.com General Help Forum - My Account Has Been Closed”, 2012, available from: http://www.amazon.com/gp/help/customer/forums/ref=help_forum_tft_tp?ie=UTF8&cdForum=Fx2NFGOONPZEXIP&cdThread=Tx1IS0VNGMKXPXQ, accessed 10 June 2016.
[46] Eßig, M., and A.H. Glas, “Considering Small and Medium Sized Suppliers in Public Procurement - The Case of the German Defence Sector”, in: Matfeld, D.C., T.S. Spengler, J. Brinkmann, M. Grunewald (eds.): Logistics Management, Springer International, 2015, pp. 19-33.
[47] Guide Jr., V.D.R., and M. Ketokivi, “Notes from the Editors: Redefining Some Methodological Criteria for the journal”, Journal of Operations Management, 2015, 27(1), pp. v-viii.
[48] Spiegel, J.R., M.T. McKenna, G.S. Lakshman, and P.G. Nordstrom, “Method and System for Anticipatory Shipping”, 2013, Patent No. US 8,615,473.
4201