examination of the k overburden correction … · overburden correction factor on liquefaction ......
TRANSCRIPT

CENTER FOR GEOTECHNICAL MODELING REPORT NO. UCD/CGM-12/02
EXAMINATION OF THE K OVERBURDEN CORRECTION FACTOR ON LIQUEFACTION RESISTANCE
BY J. MONTGOMERY R. W. BOULANGER L. F. HARDER, JR.
DEPARTMENT OF CIVIL & ENVIRONMENTAL ENGINEERING COLLEGE OF ENGINEERING UNIVERSITY OF CALIFORNIA AT DAVIS December 2012

EXAMINATION OF THE Kσ OVERBURDEN CORRECTION FACTOR ON LIQUEFACTION RESISTANCE
by
Jack Montgomery Ross W. Boulanger Leslie F. Harder, Jr.
Report No. UCD/CGM-12-02
Center for Geotechnical Modeling Department of Civil and Environmental Engineering
University of California Davis, California
December 2012

i
TABLE OF CONTENTS 1. INTRODUCTION 2. DATABASE ON Kσ RELATIONSHIP 2.1 Current database for Kσ 2.2 Challenges in interpreting Kσ from laboratory test data 2.2.1 Effect of relative density on Kσ
2.2.2 Effect of specimen overconsolidation on Kσ
2.2.3 Other factors which influence Kσ
2.3 Summary 3. COMPARISON OF DATABASE AND CURRENT RELATIONSHIPS
3.1 Relating Kσ to CRRM=7.5,σ'vc=1,α=0
3.2 Residuals between data and current relationships
3.3 Discussion 4. SUMMARY AND CONCLUSIONS ACKNOWLEDGEMENTS REFERENCES

1
EXAMINATION OF THE Kσ OVERBURDEN CORRECTION FACTOR ON LIQUEFACTION RESISTANCE
1. INTRODUCTION
The cyclic strength of sands and other cohesionless soils (e.g. gravels to nonplastic silts) depends on, among other factors, both the soil density [e.g. as may be represented by its void ratio or relative density (DR)] and the imposed effective stress ('), which together determine the state of the soil. Seed and Idriss (1971) introduced use of a liquefaction triggering curve to relate the cyclic strength of a soil to the normalized Standard Penetration Test (SPT) blow count, which was used as a proxy for the DR and other factors affecting the cyclic strength of the soil. Seed (1983) later introduced the overburden correction factor (Kσ) to account for the variation of a soil's cyclic resistance ratio (CRR) as a function of effective consolidation stress. This factor was defined as:
' , 0
' 1, 0
vc
vc
CRRK
CRR
(1.1)
where CRRσ'vc,α=0 and CRRσ'vc=1,α=0 are the cyclic resistance ratios for a static shear stress ratio (α) of zero and vertical effective consolidation stress (σ'vc) equal to the stress level of interest and to 1.0 atm (1 atm = 101.3 kPa), respectively. Both CRR values are assumed to be for soil that is identical in all respects other than consolidation stress (i.e., the same DR, same fabric, same age, same cementation, and same loading history). The factor Kσ describes the curvature of the cyclic strength envelope with increasing consolidation stress, as illustrated by the example shown in
Figure 1.1. Example of how the factor Kσ describes the curvature of the cyclic resistance
envelope with increasing isotropic effective consolidation stress (σ'3c).

2
Figure 1.1. More recent studies have found the magnitude of this curvature is dependent on DR and soil type (Vaid and Sivathayalan 1996, Hynes and Olsen 1999, Boulanger 2003).
The effects of DR and ' on the CRR of sands can be expressed through the state parameter () (Pillai and Muhunthan 2001, Stamatopolous 2010) or relative state parameter (R) (Boulanger 2003, Idriss and Boulanger 2008). The parameter is the difference between a sample's void ratio and its corresponding critical state void ratio at the same effective consolidation stress (Been and Jefferies 1985), whereas the parameter R is the difference between a sample's DR and its corresponding critical state DR at the same effective consolidation stress (Konrad 1988). Measurement of or R for in situ soils through laboratory testing is difficult due to issues of disturbance during sampling of cohesionless soils. Boulanger (2003) subsequently recommended using an empirical procedure for estimating the position of the critical state line (Figure 1.2c) and then referring to the estimated R as an index.
The most common approach used for developing and applying liquefaction triggering
correlations for sandy soils is to normalize the SPT or Cone Penetration Test (CPT) penetration resistances (i.e., N60 or qc) to a reference σ'vc of 1 atm (assuming the soil's DR and all other
Figure 1.2. Illustration of how the CRR of sand can be related to the effective stress and DR
through the use of a relative state parameter index or Kσ factor (Idriss and Boulanger 2008).
CRR
CRR
DR
K

3
attributes are unchanged) and to correlate this normalized penetration resistance [i.e., (N1)60 or qc1] to a normalized cyclic strength for this same reference stress (i.e., CRRσ'vc=1). The SPT-based liquefaction triggering correlations recommended by Youd et al. (2001) and Idriss and Boulanger (2008), as shown in Figure 1.3 for a Magnitude 7.5 earthquake, follow this approach. The normalization of penetration resistances is performed using the overburden correction factor CN as follows:
1 60 60NN C N (1.2)
where N60 equals the SPT blow count for an energy ratio of 60%, and (N1)60 equals the N60 value for an equivalent σ'vc of 1 atm. The dependence of the liquefaction triggering correlation on the fines content (FC) is accommodated by adding an increment, Δ(N1)60, to the (N1)60 value to obtain an equivalent clean-sand (N1)60cs in order to determine the appropriate CRR as shown below:
1 1 160 60 60
csN N N
(1.3) The relationship for Δ(N1)60 depends on the liquefaction triggering correlation, with the following expression (with FC expressed as a percent) being the one recommended by Idriss and Boulanger (2008) for use with their triggering correlation:
2
1 60
9.7 15.7exp 1.63
.01 .01N
FC FC
(1.4)
The effect on the CRR of variations in σ'vc, sloping ground conditions, and earthquake magnitude
Figure 1.3. Empirical liquefaction triggering correlations have been proposed by Idriss and Boulanger (2008) and Youd et al. (2001) to relate penetration resistance to cyclic resistance
of a soil layer.

4
(M) are accounted for through Kσ, static shear stress correction (Kα), and magnitude scaling (MSF) factors as follows:
, , 7.5, 1, 0 M MCRR CRR MSF K K (1.5)
where CRRM,σ'vc,α is the CRR for given values of M, σ'vc, and α, and CRRM=7.5,σ'vc=1,α=0 is the value
of CRR for M = 7.5, σ'vc = 1 atm, and α = 0, as obtained from case history-based correlations.
The roles of the CN and K factors in this approach are schematically illustrated in Figure 1.4 for a hypothetical deep deposit of saturated clean sand at a uniform DR = 60%. Penetration resistances (SPT N60 values in this example) increase with depth (Figure 1.4b) because the sand's shear strength and stiffness increase with increasing σ'vc. The (N1)60 values, however, are constant with depth (Figure 1.4d) because the deposit is uniform in all attributes other than σ'vc. The CN factor, which accounts for the effect of σ'vc on the measured N60 values, is simply the ratio (N1)60/N60 and thus it decreases with increasing σ'vc (Figure 1.4c). The more strongly dependent CN is on the σ'vc the lower the CN value becomes for σ'vc greater than 1 atm The CRRM=7.5,σ'vc=1,α=0 values obtained from a liquefaction triggering correlation using the (N1)60 values are constant with depth (Figure 1.4e) because the (N1)60 values are constant with depth. However, the CRRM=7.5,σ'vc,α=0 values are shown to decrease with increasing depth and σ'vc
Figure 1.4. One approach to evaluating the cyclic strength of soils in situ uses the factors CN
and Kσ to normalize both the penetration resistance and cyclic strength to an effective overburden stress of 101.3 kPa (1 atm) at a constant relative density.

5
(Figure 1.4g) because K decreases with increasing σ'vc (Figure 1.4f). The more strongly dependent K is on the σ'vc the lower the K values become for σ'vc greater than 1 atm
Another approach to evaluating the cyclic strength of sand is to normalize the SPT or CPT
penetration resistances (i.e., N60 or qc) to a reference σ'vc of 1 atm, but this time assuming the soil remains at the same state (i.e., same state parameter or relative state parameter) with all other attributes unchanged. The resulting state-based normalized penetration resistances [i.e., using a CN to obtain a (N1)60 or qc1] can then be correlated more directly to the soil's CRRM=7.5,σ'vc,α=0.
A third approach is to correlate the penetration resistance directly to which can then be correlated to the CRRM=7.5,σ'vc,α=0. Details on state-based approaches are given in Boulanger and Idriss (2004), Jefferies and Been (2006) and Robertson (2010).
This report will focus on the Kσ factor which is used within the first approach described
above for evaluating the cyclic strength of sand. The Kσ and CN factors provide the basis for extrapolating the case history data on liquefaction triggering (i.e., Fig. 1.3) from depths less than about 15 m and σ'vc less than about 1.5 atm to the much greater depths and stresses encountered under large embankment dams. The Kσ factor can be evaluated through laboratory element tests, whereas the CN factor can be evaluated using calibration chamber tests, numerical analyses, and in situ test data. The Kσ and CN factors are not independent, however, because they are both influenced by the same soil properties (often in opposing ways). The interdependency of the Kσ and CN factors and their algebraic relationship with the alternative state-based overburden normalization factor for penetration resistances (i.e., CN) are examined in Boulanger (2003) and Boulanger and Idriss (2004).
The purpose of this report is to examine current Kσ relationships against an updated database
of laboratory test results defining Kσ effects. The original laboratory test results included in previous databases (e.g., Seed and Harder 1990) are reexamined in light of the current understanding of factors which can affect laboratory measurements of cyclic strength. This report will present an updated database of laboratory test results defining Kσ effects, discuss important factors which can influence the interpretation of Kσ, present a comparison between current relationships and the updated database, and discuss implications for future relationships.
6
2. DATABASE ON Kσ RELATIONSHIP
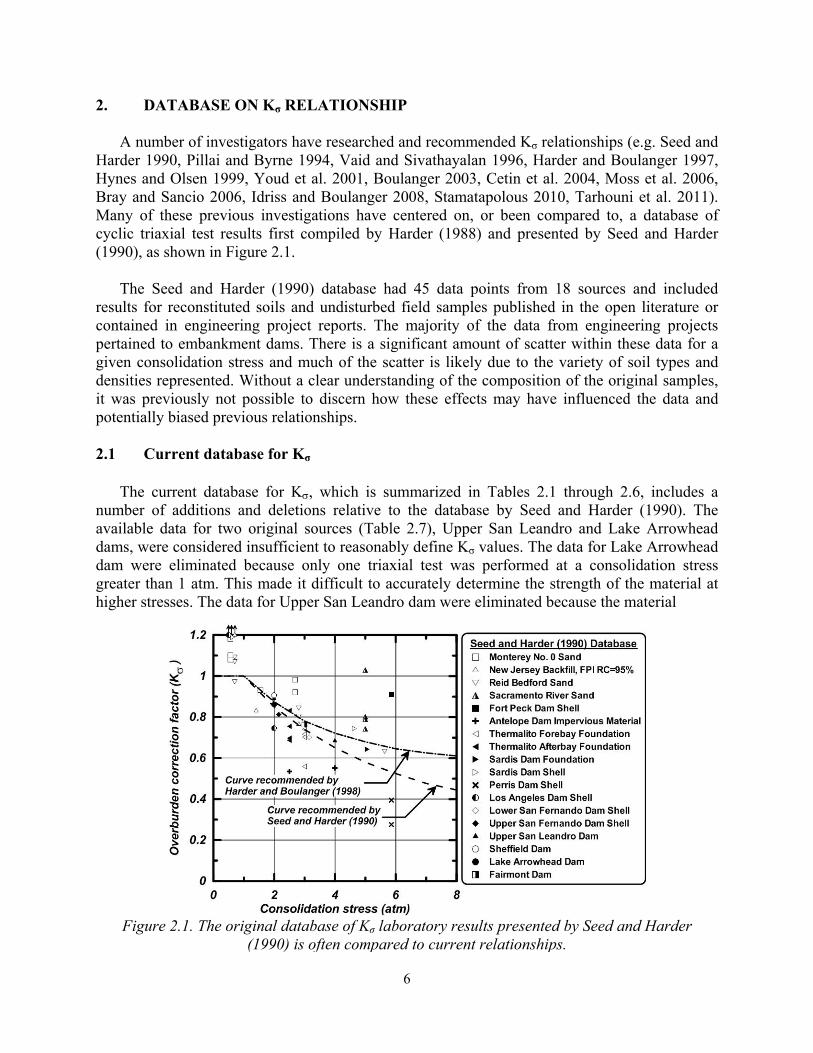
A number of investigators have researched and recommended Kσ relationships (e.g. Seed and Harder 1990, Pillai and Byrne 1994, Vaid and Sivathayalan 1996, Harder and Boulanger 1997, Hynes and Olsen 1999, Youd et al. 2001, Boulanger 2003, Cetin et al. 2004, Moss et al. 2006, Bray and Sancio 2006, Idriss and Boulanger 2008, Stamatapolous 2010, Tarhouni et al. 2011). Many of these previous investigations have centered on, or been compared to, a database of cyclic triaxial test results first compiled by Harder (1988) and presented by Seed and Harder (1990), as shown in Figure 2.1.
The Seed and Harder (1990) database had 45 data points from 18 sources and included
results for reconstituted soils and undisturbed field samples published in the open literature or contained in engineering project reports. The majority of the data from engineering projects pertained to embankment dams. There is a significant amount of scatter within these data for a given consolidation stress and much of the scatter is likely due to the variety of soil types and densities represented. Without a clear understanding of the composition of the original samples, it was previously not possible to discern how these effects may have influenced the data and potentially biased previous relationships. 2.1 Current database for Kσ
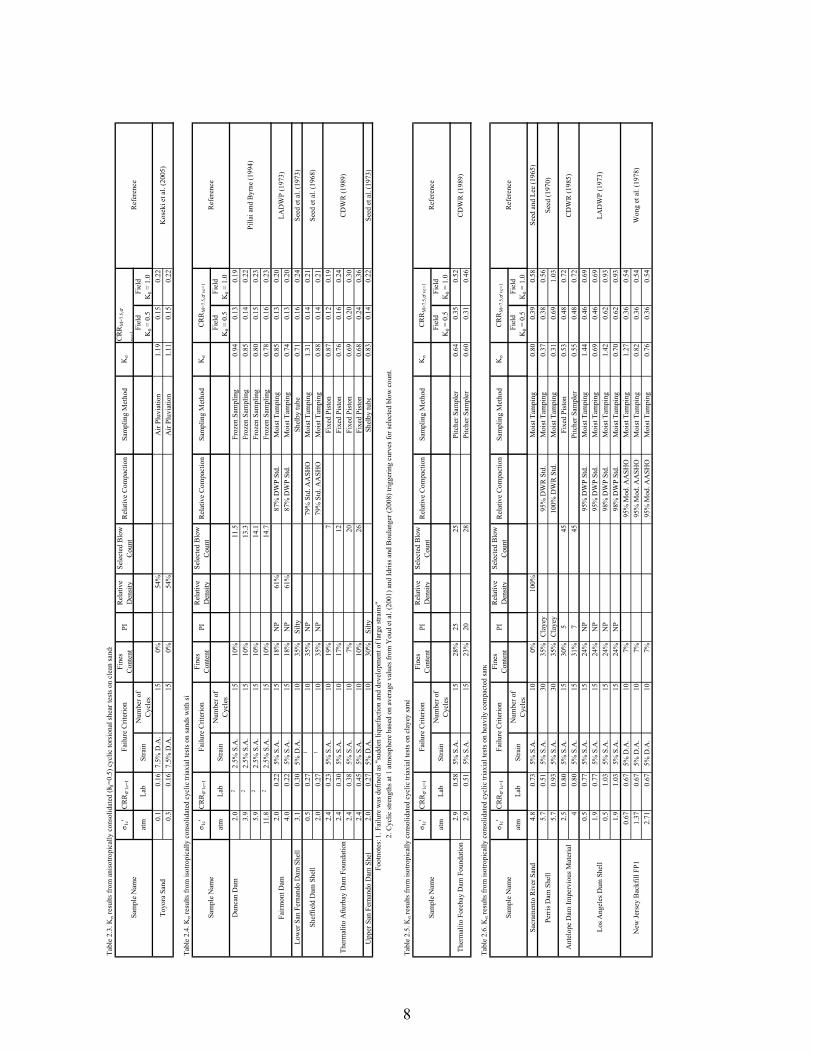
The current database for K, which is summarized in Tables 2.1 through 2.6, includes a
number of additions and deletions relative to the database by Seed and Harder (1990). The available data for two original sources (Table 2.7), Upper San Leandro and Lake Arrowhead dams, were considered insufficient to reasonably define Kσ values. The data for Lake Arrowhead dam were eliminated because only one triaxial test was performed at a consolidation stress greater than 1 atm. This made it difficult to accurately determine the strength of the material at higher stresses. The data for Upper San Leandro dam were eliminated because the material
Figure 2.1. The original database of Kσ laboratory results presented by Seed and Harder
(1990) is often compared to current relationships.

Tabl
e 2.
1. K
σ res
ults
from
isot
ropi
cally
con
solid
ated
cyc
lic tr
iaxi
al te
sts o
n cl
ean
sand
σ 1c'
CR
Rσ
1c=1
Fine
s C
onte
ntPI
Rel
ativ
e D
ensi
tySe
lect
ed B
low
C
ount
Rel
ativ
e C
ompa
ctio
nSa
mpl
ing
Met
hod
Kσ
atm
Lab
Stra
inN
umbe
r of
Cyc
les
Fiel
d
K
0 = 0
.5Fi
eld
K0 =
1.0
0.5
0.21
5% D
.A.
100%
50%
Air
Pluv
iatio
n1.
10.
110.
171.
50.
215%
D.A
.10
0%50
%A
ir Pl
uvia
tion
0.9
0.11
0.17
0.5
0.32
5% D
.A.
100%
50%
Moi
st T
ampi
ng1.
00.
170.
262.
60.
325%
D.A
.10
0%50
%M
oist
Tam
ping
0.9
0.17
0.26
0.5
0.45
5% D
.A.
100%
50%
Vib
ratio
n Ta
mpi
ng1.
10.
240.
362.
60.
455%
D.A
.10
0%50
%V
ibra
tion
Tam
pin g
0.8
0.24
0.36
0.7
0.
285%
S.A
.10
0%40
%M
oist
Tam
ping
1.05
0.15
0.22
2.7
0.
285%
S.A
.10
0%40
%M
oist
Tam
ping
0.82
0.15
0.22
0.7
0.
465%
S.A
.10
0%60
%M
oist
Tam
ping
1.06
0.25
0.37
1.4
0.
465%
S.A
.10
0%60
%M
oist
Tam
ping
0.95
0.25
0.37
2.7
0.
465%
S.A
.10
0%60
%M
oist
Tam
ping
0.78
0.25
0.37
5.4
0.
465%
S.A
.10
0%60
%M
oist
Tam
ping
0.58
0.25
0.37
4.8
0.20
5% S
.A.
100%
38%
Moi
st T
ampi
ng1.
020.
110.
164.
80.
315%
S.A
.10
0%60
%M
oist
Tam
ping
0.80
0.17
0.25
4.8
0.42
5% S
.A.
100%
78%
Moi
st T
ampi
ng0.
760.
220.
330.
50.
145%
D.A
.10
0%31
%W
et P
luvi
atio
n1.
00
0.07
0.11
2.0
0.14
5% D
.A.
100%
31%
Wet
Plu
viat
ion
1.00
0.
070.
113.
90.
145%
D.A
.10
0%31
%W
et P
luvi
atio
n1.
01
0.07
0.11
0.5
0.15
5% D
.A.
100%
40%
Wet
Plu
viat
ion
1.02
0.
080.
122.
00.
155%
D.A
.10
0%40
%W
et P
luvi
atio
n0.
99
0.08
0.12
3.9
0.15
5% D
.A.
100%
40%
Wet
Plu
viat
ion
0.97
0.
080.
120.
50.
215%
D.A
.10
0%59
%W
et P
luvi
atio
n1.
07
0.11
0.17
2.0
0.21
5% D
.A.
100%
59%
Wet
Plu
viat
ion
0.93
0.
110.
173.
90.
215%
D.A
.10
0%59
%W
et P
luvi
atio
n0.
85
0.11
0.17
0.5
0.26
5% D
.A.
100%
72%
Wet
Plu
viat
ion
1.13
0.
140.
212.
00.
265%
D.A
.10
0%72
%W
et P
luvi
atio
n0.
91
0.14
0.21
3.9
0.26
5% D
.A.
100%
72%
Wet
Plu
viat
ion
0.81
0.
140.
21Sa
rdis
Dam
Fou
ndat
ion
5.1
0.25
5% S
.A.
153%
Silty
38%
Moi
st T
ampi
ng0.
600.
150.
22M
arcu
son
et a
l. (1
978)
0.6
0.27
5% S
.A.
155%
Silty
38%
Moi
st T
ampi
ng1.
130.
160.
244.
60.
275%
S.A
.15
5%Si
lty38
%M
oist
Tam
ping
0.67
0.16
0.24
Fort
Peck
Dam
She
l l5.
70.
155%
S.A
.15
5%50
%D
ry S
poon
ing
0.87
0.09
0.13
Mar
cuso
n an
d K
rinitz
ky (1
976)
Tabl
e 2.
2. K
σ res
ults
from
cyc
lic si
mpl
e sh
ear t
ests
on
clea
n sa
nds
σ 1c'
CR
Rσ
1c=1
Fine
s C
onte
ntPI
Rel
ativ
e D
ensi
tySe
lect
ed B
low
C
ount
Rel
ativ
e C
ompa
ctio
nSa
mpl
ing
Met
hod
Kσ
atm
Lab
Stra
inN
umbe
r of
Cyc
les
Fiel
d
K
0 = 0
.5Fi
eld
K0 =
1.0
0.5
0.11
γ =
3.75
%10
0%31
%W
et P
luvi
atio
n1.
01
0.09
0.09
2.0
0.11
γ =
3.75
%10
0%31
%W
et P
luvi
atio
n0.
99
0.09
0.09
3.9
0.11
γ =
3.75
%10
0%31
%W
et P
luvi
atio
n0.
98
0.09
0.09
0.5
0.12
γ =
3.75
%10
0%40
%W
et P
luvi
atio
n1.
02
0.09
0.09
2.0
0.12
γ =
3.75
%10
0%40
%W
et P
luvi
atio
n0.
98
0.09
0.09
3.9
0.12
γ =
3.75
%10
0%40
%W
et P
luvi
atio
n0.
97
0.09
0.09
0.5
0.14
γ =
3.75
%10
0%59
%W
et P
luvi
atio
n1.
06
0.11
0.11
2.0
0.14
γ =
3.75
%10
0%59
%W
et P
luvi
atio
n0.
96
0.11
0.11
3.9
0.14
γ =
3.75
%10
0%59
%W
et P
luvi
atio
n0.
93
0.11
0.11
0.5
0.16
γ =
3.75
%10
0%72
%W
et P
luvi
atio
n1.
05
0.13
0.13
2.0
0.16
γ =
3.75
%10
0%72
%W
et P
luvi
atio
n0.
96
0.13
0.13
3.9
0.16
γ =
3.75
%10
0%72
%W
et P
luvi
atio
n0.
91
0.13
0.13
2.0
0.15
γ =
3.75
%10
0%41
%W
et P
luvi
atio
n0.
97
0.12
0.12
4.0
0.15
γ =
3.75
%10
0%41
%W
et P
luvi
atio
n0.
94
0.12
0.12
2.0
0.18
γ =
3.75
%10
0%41
%W
et P
luvi
atio
n0.
96
0.14
0.14
4.0
0.18
γ =
3.75
%10
0%41
%W
et P
luvi
atio
n0.
92
0.14
0.14
2.0
0.21
γ =
3.75
%10
0%41
%W
et P
luvi
atio
n0.
95
0.17
0.17
4.0
0.21
γ =
3.75
%10
0%41
%W
et P
luvi
atio
n0.
91
0.17
0.17
Sam
ple
Nam
eFa
ilure
Crit
erio
nC
RR
M=7
.5,σv
c=1
Ref
eren
ce
CR
RM
=7.5
,σv
c=1
Sam
ple
Nam
e
Mul
ilis e
t al.
(197
5)
Man
mat
hara
jan
& S
ivat
haya
lan
(201
1)
Man
mat
hara
jan
& S
ivat
haya
lan
(201
1)
Man
mat
hara
jan
& S
ivat
haya
lan
(201
1)
Fras
er D
elta
San
d (O
CR
= 1
.5)
Fras
er D
elta
San
d (O
CR
= 2
)
Fras
er D
elta
San
d (O
CR
= 1
)
Ref
eren
ce
Vai
d an
d Si
vath
ayal
an (1
996)
Mar
cuso
n et
al.
(197
8)
Vai
d an
d Si
vath
ayal
an (1
996)
Seed
and
Lee
(196
5)
Tow
nsen
d an
d M
ulili
s (19
79)
Failu
re C
riter
ion
Fras
er D
elta
San
d
Sard
is D
am S
hell
Sacr
amen
to R
iver
San
d
Rei
d B
edfo
rd S
and
Mon
tere
y N
o. 0
Fras
er D
elta
San
d
7
Tabl
e 2.
3. K
σ res
ults
from
ani
sotro
pica
lly c
onso
lidat
ed (K
0=0.
5) c
yclic
tors
iona
l she
ar te
sts o
n cl
ean
sand
s
σ 1c'
CR
Rσ
1c=1
Fine
s C
onte
ntPI
Rel
ativ
e D
ensi
tySe
lect
ed B
low
C
ount
Rel
ativ
e C
ompa
ctio
nSa
mpl
ing
Met
hod
Kσ
CR
RM
=7.5
,σ
vc=1
atm
Lab
Stra
inN
umbe
r of
Cyc
les
Fiel
d
K
0 = 0
.5Fi
eld
K0 =
1.0
0.1
0.16
7.5%
D.A
.15
0%54
%A
ir Pl
uvia
tion
1.19
0.15
0.22
0.3
0.16
7.5%
D.A
.15
0%54
%A
ir Pl
uvia
tion
1.11
0.15
0.22
Tabl
e 2.
4. K
σ res
ults
from
isot
ropi
cally
con
solid
ated
cyc
lic tr
iaxi
al te
sts o
n sa
nds w
ith si
l
σ 1c'
CR
Rσ
1c=1
Fine
s C
onte
ntPI
Rel
ativ
e D
ensi
tySe
lect
ed B
low
C
ount
Rel
ativ
e C
ompa
ctio
nSa
mpl
ing
Met
hod
Kσ
atm
Lab
Stra
inN
umbe
r of
Cyc
les
Fiel
d
K
0 = 0
.5Fi
eld
K0 =
1.0
Dun
can
Dam
2.0
22.
5% S
.A.
1510
%11
.5Fr
ozen
Sam
plin
g0.
940.
130.
193.
92
2.5%
S.A
. 15
10%
13.3
Froz
en S
ampl
ing
0.85
0.14
0.22
5.9
22.
5% S
.A.
1510
%14
.1Fr
ozen
Sam
plin
g0.
800.
150.
2311
.82
2.5%
S.A
. 15
10%
14.7
Froz
en S
ampl
ing
0.78
0.16
0.23
2.0
0.22
5% S
.A.
1518
%N
P61
%87
% D
WP
Std.
Moi
st T
ampi
ng0.
850.
130.
204.
00.
225%
S.A
.15
18%
NP
61%
87%
DW
P St
d.M
oist
Tam
ping
0.74
0.13
0.20
Low
er S
an F
erna
ndo
Dam
She
ll3.
10.
305%
D.A
.10
35%
Silty
Shel
by tu
be0.
710.
160.
24Se
ed e
t al.
(197
3)0.
50.
271
1035
%N
P79
% S
td. A
ASH
OM
oist
Tam
ping
1.31
0.14
0.21
2.0
0.27
110
35%
NP
79%
Std
. AA
SHO
Moi
st T
ampi
ng0.
880.
140.
212.
40.
235%
S.A
.10
19%
7Fi
xed
Pist
on0.
870.
120.
192.
40.
305%
S.A
.10
17%
12Fi
xed
Pist
on0.
760.
160.
242.
40.
385%
S.A
.10
7%20
Fixe
d Pi
ston
0.69
0.20
0.30
2.4
0.45
5% S
.A.
1010
%26
Fixe
d Pi
ston
0.68
0.24
0.36
Upp
er S
an F
erna
ndo
Dam
She
ll2.
00.
275%
D.A
.10
30%
Silty
Shel
by tu
be0.
830.
140.
22Se
ed e
t al.
(197
3)Fo
otno
tes:
1. F
ailu
re w
as d
efin
ed a
s "su
dden
liqu
efac
tion
and
deve
lopm
ent o
f lar
ge st
rain
s"2.
Cyc
lic st
reng
ths a
t 1 a
tmos
pher
e ba
sed
on a
vera
ge v
alue
s fro
m Y
oud
et a
l. (2
001)
and
Idris
s and
Bou
lang
er (2
008)
trig
gerin
g cu
rves
for s
elec
ted
blow
cou
nt.
Tabl
e 2.
5. K
σ res
ults
from
isot
ropi
cally
con
solid
ated
cyc
lic tr
iaxi
al te
sts o
n cl
ayey
sand
σ 1c'
CR
Rσ
1c=1
Fine
s C
onte
ntPI
Rel
ativ
e D
ensi
tySe
lect
ed B
low
C
ount
Rel
ativ
e C
ompa
ctio
nSa
mpl
ing
Met
hod
Kσ
atm
Lab
Stra
inN
umbe
r of
Cyc
les
Fiel
d
K
0 = 0
.5Fi
eld
K0 =
1.0
2.9
0.58
5% S
.A.
1528
%25
25Pi
tche
r Sam
pler
0.64
0.35
0.52
2.9
0.51
5% S
.A.
1523
%20
28Pi
tche
r Sam
pler
0.60
0.31
0.46
Tabl
e 2.
6. K
σ res
ults
from
isot
ropi
cally
con
solid
ated
cyc
lic tr
iaxi
al te
sts o
n he
avily
com
pact
ed sa
nd
σ 1c'
CR
Rσ
1c=1
Fine
s C
onte
ntPI
Rel
ativ
e D
ensi
tySe
lect
ed B
low
C
ount
Rel
ativ
e C
ompa
ctio
nSa
mpl
ing
Met
hod
Kσ
atm
Lab
Stra
inN
umbe
r of
Cyc
les
Fiel
d
K
0 = 0
.5Fi
eld
K0 =
1.0
Sacr
amen
to R
iver
San
d4.
80.
735%
S.A
.10
0%10
0%M
oist
Tam
ping
0.80
0.39
0.58
Seed
and
Lee
(196
5)5.
70.
515%
S.A
.30
35%
Cla
yey
95%
DW
R S
td.
Moi
st T
ampi
ng0.
370.
380.
565.
70.
935%
S.A
.30
35%
Cla
yey
100%
DW
R S
td.
Moi
st T
ampi
ng0.
310.
691.
032.
50.
805%
S.A
.15
30%
545
Fixe
d Pi
ston
0.53
0.48
0.72
40.
805%
S.A
.15
31%
745
Pitc
her S
ampl
er0.
550.
480.
720.
50.
775%
S.A
.15
24%
NP
95%
DW
P St
d.M
oist
Tam
ping
1.44
0.46
0.69
1.9
0.77
5% S
.A.
1524
%N
P95
% D
WP
Std.
Moi
st T
ampi
ng0.
690.
460.
690.
51.
035%
S.A
.15
24%
NP
98%
DW
P St
d.M
oist
Tam
ping
1.42
0.62
0.93
1.9
1.03
5% S
.A.
1524
%N
P98
% D
WP
Std.
Moi
st T
ampi
ng0.
700.
620.
930.
670.
675%
D.A
. 10
7%95
% M
od. A
ASH
OM
oist
Tam
ping
1.27
0.36
0.54
1.37
0.67
5% D
.A.
107%
95%
Mod
. AA
SHO
Moi
st T
ampi
ng0.
820.
360.
542.
710.
675%
D.A
. 10
7%95
% M
od. A
ASH
OM
oist
Tam
ping
0.76
0.36
0.54
Sam
ple
Nam
eFa
ilure
Crit
erio
nR
efer
ence
Seed
(197
0)
CD
WR
(198
5)
Sam
ple
Nam
e
Sam
ple
Nam
eFa
ilure
Crit
erio
n
Sam
ple
Nam
eFa
ilure
Crit
erio
n
CR
RM
=7.5
,σv
c=1
CR
RM
=7.5
,σv
c=1
CR
RM
=7.5
,σv
c=1
Toyo
ra S
and
Kos
eki e
t al.
(200
5)
LAD
WP
(197
3)
Won
g et
al.
(197
8)
Ref
eren
ce
CD
WR
(198
9)
CD
WR
(198
9)
Seed
et a
l. (1
968)
Ref
eren
ce
Ref
eren
ce
LAD
WP
(197
3)
Pilla
i and
Byr
ne (1
994)
New
Jers
ey B
ackf
ill F
P1
Los A
ngel
es D
am S
hell
Ant
elop
e D
am Im
perv
ious
Mat
eria
l
Perr
is D
am S
hell
Failu
re C
riter
ion
Ther
mal
ito F
oreb
ay D
am F
ound
atio
n
Ther
mal
ito A
fterb
ay D
am F
ound
atio
n
Shef
field
Dam
She
ll
Fairm
ont D
am
8

9
Table 2.7. Kσ results from specimens with data quality issues. tested ranged from clayey gravel to sandy silt. Any interpretation of the effects of overburden stress on the cyclic strength would likely be affected by these variations in material type and plasticity.
The original sources for the rest of the data presented by Seed and Harder (1990) were then
re-examined to evaluate the specimen composition, test procedures and strength results for each individual data set. This evaluation was conducted by reviewing the original sources for each of the data sets, which included various dam project files located in the archives of the California Division of Safety of Dams and various publications in the literature. From this information, it was possible to categorize the specimens in terms of composition and to examine patterns in the data. The re-interpreted values of Kσ from this study were within a few percent of the values plotted in Seed and Harder (1990), with few exceptions as noted later.
The updated, or re-interpreted, values of Kσ from Seed and Harder (1990) were then augmented using data from more recent laboratory studies on reconstituted sands by Vaid and Thomas (1995), Vaid and Sivalythalyn (1996), Koseki et al. (2005) and Manmatharajan and Sivathayalan (2011) and on frozen sand samples from Duncan Dam by Pillai and Byrne (1994). For cases where the full details of the cyclic loading responses were available, the failure criterion used to determine the onset of liquefaction was set at + 2.5% single amplitude (SA) axial strain in 15 cycles. For cases where the full details of cyclic loading responses were not available, the failure criterion reported by the original authors was used (e.g., 5% double-amplitude (DA) axial strain in 10 cycles). The failure criteria for each data set are listed in Tables 2.1 through 2.6. Kσ values were calculated for each data set using the laboratory CRR (CRRlab) for the selected criterion. In some cases, cyclic test results were not available at an overburden stress of 1 atm and thus interpolation between available data was necessary for determining the value of CRRlab at 1 atm (i.e., CRRlab,σ'vc=1). If the original authors provided an interpolated value for CRR lab,σ'vc=1, this value was used in this report. If the original authors did not provide an interpolated value for CRR lab,σ'vc=1, a value was determined by taking the average of the values obtained by fitting the available CRRlab data with both a power function and a logarithmic function.
The CRRlab for each individual data set was then converted to an equivalent field CRR
(CRRM=7.5,σ'vc=1,α=0) for comparison with liquefaction triggering relationships. This conversion was performed using the methods summarized in Idriss and Boulanger (2008). The CRRlab was first corrected for the effects of differing coefficient of lateral earth pressure at rest (K0) between the isotropically consolidated triaxial and anisotropically consolidated torsional shear tests and
Specimen Name σ1c' Kσ
Reason for Elimination
(atm) Lake Arrowhead 2.0 0.86
Only one triaxial test was performed at a consolidation stress above 1 atm.
Upper San Leandro Dam Shell
2.0 0.89 Specimens tested ranged from clayey gravel to sandy silt. The specimens D50 ranged from 0.06 to 7 mm and 4 specimens had a PI > 9. Too varied to determine accurate Kσ. 4.0 0.68

10
the field conditions. This correction requires an estimate of K0 in the field which is difficult to obtain with confidence. To cover the range typically used in liquefaction problems, each of the CRRlab values from cyclic triaxial and torsional shear tests were adjusted to an assumed field K0 of 0.5 and 1.0. No K0 correction was applied to the results of cyclic simple shear test results, based on the assumption that the Ko conditions in the simple shear device are representative of those in the field. The effects of two-dimensional shaking in the field were accounted for by multiplying the CRRlab by a correction factor of 0.9. To normalize for the effects of loading cycles, the CRRlab values were either selected at 15 uniform loading cycles or converted to 15 uniform cycles by assuming that the CRR versus number of cycles curve could be fit using a power law with an exponent of -0.3. The complete equation to convert the CRRlab to an equivalent field CRRM=7.5,σ'vc=1,α=0 is:
0
7.5, , 00
1 20.9
15 1 2
bfieldlab
M lab
lab
KNCRR CRR
K
(2.1)
where Nlab is the number of cycles to liquefaction measured in the laboratory and b is equal to 0.3. For the simple shear data, (K0)lab was assumed to be equal to (K0)field, as mentioned above. This equation was used to convert the CRRlab values listed in Tables 2.1 through 2.6 to equivalent field CRRM=7.5,σ'vc=1,α=0 values, the results of these conversions will be used for
comparing the laboratory results to different K relationships in a following section of this report.
In some cases, an examination of the original data sources produced Kσ values that did not as
closely match the values in the Seed and Harder (1990) database. Some of the differences were due to selecting different failure criteria than originally used by Seed and Harder (1990). Two of the original sources also had additional data which had not been previously included and one source was found to have fewer data points than had been previously included. Three Kσ data points have a difference of more than 10% from the Seed and Harder (1990) values with the largest difference being 13%.
The Kσ results were separated into the four soil type categories plotted separately in Figures
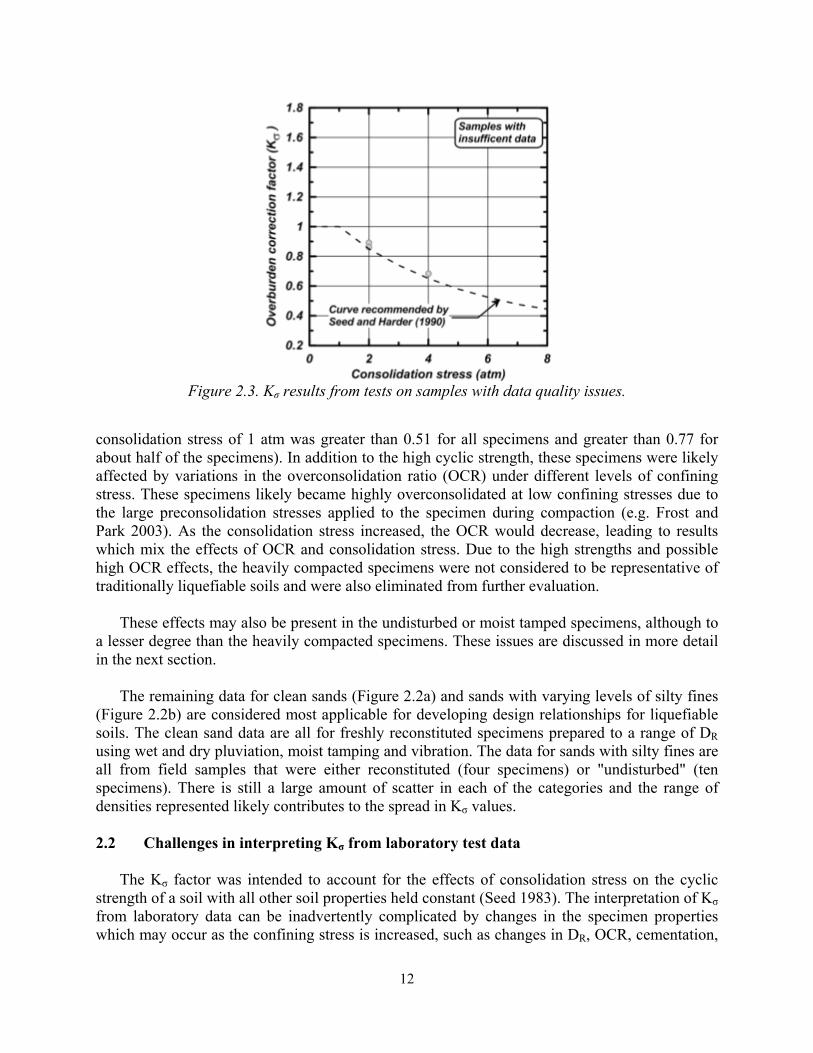
2.2a through 2.2d: clean sands (sands with 5% fines or less, 52 data points), sands with varying levels of silty fines (14 data points), clayey sands (2 data points), and well-compacted specimens (12 data points). Properties for each soil grouping are listed in Tables 2.1 through 2.6, although not all of the desired properties were available for each of the soils. The two sets of data previously eliminated from this study due to insufficient details (Lake Arrowhead and Upper San Leandro) are listed in Table 2.7 and shown in Figure 2.3. Each of the categories is shown with the curve recommended by Seed and Harder (1990) for comparison purposes.
The results for the clayey sands (fines contents of 23 to 28%, plasticity indices of 20 to 25), as plotted in Figure 2.2c, were considered to be of limited value when examining the liquefaction potential of cohesionless soils. This is because plastic fines have been shown to influence the response of a soil to cyclic loading (e.g. Boulanger and Idriss 2006, Bray and Sancio 2006). The effects of the fines' plasticity on Kσ are not clear, but this data was not considered useful for evaluating the behavior of clean sands or sands with primarily nonplastic silty fines which are

11
traditionally evaluated using liquefaction triggering curves. For these reasons, the data for clayey sands (two data points) were eliminated from further consideration.
The data from well-compacted soils (fines content of 7 to 35%, 12 data points), as plotted in
Figure 2.2d, were also considered to be of limited value for determining the response of liquefiable materials. These soils had: (a) all been compacted to a relative compaction of 95% or larger [per DWR (20,000 ft-lb/cu. ft.), L.A. Water System (33,750 ft-lb/cu. ft.) or Mod. AASHO standards (56,000 ft-lb/cu ft.)]; (b) been compacted to a DR of 100%; or (c) had in situ blow counts of 45. In addition, these soils all exhibited high cyclic triaxial strengths (i.e., without the Ko and 2-D shaking corrections, the CRRlab,σ'vc=1 in 15 uniform loading cycles at an effective
Figure 2.2. The current database is composed of several different soil types including clean laboratory sands, sands mixed with fines of varying plasticity and heavily compacted
samples. Each of the data sets is compared with the curve developed by Seed and Harder (1990).
12
consolidation stress of 1 atm was greater than 0.51 for all specimens and greater than 0.77 for about half of the specimens). In addition to the high cyclic strength, these specimens were likely affected by variations in the overconsolidation ratio (OCR) under different levels of confining stress. These specimens likely became highly overconsolidated at low confining stresses due to the large preconsolidation stresses applied to the specimen during compaction (e.g. Frost and Park 2003). As the consolidation stress increased, the OCR would decrease, leading to results which mix the effects of OCR and consolidation stress. Due to the high strengths and possible high OCR effects, the heavily compacted specimens were not considered to be representative of traditionally liquefiable soils and were also eliminated from further evaluation.
These effects may also be present in the undisturbed or moist tamped specimens, although to
a lesser degree than the heavily compacted specimens. These issues are discussed in more detail in the next section.
The remaining data for clean sands (Figure 2.2a) and sands with varying levels of silty fines
(Figure 2.2b) are considered most applicable for developing design relationships for liquefiable soils. The clean sand data are all for freshly reconstituted specimens prepared to a range of DR using wet and dry pluviation, moist tamping and vibration. The data for sands with silty fines are all from field samples that were either reconstituted (four specimens) or "undisturbed" (ten specimens). There is still a large amount of scatter in each of the categories and the range of densities represented likely contributes to the spread in Kσ values.
2.2 Challenges in interpreting Kσ from laboratory test data
The Kσ factor was intended to account for the effects of consolidation stress on the cyclic strength of a soil with all other soil properties held constant (Seed 1983). The interpretation of Kσ
from laboratory data can be inadvertently complicated by changes in the specimen properties which may occur as the confining stress is increased, such as changes in DR, OCR, cementation,
Figure 2.3. Kσ results from tests on samples with data quality issues.

13
and reorientation of particle fabric. For example, as specimens are consolidated to higher stress levels, the void ratio will decrease and, if this is not accounted for, Kσ may be evaluated based on specimens tested at different DR. This effect has likely influenced many of the previously published test results with the exception of carefully controlled experimental studies, such as Vaid and Sivathayalan (1996) where changes in void ratio were carefully monitored during consolidation of reconstituted specimens or Pillai and Byrne (1994) where changes in void ratio were accounted for in their interpretation of cyclic test data on frozen sand samples from Duncan Dam. The effect of not accounting for the lower void ratio at higher consolidation stresses is to produce Kσ curves with a weaker dependence on σ'vc. These and other factors cannot be isolated or eliminated from the current Kσ database. The potential magnitude of such effects is discussed in the following sections. 2.2.1 Effect of relative density on Kσ
An example of how DR and consolidation stress affect cyclic strengths and Kσ values is
shown in Figure 2.4 using data from Thermalito Afterbay (CDWR 1989). Cyclic triaxial tests were performed on “undisturbed” samples of the silty sand foundation obtained using fixed piston samplers. The test results were grouped by average (N1)60 values for the strata from which the samples were obtained. The cyclic strength of the soils increased with increasing blow count and increasing confinement (Figure 2.4a), as expected. The envelope of cyclic strength versus consolidation stress is curved, such that the cyclic resistance ratio (i.e., the secant slope of the envelope) decreases as the confinement is increased. The corresponding Kσ values are shown in Figure 2.4b, illustrating how Kσ curves generally became more strongly dependent on σ'vc as the average (N1)60 (and hence DR) of the soil increased and the envelope of cyclic strength versus consolidation stress became more strongly curved (Figure 2.4a).
The effect of DR on Kσ has also been demonstrated from a theoretical standpoint (Hynes and
Olsen 1999, Boulanger 2003) and through carefully controlled laboratory tests by Vaid and Thomas (1995) on reconstituted specimens of Fraser River sand prepared at DR of 31%, 40%, 59% and 72% (Figure 2.5). This is an important effect which must be accounted for when
Figure 2.4. Cyclic triaxial strengths and Kσ values for undisturbed samples of silty sand
foundation materials from Thermalito Afterbay (data from CDWR 1989)
14
interpreting results from the laboratory test database or when selecting design relationships. Using a Kσ relationship that is independent of DR will thus be conservative for loose soils and unconservative for dense soils.
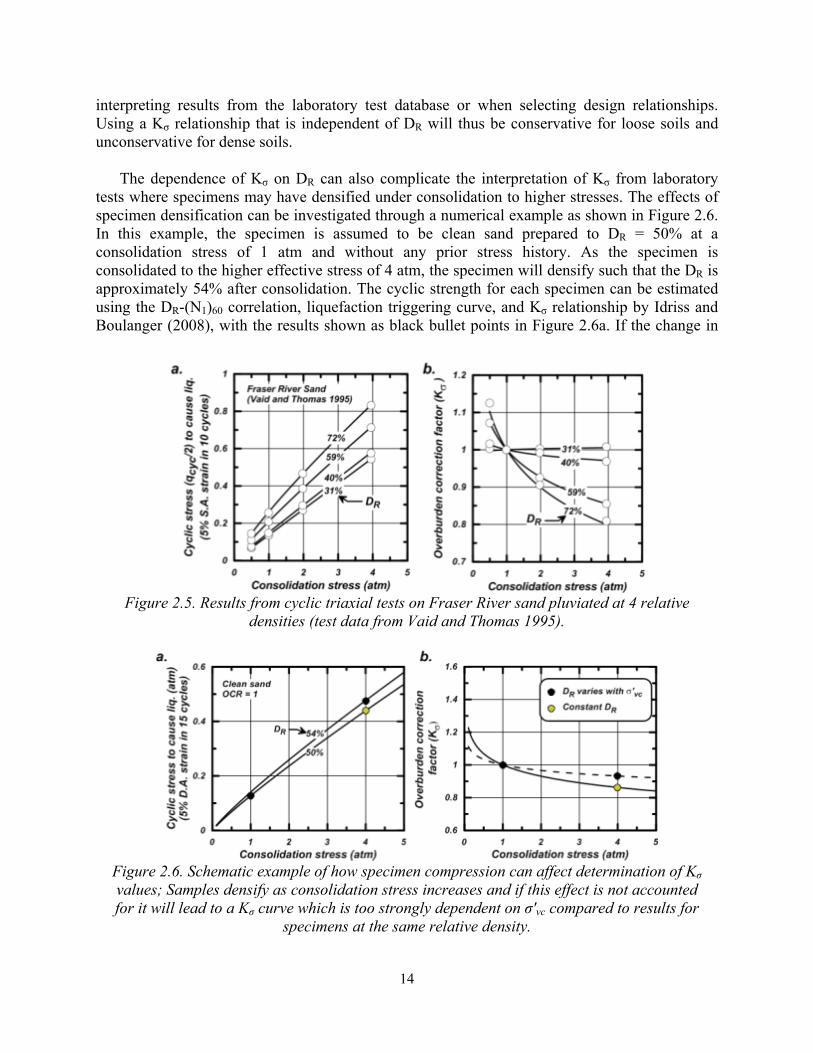
The dependence of Kσ on DR can also complicate the interpretation of Kσ from laboratory tests where specimens may have densified under consolidation to higher stresses. The effects of specimen densification can be investigated through a numerical example as shown in Figure 2.6. In this example, the specimen is assumed to be clean sand prepared to DR = 50% at a consolidation stress of 1 atm and without any prior stress history. As the specimen is consolidated to the higher effective stress of 4 atm, the specimen will densify such that the DR is approximately 54% after consolidation. The cyclic strength for each specimen can be estimated using the DR-(N1)60 correlation, liquefaction triggering curve, and Kσ relationship by Idriss and Boulanger (2008), with the results shown as black bullet points in Figure 2.6a. If the change in
Figure 2.5. Results from cyclic triaxial tests on Fraser River sand pluviated at 4 relative
densities (test data from Vaid and Thomas 1995).
Figure 2.6. Schematic example of how specimen compression can affect determination of Kσ values; Samples densify as consolidation stress increases and if this effect is not accounted for it will lead to a Kσ curve which is too strongly dependent on σ'vc compared to results for
specimens at the same relative density.

15
DR is not accounted for, the interpreted Kσ (Figure 2.6b) will include both the decrease in CRR due to the increase in consolidation stress and the increase in CRR due to specimen densification. These two effects compensate and will lead to the interpretation of a Kσ curve that is too weakly dependent on σ'vc (higher Kσ values at stresses greater than 1 atm) than would have been measured had the specimens been tested at the same DR, as illustrated by the yellow bullet points in Figure 2.6b. Pillai and Byrne (1994) performed a similar analysis of the cyclic testing test data for Duncan Dam and showed a similar effect on the interpretation of Kσ values.
In actual investigations of soils under high confining pressures, such as beneath large dams, it
is presumed that the penetration testing would reflect the increase in density resulting from consolidation. The K values interpreted from laboratory tests would therefore ideally not include any effects of increasing density with consolidation stress. However, many laboratory studies that form the basis of the current Kσ database presented in this report did not account for or report changes in DR with consolidation stress and therefore may have some degree of unconservatism, as demonstrated in Figure 2.6.
2.2.2 Effect of specimen overconsolidation on Kσ
The effects of OCR varying with consolidation stress can be even more important to the
interpretation of Kσ and can lead to misleading results if it is not accounted for. Experimental results have shown that the cyclic strength of a soil increases with increasing OCR, as illustrated by Ishihara et al.'s (1978) experimental results for Takasuga sand at OCR of 1.0, 1.5 and 2.0 as shown in Figure 2.7. Terzaghi et al. (1996) found that cyclic test results from clean sands with varying OCR could be fit well by:
mOC NCCRR CRR OCR (2.2)
Figure 2.7. Cyclic triaxial tests on Takasoga soil at different levels of OCR (data after
Ishihara et al. 1978) show that the cyclic resistance ratio increases with increasing OCR. This data can be fit using the relationship suggested by Terzaghi et al. (1996).

16
The exponent m was found to range between 0.35 and 0.64 (Terzaghi et al. 1996). The test results by Ishihara et al. (1978) in Figure 2.7 are, for example, well fit by an exponent of 0.4. The effect of OCR on cyclic strength is not often accounted for in design, but can be very important when examining laboratory test results from undisturbed or reconstituted specimens.
The potential effect of varying the specimen OCR on the interpretation of Kσ can also be illustrated through a numerical example. In this example, it is assumed that identical specimens of clean sand at DR = 50% are obtained from a block sample having a preconsolidation stress (σ'vp) of 2 atm and that the specimens are then tested at consolidation stresses of 0.5, 1.0, 2.0, and 4.0 atm. The specimens would therefore have OCR values of 4, 2, 1, and 1 at these four consolidation stresses, respectively. For this example it is assumed that the specimens have the same DR at all consolidation stresses. The CRR is assumed to increase with increasing OCR according to Equation 2.2, with the exponent m = 0.4. The resulting "raw" data produces a sharply curved envelope of cyclic strength versus consolidation stress, as shown by the black bullets in Figure 2.8a. The Kσ values interpreted from the raw data will produce Kσ curves with an artificially strong dependence on σ'vc, as illustrated in Figure 2.8b. The true Kσ curve would be much less dependent on σ'vc, as shown by the yellow bullet points in Figure 2.8b; note that the true Kσ curve is independent of OCR (i.e., as long as all test specimens have the same DR) in this example. The potential error in Kσ interpretations due to the OCR varying with consolidation stress in this example was greater in magnitude, but opposite in direction than the error due to varying DR in the previous example (Figure 2. 6).
It can be difficult to control or evaluate OCR values when testing either undisturbed or laboratory prepared specimens. If undisturbed specimens are tested at consolidation stresses lower than their in situ stress, then the specimens will have OCR values that increase with decreasing consolidation stress. If undisturbed specimens of over-consolidated soil are tested at consolidation stresses greater than existed in situ, then the specimens will have OCR values that
Figure 2.8. Schematic example of how the preconsolidation stresses can affect
determination of Kσ values. When samples having the same preconsolidation stress are tested at different consolidation stresses, they may have different over-consolidation ratios (OCR). This can lead to the interpretation of a Kσ curve which is too strongly
dependent on σ'vc compared to tests on samples at the same OCR.

17
decrease with increasing consolidation stresses. Consequently, if specimens having the same in situ preconsolidation stress are tested at different levels of consolidation stress, the results will likely mix the effects of OCR and confining stress. This effect has been observed by Bray and Sancio (2006) in test results on undisturbed samples of potentially liquefiable silts. This is reinforced by a comparison of test results on undisturbed samples (Sancio 2003) and reconstituted specimens (Donahue et al. 2008) of the same material which show how tests on undisturbed samples can produce Kσ curves with a stronger dependence on σ'vc. The differences are likely due in part to the effects of varying OCR.
The effects of varying OCR in tests on undisturbed samples can also be demonstrated by
examining the data by Yoshimi et al. (1984) from frozen samples of an overconsolidated sand layer. Yoshimi et al. (1984) used ground freezing to sample dense, alluvial sand at a depth of approximately 10 meters (effective overburden stress of about 1 atm). Based on the alluvial environment and the laboratory test results, the in situ sand likely had some level of overconsolidation. Cyclic triaxial tests were performed on the specimens at isotropic
Figure 2.9. Results from cyclic triaxial tests performed on frozen samples of dense alluvial
sand assuming a preconsolidation stress of 150 kPa (data after Yoshimi et al. 1984).
18
consolidation stresses (σ'3c) of 0.5, 1.0 and 2.0 atm (Figure 2.9). All specimens were assumed to have a preconsolidation stress of 1.5 atm for this example, so the OCR of the specimens in the laboratory decreased from 3.0 at σ'3c =0.5 atm to 1.0 at σ'3c =2.0 atm. The cyclic strength can be approximately corrected for the effects of OCR using Equation 2.2 and assuming the exponent m is equal to 0.4 (based on the results shown in Figure 2.7 for clean sand tested in a cyclic triaxial device). The cyclic strengths with and without this correction are shown in Figure 2.9b, from which the Kσ curves in Figure 2.9d were obtained. The results obtained for specimens at different OCR would lead to the interpretation of a Kσ curve which is too strongly dependent on σ'vc, whereas the corrected results show a curve which appears to be closer in shape to other clean sand data.
One assumption present in both of the previous examples is that overconsolidation does not
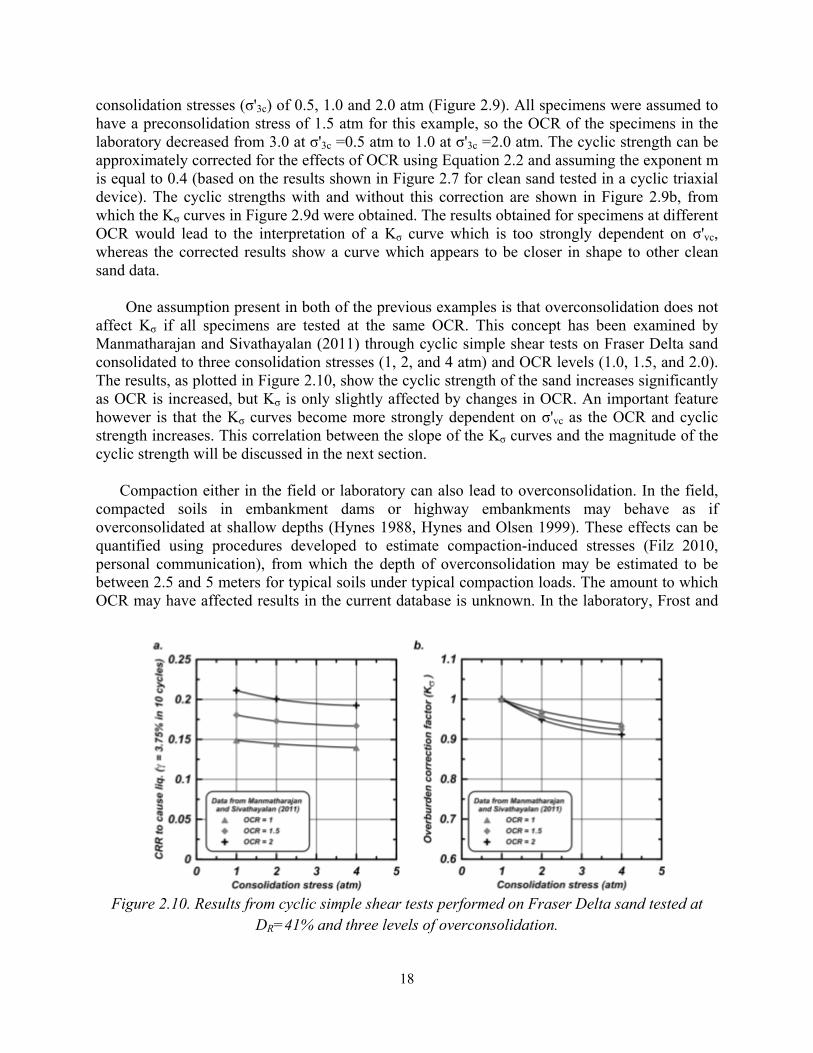
affect Kσ if all specimens are tested at the same OCR. This concept has been examined by Manmatharajan and Sivathayalan (2011) through cyclic simple shear tests on Fraser Delta sand consolidated to three consolidation stresses (1, 2, and 4 atm) and OCR levels (1.0, 1.5, and 2.0). The results, as plotted in Figure 2.10, show the cyclic strength of the sand increases significantly as OCR is increased, but Kσ is only slightly affected by changes in OCR. An important feature however is that the Kσ curves become more strongly dependent on σ'vc as the OCR and cyclic strength increases. This correlation between the slope of the Kσ curves and the magnitude of the cyclic strength will be discussed in the next section.
Compaction either in the field or laboratory can also lead to overconsolidation. In the field,
compacted soils in embankment dams or highway embankments may behave as if overconsolidated at shallow depths (Hynes 1988, Hynes and Olsen 1999). These effects can be quantified using procedures developed to estimate compaction-induced stresses (Filz 2010, personal communication), from which the depth of overconsolidation may be estimated to be between 2.5 and 5 meters for typical soils under typical compaction loads. The amount to which OCR may have affected results in the current database is unknown. In the laboratory, Frost and
Figure 2.10. Results from cyclic simple shear tests performed on Fraser Delta sand tested at
DR=41% and three levels of overconsolidation.

19
Park (2003) measured the forces applied to specimens during moist tamping (Figure 2.11). This measurement was performed by instrumenting the tamping rod to measure the amount of axial force applied to the sand during preparation. The magnitude of the applied force was found to increase as the DR of the specimen increased (Figure 2.11). For specimens prepared to DR greater than 60%, the specimens may be overconsolidated at stresses less than 100 kPa. For the present study, well-compacted specimens (Figure 2.2d) were eliminated from further consideration in part due to this effect; this included three soils prepared to relative compactions of 95% or greater (per DWR, LA Water System and Mod. AASHO standards), one soil having in situ SPT blow counts of 45 and one soil moist tamped to DR=100%. Other moist tamped specimens
Figure 2.11. The moist tamping technique applies stresses which may cause samples to be
overconsolidated if tested at low consolidation stresses (after Frost and Park 2003).
Figure 2.12. The database contains several samples which were prepared by moist tamping
which may have introduced some effects of overconsolidation at stresses less than 1 atm.
20
(prepared to DR less than 78% or relative compactions less than 87%) were not eliminated (Figure 2.12) because the severity of the effect from moist tamping is difficult to evaluate and it is expected to be less significant than for well-compacted soils. It is, however, noted that the data for most-tamped specimens also likely exhibit some effects from changing OCR especially at low stresses.
Data for undisturbed samples may also be affected by overconsolidation or aging in the field.
Natural, sandy deposits are likely to have some amount of overconsolidation in situ, but the nature of conventional sampling and specimen preparation may sufficiently disturb or disrupt the soil fabric such that the effects of prior overconsolidation on CRR are lost. It is not possible to assess the degree to which overconsolidation may or may not have affected the interpretation of K values from tests on undisturbed samples in the current database.
In actual investigations of soils under high confining pressures, such as beneath large dams, it
is presumed that the penetration testing would reflect the reductions in OCR level resulting from consolidation. The K values interpreted from laboratory tests would therefore ideally not include any effects of varying OCR with consolidation stress. However, some of the laboratory studies (e.g., those involving field samples and/or moist tamping preparation techniques) that form the basis of the current Kσ database presented in this report may include changes in OCR with consolidation stress and therefore may have some degree of conservatism, as demonstrated in Figures 2.8 and 2.9. 2.2.3 Other factors which influence Kσ
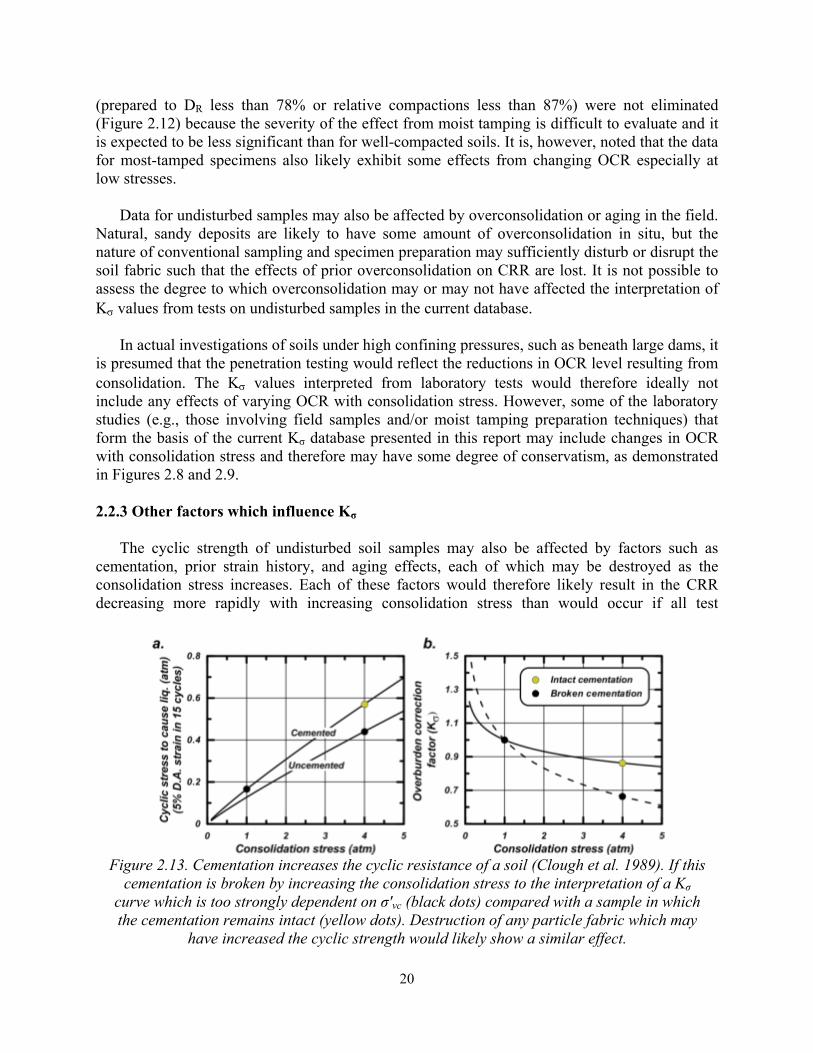
The cyclic strength of undisturbed soil samples may also be affected by factors such as cementation, prior strain history, and aging effects, each of which may be destroyed as the consolidation stress increases. Each of these factors would therefore likely result in the CRR decreasing more rapidly with increasing consolidation stress than would occur if all test
Figure 2.13. Cementation increases the cyclic resistance of a soil (Clough et al. 1989). If this
cementation is broken by increasing the consolidation stress to the interpretation of a Kσ curve which is too strongly dependent on σ'vc (black dots) compared with a sample in which the cementation remains intact (yellow dots). Destruction of any particle fabric which may
have increased the cyclic strength would likely show a similar effect.
21
specimens were in fact identical, as schematically illustrated in Figure 2.13. This could lead to the interpretation of a Kσ curve which is too strongly dependent on σ'vc and may be an issue when examining laboratory test results from undisturbed samples of sands. However, the nature of conventional sampling and specimen preparation may disturb or disrupt such effects, as previous discussed, such that the magnitude of these effects may vary and be difficult to assess.
The Kσ factor may also be affected by various soil characteristics including the fines content
(Stamatopolous 2010) and fines plasticity. This effect is not well constrained by available data, but the current database has been separated according to fines content in an attempt to isolate some of these effects. Results for each of the categories and the implications of this dependence on fines content will be discussed more in the next section. 2.3 Summary
Changes in soil properties (e.g., DR, OCR, cementation) with consolidation stress can have significant effects on cyclic strengths, but these effects should not be confused with, or mixed with, the intended purpose of the Kσ relationship. Changes in properties such as DR, OCR, or cementation can be expected to affect both the CRR and N60 values for a soil. The magnitudes of these changes are not well defined, but the underlying presumption of penetration test-based liquefaction procedures is that their effects on CRR are reasonably accounted for by: (1) the simultaneous changes in measured N60 values, (2) the applicability of the CN relationship for obtaining (N1)60 values, (3) the presumed relative uniqueness of the CRRM=7.5,σ'vc=1,α=0 versus (N1)60cs correlation, and (4) the applicability of the Kσ relationship for obtaining CRRM=7.5,σ'vc,α=0 values. Thus, the Kσ relationship is only intended to account for how confining stress affects CRR values, whereas the effect on CRR of changes in other soil properties are currently accounted for through their effects on N60 values.
An effort has been made to remove some of the above-described adverse influences from the updated Kσ database, but it is not possible to eliminate all of their effects. The moist tamped and possibly the vibrated specimens in the database likely have been influenced by the effects of OCR at low stress levels which would contribute to Kσ curves with an overly strong dependence on σ'vc. The results for undisturbed samples in the database are likely affected by the simultaneous, and sometimes compensating, influences of varying cementation, OCR, and DR as samples were consolidated to different stresses than existed in situ.

22
3. COMPARISON OF DATABASE AND CURRENT RELATIONSHIPS
One of the benefits of the updated database is the ability to compare current relationships to a
large body of laboratory tests performed on a variety of soils at different densities. The relationships by Idriss and Boulanger (2008) and Hynes and Olsen (1999), with the parameters recommended in Youd et al. (2001), were chosen for this comparison because they both account for the dependence of K on DR. The Hynes and Olsen (1999) Kσ relationship is,
(1 )
'1.0
f
vc
a
KP
(3.1)
Youd et al. (2001) suggested values for f of 0.8, 0.7, and 0.6 for DR of 40, 60, and 80%, with f limited to being no smaller than 0.6 and no larger than 0.8. These values can be approximated by the linear relationship,
1 , 0.6 0.82
RDf f
Idriss and Boulanger (2008) recommended the relationship,
'1 ln 1.1vc
a
K CP
(3.2)
where the factor Cσ is defined in terms of DR as,
1
0.318.9 17.3 R
CD
(3.3)
The DR can estimated from the SPT blow count as,
1 60 cs
Rd
ND
C (3.4)
where, as previously noted, the value of Cd was taken as 46 by Idriss and Boulanger (2008) based on a review of work by Cubrinovski and Ishihara (1999), Meyerhoff (1957), and Skempton (1986). These two relationships are shown in Figure 3.1 and will be compared to the updated Kσ database later in this section. 3.1 Relating Kσ to CRRM=7.5,σ'vc=1,α=0
To compare the database to the design relationships descried above, it was necessary to find a
common measure of denseness for each of the specimens. No one measure of denseness (i.e., DR, blow count, relative compaction) was common to all data sets in the database. One approximate

23
measure of denseness common to all the soils is the CRRM=7.5,σ'vc=1,α=0. If the liquefaction triggering curve is assumed to be unique for all soils in the current database, this reference cyclic strength can be related to an equivalent (N1)60cs and then to a Kσ value (through the equivalent DR from eq. 3.4) for a given consolidation stress, as illustrated in Figure 3.2.
To perform this comparison, the cyclic strength for each of the soils was first converted to an equivalent field strength using the methods outlined by Idriss and Boulanger (2008). The specific factors used for the conversion were discussed in Section 2.1. The uncertainty in selecting an appropriate field value of K0 for this conversion warrants more discussion. In an isotropically consolidated cyclic triaxial test the laboratory K0 is equal to 1.0. However, K0 in the field could range from about 0.5 for a normally consolidated soil to about 1.0 for moderately overconsolidated soils. The effect of the assumed field K0 value on the interpretation of cyclic triaxial or torsional shear test data was evaluated by performing this adjustment with assumed field K0 values of 0.5 and 1.0. For the simple shear test results, no adjustment for K0 was made. After obtaining an equivalent field CRRM=7.5,σ'vc=1,α=0, this strength was mapped to an equivalent (N1)60cs through the corresponding liquefaction triggering curve from each of the methods (Youd et al. 2001 and Idriss and Boulanger 2008). The equivalent (N1)60cs value was then used to determine Kσ values using the equations given above for each of the two methods. This process is illustrated schematically in Figure 3.2.
The distribution of data points with respect to CRRM=7.5,σ'vc=1,α=0 was examined (Figure 3.3a-
c) for the purpose of sorting the data into bins of different CRRM=7.5,σ'vc=1,α=0 ranges. For clean sands the cyclic triaxial and torsional shear data was examined separately (Figure 3.3a) from the cyclic simple shear test data (Figure 3.3b). For sands with varying silt contents, the data are limited to cyclic triaxial tests and are shown in Figure 3.3c.From these distributions, bins were selected.
Figure 3.1. Two current relationships for Kσ which include a dependence on relative density.

24
The Kσ data for clean sands tested in triaxial and torsional shear were separated into three
bins with CRRM=7.5,σ'vc=1,α=0 values of 0.07 to 0.11 (Figure 3.4a), 0.14 to 0.17 (Figure 3.4c), and 0.22 to 0.25 (Figure 3.4e) adjusted to a field K0 of 0.5. Similarly, Figures 3.4b, 3.4d, and 3.4f show the same data adjusted a field K0 of 1.0. The larger K0 value increases the cyclic strength by 50%, but does not change the measured Kσ values or have an effect on the number of points within each bin. The design relationships from Youd et al. (2001) and Idriss and Boulanger (2008) are also shown in these figures for a DR that corresponds to a CRRM=7.5,σ'vc=1,α=0 value at
the middle of each bin's range (e.g., CRRM=7.5,σ'=1,=0 values of 0.09, 0.155, and 0.235 for K0 of 0.5 and 0.135, 0.225 and 0.35 for K0 of 1.0). The trends in the Kσ data generally become steeper as CRRM=7.5,σ'vc=1,α=0 increases, as expected. The Idriss and Boulanger (2008) relationship is in reasonable overall agreement with the data, whereas the Youd et al. (2001) relationship is generally conservative relative to the data.
The test data from clean sands tested in simple shear was separated into bins of
approximately equal size and similarly compared to the design relationships (Figure 3.5). The data from simple shear tests was not adjusted for the effects of K0 as previously discussed. The
Figure 3.2. Process for relating the cyclic strength at 1 atm to Kσ.

25
Kσ values for these data points fall well above the values predicted by the relationships suggested by Youd et al. (2001) and Idriss and Boulanger (2008), although the values are much closer to the latter. These tests were all from water pluviated specimens of Fraser River sand and do not exhibit the same scatter seen in the triaxial and torsional shear bins for a similar range of cyclic strength.
Figure 3.3. The distribution of data points with CRR1,field was used to determine proper bins
for subsequent comparisons with current design relationships.

26
Figure 3.4. The Kσ database for clean sands tested in triaxial or torsional shear devices was binned according to the cyclic strength at 1 atm and compared to a curve from each of the
relationships for a cyclic strength at the center of each bin. Two values for the field K0 were considered when converting from triaxial strength to field strength.

27
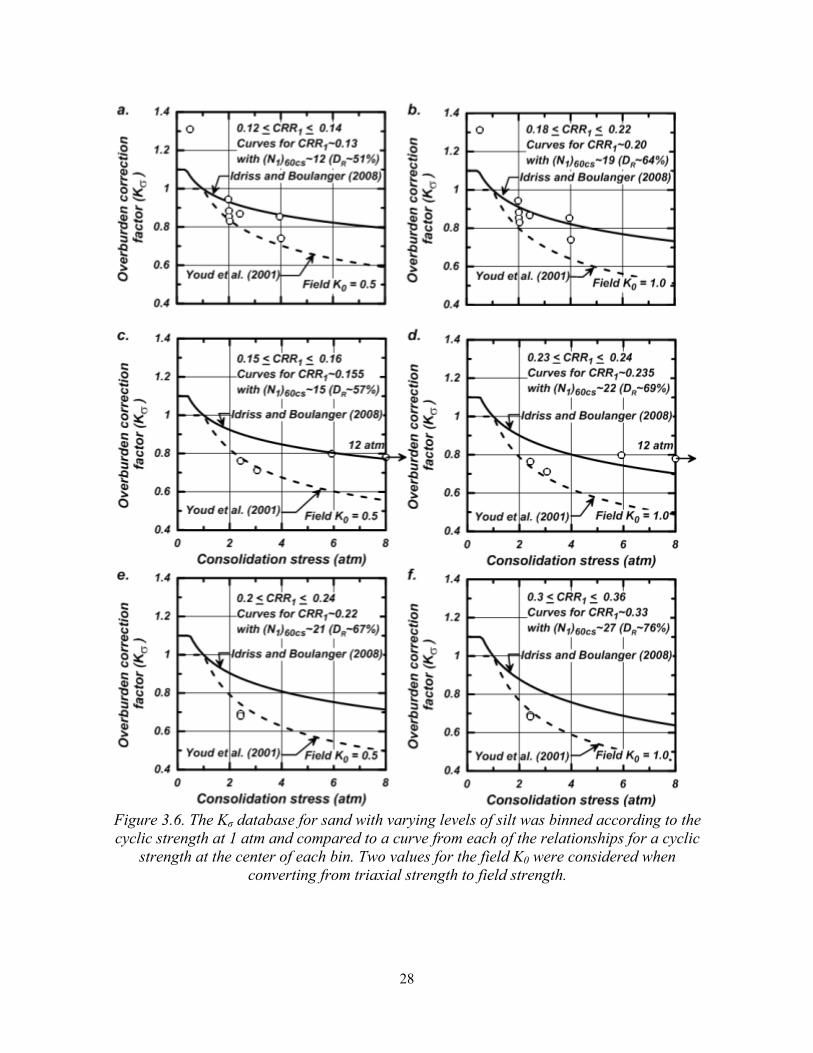
The test data for sands with varying levels of silty fines, all from cyclic triaxial tests, were similarly compared to the design relationships, with the results shown in Figure 3.6a-e. Much of the data falls in a narrower range of CRRM=7.5,σ'vc=1,α=0 values with a large number of the specimens having a CRRM=7.5,σ'vc=1,α=0 close to 0.14 for a K0 of 0.5. Two specimens had a significantly higher CRRM=7.5,σ'vc=1,α=0 than the rest of the points and were placed in a separate bin (Figure 3.6e-f). A similar trend of lower Kσ values with increasing CRRM=7.5,σ'vc=1,α=0 can be seen between the three bins. The data for the looser specimens, as shown in Figures 3.6a-d generally fall between the two relationships, while the two points in the higher bin (Figure 3.6e-f) agree better with Youd et al. (2001).
3.2 Residuals between data and current relationships
Residuals between the individual data points and their corresponding model predictions were
also computed. The model predictions were calculated for each individual data point using the corresponding CRRM=7.5,σ'vc=1,α=0. This process was completed for both the clean sands and sands with silt tested in triaxial or torsional shear devices using field K0 values of both 0.5 and 1.0. Data points from clean sands tested in simple shear devices were not adjusted for K0 for reasons previously discussed. The relationship by Youd et al. (2001) has a cap of 1.0 on Kσ as part of its coupling with the Seed et al. (1985) liquefaction triggering correlation which was not derived using Kσ. Therefore, the residuals for σ'vc less than 1 atm using the Youd et al. (2001) relationship (Figures 3.7 through 3.11) are not significant as this correlation was not intended to capture these effects.
Residuals from the clean sand specimens (cyclic triaxial, torsional shear and simple shear)
show that the relationship suggested by Idriss and Boulanger (2008) provides a reasonably good fit (Figures 3.7 and 3.8) whereas the relationship by Youd et al. (2001) generally underpredicts
Figure 3.5. The Kσ database for clean sands tested in a simple shear device was binned
according to the cyclic strength at 1 atm and compared to a curve from each of the relationships for a cyclic strength at the center of each bin. No K0 correction was made
because the laboratory K0 was assumed to be equal to the field K0.
28
Figure 3.6. The Kσ database for sand with varying levels of silt was binned according to the cyclic strength at 1 atm and compared to a curve from each of the relationships for a cyclic
strength at the center of each bin. Two values for the field K0 were considered when converting from triaxial strength to field strength.

29
Kσ for either value of field K0. For confining stresses greater than 1 atm, the relationship suggested by Idriss and Boulanger (2008) has an average residual near 0.0% for a K0 of 0.5 and 2.4% for a K0 of 1.0 over the full range of strengths and confining stresses. The relationship suggested by Youd et al. (2001) predicts lower Kσ values over the full range of strengths and confining stresses with an average residual of between 16.3% and 19.9% depending on the field K0. For stresses less than 1 atm, the relationship by Idriss and Boulanger (2008) fits the data similarly well with an average residual of 0.0% and -1.0% depending on the field K0.
Figure 3.7. Residuals between models and database for clean sands compared with the cyclic strength at 1 atm for two possible values for the field K0. The average residuals are shown for
consolidation stresses above and below 1 atm.
30
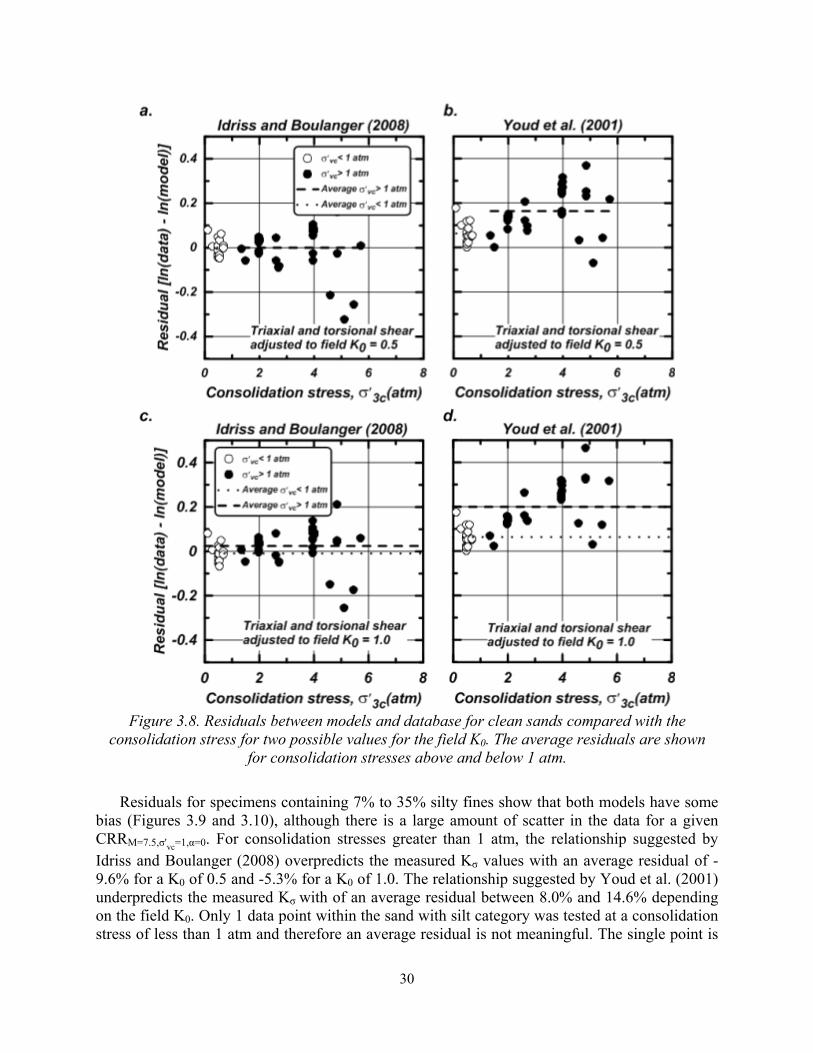
Residuals for specimens containing 7% to 35% silty fines show that both models have some
bias (Figures 3.9 and 3.10), although there is a large amount of scatter in the data for a given CRRM=7.5,σ'vc=1,α=0. For consolidation stresses greater than 1 atm, the relationship suggested by Idriss and Boulanger (2008) overpredicts the measured Kσ values with an average residual of -9.6% for a K0 of 0.5 and -5.3% for a K0 of 1.0. The relationship suggested by Youd et al. (2001) underpredicts the measured Kσ with of an average residual between 8.0% and 14.6% depending on the field K0. Only 1 data point within the sand with silt category was tested at a consolidation stress of less than 1 atm and therefore an average residual is not meaningful. The single point is
Figure 3.8. Residuals between models and database for clean sands compared with the
consolidation stress for two possible values for the field K0. The average residuals are shown for consolidation stresses above and below 1 atm.

31
based on moist tamped, reconstituted specimens from Sheffield Dam (Seed et al. 1968) with a measured Kσ of 1.3. The majority of the data for sand with silty fines are from undisturbed samples and thus are more likely affected by varying degrees of OCR, DR, cementation and aging effects across the range of imposed consolidation stresses.
The residuals are also plotted versus the fines content of the soils for both the Idriss and
Boulanger (2008) relationship (Figures 3.11a and 3.11b) and the Youd et al. (2001) relationship (Figures 3.11c and 3.11d). The Idriss and Boulanger (2008) relationship provides a reasonably good fit for clean sands, but tends to progressively overpredict Kσ values as the fines content increases. Over the full range of fines contents, the relationship suggested by Idriss and Boulanger (2008) has an average residual of -2.6% for a K0 of 0.5 and 0.0% for a K0 of 1.0 for
Figure 3.9. Residuals between models and database for sands with varying levels of silt compared with the cyclic strength at 1 atm for two possible values for the field K0. The average residual for consolidation stresses above 1 atm is shown as a dashed line.

32
consolidation stresses greater than 1 atm. The Youd et al. (2001) relationship generally under predicts the measured Kσ at the lower range of fines contents, but becomes in better agreement with the data at higher fines contents. Over the full range of fines contents, the relationship suggested by Youd et al. (2001) has an average residual of 14.1% for a K0 of 0.5 and 18.5% for a K0 of 1.0 for consolidation stresses greater than 1 atm. The database suggests Kσ curves become more strongly dependent on σ'vc as the fines content increases, which is similar to the findings of Stamatopolous (2010). It is important to note, however, that the majority of the specimens in this database with silty fines are from undisturbed samples and thus likely affected by varying degrees of OCR, DR, cementation and aging effects across the range of imposed consolidation stresses.
Figure 3.10. Residuals between models and database for sands with varying levels of silt compared with the consolidation stress for two possible values for the field K0. The average residual is shown as a dashed line.

33
3.3 Discussion
For clean sands, the residuals between the database and the two design relationships showed: (1) the relationship by Hynes and Olsen (1999) in combination with the parameters recommended by Youd et al. (2001) was conservative by an average residual of 16% to 20%, and (2) the relationship by Idriss and Boulanger (2008) provided a reasonably good fit to the data with an average residual of 0% to 2%.
For sands with varying levels of silt (fines contents between 7% and 35%), the residuals
showed: (1) the relationship by Hynes and Olsen (1999) in combination with the parameters
Figure 3.11. Residuals between models and database for both clean sands and sands with varying levels of silt compared with the fines content for two possible values for the field K0. The average residual is shown as a dashed line while the linear trend is shown as a
dash-dot line. Both are only shown for consolidation stresses above 1 atm.

34
recommended by Youd et al. (2001) was conservative by an average residual of 8% to 15%,with the average residual becoming closer to zero with increasing fines content, and (2) the relationship by Idriss and Boulanger (2008) was slightly unconservative with an average residual of -5% to -10%.
For specimens tested at less than 1 atm, the database indicates that the cap on Kσ of 1.1
recommended by Idriss and Boulanger (2008) fits well with the clean sand data. A single data point within the silty sand category would suggest that a higher cap on Kσ may be warranted, but this specimen was prepared through moist tamping which can apply a significant preconsolidation stress and lead to an over-estimation of Kσ as previously discussed. The relationship by Youd et al. (2001) has a cap of 1.0 on Kσ as part of its coupling with the Seed et al. (1985) liquefaction triggering correlation which was not derived using Kσ. Therefore, any comparisons between the Youd et al. (2001) relationship and Kσ values for σ'vc less than 1 atm are not significant as this correlation was not intended to capture these effects.
The more conservative nature of the K relationship recommended by Youd et al. (2001), at
least for clean sands, may be attributed to the fact it appears to have been guided, at least in part, by its comparison to the original Seed and Harder (1990) database. The original Seed and Harder (1990) database included the data from clayey sands (Figure 2.2c) and well-compacted sands with varying levels of silt and clay (Figure 2.2d), which together comprised the majority of their lowest data points (relative to their recommended design curve). The parameters recommended by Youd et al. (2001) produced curves that reasonably fit the Seed and Harder (1990) database.
The current database suggests that sands with nonplastic fines may have Kσ curves with a
stronger dependence on σ'vc (i.e. lower Kσ values) than clean sands, but this result is complicated by the fact that the majority of the silty sand studies involved testing of undisturbed samples. Test programs using undisturbed samples are, as discussed previously, most susceptible to the effects of varying DR, OCR, and cementation across the range of imposed consolidation stresses. The net effect of these factors is difficult to quantify, and thus it is suggested that laboratory testing of silty sands under more controlled conditions may be required to determine the effect that fines content may have on K relationships.
The fines content in sand can also be expected to affect the overburden correction factor for
penetration resistances (CN), which is equally important for the assessment of cyclic strengths at high overburden stresses. Boulanger and Idriss (2004) showed that increasing the compressibability of sand can be expected produce Kσ curves with a stronger dependence on σ'vc (i.e. lower Kσ values at σ'vc > 1 atm) and CN curves with a weaker dependence on σ'vc (i.e. higher CN values at σ'vc > 1 atm), which together have compensating effects on the final estimate of cyclic strength. The field-based CN relationship derived for the silty and clayey sands in the foundation of Perris Dam similarly showed CN curves with a lesser dependence on σ'vc (i.e. higher CN values at σ'vc > 1 atm) than is commonly assumed for clean sands (Wehling and Rennie 2008, Idriss and Boulanger 2010). The combined roles and the potentially compensating nature of the Kσ and CN relationships were recently illustrated by application of different design relationships to the data from Duncan Dam (Boulanger and Idriss 2012).

35
As discussed in previous sections, the use of Kσ and CN relationships to extend the liquefaction triggering correlation to larger depths and overburden pressures is based on limited data that includes the effects of changes in soil properties associated with increasing ', such as DR, OCR, cementation and other properties. In view of the above observations and the uncertainties in the K database, it is suggested that the relationships by Idriss and Boulanger (2008) continue to provide a reasonable basis for evaluating liquefaction effects in clean sands. For silty sands, the laboratory test results currently available indicate that intermediate values between the Youd et al. (2001) and the Idriss and Boulanger (2008) relationships may give the best estimates for Kσ. However, the existing CN relationships were derived primarily for clean sands and are likely conservative for silty sands, based on recent work at Perris Dam and other projects. Thus, it may be that a Kσ relationship that is slightly unconservative for silty sands may be compensated for by using a CN relationship that is conservative for silty sands. Therefore, the use of the current Idriss and Boulanger (2008) Kσ and CN relationships may be adequate for both clean and silty sands due to these compensating effects. It is recommended that if Kσ values for silty sands are selected on the basis of intermediate values from the two relationships, as is indicated by currently available data, then extra attention should be given to evaluating whether the selected CN curve is appropriate for the soil of interest with the idea of avoiding excessive conservatism.
There are cases in practice where the cyclic strength of cohesionless soils beneath large
embankment dams (e.g., point A in the alluvial foundation stratum shown in Figure 3.12) needs to be estimated based solely on data obtained from the same stratum but at the toe of the dam (point B in Figure 3.12). This situation is complicated by the fact that construction of the dam can be expected to change the DR, OCR, cementation, and aging-induced fabric of the soils beneath the dam. If the stratum is believed to be geologically the same across the dam footprint, it is sometimes assumed that the (N1)60 values in the stratum beneath the dam would be the same as at the toe. This assumption may be in significant error if the changes in DR, OCR, cementation, and aging-induced fabric are significant. An alternative approach used at Duncan Dam (Pillai and Byrne 1994) was to obtain frozen samples from the toe area and then test the
Figure 3.12. The liquefaction resistance of foundation strata beneath large embankment dams will be affected by the stresses imposed by the dam. These changes will not only be due to the
effect of confining stress on the cyclic strength, but also due to changes in soil properties caused by consolidation to higher stresses. The K relationships discussed in this report only
account for the effect of confining stress on cyclic strength with all other properties held constant.

36
samples under confining stresses representative of those under the dam. In this approach, the test specimens experience changes in DR, OCR, cementation and fabric that are comparable to those expected to have occurred beneath the dam in the field, and thus the laboratory measured strengths were expected to be representative of the in situ values. In this regard, it should be noted that the K relationships discussed in this report: (1) are only intended to account for the effect of confining stress on cyclic strength with all other properties held constant and (2) do not account for how increasing confining stresses from point B to point A in Figure 3.12 may also alter the in situ soil properties.

37
4. SUMMARY AND CONCLUSIONS
The cyclic strength of sandy soils depends on both the relative density (DR) and effective consolidation stress (σ'vc), which together reflect the state of the soil. The density and strength of the soil in situ is often estimated using correlations to SPT and CPT penetration resistances to avoid the effects of sample disturbance. Changes in the in situ consolidation stress will affect both the penetration resistance measured in situ and the cyclic strength of the soil. The potential for liquefaction is often evaluated by normalizing the penetration resistance to a reference vertical effective consolidation stress (commonly 1 atm) for a soil at the same DR using an overburden correction factor for penetration resistance (CN). The resulting normalized penetration resistance (e.g., an (N1)60cs value) is then correlated to the cyclic strength at the same reference stress level (e.g., a CRRM=7.5,σ'vc=1,α=0 value) based on analyses of liquefaction case histories which generally correspond to consolidation stresses less than 1.5 atm. The CRRM=7.5,σ'vc=1,α=0 value obtained from such a correlation is subsequently extrapolated to the in situ stress conditions for the same soil at the same DR using an overburden stress correction factor for liquefaction resistance (K).
The K factor is intended to account only for the effects of consolidation stress on the cyclic
strength of a cohesionless soil with all other properties held constant (Seed 1983), such that the interpretation of K from laboratory test data can be inadvertently affected by the changes in other specimen properties which may occur as the confining stress is increased. The increase in specimen DR that may occur as the consolidation stress is increased can contribute to K curves with a lesser dependence on σ'vc (unconservatively higher Kvalues) if this effect is not accounted for. The variation in specimen overconsolidation ratio that may occur when compacted or undisturbed field samples (i.e., with their associated preconsolidation stress) are tested at different laboratory stresses can contribute to K curves with a stronger dependence on σ'vc (conservatively lower Kvalues) if this effect is not accounted for. The progressive destruction of cementation or aging-induced fabric that may occur when undisturbed field samples are tested at increasing levels of consolidation stress can contribute to K curves with a stronger dependence on σ'vc if not properly accounted for. Examples of these effects were presented to illustrate the potential magnitude of the resulting errors in the interpreted K values. Many of these effects occur in a sandy soil deposit after being loaded by higher overburden, such as when a large dam is constructed. However, it is presumed that penetration tests through the dam will reflect such changes in the deposit (e.g. higher DR, lower OCR values, or disruption of cementation and particle fabric). Thus, it is important to separate these effects from the interpretation of K values.
An updated K database was presented which includes details on the major factors affecting
cyclic strengths and the interpretation of K values. Data points from the categories of clayey sands (fines contents of 23% to 28% and plasticity indices of 20 to 25) and well-compacted sands with varying levels of silt and clay (fines contents of 7% to 35%) were eliminated from further consideration in the evaluation of K relationships based on the presence of significant amounts of plastic fines and the adverse effects of significant compaction-induced preconsolidation stresses (and hence varying OCR values across the range of imposed consolidation stresses). The presence of these same data points in the Seed and Harder (1990)

38
database appear to have contributed to the development and recommendation of K curves with an overly strong dependence on σ'vc in past studies. It is important to remember that these effects may still be present in the current database (e.g. moist tamped and undisturbed samples) and are impossible to fully separate out.
Two current Kσ relationships that account for the dependence of K on DR were evaluated
against the updated database. The relationship by Hynes and Olsen (1999) in combination with the parameters recommended by Youd et al. (2001) was found to be conservative by an average residual of 16% to 20% with respect to the data for clean sands, and to be less conservative (average residual of 8% to 15%) for sands with fines contents between 7% and 35%. The relationship by Idriss and Boulanger (2008) was found to provide a reasonably good fit to the data for clean sands (average residual of 0% to 2%), and to be slightly unconservative (average residual of -5% to -10%) for sands with fines contents between 7% and 35%.
In view of the above observations and the uncertainties in the K database, it is suggested that the relationships by Idriss and Boulanger (2008) continue to provide a reasonable basis for evaluating liquefaction effects in clean sands. For silty sands, the laboratory test results currently available indicate that intermediate values between the Youd et al. (2001) and the Idriss and Boulanger (2008) relationships may give the best estimates for Kσ. However, the existing CN relationships were derived primarily for clean sands and are likely conservative for silty sands, based on recent work at Perris Dam and other projects. Thus, it may be that a Kσ relationship that is slightly unconservative for silty sands may be compensated for by using a CN relationship that is conservative for silty sands. Therefore, the use of the current Idriss and Boulanger (2008) Kσ relationship may be adequate for both clean and silty sands due to these compensating effects. It is recommended that if Kσ values for silty sands are selected on the basis of intermediate values from the two relationships, as is indicated by currently available data, then extra attention should be given to evaluating whether the selected CN curve is appropriate for the soil of interest with the idea of avoiding excessive conservatism.
39
ACKNOWLEDGMENTS
This study was supported by the California Division of Safety of Dams under contract 4600009523 and by the U.S. Army Corps of Engineers. The first author is also grateful for the financial report received from the United States Society on Dams. Any opinions, findings, conclusions or recommendations expressed in this material are those of the authors and do not necessarily reflect the views of these organizations. The staff at the California Division of Safety of Dams provided assistance with accessing project file records regarding cyclic testing data for a number of dam projects. Professors Bruce Kutter and Jason DeJong and Dr. Vlad Perlea provided valuable comments and suggestions regarding a draft of this report. The authors appreciate the above support and assistance.

40
REFERENCES
Been, K., and Jefferies, M. G. (1985). "A state parameter for sands." Geotechnique, 35(2), 99-
112. Boulanger, R. W. (2003). “High overburden stress effects in liquefaction analyses.” J.
Geotechnical and Geoenvironmental Eng., 129(12), 1071–1082. Boulanger, R. W. and Idriss, I. M. (2004). “State normalization of penetration resistances and the
effect of overburden stress on liquefaction resistance.” Proc., 11th Int. Conf. on Soil Dynamics and Earthquake Eng., and 3rd Int. Conf. on Earthquake Geotechnical Eng., D. Doolin et al., eds., Stallion Press, Vol. 2, pp. 484–491.
Boulanger, R. W., and Idriss, I. M. (2006). “Liquefaction susceptibility criteria for silts and
clays.” J. Geotechnical and Geoenvironmental Eng., 132(11), 1413–1426. Boulanger, R. W., and Idriss, I. M. (2012). "Evaluation of overburden stress effects on
liquefaction resistance at Duncan Dam." Canadian Geotechnical Journal, 49(9), 1052-1058. Bray, J. D., and Sancio, R. B. (2006). “Assessment of the liquefaction susceptibility of fine-
grained soils.” J. Geotechnical and Geoenvironmental Eng., 132(9), 1165–1177. California Department of Water Resources (CDWR) (1985). Stability investigation of Antelope
Dam, State of California, The Resources Agency, Department of Water Resources, Division of Engineering.
California Department of Water Resources (CDWR) (1989). Bulletin 203-88: The August 1,
1975 Oroville earthquake investigation, State of California, The Resources Agency, Department of Water Resources, Division of Engineering.
Cetin, K. O. , Seed, R. B. , DerKiureghian A. , Tokimatsu, K. , Harder L. F. Jr, Kayen, R. E. ,
and Moss, R. E. S. (2004). “Standard penetration test-based probabilistic and deterministic assessment of seismic soil liquefaction potential.” J. Geotech. Geoenviron. Eng. , 130 (12), 1314–1340.
Clough, G. W., Iwabuchi, J., Rad, N. S., and Kuppusamy, T. (1989). ‘‘Influence of cementation
on liquefaction of sands.’’ J. Geotech. Engrg., 115(8), 1102–1117. Cubrinovski, M., and Ishihara, K. (1999). “Empirical correlation between SPT N-value and
relative density for sandy soils.” Soils and Foundations, 39(5), 61–71. Donahue, J. L., Bray, J. D., and Riemer, M. (2007). Liquefaction susceptibility, resistance, and
response of silty and clayey soils. Report UCB/GT 2008-01, University of California, Berkeley, CA.
Filz, G. M. (2010). Personal communication.

41
Frost, J.D. and Park, J.Y. (2003). “A critical assessment of the moist tamping technique.” ASTM
Geotechnical Testing Journal, 26(1), 57-70. Harder, L.F. and Boulanger, R.W. (1997). “Application of Kσ and Kα correction factors,” Proc.,
NCEER Workshop on Evaluation of Liquefaction Resistance of Soils, T.L. Youd and I.M. Idriss, eds., Technical Report NCEER-97-0022, National Center for Eathquake Engineering Research, SUNY, Buffalo, NY, 167-190.
Harder, L. F., Jr. (1988). ‘‘Use of penetration tests to determine the cyclic loading resistance of
gravelly soils during earthquake shaking.’’ PhD dissertation, University of California, Berkeley, CA.
Hynes, M. E. (1988). “Pore pressure characterization of gravels under undrained cyclic
loading.’’ PhD dissertation, University of California, Berkeley, CA. Hynes, M. E., and Olsen, R. (1999.) “Influence of confining stress on liquefaction resistance.”
Physics and Mechanics of Soil Liquefaction, P.V. Lade and J.A, Yamamuro, eds., Balkema, Rotterdam, Netherlands, 145–152.
Idriss, I. M., and Boulanger, R. W. (2004). “Semi-empirical procedures for evaluating
liquefaction potential during earthquakes.” Proc., 11th Int. Conf. on Soil Dynamics and Earthquake Engineering, and 3rd Int. Conf. on Earthquake Geotechnical Engineering, D. Doolin, A. Kammerer, T. Nogami, R. B. Seed, and I. Towhata, eds., Stallion Press, Singapore, 32–56.
Idriss, I. M., and Boulanger, R. W. (2008). Soil liquefaction during earthquakes. Monograph
MNO-12, Earthquake Engineering Research Institute, Oakland, CA. Idriss, I. M., and Boulanger, R. W. (2010). SPT-based liquefaction triggering procedures. Report
UCD/CGM-10/02, Center for Geotechnical Modeling, University of California, Davis, CA. Ishihara, K., Sodekawa, M. and Tanaka, Y. (1978). “Effects of overconsolidation on liquefaction
characteristics of sands containing fines.” Dynamic Geotechnical Testing, ASTM STP 654, American Society for Testing and Materials, 246-264.
Jefferies, M. G., and Been, K. (2006). Soil liquefaction - A critical state approach, Taylor and
Francis, London. Konrad, J. M. (1988). "Interpretation of flat plate dilatometer tests in sands in terms of the state
parameter." Geotechnique, 38(2), 263-277. Koseki, J., Yoshida, T., and Sato, T. (2005) “Liquefaction properties of Toyoura sand in cyclic
torsional shear tests under low confining stress.” Soil and Foundations, 45(5), 103–113.

42
Los Angeles Department of Water and Power (LADWP) (1973). Fairmont Dam, Seismic Stability Evaluation. Report No. AX 189-3, Dam Analysis Group, Department of Water and Power, Los Angeles, CA.
Manmatharajan, V. and Sivathayalan, S. (2011). “Effect of overconsolidation on cyclic
resistance correction factors Kσ and Kα.” Proc., Fourteenth Pan-American Conference on Soil Mechanics and Geotechnical Engineering and the Sixty-Fourth Canadian Geotechnical Conference, Ontario, Canada.
Marcuson, W. F. and Krinitzsky, E. L. (1976). Dynamic Analyses of Fort Peck Dam. Research
Report S-76-1, Soils and Pavements Laboratory, U.S. Army Engineer Waterways Experiment Station, Vicksburg, MS.
Marcuson, W. F., Dennis, W. D., Cooley, L. A. and Horz, R. A. (1978). "Effect of load form and
sample reconstitution on test results." Proc., Earthquake Engineering and Soil Dynamics, June 19-21, 1978; Pasadena, CA. 588-599.
Meyerhof, G. G., (1957). “Discussion on research on determining the density of sands by spoon
penetration testing.” Proc.,4th Int. Conf. on Soil Mechanics and Foundation Eng., London, Vol. 3, p. 110.
Moss, R. E. S. , Seed, R. B. , Kayen, R. E. , Stewart, J. P. , Der Kiureghian, A. and Cetin, K. O.
(2006). “CPT-based probabilistic and deterministic assessment of in situ seismic soil liquefaction potential.” J. Geotech. Geoenviron. Eng., 132(8), 1032–1051.
Mulilis, J. P., Chan, C. K. and Seed, H.B. (1975). The effects of method of sample preparation on
the cyclic stress-strain behavior of sands. Report No. EERC 75-18, Earthquake Engineering Research Center, University of California, Berkeley, CA.
Pillai, V. S. and Byrne, P. M. (1994). "Effect of overburden pressure on liquefaction resistance
of sand." Canadian Geotechnical J., 31(1), 53-60. Pillai, V. S., and Muhunthan, B. (2001). "A review of the influence of initial static shear (K)
and confining stress (K) on failure mechanisms and earthquake liquefaction of soils." Proc., Fourth International Conference on Recent Advances in Geotechnical Earthquake Engineering and Soil Dynamics, S. Prakash, ed., University of Missouri Rolla, Rolla, MO, paper 1.51.
Robertson, P. K. (2010). “Evaluation of flow liquefaction and liquefied strength using the cone
penetration test.” J. Geotechnical and Geoenvironmental Eng., 136(6), 842–853. Sancio, R. B. (2003). “Ground failure and building performance in Adapazari, Turkey.’’ PhD
dissertation, University of California, Berkeley, CA.

43
Seed, H. B. and Lee, K. L. (1965). Studies of liquefaction of sands under cyclic loading conditions. Report No. TE-65-5, Soil Mechanics and Bituminous Materials Research Laboratory, University of California, Berkeley, CA.
Seed, H. B., Lee, K. L and Idriss, I. M. (1968). “An analysis of the Sheffield Dam failure.”
Report No. TE-68-2, Soil Mechanics and Bituminous Materials Research Laboratory, University of California, Berkeley, CA.
Seed, H. B. (1970) Evaluation of the stability of Perris Dam during earthquakes. Report to
California Department of Water Resources. Seed, H. B. and Idriss, I. M. (1971). “Simplified procedure for evaluating soil liquefaction
potential.” J. Soil Mech. Found. Div., 97(SM9), 1249–1273. Seed, H. B., Lee, K. L., Idriss, I. M. and Makdisi, F. (1973). Analysis of the slides in the San
Fernando dams during the earthquake of Feb. 9, 1971. Report No. EERC 73-2, Earthquake Engineering Research Center, University of California, Berkeley, CA.
Seed, H. B. (1983). “Earthquake resistant design of earth dams.” Proc., Symp. on Seismic Design
of Embankments and Caverns, ASCE, N.Y., 41–64. Seed, H. B., Tokimatsu, K., Harder, L. F., and Chung, R. M. (1985). ‘‘The influence of SPT
procedures in soil liquefaction resistance evaluations.’’ J. Geotech. Engrg., ASCE, 111(12), 1425–1445.
Seed, R. B, and Harder, L. F., (1990). SPT-based analysis of cyclic pore pressure generation and
undrained residual strength, in Proc., Seed Memorial Symposium, J. M. Duncan, ed., BiTech Publishers, Vancouver, British Columbia, 351–376.
Skempton, A. W. (1986). “Standard penetration test procedures and the effects in sands of
overburden pressure, relative density, particle size, aging and overconsolidation.” Geotechnique, 36(3), 425–447.
Stamatopolous (2010). “An experimental study of the liquefaction of silty sands in terms of the
state paramenter.” Soil Dynamics and Earthquake Eng., 30(8), 662-678. Tarhouni, M. A., Simms, P., and Sivathayalan, S. (2011). “Cyclic behaviour of reconstituted and
desiccated–rewet thickened gold tailings in simple shear.” Canadian Geotechnical J., 48(7), 1044-1060.
Terzaghi, K., Peck, R. B. and Meszri, G. (1996). Soil mechanics in engineering practice. John
Wiley & Sons, New York, NY. Townsend, F. C. and Mulilis, J. P. (1979). Laboratory strength of sands under static and cyclic
loading. Research Report S-76-2, Geotechnical Laboratory, U.S. Army Engineer Waterways Experiment Station, Vicksburg, MS.
44
Vaid, Y. P., and Sivathayalan, S. (1996). “Static and cyclic liquefaction potential of Fraser delta
sand in simple shear and triaxial tests.” Canadian Geotechnical J., 33(2), 281–289. Vaid, Y. P., and Thomas, J. (1995). “Liquefaction and postliquefaction behavior of sand.” J.
Geotechnical Eng., 121(2), 163–173. Wehling, T. M., and Rennie, D. C. (2008). "Seismic evaluation of liquefaction potential at Perris
Dam." Proc., Dam Safety 2008, Association of State Dam Safety Officials, Lexington, KY. Wong, I. H., Abdelhamid, M. S. and Fischer, J. A. (1978). “Compaction and cyclic shear
strength of granular backfill.” Proc., Earthquake Engineering and Soil Dynamics, June 19-21, 1978; Pasadena, CA. 1042-1055.
Youd, T. L., Idriss, I. M., Andrus, R. D., Arango, I., Castro, G., Christian, J. T., Dobry, R., Finn,
W. D. L., Harder, L. F., Hynes, M. E., Ishihara, K., Koester, J. P., Liao, S. S. C., Marcuson, W. F., Martin, G. R., Mitchell, J. K., Moriwaki, Y., Power, M. S., Robertson, P. K., Seed, R. B., and Stokoe, K. H. (2001). “Liquefaction resistance of soils: summary report from the 1996 NCEER and 1998 NCEER/NSF workshops on evaluation of liquefaction resistance of soils.” J. Geotechnical and Geoenvironmental Eng., 127(10), 817-833.