ex-tc oswald floods - bureau of meteorology oswald floods january and february 2013 1 2 3 1. flood...
TRANSCRIPT
Ex-TC Oswald Floods January and February 2013
1
2 3
1. Flood waters through Bundaberg from the air – Photo by John McDermott, ABC News 2. Floodwaters through the main street of Laidley – Photo by Josh Bavas, ABC News 3. Flood waters up to roof level in Gympie – Photo by Eric Tlozek, ABC News
Note:
1. Data in this report has been operationally quality controlled but errors may still exist.
2. This product includes data made available to the Bureau by other agencies. Separate approval may be required to use the data for other purposes. See Appendix 4 for DNRM Usage Agreement.
3. This report is not a complete set of all data that is available. It is a representation of some of the key information.


Table of Contents 1. Introduction.................................................................................................................................... 1 2. Meteorological Summary.............................................................................................................. 2
Figure 2.1 Track of Oswald as a Tropical Cyclone and Tropical Low – 17th to 29th January 20133 Figure 2.2 7-day rainfall totals for the week ending 29th January 2013 ........................................ 3 Figure 2.3 Radar imagery of Oswald as a Tropical Cyclone in the Gulf of Carpentaria and as a tropical low producing heavy rainfall along the east Queensland coast. ...................................... 4
3. Hydrology........................................................................................................................................ 5 3.1 Peak River Heights .................................................................................................................. 5
Figure 3.1.1 Peak flood heights observed between 21st of January and 14th of February 2013 resulting from rainfall produced by Ex-Tropical Cyclone Oswald.................................................. 6 Table 3.1.1 Significant peak heights observed between the 24th January and the 2nd of February 2013 and their historical comparison ............................................................................................ 7
3.2 Rainfall Maps............................................................................................................................ 8 Figure 3.2.1 Rainfall map of the Herbert River catchment from the 20th to 30th January 2013..... 8 Figure 3.2.2 Rainfall map of the Fitzroy River catchment from the 20th to 30th January 2013...... 9 Figure 3.2.3 Rainfall map of the Burnett River catchment from the 20th to 30th January 2013... 10 Figure 3.2.4 Rainfall map of the Brisbane, Albert, Logan, Coomera and Nerang River catchments from the 20th to 30th January 2013........................................................................... 11
3.3 Rainfall Intensity ..................................................................................................................... 12 Figure 3.3.1 Hourly hyetographs for Upper Dee TM on the Don River in the Fitzroy River catchment and Walla TM in the Burnett River catchment.......................................................... 13 Table 3.3.1 Intensity Frequency Duration rainfall analysis for Upper Dee TM and Walla TM .... 14 Figure 3.3.2 Hourly hyetographs for Mt Castle Alert on Laidley Creek in the Brisbane River catchment and Upper Springbrook Alert in the Nerang River catchment ................................... 15 Table 3.3.2 Intensity Frequency Duration rainfall analysis for Mt Castle Alert and Upper Springbrook Alert......................................................................................................................... 16
3.4 Flood Warning Services........................................................................................................ 17 Table 3.4.1 Number of Flood Warnings issued for each catchment during Ex-Tropical Cyclone Oswald......................................................................................................................................... 17 Figure 3.4.1 Number of Flood Warnings issued per day during Ex-Tropical Cyclone Oswald... 18
Appendix 1. Peak Heights................................................................................................................ 19 Appendix 2. Rainfall Tables............................................................................................................. 28 Appendix 3. Hydrographs................................................................................................................ 55 Appendix 4. DNRM Usage Agreement............................................................................................ 69

TC Oswald Floods – January 2013
Bureau of Meteorology, Queensland Page 1 http://www.bom.gov.au/hydro/flood/qld/fld_reports/reports.shtml © Copyright Commonwealth of Australia 2013, Bureau of Meteorology (ABN 92 637 533 532)
Ex-TC Oswald Floods January and February 2013
1. Introduction The flood event that was recorded with the path of Ex-Tropical Cyclone Oswald proved to be the largest and most significant since European settlement in some areas of southeast Queensland, where rainfall in excess of 1000 millimetres was recorded in 96 hours. Upper Springbrook, in the Gold Coast hinterland recorded 744 millimetres in the 24 hours to 9am on the 28th of January, which was the highest 24-hour rainfall total in Australia since 772 millimetres fell at Coops Corner (Noosa River) in August 2007. Many other areas recorded daily rainfall totals of between 400-500 millimetres during the event. For a complete discussion on the significant rainfall from Ex Tropical Cyclone Oswald please refer to the Special Climate Statement 44, which can be accessed at: http://www.bom.gov.au/climate/current/statements/scs44.pdf Ex-Tropical Cyclone Oswald tracked down the east coast of Australia from the Queensland North Tropical Coast to Sydney, between the 22nd and 29th of January 2013, with major flooding occurring in several river catchments in its path. Major flood levels in Queensland rivers continued from the 22nd of January to the 17th of February with record flood levels recorded along the Burnett River and its tributaries, throughout the Calliope, Boyne, Baffle and Kolan catchments, along Laidley, Tenthill and Black Duck Creeks in the Lockyer Valley and also in the Upper Weir River catchment. A total of 6,500 properties across 90 towns were either damaged or uninhabitable across Queensland, costing an estimated $2.4 billion*. Flooding above the moderate flood level (and in most instances above the major flood level) occurred along the east coast of Queensland in the following basins:
• Tully/Murray Rivers (Euramo) • Herbert River (Ingham and Halifax) • Bohle (Townsville) • Haughton (Giru) • Burdekin (Ayr and Home Hill) • Don (Bowen) • Fitzroy (Jambin, Baralaba, Yaamba, Rockhampton) • Calliope, Boyne, Baffle and Kolan • Cherwell-Burrum (Pacific Haven, Howard) • Burnett (Monto, Eidsvold, Mundubbera, Gayndah, Walla, Bundaberg) • Mary (Gympie, Miva, Tiaro, Maryborough) • Noosa (Tewantin) • Maroochy • Brisbane (Ipswich, Brisbane) • Logan-Albert (Beenleigh, Eagleby) • Moonie (Flinton, Nindigully, Thallon) • Weir (Talwood) • Border Rivers (Goondiwindi) • Condamine-Balonne (Warwick, Chinchilla, Condamine, Surat, St George, Dirranbandi)
This report provides a summary and analysis of the meteorology and hydrology associated with the significant rainfall and flooding following Ex-Tropical Cyclone Oswald as it traced a path across Queensland’s eastern river basins. * Information sourced from the Queensland Reconstruction Authority. The following link provides a complete list of maps of the relevant river catchments and flood warning stations referred to in this report.

TC Oswald Floods – January 2013
Bureau of Meteorology, Queensland Page 2 http://www.bom.gov.au/hydro/flood/qld/fld_reports/reports.shtml © Copyright Commonwealth of Australia 2013, Bureau of Meteorology (ABN 92 637 533 532)
2. Meteorological Summary A large stretch of the east coast of Australia, extending from Queensland’s North Tropical coast southward to Illawarra in New South Wales experienced very heavy rainfall during the period from the 22nd to the 29th of January 2013 as Ex-Tropical Cyclone Oswald traced a path across the region. This rainfall resulted in severe flooding in many areas within 200 kilometres of the east coast, most notably in the Burnett catchment in Queensland and the Clarence catchment in northern New South Wales, both of which reached record flood levels. Tropical Cyclone Oswald formed in the Gulf of Carpentaria on the afternoon of the 21st January 2013 and made landfall as a category 1 system six hours later near Kowanyama, on the west coast of Cape York Peninsula. The cyclone rapidly weakened after landfall and was downgraded to a tropical low on the morning of 22nd January. The low tracked eastwards across Cape York Peninsula and was positioned to the west of Cooktown on the 23rd of January. The system then took a turn to the south and tracked inland almost parallel to the Queensland coast to be positioned inland from Townsville on the 24th of January. The moist northeast flow around the southern flank of the low pressure system combined with a firm ridge that extended along the Queensland coast, from a high pressure system to the south of Victoria, to produce an enhanced band of rainfall on its southern side. The high pressure system moved eastwards allowing the low pressure system to move south during the 25th of January to be positioned near Emerald in Central Queensland. The tropical low then stagnated in that area over the 25th and 26th of January. Moist northeast to easterly winds around the eastern side of the low coincided with enhanced low level convergence brought about by a strong low level jet, and resulted in very heavy rainfall across the Capricornia, Wide Bay and Burnett regions at this time. Tornadoes were also observed on radar and reported. Rainfall totals of more than 400 to 500 millimetres in 24 hours were recorded during this period with several sites exceeding the 1% ARI for 3 to 72 hour totals (refer to section 3.3). By the 27th of January 2013, the low pressure system had resumed a steady southwards track to be centred near Dalby on the 28th of January, enticed southwards by a vigorous mid level trough over south-eastern Australia. This movement brought the intense area of rainfall to the southeast corner of Queensland where falls up to 750mm in 24 hours were recorded in some parts, particularly about the ranges. The system then accelerated southwards through northern New South Wales before moving offshore near Sydney on the 29th of January, but not before producing heavy rainfall across north-eastern parts of the state. The track of Oswald as a Tropical Cyclone and Tropical Low is shown in Figure 2.1. Throughout Oswald’s lifespan, the system brought heavy rainfall to the east coast of Australia extending from Queensland’s North Tropical Coast to around Illawarra, south of Sydney, on the New South Wales coast. The 7-day rainfall totals for the week ending the 29th of January 2013 are shown in Figure 2.2 and indicate totals generally in excess of 200 millimetres in coastal and adjacent inland areas, with enhanced activity greater than 400 millimetres in areas south from the Capricornia coast in Queensland to northern New South Wales. Scattered heavier falls of more than 400 millimetres in a day were also recorded in this region. Further detailed analysis of the rainfall associated with Ex-Tropical Cyclone Oswald is presented in Sections 3.2 and 3.3 and daily rainfall totals for the period from the 21st of January to 31st of January for Queensland River Basins are listed in Appendix 2. Radar imagery tracking the path of Ex-Tropical Cyclone Oswald as it moved through the eastern interior of Queensland is shown in Figure 2.3. The low pressure system was also associated with strong winds, with numerous sites experiencing gusts in excess of 100 km/h and several tornadoes sighted and reported. Rough seas, large waves and coastal storm surge also resulted from the system. Waves to 12 metres were observed offshore at Coffs Harbour and storm surge heights of around 0.5 to 0.6 metres above normal tide levels were recorded at several locations along the Queensland and New South Wales coastline, causing some inundation of foreshore areas. There are few close precedents in the last 50 years for the track of Ex-Tropical Cyclone Oswald. While a number of former tropical cyclones have moved far enough south to have significant impacts on New South Wales, most such systems have either originated over the Coral Sea and not

TC Oswald Floods – January 2013
Bureau of Meteorology, Queensland Page 3
approached the Queensland coast until south of the Tropic of Capricorn (e.g. Zoe 1974, Nancy 1990), or moved south from the Gulf of Carpentaria and tracked through western Queensland (e.g. Audrey 1964).
http://www.bom.gov.au/hydro/flood/qld/fld_reports/reports.shtml © Copyright Commonwealth of Australia 2013, Bureau of Meteorology (ABN 92 637 533 532)
Figure 2.1 Track of Oswald as a Tropical Cyclone and Tropical Low – 17th to 29th January 2013
thFigure 2.2 7-day rainfall totals for the week ending 29 January 2013

TC Oswald Floods – January 2013
Bureau of Meteorology, Queensland Page 4
Figure 2.3 Radar imagery of Oswald as a Tropical Cyclone in the Gulf of Carpentaria and as a tropical low producing heavy rainfall along the east Queensland coast.
Mackay 256km radar 9pm EST on 24th January 2013 Mornington Island 256km radar 2pm EST on 21st January 2013
Gladstone 256km radar 4pm EST on 25th January 2013 Mt Stapylton 256km radar 10am EST on 27th January 2013
http://www.bom.gov.au/hydro/flood/qld/fld_reports/reports.shtml © Copyright Commonwealth of Australia 2013, Bureau of Meteorology (ABN 92 637 533 532)

TC Oswald Floods – January 2013
Bureau of Meteorology, Queensland Page 5 http://www.bom.gov.au/hydro/flood/qld/fld_reports/reports.shtml © Copyright Commonwealth of Australia 2013, Bureau of Meteorology (ABN 92 637 533 532)
3. Hydrology
Ex-Tropical Cyclone Oswald tracked south, inland and parallel to the east Australian coast producing heavy to intense rainfall over the region causing widespread major river flooding. The low pressure system moved steadily from the North Tropical coast of Queensland to around Emerald producing daily rainfall totals of between 100 to 300 millimetres with isolated falls in excess of 300mm. This rainfall caused moderate to major river flooding in the Tully, Herbert, Haughton, Burdekin, Don and Pioneer Rivers. The low pressure system then stalled for 48 hours in the Capricornia region of Queensland, producing intense rainfall and widespread 24-hour totals up to 300 millimetres with isolated heavier falls greater than 400 millimetres and isolated 48-hour totals greater than 800 millimetres. This intense rainfall led to widespread major flooding across the Connors, Isaac, Mackenzie, Kolan, Baffle, Boyne, Calliope, Burnett and Burrum River catchments where record flood levels were recorded at Mimdale on Baffle Creek and Bundaberg on the Burnett River. Ex-Tropical Cyclone Oswald then resumed its course southward producing further heavy rainfall from Bundaberg to the Queensland and New South Wales border with 24-hour rainfall totals of 200 to 300 millimetres and scattered heavier totals greater than 400 millimetres recorded. The highest daily total recorded was 744 millimetres at Upper Springbrook Alert in the upper reaches of the Nerang River. Widespread major flooding extended further south across Queensland to include the Mary, Sunshine Coast, Brisbane, Logan, Albert, Coomera and Nerang River catchments, with record flood levels occurring at Laidley on the Brisbane River. Major flooding also extended over the southern inland Moonie, Weir and Condamine-Balonne River basins. As the tropical low tracked south of the Queensland and New South Wales border it continued to produce heavy to intense rainfall causing major flooding across coastal river catchments across New South Wales. The Hydrology presented in this report concentrates on flooding that has occurred in Queensland river basins with Hydrographs and rainfall data of Queensland Flood Warning network stations only included.
3.1 Peak River Heights A map displaying the peak river heights that occurred over Queensland between the 20th and 30th of January 2013 is shown in Figure 3.1.1. As is evident, isolated major flood levels were recorded across the coastal rivers in the north of the state, with more widespread major flooding occurring over southern coastal rivers extending inland to the Condamine-Balonne River. Table 3.1.1 displays a comparison of the January 2013 peak heights at key sites with historical peak heights, highlighting new peak height records which occurred at Mimdale on Baffle Creek, Bundaberg on the Burnett River and Laidley on the Brisbane River. Refer to Appendix 1 for a complete list of peak heights that occurred in Queensland during the Ex-Tropical Cyclone Oswald event.

TC Oswald Floods – January 2013
Bureau of Meteorology, Queensland Page 6 http://www.bom.gov.au/hydro/flood/qld/fld_reports/reports.shtml © Copyright Commonwealth of Australia 2013, Bureau of Meteorology (ABN 92 637 533 532)
Figure 3.1.1 Peak flood heights observed between 21st th of January and 14 of February 2013 resulting from rainfall produced by Ex-Tropical Cyclone Oswald

TC Oswald Floods – January 2013
Bureau of Meteorology, Queensland Page 7 http://www.bom.gov.au/hydro/flood/qld/fld_reports/reports.shtml © Copyright Commonwealth of Australia 2013, Bureau of Meteorology (ABN 92 637 533 532)
Table 3.1.1 Significant peak heights observed between the 24th January and the 2nd of February 2013 and their historical comparison
Location Catchment Peak Height Flood Class Start of Record Ranking Highest
Since Record
Ingham Pump Station Herbert River 13.54m
24/01/2013 Major 1916 19th 14.75m Feb 2009
15.20m Mar 1967
Giru Haughton River 2.75m 24/01/2013 Major 1978 11th 3.09m
Feb 2011 3.09m
Feb 2011
Bowen Don River 4.45m 24/01/2013 Moderate 1970 23rd 4.80m
Mar 2012 7.25m
Jan 1970
Rockhampton Fitzroy River 8.60m 2/2/2013 Major 1890 9th 9.2m
Jan 2011 10.11m
Feb 1918
Mimdale Baffle Creek 22.33m 27/01/2013 Major 1970 1st New record New record
Monduran Kolan River 13.30m 27/01/2013 Major 1887 2nd 17.70m
1887 17.70m
1887
Mundubbera Burnett River 23.0m 28/01/2013 Major 1942 2nd 23.62m
Feb 1942 23.6 m
Feb 1942
Gayndah Burnett River 18.61m 28/01/2013 Major 1864 2nd 19.66m
Feb 1942 19.66m
Feb 1942
Bundaberg Burnett River 9.53m 29/1/2013 Major 1875 1st New record New record
Maryborough Mary River 10.70m 29/1/2013 Major 1864 4th 10.95 m
Jan 1974 12.27m
1893
Gympie Mary River 19.98m 28/1/2013 Major 1870 8th 21.95m
Feb 1999 25.45m
Feb 1893
Ipswich Bremer River 13.9m 28/1/2013 Major 1840 20th 19.25m
Jan 2011 23.47m
Feb1893
Brisbane Brisbane River 2.3m 28/1/2013 Minor 1840 24th 4.46m
Jan 2011 8.35m
Jan 1893
Waterford Logan River 9.0m 30/1/2013 Major 1887 6th 9.06m
Feb 1991 13.7m 1887
Laidley Brisbane River 8.95m 27/1/2013 Major 1990 1st New record New record
Warwick Condamine River
7.21m 28/1/2013 Major 1887 12th 8.35m
Jan 2011 9.1m
Feb 1976

TC Oswald Floods – January 2013
Bureau of Meteorology, Queensland Page 8
3.2 Rainfall Maps The rainfall amounts in Figures 3.2.1 to 3.2.4 are all given in millimetres. Refer to http://www.bom.gov.au/qld/flood/brochures/river_maps.shtml for the station names of the rainfall locations used in Figures 3.2.1-3.2.4. For a complete list of daily rainfalls please refer to Appendix 2 – rainfall tables.
http://www.bom.gov.au/hydro/flood/qld/fld_reports/reports.shtml © Copyright Commonwealth of Australia 2013, Bureau of Meteorology (ABN 92 637 533 532)
Figure 3.2.1 Rainfall map of the Herbert River catchment from the 20th th to 30 January 2013
North Johnstone River
South Johnstone River
Tully River
Euramo
Herbert River
Murray River
Ingham

TC Oswald Floods – January 2013
Bureau of Meteorology, Queensland Page 9 http://www.bom.gov.au/hydro/flood/qld/fld_reports/reports.shtml © Copyright Commonwealth of Australia 2013, Bureau of Meteorology (ABN 92 637 533 532)
Figure 3.2.2 Rainfall map of the Fitzroy River catchment from the 20th th to 30 January 2013
Fitzroy River
Upper Dee TM ( 1102mm)
Calliope River
Boyne River
Boolaroo Tops TM ( 1426mm)
The highest rainfall totals (in excess of 800mm) were recorded in the Burnett, Baffle and Boyne catchments and also in the Don River (Fitzroy catchment). An analysis of the rainfall intensities at Upper Dee TM in the Don River catchment is presented in Figure 3.3.1.

TC Oswald Floods – January 2013
Bureau of Meteorology, Queensland Page 10 http://www.bom.gov.au/hydro/flood/qld/fld_reports/reports.shtml © Copyright Commonwealth of Australia 2013, Bureau of Meteorology (ABN 92 637 533 532)
Figure 3.2.3 Rainfall map of the Burnett River catchment from the 20th th to 30 January 2013
Captain Creek TM ( 1006mm)
Baffle CreekBoolaroo Tops TM ( 1426mm)
Walla TM ( 649mm)
Burnett River

TC Oswald Floods – January 2013
Bureau of Meteorology, Queensland Page 11
Figure 3.2.4 Rainfall map of the Brisbane, Albert, Logan, Coomera and Nerang River catchments from the 20th to 30th January 2013
http://www.bom.gov.au/hydro/flood/qld/fld_reports/reports.shtml © Copyright Commonwealth of Australia 2013, Bureau of Meteorology (ABN 92 637 533 532)
The highest rainfall totals for the period from the 20th to 30th of January 2013 in southeast Queensland occurred at Mt Castle Alert (991 millimetres) and Upper Springbrook Alert (1516 millimetres).
Mt Castle Alert ( 991mm)
Upper Springbrook Alert (1516mm)
Brisbane River
Coomera River
Albert River
Logan River Nerang River

TC Oswald Floods – January 2013
Bureau of Meteorology, Queensland Page 12 http://www.bom.gov.au/hydro/flood/qld/fld_reports/reports.shtml © Copyright Commonwealth of Australia 2013, Bureau of Meteorology (ABN 92 637 533 532)
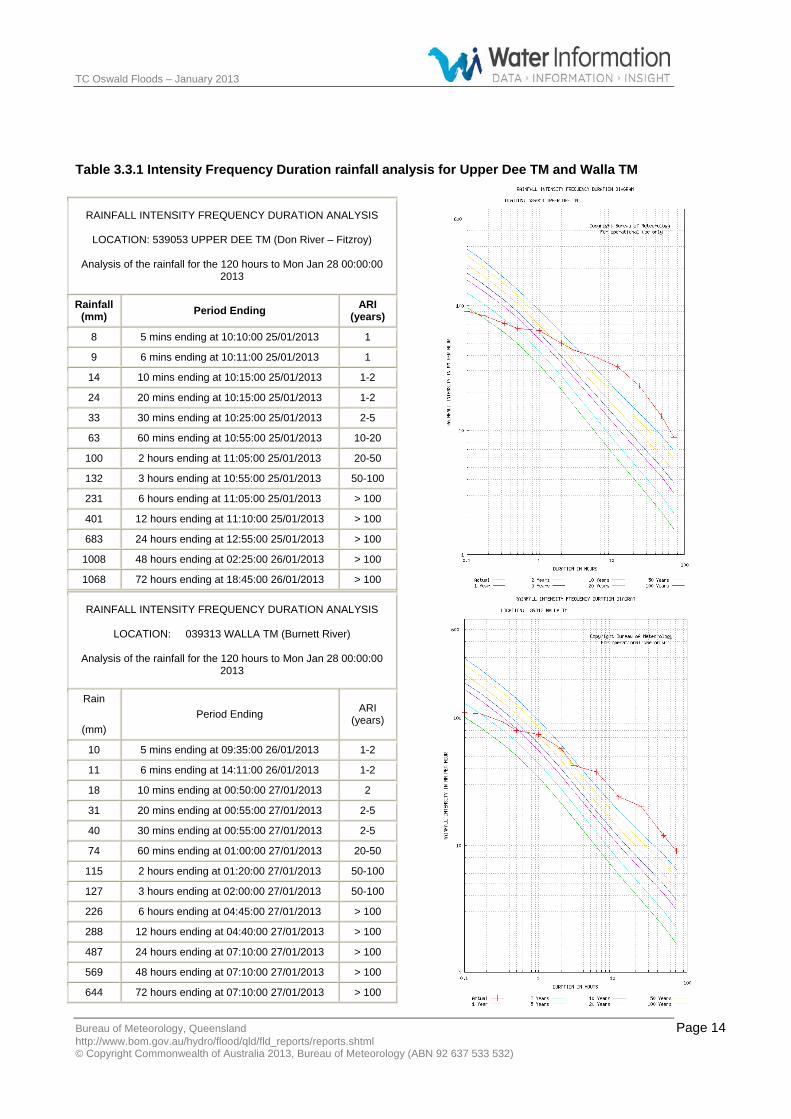
3.3 Rainfall Intensity Hourly hyetographs and an analysis of the duration and intensity of the most significant rainfall totals following Ex-Tropical Cyclone Oswald are presented in Figures 3.3.1 and 3.3.2 and Tables 3.3.1 and 3.3.2 respectively. The selected sites include Upper Dee TM on the Don River in the Fitzroy River catchment, Walla TM in the Burnett River catchment, Mt Castle Alert on Laidley Creek in the Brisbane River catchment and Upper Springbrook Alert in the Nerang River catchment. Short duration rainfall intensities (less than 1 hour) for all locations were typically insignificant with at least a 10% chance of being exceeded in any one year. Rainfall intensities for durations of 2 and 3 hours were typically between 1 to 2% AEP (Annual Exceedance Probability) except the 136 millimetres of rain that fell at Mt Castle in the three hours to 4:05am on the 28th January 2013, which exceeds the 1% AEP; that is the 1 in 100 year ARI (Average Recurrence Interval). The most statistically significant rainfall intensities occurred over durations of 6, 12, 24, 48 and 72 hours where a large number of rainfall stations exceeded the 1% AEP, as is evident from the data presented in Figures 3.3.1 and 3.3.2 of rainfall stations that recorded the highest rainfall totals for the event. Refer to http://www.bom.gov.au/qld/flood/brochures/river_maps.shtml for the location of rainfall stations used in Figures 3.3.1 and 3.3.2. Note: A flood frequency analysis would be required to assess the probability of flood peaks recorded at each location. The frequency analysis in this report is for rainfall only.

TC Oswald Floods – January 2013
Bureau of Meteorology, Queensland Page 13
Figure 3.3.1 Hourly hyetographs for Upper Dee TM on the Don River in the Fitzroy River catchment and Walla TM in the Burnett River catchment.
http://www.bom.gov.au/hydro/flood/qld/fld_reports/reports.shtml © Copyright Commonwealth of Australia 2013, Bureau of Meteorology (ABN 92 637 533 532)
TC Oswald Floods – January 2013
Bureau of Meteorology, Queensland Page 14
Table 3.3.1 Intensity Frequency Duration rainfall analysis for Upper Dee TM and Walla TM
RAINFALL INTENSITY FREQUENCY DURATION ANALYSIS
LOCATION: 539053 UPPER DEE TM (Don River – Fitzroy)
Analysis of the rainfall for the 120 hours to Mon Jan 28 00:00:00 2013
Rainfall (mm)
ARI (years) Period Ending
8 5 mins ending at 10:10:00 25/01/2013 1
9 6 mins ending at 10:11:00 25/01/2013 1
14 10 mins ending at 10:15:00 25/01/2013 1-2
24 20 mins ending at 10:15:00 25/01/2013 1-2
33 30 mins ending at 10:25:00 25/01/2013 2-5
63 60 mins ending at 10:55:00 25/01/2013 10-20
100 2 hours ending at 11:05:00 25/01/2013 20-50
132 3 hours ending at 10:55:00 25/01/2013 50-100
231 6 hours ending at 11:05:00 25/01/2013 > 100
401 12 hours ending at 11:10:00 25/01/2013 > 100
683 24 hours ending at 12:55:00 25/01/2013 > 100
1008 48 hours ending at 02:25:00 26/01/2013 > 100
1068 72 hours ending at 18:45:00 26/01/2013 > 100
http://www.bom.gov.au/hydro/flood/qld/fld_reports/reports.shtml © Copyright Commonwealth of Australia 2013, Bureau of Meteorology (ABN 92 637 533 532)
RAINFALL INTENSITY FREQUENCY DURATION ANALYSIS
LOCATION: 039313 WALLA TM (Burnett River)
Analysis of the rainfall for the 120 hours to Mon Jan 28 00:00:00 2013
Rain ARI
(years) Period Ending (mm)
10 5 mins ending at 09:35:00 26/01/2013 1-2
11 6 mins ending at 14:11:00 26/01/2013 1-2
18 10 mins ending at 00:50:00 27/01/2013 2
31 20 mins ending at 00:55:00 27/01/2013 2-5
40 30 mins ending at 00:55:00 27/01/2013 2-5
74 60 mins ending at 01:00:00 27/01/2013 20-50
115 2 hours ending at 01:20:00 27/01/2013 50-100
127 3 hours ending at 02:00:00 27/01/2013 50-100
226 6 hours ending at 04:45:00 27/01/2013 > 100
288 12 hours ending at 04:40:00 27/01/2013 > 100
487 24 hours ending at 07:10:00 27/01/2013 > 100
569 48 hours ending at 07:10:00 27/01/2013 > 100
644 72 hours ending at 07:10:00 27/01/2013 > 100

TC Oswald Floods – January 2013
Bureau of Meteorology, Queensland Page 15
Figure 3.3.2 Hourly hyetographs for Mt Castle Alert on Laidley Creek in the Brisbane River catchment and Upper Springbrook Alert in the Nerang River catchment
http://www.bom.gov.au/hydro/flood/qld/fld_reports/reports.shtml © Copyright Commonwealth of Australia 2013, Bureau of Meteorology (ABN 92 637 533 532)

TC Oswald Floods – January 2013
Bureau of Meteorology, Queensland Page 16
Table 3.3.2 Intensity Frequency Duration rainfall analysis for Mt Castle Alert and Upper Springbrook Alert
RAINFALL INTENSITY FREQUENCY DURATION ANALYSIS
LOCATION: 540171 MT CASTLE ALERT (Brisbane River)
Analysis of the rainfall for the 120 hours to Wed Jan 30 00:00:00
2013
http://www.bom.gov.au/hydro/flood/qld/fld_reports/reports.shtml © Copyright Commonwealth of Australia 2013, Bureau of Meteorology (ABN 92 637 533 532)
Rain
(mm) Period Ending ARI
(years)
6 5 mins ending at 03:35:00 28/01/2013 < 1
7 6 mins ending at 03:36:00 28/01/2013 < 1
12 10 mins ending at 03:40:00 28/01/2013 < 1
22 20 mins ending at 03:40:00 28/01/2013 1-2
32 30 mins ending at 03:45:00 28/01/2013 2-5
53 60 mins ending at 04:05:00 28/01/2013 10
93 2 hours ending at 04:05:00 28/01/2013 50-100
136 3 hours ending at 04:05:00 28/01/2013 > 100
244 6 hours ending at 04:05:00 28/01/2013 > 100
441 12 hours ending at 04:05:00 28/01/2013 > 100
714 24 hours ending at 08:05:00 28/01/2013 > 100
944 48 hours ending at 09:45:00 28/01/2013 > 100
1117 72 hours ending at 20:25:00 28/01/2013 > 100
RAINFALL INTENSITY FREQUENCY DURATION ANALYSIS
LOCATION: 540400 UPPER SPRINGBROOK ALERT (Nerang River)
Analysis of the rainfall for the 120 hours to Wed Jan 30 00:00:00 2013
Rain ARI
(years) Period Ending (mm)
8 5 mins ending at 20:55:00 28/01/2013 < 1
9 6 mins ending at 20:56:00 28/01/2013 < 1
15 10 mins ending at 20:55:00 28/01/2013 < 1
26 20 mins ending at 21:05:00 28/01/2013 1-2
37 30 mins ending at 20:55:00 28/01/2013 2-5
65 60 mins ending at 21:20:00 28/01/2013 5
110 2 hours ending at 21:15:00 28/01/2013 10-20
146 3 hours ending at 22:05:00 28/01/2013 10-20
226 6 hours ending at 08:15:00 28/01/2013 20-50
433 12 hours ending at 08:35:00 28/01/2013 > 100
787 24 hours ending at 12:30:00 28/01/2013 > 100
1168 48 hours ending at 02:15:00 29/01/2013 > 100 1391 72 hours ending at 23:00:00 28/01/2013 > 100

TC Oswald Floods – January 2013
Bureau of Meteorology, Queensland Page 17 http://www.bom.gov.au/hydro/flood/qld/fld_reports/reports.shtml © Copyright Commonwealth of Australia 2013, Bureau of Meteorology (ABN 92 637 533 532)
3.4 Flood Warning Services During the Ex-Tropical Cyclone Oswald event, a total of 406 flood warnings were issued between the 23rd of January and the 25th of February 2013, with half of those warnings issued over a 96 hour period between the 26th and the 29th of January 2013. The number of flood warnings issued for each river basin or region and the date for the first and final warning is outlined in Table 3.4.1. As is evident, the largest number of warnings was issued for the Condamine-Balonne River catchment where the heavy rain fell over the upper reaches of the catchment and the travel time along the river system to the south of the New South Wales and Queensland border is several weeks.
Table 3.4.1 Number of Flood Warnings issued for each catchment during Ex-Tropical Cyclone Oswald
Catchment First Warning
Last Warning
Number Issued
Coastal Rivers - North 23/1/2013 24/1/2013 7 Coastal Rivers - Central 24/1/2013 25/1/2013 5 Coastal Rivers – South 25/1/2013 28/1/2013 15 Tully River 21/1/2013 25/1/2013 17 Herbert River 22/1/2013 25/1/2013 12 Haughton River 24/1/2013 25/1/2013 7 Burdekin River 25/1/2013 26/1/2013 3 Don River and Adj. Streams 24/1/2013 25/1/2013 8 Pioneer River 24/1/2013 25/1/2013 2 Fitzroy River 24/1/2013 5/2/2013 35 Burnett River 25/1/2013 1/2/2013 39 Kolan, Baffle, Boyne & Calliope 25/1/2013 30/1/2013 22 Burrum River 26/1/2013 29/1/2013 11 Mary River 26/1/2013 1/2/2013 33 Sunshine Coast Rivers 27/1/2013 29/1/2013 10 Upper Brisbane 27/1/2013 29/1/2013 14 Lower Brisbane 27/1/2013 31/1/2013 20 Logan-Albert 27/1/2013 31/1/2013 23 Coomera, Nerang 27/1/2013 29/1/2013 7 Condamine-Balonne Rivers 27/1/2013 25/2/2013 55 Border Rivers 27/1/2013 13/2/2013 35 Moonie River 27/1/2013 11/2/2013 26 Figure 3.4.1 shows the number of flood warnings that were issued per day during the Ex-Tropical Cyclone Oswald event. The greatest number of flood warnings were issued on the 28th January 2013 at which time flooding was occurring in Baffle Creek and the Fitzroy, Burnett, Kolan, Boyne, Calliope, Burrum, Mary, Brisbane, Logan, Albert, Coomera, Nerang, Condamine-Balonne, Border, Moonie and Sunshine Coast Rivers.

TC Oswald Floods – January 2013
Bureau of Meteorology, Queensland Page 18
Figure 3.4.1 Number of Flood Warnings issued per day during Ex-Tropical Cyclone Oswald
Ex-Tropical Cyclone Oswald Flood Warnings
0
10
20
30
40
50
60
70
20/0
1/20
1321
/01/
2013
22/0
1/20
1323
/01/
2013
24/0
1/20
1325
/01/
2013
26/0
1/20
1327
/01/
2013
28/0
1/20
1329
/01/
2013
30/0
1/20
1331
/01/
2013
1/02
/201
32/
02/2
013
3/02
/201
34/
02/2
013
5/02
/201
36/
02/2
013
7/02
/201
38/
02/2
013
9/02
/201
310
/02/
2013
11/0
2/20
1312
/02/
2013
13/0
2/20
1314
/02/
2013
15/0
2/20
1316
/02/
2013
17/0
2/20
1318
/02/
2013
19/0
2/20
1320
/02/
2013
21/0
2/20
1322
/02/
2013
23/0
2/20
1324
/02/
2013
25/0
2/20
13
Date
Num
ber o
f War
ning
s
http://www.bom.gov.au/hydro/flood/qld/fld_reports/reports.shtml © Copyright Commonwealth of Australia 2013, Bureau of Meteorology (ABN 92 637 533 532)

TC Oswald Floods – January 2013
Bureau of Meteorology, Queensland Page 19 http://www.bom.gov.au/hydro/flood/qld/fld_reports/reports.shtml © Copyright Commonwealth of Australia 2013, Bureau of Meteorology (ABN 92 637 533 532)
Appendix 1. Peak Heights Outlined below is a list of peak heights recorded during the Ex TC Oswald event. Only stations that exceeded the minor flood level are given and data used is operational only, errors may exist.
Basin Station Number Station Name Height Flood Class Time
BAFFLE 539085 MIMDALE TM 21.992 Major 27/01/2013 04:15BARRON 531037 BOLTON ROAD ALERT 6.18 Moderate 23/01/2013 14:03
BORDER RIVERS 541081 STORM KING DAM HEADWATER ALERT 0.1 Minor 29/01/2013 01:12BORDER RIVERS 541085 DALCOUTH AL 1.75 Minor 28/01/2013 03:32BORDER RIVERS 541086 GRANITE STREET ALERT 1.03 Minor 28/01/2013 06:19BORDER RIVERS 541087 STANTHORPE ALERT 3.17 Minor 28/01/2013 07:32BORDER RIVERS 541073 STANTHORPE TM 2.55 Minor 28/01/2013 08:30BORDER RIVERS 41540 BEARDY JUNCTION 4.8 Minor 29/01/2013 06:00BORDER RIVERS 541066 BEEBO TM 4.832 Major 28/01/2013 08:00BORDER RIVERS 41133 WOODSPRING TM 6.45 Moderate 29/01/2013 00:00BORDER RIVERS 41520 INGLEWOOD WEIR TM 5.504 Minor 28/01/2013 06:00BORDER RIVERS 41519 BOOBA SANDS TM 6.958 Minor 28/01/2013 19:00BORDER RIVERS 41506 BENGALLA TM 7.182 Moderate 30/01/2013 12:00BORDER RIVERS 41507 NEW KILDONAN TM 8.485 Moderate 30/01/2013 03:50BORDER RIVERS 41350 GOONDIWINDI 8.73 Major 30/01/2013 11:00BORDER RIVERS 541030 GOONDIWINDI WEIR TM 7.447 Moderate 30/01/2013 12:00BORDER RIVERS 541070 CARANA WEIR TM 5.906 Major 31/01/2013 05:00BORDER RIVERS 41508 O'CONNOR TM 13.062 Major 28/01/2013 14:20BORDER RIVERS 41485 RETREAT BRIDGE TM 12.71 Major 28/01/2013 23:00BORDER RIVERS 41488 BALLYMENA TM 11.223 Major 30/01/2013 05:50BORDER RIVERS 41124 KILBRONAE TM 4.175 Major 28/01/2013 18:10BORDER RIVERS 542004 GUNN BRIDGE (DERM) TM 7.607 Major 30/01/2013 10:20BORDER RIVERS 41489 MEDPARK BRIDGE TM 6.021 Major 28/01/2013 20:20BORDER RIVERS 41366 GIDDI GIDDI SOUTH 6.75 Major 30/01/2013 09:00BORDER RIVERS 41112 GIDDI GIDDI SOUTH TM 6.557 Major 29/01/2013 20:40BORDER RIVERS 42097 HARTMANN BRIDGE TM 6.064 Major 30/01/2013 20:00BORDER RIVERS 42104 SURREY TM 5.973 Major 1/02/2013 01:00 BORDER RIVERS 42108 TALWOOD TM 5.31 Major 2/02/2013 02:30 BORDER RIVERS 42066 TALWOOD 4.7 Major 1/02/2013 15:00 BORDER RIVERS 542005 JERICHO TM 3.699 Major 3/02/2013 21:00
BRISBANE 540046 PEACHESTER WRC TM 8.556 Moderate 27/01/2013 14:20BRISBANE 540059 PEACHESTER ALERT 8.9 Moderate 27/01/2013 14:18BRISBANE 540485 WOODFORD TM 7.806 Moderate 27/01/2013 21:00BRISBANE 540337 WOODFORD ALERT-P 7.89 Moderate 27/01/2013 21:01BRISBANE 540338 WOODFORD ALERT-B 7.81 Moderate 27/01/2013 20:24BRISBANE 540044 COOYAR CREEK TM 6.701 Moderate 27/01/2013 21:39BRISBANE 540146 COOYAR CREEK ALERT 6.66 Moderate 27/01/2013 21:07BRISBANE 540040 LINVILLE TM 7.645 Major 27/01/2013 14:40BRISBANE 540261 LINVILLE ALERT 7.65 Major 27/01/2013 14:16BRISBANE 540188 DEVON HILLS ALERT 8.33 Major 27/01/2013 15:10BRISBANE 540045 BOAT MOUNTAIN TM 8.427 Major 27/01/2013 18:50BRISBANE 540141 BOAT MOUNTAIN ALERT 8.48 Major 27/01/2013 17:57BRISBANE 40822 GREGOR CREEK TM 11.253 Major 27/01/2013 17:00BRISBANE 540139 GREGOR CK ALERT-P 11.14 Major 27/01/2013 16:53BRISBANE 540140 GREGOR CK ALERT-B 6.22 Moderate 27/01/2013 12:23

TC Oswald Floods – January 2013
Bureau of Meteorology, Queensland Page 20 http://www.bom.gov.au/hydro/flood/qld/fld_reports/reports.shtml © Copyright Commonwealth of Australia 2013, Bureau of Meteorology (ABN 92 637 533 532)
BRISBANE 40823 ROSENTRETERS BRIDGE TM 6.687 Major 27/01/2013 15:21BRISBANE 540148 ROSENTRETERS BRIDGE AL 6.68 Major 27/01/2013 15:10BRISBANE 540566 UPPER LOCKYER ALERT 3.45 Minor 27/01/2013 14:27BRISBANE 40829 HELIDON TM 5.73 Minor 27/01/2013 15:28BRISBANE 540143 HELIDON ALERT 5.76 Minor 27/01/2013 15:10BRISBANE 540386 SANDY CREEK ROAD ALERT 5.6 Major 27/01/2013 16:05BRISBANE 540568 JUNCTION VIEW ALERT 2.1 Moderate 27/01/2013 11:40BRISBANE 540067 TENTHILL TM 6.764 Major 28/01/2013 04:10BRISBANE 540152 TENTHILL ALERT 6.73 Major 28/01/2013 03:59BRISBANE 540156 GATTON ALERT 13.58 Moderate 28/01/2013 06:19BRISBANE 540567 MOON ROAD ALERT 4.2 Moderate 28/01/2013 01:51BRISBANE 40835 MULGOWIE TM 9.267 Major 28/01/2013 07:00BRISBANE 540528 MULGOWIE ALERT 9.11 Major 28/01/2013 06:31BRISBANE 540047 SHOWGROUND WEIR HW TM 9.258 Major 28/01/2013 11:45BRISBANE 540158 SHOWGROUND WEIR ALERT 9.26 Major 28/01/2013 00:51BRISBANE 540050 WARREGO HIGHWAY TM 7.411 Major 28/01/2013 05:00BRISBANE 540149 GLENORE GROVE ALERT 15.1 Major 28/01/2013 08:49BRISBANE 540174 LYONS BRIDGE ALERT-P 17.46 Major 28/01/2013 00:00BRISBANE 40817 RIFLE RANGE ROAD TM 16.73 Major 28/01/2013 16:10BRISBANE 540544 RIFLE RANGE ROAD ALERT 16.7 Major 28/01/2013 15:54BRISBANE 540051 O'REILLY'S WEIR TM 15.102 Moderate 28/01/2013 19:20BRISBANE 540153 O'REILLY'S WEIR ALERT 15.26 Moderate 28/01/2013 19:08BRISBANE 540066 SAVAGES CROSSING TM 12.047 Minor 29/01/2013 03:00BRISBANE 540150 SAVAGES CROSSING ALERT 12.1 Minor 29/01/2013 02:54BRISBANE 40818 MT CROSBY TM 13.396 Moderate 29/01/2013 07:20BRISBANE 540199 MT CROSBY ALERT 13.41 Moderate 29/01/2013 08:04BRISBANE 540068 ADAMS BRIDGE TM 5.246 Moderate 28/01/2013 02:47BRISBANE 540157 ADAMS BRIDGE ALERT 5.23 Moderate 28/01/2013 02:31BRISBANE 540314 SPRESSERS BRIDGE ALERT 6.16 Major 28/01/2013 00:59BRISBANE 540064 GRANDCHESTER ALERT 5.1 Major 27/01/2013 15:31BRISBANE 540583 KUSS ROAD TM 7.835 Moderate 27/01/2013 20:38BRISBANE 540194 KUSS ROAD ALERT 7.84 Moderate 27/01/2013 19:10BRISBANE 540081 WALLOON TM 9.863 Major 28/01/2013 06:00BRISBANE 540147 WALLOON ALERT-P 8.12 Major 28/01/2013 03:22BRISBANE 540504 WALLOON (DERM) AL 9.85 Major 28/01/2013 05:43BRISBANE 540248 CHURCHILL ALERT 5 Moderate 28/01/2013 20:08BRISBANE 540193 ROSEWOOD ALERT 6.85 Major 28/01/2013 00:42BRISBANE 540388 ROSEWOOD AL-B 6.85 Major 28/01/2013 00:27BRISBANE 40838 THREE MILE BRIDGE ALERT 28.61 Major 28/01/2013 19:11BRISBANE 40440 KALBAR 11 Major 28/01/2013 06:00BRISBANE 540057 KALBAR WEIR TW TM 10.401 Major 28/01/2013 05:40BRISBANE 540151 KALBAR WEIR ALERT 78.83 Major 27/01/2013 16:30BRISBANE 540154 HARRISVILLE ALERT 6.06 Major 28/01/2013 04:16BRISBANE 540387 HARRISVILLE AL-B 5.77 Major 28/01/2013 06:21BRISBANE 540217 CHURCHBANK WEIR TM 31.962 Major 29/01/2013 16:50BRISBANE 540316 CHURCHBANK WEIR ALERT 5.76 Major 28/01/2013 21:22BRISBANE 40816 AMBERLEY (DERM) TM 10.208 Major 28/01/2013 20:00BRISBANE 540180 AMBERLEY ALERT-P 8.91 Major 28/01/2013 14:44BRISBANE 540505 AMBERLEY (DERM) AL 10.2 Major 28/01/2013 19:35BRISBANE 540065 PEAK CROSSING ALERT 4.76 Moderate 27/01/2013 22:27BRISBANE 540062 LOAMSIDE ALERT 6.94 Moderate 28/01/2013 02:34

TC Oswald Floods – January 2013
Bureau of Meteorology, Queensland Page 21 http://www.bom.gov.au/hydro/flood/qld/fld_reports/reports.shtml © Copyright Commonwealth of Australia 2013, Bureau of Meteorology (ABN 92 637 533 532)
BRISBANE 540210 LOAMSIDE TM 8.18 Major 28/01/2013 02:50BRISBANE 40836 ONE MILE BRIDGE ALERT 19.05 Major 28/01/2013 20:18BRISBANE 40101 IPSWICH 13 Major 28/01/2013 13:30BRISBANE 40831 IPSWICH ALERT 13.9 Major 28/01/2013 21:24BRISBANE 540198 BRISBANE CITY ALERT 2.32 Minor 28/01/2013 09:32BRISBANE 40873 HARDING STREET ALERT 24.83 Minor 27/01/2013 22:23BRISBANE 40872 BLACKSTONE BRIDGE ALERT 19.89 Minor 27/01/2013 23:30BRISBANE 40875 BUNDAMBA SCHOOL ALERT 16.28 Moderate 28/01/2013 00:31BRISBANE 40795 OPOSSUM ALERT 24.4 Major 27/01/2013 19:02BRISBANE 40874 BRISBANE ROAD ALERT 11.52 Major 26/01/2013 07:21BRISBANE 40719 NEW BEITH TM 5.386 Moderate 27/01/2013 21:40BRISBANE 40796 BEATTY ROAD ALERT 6.24 Minor 28/01/2013 10:48BRISBANE 540432 MARSHALL RD AL 4.87 Minor 27/01/2013 18:11BRISBANE 540071 CORINDA HIGH ALERT 4.05 Minor 28/01/2013 14:45BRISBANE 540433 MURIEL AVE AL 4.71 Minor 27/01/2013 17:28BRISBANE 540274 OXLEY CREEK MOUTH ALERT 3.36 Minor 29/01/2013 11:22BRISBANE 540132 EAST BRISBANE ALERT 2.71 Minor 27/01/2013 17:38BRISBANE 540061 MISTY MORN ALERT 9.64 Minor 27/01/2013 19:41BRISBANE 40813 UPPER BROOKFIELD 3.908 Moderate 27/01/2013 19:00BRISBANE 540119 ENOGGERA DAM ALERT 78.91 Moderate 28/01/2013 03:04BRISBANE 540130 BOWEN HILLS ALERT 2.72 Moderate 27/01/2013 20:37BRISBANE 540286 BREAKFAST CREEK MOUTH AL 2.12 Moderate 28/01/2013 10:40BURDEKIN 533102 JACKS CREEK TM 12.885 Minor 25/01/2013 12:40BURDEKIN 533015 JACKS CREEK ALERT 13.02 Minor 25/01/2013 12:38BURDEKIN 533024 MYUNA TM 7.502 Minor 25/01/2013 11:00BURDEKIN 33292 MYUNA ALERT 7.51 Minor 25/01/2013 10:37BURNETT 539092 CANIA DAM HW TM 3.447 Major 27/01/2013 01:15BURNETT 39000 ABERCORN 11.15 Major 27/01/2013 09:00BURNETT 39319 ABERCORN TM 11.15 Major 27/01/2013 08:11BURNETT 539052 LANDS END TM 11.892 Major 26/01/2013 23:50BURNETT 539035 JOHN GOLEBY WEIR HW TM 9.49 Moderate 27/01/2013 07:30BURNETT 39318 CERATODUS TM 19.929 Major 27/01/2013 08:00BURNETT 539051 WURUMA DAM HW TM 3.739 Major 27/01/2013 07:00BURNETT 539074 WURUMA DAM TW TM 5.708 Major 26/01/2013 22:58BURNETT 39259 EIDSVOLD BRIDGE 7.2 Minor 29/01/2013 17:00BURNETT 39321 EIDSVOLD TM 20.211 Major 27/01/2013 08:50BURNETT 39324 MARRIAGES TM 17.46 Major 27/01/2013 15:30BURNETT 39177 GLENWOOD 11.2 Moderate 27/01/2013 12:00BURNETT 539037 DYKEHEAD TM 9.545 Moderate 27/01/2013 13:30BURNETT 539042 BROVINIA TM 12.073 Major 27/01/2013 11:00BURNETT 540056 CARTERS TM 10.079 Major 27/01/2013 15:00BURNETT 540055 PROSTON TM 12.428 Major 27/01/2013 21:00BURNETT 540262 BOONDOOMA DAM HW TM 6.169 Major 28/01/2013 06:30BURNETT 40455 DUNOLLIE 12.98 Major 28/01/2013 07:30BURNETT 539069 COORANGA TM 15.486 Major 28/01/2013 13:00BURNETT 539038 DERRA TM 18.57 Major 27/01/2013 23:45BURNETT 39073 MUNDUBBERA 23 Major 28/01/2013 01:00BURNETT 39320 MUNDUBBERA TW TM 17.668 Major 27/01/2013 12:50BURNETT 39323 GAYNDAH FLUME TM 18.741 Major 27/01/2013 12:10BURNETT 540041 BROOKLANDS TM 8.626 Major 27/01/2013 15:20BURNETT 40500 EMBREYS BRIDGE 7.05 Major 27/01/2013 18:00

TC Oswald Floods – January 2013
Bureau of Meteorology, Queensland Page 22 http://www.bom.gov.au/hydro/flood/qld/fld_reports/reports.shtml © Copyright Commonwealth of Australia 2013, Bureau of Meteorology (ABN 92 637 533 532)
BURNETT 540042 GLENMORE TM 5.64 Major 28/01/2013 03:00BURNETT 540053 BJELKE-PETERSEN DAM HW TM 2.705 Minor 28/01/2013 17:00BURNETT 40834 LITZOWS TM 12.309 Major 27/01/2013 12:00BURNETT 540361 JOE SIPPEL WEIR TW TM 9.729 Major 27/01/2013 12:50BURNETT 540077 FICKS CROSSING TM 10.967 Major 27/01/2013 18:30BURNETT 539073 SILVERLEAF WEIR TW TM 7.713 Minor 27/01/2013 09:30BURNETT 539077 SILVERLEAF WEIR HW TM 4.789 Major 27/01/2013 22:45BURNETT 540075 ETTIEWYN TM 11.389 Major 27/01/2013 12:10BURNETT 40827 BAN BAN TM 14.007 Major 27/01/2013 09:00BURNETT 40428 BRIAN PASTURES 13 Major 27/01/2013 08:30BURNETT 39193 MT LAWLESS TM 17.986 Major 28/01/2013 13:40BURNETT 539045 CORINGA TM 15.176 Major 27/01/2013 09:10BURNETT 539108 PARADISE DAM HW TM 71.884 Major 27/01/2013 04:30BURNETT 39184 PARADISE DAM 76.25 Major 28/01/2013 19:00BURNETT 539021 FIG TREE TM 22.256 Major 28/01/2013 22:20BURNETT 39313 WALLA TM 23.248 Major 28/01/2013 22:40BURNETT 539089 WALLA WEIR HW TM 27.588 Major 29/01/2013 12:45BURNETT 539058 WOONGARRA P/S TM 17.555 Major 29/01/2013 12:15BURNETT 39170 BUNDABERG 9.525 Major 29/01/2013 15:00BURRUM 40907 HOWARD ALERT 11.97 Major 27/01/2013 13:33BURRUM 40904 RAILWAY BRIDGE ALERT 9.97 Major 27/01/2013 09:21BURRUM 40903 PACIFIC HAVEN ALERT 5.6 Major 27/01/2013 12:32BURRUM 540076 BRUCE HIGHWAY TM 14.289 Major 27/01/2013 12:10BURRUM 539059 ELLIOTT TM 6.148 Major 27/01/2013 10:00BURRUM 539060 DR MAYS CROSSING TM 4.539 Major 27/01/2013 11:00BURRUM 539061 BURRUM HIGHWAY TM 13.601 Major 27/01/2013 14:00
CONDAMINE-BALONNE 41046 THE HEAD 5 Major 28/01/2013 09:00CONDAMINE-BALONNE 541039 BROSNANS BARN TM 6.462 Major 28/01/2013 08:00CONDAMINE-BALONNE 41537 KILLARNEY ALERT 6.25 Major 27/01/2013 22:48CONDAMINE-BALONNE 41494 ELBOW VALLEY TM 6.211 Major 28/01/2013 14:00CONDAMINE-BALONNE 41535 ELBOW VALLEY ALERT 6.1 Major 28/01/2013 12:44CONDAMINE-BALONNE 41533 EMU VALE ALERT 8.91 Major 28/01/2013 06:20CONDAMINE-BALONNE 541035 EMU VALE TM 8.894 Major 28/01/2013 06:20CONDAMINE-BALONNE 41536 MURRAYS BRIDGE ALERT 8.4 Major 28/01/2013 10:12CONDAMINE-BALONNE 541036 SWANFELS TM 4.428 Moderate 28/01/2013 05:00CONDAMINE-BALONNE 41530 YANGAN ALERT 7.9 Minor 28/01/2013 06:22CONDAMINE-BALONNE 41503 WARWICK (SCOTS COLLEGE) TM 6.886 Major 28/01/2013 15:00CONDAMINE-BALONNE 41534 WARWICK ALERT 7.41 Major 28/01/2013 14:49CONDAMINE-BALONNE 41531 GLENGALLAN CREEK ALERT 5.7 Major 27/01/2013 21:07CONDAMINE-BALONNE 41473 PRATTEN 9.25 Major 28/01/2013 21:00CONDAMINE-BALONNE 41501 PRATTEN ALERT 8.935 Major 28/01/2013 20:20CONDAMINE-BALONNE 541038 TALGAI WEIR TW TM 7.234 Major 28/01/2013 23:00CONDAMINE-BALONNE 41516 ALLORA TM 7.019 Major 28/01/2013 11:00CONDAMINE-BALONNE 41404 ELLANGOWAN 4.7 Major 29/01/2013 06:00CONDAMINE-BALONNE 41518 AIDES BRIDGE TM 5.685 Major 28/01/2013 11:00CONDAMINE-BALONNE 41405 FELTON 3.9 Minor 27/01/2013 19:00CONDAMINE-BALONNE 41515 FELTON TM 2.448 Moderate 28/01/2013 10:00CONDAMINE-BALONNE 41499 TUMMAVILLE TM 10.739 Major 29/01/2013 13:00CONDAMINE-BALONNE 541040 YARRAMALONG TM 7.001 Major 29/01/2013 18:15CONDAMINE-BALONNE 41472 CENTENARY BRIDGE 8.2 Major 30/01/2013 08:00CONDAMINE-BALONNE 41498 CECIL PLAINS TM 8.284 Major 31/01/2013 04:00

TC Oswald Floods – January 2013
Bureau of Meteorology, Queensland Page 23 http://www.bom.gov.au/hydro/flood/qld/fld_reports/reports.shtml © Copyright Commonwealth of Australia 2013, Bureau of Meteorology (ABN 92 637 533 532)
CONDAMINE-BALONNE 541047 PAMPAS BRIDGE TM 3.092 Moderate 30/01/2013 09:00CONDAMINE-BALONNE 41479 FAIRVIEW TM 6.392 Major 28/01/2013 14:00CONDAMINE-BALONNE 41339 LOUDOUN BRIDGE 10.5 Major 1/02/2013 09:00 CONDAMINE-BALONNE 541054 LOUDOUN BRIDGE TM 7.093 Major 31/01/2013 22:00CONDAMINE-BALONNE 541043 CLYDESDALE ALERT 4.38 Major 28/01/2013 00:05CONDAMINE-BALONNE 541042 MOFFATT ALERT 3.35 Minor 27/01/2013 20:57CONDAMINE-BALONNE 541041 DALBY ALERT 2.56 Minor 28/01/2013 18:46CONDAMINE-BALONNE 41486 WARRA-KOGAN RD BR 12.3 Major 2/02/2013 12:30 CONDAMINE-BALONNE 41490 BRIGALOW BRIDGE TM 12.391 Major 2/02/2013 21:40 CONDAMINE-BALONNE 41517 CHINCHILLA WEIR TM 12.416 Major 31/01/2013 13:00CONDAMINE-BALONNE 41409 BERUNA 7.85 Major 29/01/2013 09:00CONDAMINE-BALONNE 41020 SEVEN OAKS TM 6.56 Major 29/01/2013 09:00CONDAMINE-BALONNE 41351 CHINCHILLA 6.55 Major 29/01/2013 23:00CONDAMINE-BALONNE 541074 CHINCHILLA TM 8.722 Major 30/01/2013 01:00CONDAMINE-BALONNE 42048 CONDAMINE 11.7 Major 2/02/2013 08:00 CONDAMINE-BALONNE 42098 COTSWOLD TM 13.709 Major 3/02/2013 23:10 CONDAMINE-BALONNE 42049 MILES 9.475 Minor 29/01/2013 06:30CONDAMINE-BALONNE 42113 GILWEIR TM 11.462 Minor 29/01/2013 10:00CONDAMINE-BALONNE 42113 PINE HILL CROSSING 8.8 Major 30/01/2013 12:00CONDAMINE-BALONNE 43052 WARKON 11.03 Major 3/02/2013 06:00 CONDAMINE-BALONNE 43063 SURAT 10.93 Major 6/02/2013 12:00 CONDAMINE-BALONNE 543005 SURAT TM 10.548 Major 6/02/2013 21:00 CONDAMINE-BALONNE 43101 WERIBONE TM 11.375 Major 7/02/2013 15:20 CONDAMINE-BALONNE 43107 WARROO 9.9 Minor 7/02/2013 09:00 CONDAMINE-BALONNE 43053 ST GEORGE 7.65 Major 7/02/2013 15:00 CONDAMINE-BALONNE 43104 ST GEORGE TM 7.526 Major 7/02/2013 15:00 CONDAMINE-BALONNE 44154 WHYENBAH 6.4 Moderate 7/02/2013 09:00 CONDAMINE-BALONNE 544017 HASTINGS TM 5.461 Moderate 7/02/2013 14:50 CONDAMINE-BALONNE 544022 CARDIFF TM 12.153 Major 5/02/2013 10:20
COOPER CREEK 538001 RETREAT TM 3.55 Minor 22/01/2013 04:00DAINTREE 31127 DAINTREE VILLAGE 4.3 Minor 23/01/2013 15:00
DON 33265 IDA CREEK ALERT 3.61 Minor 24/01/2013 20:38DON 533028 IDA CREEK TM 3.613 Minor 24/01/2013 20:40DON 33267 MT DANGAR ALERT 5.95 Major 24/01/2013 21:26DON 533013 REEVES TM 5.27 Moderate 24/01/2013 23:00DON 33268 REEVES ALERT 5.25 Moderate 24/01/2013 22:04DON 33264 BOWEN PUMP STATION ALERT 4.45 Moderate 24/01/2013 23:53
FITZROY 535013 WINDAMERE TM 7.725 Moderate 27/01/2013 19:00FITZROY 35273 CHILGERRIE HILL 7.4 Moderate 28/01/2013 10:00FITZROY 35115 TAROOM 5.35 Minor 29/01/2013 09:00FITZROY 35282 TAROOM TM 5.324 Minor 29/01/2013 13:00FITZROY 39315 THEODORE 9.3 Minor 27/01/2013 14:30FITZROY 535110 THEODORE WEIR TM 9.09 Minor 27/01/2013 09:50FITZROY 539043 WOODLEIGH TM 10.616 Minor 28/01/2013 00:00FITZROY 39296 MOURA 9.3 Minor 28/01/2013 08:00FITZROY 539081 MOURA WEIR TM 2.265 Minor 28/01/2013 08:45FITZROY 535021 REDCLIFFE TM 8.075 Major 27/01/2013 03:50FITZROY 35227 KARAMEA 10.45 Major 27/01/2013 18:00FITZROY 539079 BARALABA TW TM 13.272 Major 29/01/2013 02:30FITZROY 539080 BARALABA HW TM 4.56 Major 28/01/2013 19:15FITZROY 535015 BECKERS TM 14.975 Major 29/01/2013 05:00

TC Oswald Floods – January 2013
Bureau of Meteorology, Queensland Page 24 http://www.bom.gov.au/hydro/flood/qld/fld_reports/reports.shtml © Copyright Commonwealth of Australia 2013, Bureau of Meteorology (ABN 92 637 533 532)
FITZROY 539062 KINGSBOROUGH TM 10.076 Major 25/01/2013 16:30FITZROY 539068 GOOVIGEN TM 11.035 Major 27/01/2013 04:00FITZROY 539016 WURA TM 11.846 Major 25/01/2013 12:30FITZROY 539057 RANNES TM 14.05 Major 26/01/2013 01:50FITZROY 39308 RANNES 13.5 Major 26/01/2013 02:00FITZROY 35270 NEWLANDS 18.05 Major 27/01/2013 06:00FITZROY 535090 THE LAKE ALERT 10.33 Minor 27/01/2013 12:09FITZROY 35266 BINGEGANG 11.52 Moderate 27/01/2013 09:45FITZROY 533091 MT BRIDGET TM 18.663 Major 25/01/2013 05:10FITZROY 33083 CARDOWAN 16.2 Major 25/01/2013 09:00FITZROY 534005 FUNNEL CREEK TM 10.952 Major 25/01/2013 11:10FITZROY 533030 BRAESIDE TM 9.425 Moderate 25/01/2013 02:00FITZROY 534004 PINK LAGOON TM 14.231 Moderate 26/01/2013 06:00FITZROY 534014 YATTON TM 16.691 Major 27/01/2013 05:00FITZROY 34096 TARTRUS TM 15.865 Major 28/01/2013 00:00FITZROY 535024 COOLMARINGA TM 19.671 Major 29/01/2013 06:00FITZROY 39044 RIVERSLEA TM 25.107 Major 30/01/2013 11:50FITZROY 33285 THE GAP TM 17.551 Major 1/02/2013 14:30 FITZROY 533029 WATTLEBANK TM 20.365 Major 1/02/2013 17:50 FITZROY 33076 YAAMBA 15.7 Major 1/02/2013 18:00 FITZROY 33310 SOUTH YAAMBA TM 11.616 Moderate 1/02/2013 22:30 FITZROY 39347 LAUREL BANK TM 7.822 Moderate 2/02/2013 12:10 FITZROY 39264 ROCKHAMPTON 8.6 Major 2/02/2013 09:00
HAUGHTON 533027 MT PICCANINNY TM 3.972 Minor 24/01/2013 13:40HAUGHTON 533055 MT PICCANINNY ALERT 3.9 Minor 24/01/2013 06:21HAUGHTON 533016 MAJOR CREEK TM 8.614 Moderate 24/01/2013 12:00HAUGHTON 533072 MAJOR CREEK ALERT 8.61 Moderate 24/01/2013 11:01HAUGHTON 33280 POWERLINE TM 6.486 Moderate 24/01/2013 13:00HAUGHTON 533056 POWERLINE ALERT 6.41 Moderate 24/01/2013 11:53HAUGHTON 33253 GIRU 2.75 Major 24/01/2013 16:00HAUGHTON 533051 GIRU ALERT 2.7 Major 24/01/2013 14:33HERBERT 32169 GLENEAGLE ALERT 5.7 Minor 25/01/2013 21:45HERBERT 532066 GLENEAGLE TM 5.741 Minor 26/01/2013 01:00HERBERT 32170 NASH'S CROSSING ALERT 7.15 Moderate 24/01/2013 00:29HERBERT 32184 ZATTAS ALERT 5.83 Moderate 24/01/2013 00:06HERBERT 532010 GOWRIE CREEK TM 6.73 Moderate 23/01/2013 17:15HERBERT 532006 ABERGOWRIE TM 11.625 Moderate 24/01/2013 05:13HERBERT 32091 ELPHINSTONE PKT 13.5 Moderate 24/01/2013 06:00HERBERT 532028 ABERGOWRIE BRIDGE ALERT 14 Major 24/01/2013 08:59HERBERT 532067 TREBONNE AL 13.87 Major 24/01/2013 15:03HERBERT 532012 INGHAM PUMP STATION TM 13.518 Major 24/01/2013 11:35HERBERT 32171 INGHAM PUMP STATION AL 14.24 Major 24/01/2013 11:27HERBERT 32094 GAIRLOCH 12.02 Major 24/01/2013 12:00HERBERT 532027 GAIRLOCH ALERT 12 Major 24/01/2013 08:43HERBERT 32185 HALIFAX ALERT 5.52 Major 24/01/2013 09:14
JOHNSTONE 32165 NERADA ALERT 6.03 Minor 23/01/2013 10:40JOHNSTONE 532014 SALTWATER CREEK ALERT 11.113 Major 5/02/2013 12:56 JOHNSTONE 32160 CENTRAL MILL ALERT 7.65 Minor 23/01/2013 13:49
KOLAN 539048 SPRINGFIELD TM 14.348 Major 26/01/2013 20:30KOLAN 539050 FRED HAIGH DAM HW TM 6.857 Major 27/01/2013 10:45KOLAN 39011 MONDURAN 13.3 Major 27/01/2013 12:00

TC Oswald Floods – January 2013
Bureau of Meteorology, Queensland Page 25 http://www.bom.gov.au/hydro/flood/qld/fld_reports/reports.shtml © Copyright Commonwealth of Australia 2013, Bureau of Meteorology (ABN 92 637 533 532)
KOLAN 539046 GIN GIN CREEK TM 16.003 Major 27/01/2013 00:10KOLAN 539047 BUCCA WEIR HW TM 23.846 Major 27/01/2013 00:45KOLAN 539091 GOOBURRUM P/S TM 10.648 Major 27/01/2013 06:45
LEICHHARDT 529010 FLORAVILLE TM 999.999 Major 5/02/2013 03:50 LOGAN-ALBERT 40936 LUMEAH ALERT 8.21 Moderate 28/01/2013 02:37LOGAN-ALBERT 540303 LUMEAH TM 8.321 Moderate 28/01/2013 02:50LOGAN-ALBERT 40738 BROMFLEET TM 15.684 Moderate 28/01/2013 11:00LOGAN-ALBERT 40938 BROMFLEET ALERT 15.71 Moderate 28/01/2013 11:37LOGAN-ALBERT 40761 WOLFFDENE ALERT 10.45 Major 28/01/2013 17:30LOGAN-ALBERT 540598 BAHRS SCRUB ALERT 7.87 Minor 27/01/2013 16:52LOGAN-ALBERT 40723 BEENLEIGH 6.2 Major 29/01/2013 01:00LOGAN-ALBERT 40832 FOREST HOME TM 5.52 Moderate 28/01/2013 05:20LOGAN-ALBERT 40754 RATHDOWNEY TM 12.509 Major 28/01/2013 07:40LOGAN-ALBERT 40946 RATHDOWNEY ALERT 12.25 Major 28/01/2013 07:12LOGAN-ALBERT 540074 DIECKMANS BRIDGE TM 4.233 Minor 27/01/2013 23:29LOGAN-ALBERT 40943 DIECKMANS BRIDGE ALERT 4.24 Minor 27/01/2013 23:16LOGAN-ALBERT 40539 DULBOLLA 12.5 Major 28/01/2013 08:00LOGAN-ALBERT 40944 RUDDS LANE ALERT 4.24 Minor 28/01/2013 02:29LOGAN-ALBERT 40714 ROUND MOUNTAIN TM 15.23 Major 28/01/2013 14:40LOGAN-ALBERT 40945 ROUND MOUNTAIN ALERT 15.02 Major 28/01/2013 14:08LOGAN-ALBERT 40939 BEAUDESERT ALERT 12.75 Major 28/01/2013 15:30
LOGAN-ALBERT 40841 CROFTBY TM 6.324 Major 28/01/2013 05:16
LOGAN-ALBERT 40947 CROFTBY ALERT 6.21 Major 28/01/2013 04:15
LOGAN-ALBERT 40949 BOONAH ALERT 7.25 Major 28/01/2013 05:28LOGAN-ALBERT 40762 YARRAHAPPINI TM 17.731 Major 29/01/2013 05:00LOGAN-ALBERT 40940 YARRAHAPPINI ALERT 17.42 Major 29/01/2013 04:48LOGAN-ALBERT 540214 SOUTH MACLEAN TM 15.933 Major 29/01/2013 10:30LOGAN-ALBERT 40542 MACLEAN BRIDGE 18.39 Major 29/01/2013 15:00LOGAN-ALBERT 540596 LOGAN VILLAGE ALERT 14.16 Major 29/01/2013 21:56LOGAN-ALBERT 40665 WATERFORD 8.95 Moderate 30/01/2013 06:45LOGAN-ALBERT 40878 WATERFORD ALERT 9.75 Major 30/01/2013 14:04LOGAN-ALBERT 540079 SLACKS CK(RESERVE PK) AL 9.05 Moderate 27/01/2013 17:06LOGAN-ALBERT 540078 MARSDEN (FIRST AVE) AL 9.55 Minor 27/01/2013 21:28LOGAN-ALBERT 540091 SLACKS CK(LOGANLEA RD)AL 7.12 Moderate 30/01/2013 10:27LOGAN-ALBERT 40709 EAGLEBY 4.75 Moderate 31/01/2013 00:00LOGAN-ALBERT 540236 CARBROOK(RIEDEL ROAD) AL 2 Minor 7/02/2013 08:47
MAROOCHY 540300 MOOLOOLAH TM 5.437 Moderate 27/01/2013 14:00MAROOCHY 540345 MOOLOOLAH AL 5.45 Moderate 27/01/2013 12:56MAROOCHY 540344 JORDAN ST AL 5.3 Major 27/01/2013 16:14MAROOCHY 540421 TANAWHA ALERT 1.8 Minor 27/01/2013 14:11MAROOCHY 540342 OLD GYMPIE RD AL 4.28 Moderate 27/01/2013 15:06MAROOCHY 540343 BEERWAH AL 5.1 Minor 27/01/2013 15:21MAROOCHY 540052 EUMUNDI TM 6.274 Major 27/01/2013 11:51MAROOCHY 540093 EUMUNDI ALERT 6.73 Major 27/01/2013 15:21MAROOCHY 540089 KIAMBA ALERT 4.39 Moderate 27/01/2013 13:06MAROOCHY 540263 KIAMBA TM 4.356 Moderate 27/01/2013 13:10MAROOCHY 540265 YANDINA TM 3.969 Moderate 27/01/2013 13:20MAROOCHY 540092 YANDINA ALERT 3.99 Moderate 27/01/2013 13:24MAROOCHY 540095 DUNETHIN ROCK ALERT 3.05 Moderate 27/01/2013 15:39MAROOCHY 540266 WARANA BRIDGE TM 7.509 Moderate 27/01/2013 13:10MAROOCHY 540088 WARANA BRIDGE ALERT 7.54 Moderate 27/01/2013 13:03

TC Oswald Floods – January 2013
Bureau of Meteorology, Queensland Page 26 http://www.bom.gov.au/hydro/flood/qld/fld_reports/reports.shtml © Copyright Commonwealth of Australia 2013, Bureau of Meteorology (ABN 92 637 533 532)
MAROOCHY 540506 BLI BLI ALERT 2.95 Moderate 27/01/2013 15:37MAROOCHY 540420 PALMWOODS SPORTSGROUND ALERT 4.65 Moderate 27/01/2013 12:22MAROOCHY 540083 DIDDILLIBAH ALERT 4.01 Moderate 27/01/2013 15:56MAROOCHY 540289 KIELS MOUNTAIN TM 3.121 Minor 27/01/2013 18:00MAROOCHY 540087 KIELS MOUNTAIN ALERT 3.2 Minor 27/01/2013 17:10MAROOCHY 540094 PICNIC POINT ALERT 2.295 Major 27/01/2013 07:48
MARY 40830 BELLBIRD CREEK TM 8.775 Major 27/01/2013 13:40MARY 540332 BELLBIRD CREEK ALERT 8.78 Major 27/01/2013 13:46MARY 540331 KENILWORTH H/S ALERT 10.57 Major 27/01/2013 17:04MARY 40814 MOY POCKET TM 15.551 Major 27/01/2013 17:20MARY 540330 MOY POCKET ALERT 15.6 Major 27/01/2013 17:16MARY 540575 BORUMBA DAM HW AL 6 Major 27/01/2013 14:04MARY 540264 BORUMBA DAM HW TM 6.066 Major 27/01/2013 13:50MARY 40780 HYGAIT TM 8.49 Major 27/01/2013 12:10MARY 40778 ZACHARIAH TM 9.67 Moderate 27/01/2013 11:54MARY 40781 DAGUN POCKET TM 16.904 Major 28/01/2013 03:35MARY 540569 DAGUN POCKET ALERT 16.9 Major 28/01/2013 02:10MARY 540327 LAKE MACDONALD DRIVE AL 5.85 Major 27/01/2013 15:17MARY 40782 COORAN TM 10.581 Moderate 27/01/2013 14:03MARY 540326 COORAN ALERT 10.62 Moderate 27/01/2013 13:44MARY 540215 GYMPIE WEIR TM 20.256 Major 28/01/2013 11:55MARY 40426 GYMPIE 19.98 Major 28/01/2013 11:30MARY 40993 GYMPIE ALERT 19.64 Major 28/01/2013 15:56MARY 40824 FISHERMANS POCKET TM 20.954 Major 28/01/2013 13:00MARY 40811 KILKIVAN TM 8.971 Major 27/01/2013 08:44MARY 540043 BROOYAR TM 13.886 Major 27/01/2013 11:00MARY 40826 MIVA TM 20.57 Major 27/01/2013 20:40MARY 40688 MIVA 20.9 Major 27/01/2013 18:00MARY 40825 MARODIAN TM 16.713 Major 27/01/2013 22:00MARY 40833 HOME PARK TM 14.192 Major 30/01/2013 18:00MARY 40203 TIARO 20.8 Major 28/01/2013 17:00MARY 540039 THE BARRAGE TM 13.613 Major 28/01/2013 11:15MARY 540288 TAGIGAN ROAD TM 7.394 Major 27/01/2013 15:00MARY 40679 BAUPLE EAST TM 13.043 Major 28/01/2013 16:00MARY 40896 TEDDINGTON WEIR HW TM 12.139 Major 27/01/2013 14:40MARY 540027 TINANA BARRAGE HW TM 10.181 Major 29/01/2013 06:00MARY 40443 MARYBOROUGH 10.7 Major 29/01/2013 07:30
MITCHELL 29038 KOWANYAMA AP 3.89 Moderate 30/01/2013 15:00MOONIE 41493 THE DEEP CROSSING 4.86 Major 28/01/2013 14:30MOONIE 42100 SOUTHWOOD 6.65 Major 29/01/2013 09:00MOONIE 42053 FLINTON 4.98 Moderate 1/02/2013 15:00 MOONIE 42103 MT DRIVEN 7.07 Major 3/02/2013 12:00 MOONIE 44194 NINDIGULLY 3.78 Moderate 5/02/2013 09:00 MOONIE 542009 THALLON BRIDGE 5.14 Major 7/02/2013 12:00
MULGRAVE-RUSSELL 531046 THE FISHERIES TM 4.358 Minor 23/01/2013 08:00MULGRAVE-RUSSELL 531076 THE FISHERIES ALERT 4.85 Minor 23/01/2013 09:40MULGRAVE-RUSSELL 531023 PEETS BRIDGE TM 6.305 Minor 23/01/2013 10:00MULGRAVE-RUSSELL 531052 PEETS BRIDGE ALERT 6.25 Minor 23/01/2013 10:05MULGRAVE-RUSSELL 531051 GORDONVALE ALERT 12.5 Minor 23/01/2013 12:01MULGRAVE-RUSSELL 531024 BUCKLANDS TM 7.106 Moderate 23/01/2013 13:40MULGRAVE-RUSSELL 531074 CLYDE RD ALERT 0.71 Minor 23/01/2013 19:08

TC Oswald Floods – January 2013
Bureau of Meteorology, Queensland Page 27 http://www.bom.gov.au/hydro/flood/qld/fld_reports/reports.shtml © Copyright Commonwealth of Australia 2013, Bureau of Meteorology (ABN 92 637 533 532)
NOOSA 540309 LAKE COOROIBAH ALERT 1.2 Minor 28/01/2013 09:27NOOSA 540310 TEWANTIN ALERT 1.18 Minor 27/01/2013 09:45
PINE 540131 TOOMBUL(NUDGEE RD) ALERT 3.18 Moderate 27/01/2013 19:02PINE 540431 FRANK SLEEMAN PARK AL 4.49 Minor 27/01/2013 16:49PINE 540124 DEAGON ALERT 2.05 Minor 27/01/2013 19:53PINE 540205 DRAPERS CROSSING ALERT 6.76 Major 27/01/2013 18:33PINE 540414 NORMANBY WAY ALERT 4.49 Moderate 27/01/2013 20:15PINE 540412 YOUNGS CROSSING ALERT 7.44 Minor 27/01/2013 23:03PINE 540245 BURPENGARY(ROWLEY RD) AL 19.55 Minor 27/01/2013 17:24PINE 540242 BURPENGARY (DALE ST) AL 9.94 Moderate 27/01/2013 17:41PINE 540208 UPPER CABOOLTURE TM 9.948 Minor 27/01/2013 16:00PINE 540357 UPPER CABOOLTURE ALERT 9.895 Minor 27/01/2013 15:37PINE 540243 CABOOLTURE WTP ALERT 8.19 Moderate 27/01/2013 17:22
PIONEER 33301 WHITEFORD'S ALERT 5.29 Minor 24/01/2013 22:51PIONEER 33282 SARICH'S TM 9.135 Moderate 24/01/2013 22:10PIONEER 33299 SARICH'S ALERT 9.14 Moderate 24/01/2013 22:06PIONEER 33302 MIRANI WEIR ALERT 8.13 Minor 24/01/2013 23:19PIONEER 33277 MIRANI WEIR TM 8.234 Minor 24/01/2013 23:20PIONEER 33283 DUMBLETON ROCKS TM 17.577 Minor 24/01/2013 08:40PIONEER 33300 DUMBLETON ROCKS ALERT 17.75 Minor 25/01/2013 00:57
ROSS 532035 STUART CREEK ALERT 5.58 Minor 23/01/2013 19:59ROSS 532032 LOUISA CREEK ALERT 5.08 Minor 23/01/2013 17:32ROSS 532015 BOHLE RIVER TM 6.096 Moderate 24/01/2013 08:39ROSS 532043 BOHLE RIVER ALERT 6.1 Moderate 24/01/2013 07:36
SOUTH COAST 540054 LITTLE NERANG DAM ALERT 2.8 Moderate 27/01/2013 22:17SOUTH COAST 540610 HINZE DAM HW TM 4.358 Minor 29/01/2013 02:25SOUTH COAST 540374 HINZE DAM ALERT-B 4.36 Minor 29/01/2013 03:45SOUTH COAST 540254 MUDGEERABA ALERT 9.98 Major 29/01/2013 20:00SOUTH COAST 540356 TALLEBUDGERA CK RD AL 5.12 Moderate 27/01/2013 22:24SOUTH COAST 540228 CANUNGRA ARMY TM 7.349 Major 27/01/2013 21:50SOUTH COAST 540290 CANUNGRA ARMY ALERT 7.34 Major 27/01/2013 21:41SOUTH COAST 540291 CLAGIRABA ROAD ALERT 0.616 Minor 27/01/2013 15:27SOUTH COAST 540292 OXENFORD WEIR ALERT 4.64 Minor 27/01/2013 22:26SOUTH COAST 540293 COOMERA SHORES ALERT 1.67 Moderate 28/01/2013 10:17
TULLY 531057 BOLINDA ESTATE ALERT 4.95 Minor 23/01/2013 07:27TULLY 32115 EURAMO 8.85 Moderate 23/01/2013 21:00TULLY 32167 EURAMO TM 8.71 Moderate 23/01/2013 19:40TULLY 532059 EURAMO ALERT 8.79 Moderate 23/01/2013 19:09TULLY 32109 UPPER MURRAY TM 8.276 Moderate 23/01/2013 16:00TULLY 532061 UPPER MURRAY ALERT 8.27 Moderate 23/01/2013 15:47TULLY 532060 MURRAY FLATS ALERT 8.35 Major 24/01/2013 04:55

TC Oswald Floods – January 2013
Bureau of Meteorology, Queensland Page 28 http://www.bom.gov.au/hydro/flood/qld/fld_reports/reports.shtml © Copyright Commonwealth of Australia 2013, Bureau of Meteorology (ABN 92 637 533 532)
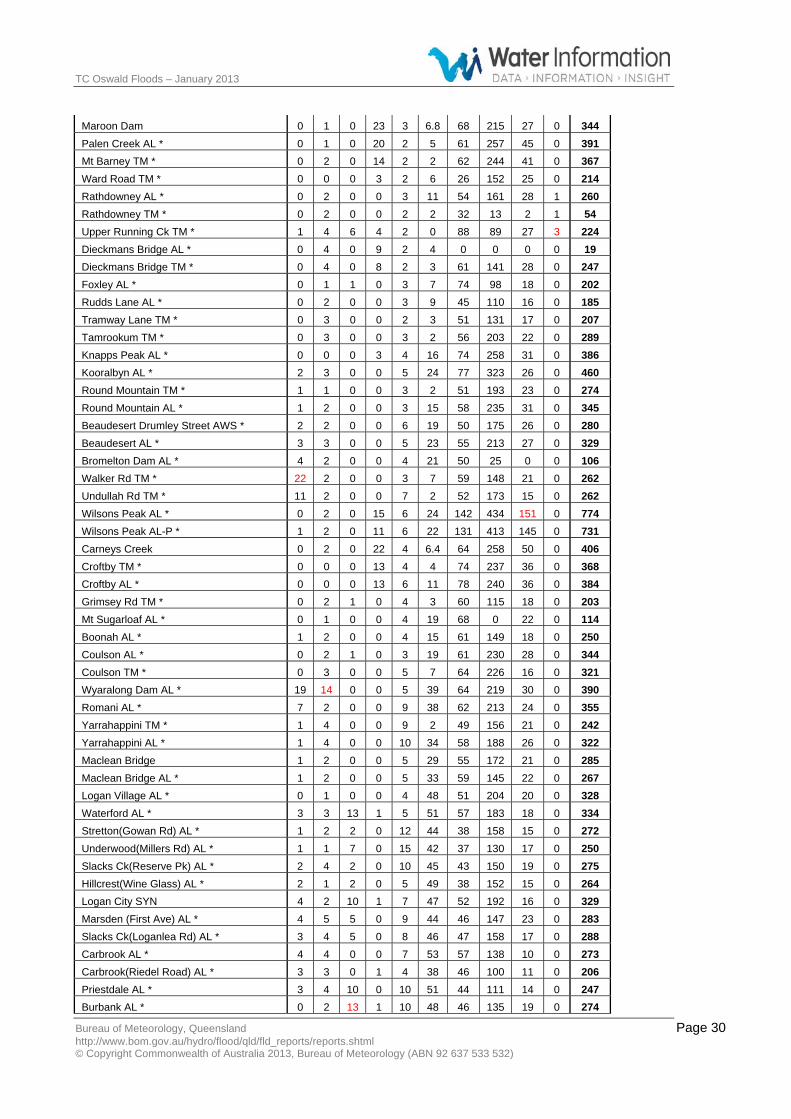
Appendix 2. Rainfall Tables The abbreviations used in the following tables include: AL - ALERT Radio Telemetry, TM - Telephone Telemetry, AWS - Automatic Weather Station, SYN - Synoptic Station, - No Data, * automatic station. Red numbers show the highest totals recorded on a particular day for each catchment. Note: Rainfall data is operational data and has not been quality controlled so errors may exist.
24 hour rainfall to 9am on
January Total
Station Name
21 22 23 24 25 26 27 28 29 30 (mm)
Nerang Upper Springbrook AL * 23 18 1 5 19 123 209 744 377 0 1,519 Springbrook 13 6 0 5 10 80 121 430 193 0 858 Springbrook TM * 20 14 0 4 18 16 154 570 323 0 1,119 Little Nerang Dam AL * 26 5 0 6 10 60 137 429 175 0 848 Tallai AL * 9 7 0 1 7 36 87 274 114 0 535 Numinbah AL * 6 2 0 2 9 52 124 480 111 0 786 Numinbah Valley TM * 11 5 0 7 7 10 121 482 116 0 759 Numinbah Valley AL * 12 5 0 7 8 61 118 496 118 0 825 Nerang 0 7 0 0 21 27 53 232 138 0 478 Clearview AL * 0 5 1 0 16 21 52 214 67 0 376 Molendinar AL * 0 3 0 0 14 15 47 159 85 0 323 Mt Nimmel AL * 29 5 1 4 11 66 120 337 207 1 781 Bonogin AL * 7 5 0 3 7 27 76 247 125 0 497 Worongary Creek AL * 3 7 0 0 6 15 65 215 134 0 445 Neranwood AL * 18 4 0 1 7 48 101 363 203 0 745 Boobegan Creek Lock AL * 1 3 0 1 5 8 41 131 75 0 265 Evandale AL * 1 3 0 0 9 6 46 135 57 0 257 Biggera Ck Dam AL * 1 5 1 5 6 12 51 194 83 0 358 Loder Ck Dam AL * 0 5 0 0 5 7 49 161 106 0 333 Loder Creek AL * 0 3 0 0 4 4 39 116 88 0 254 Southport - 3 0 18 8 142 186 98 0 0 455 Air Sea Rescue AL * 0 5 0 5 3 3 35 114 62 0 227 Gold Coast Seaway AWS * 1 6 0 9 3 6 35 108 73 0 241 Burleigh Waters AL * 1 9 0 0 11 1 22 38 12 0 94 Miami 0 11 0 4 8 277 in 4 days 0 319 Upper Tallebudgera AL * 6 3 1 0 2 21 89 55 134 12 323 Tallebudgera Ck Dam AL * 20 5 0 9 15 49 79 331 173 0 681 Coplicks Bridge AL * 5 11 0 3 18 12 30 108 56 1 244 Oyster Creek AL * 2 19 0 0 18 6 34 145 65 0 289 Tomewin AL * 22 7 0 6 15 68 88 360 118 0 684 Tomewin - Tallowood 31 6 0 6 17 66 89 385 0 0 600 Coolangatta AWS * 11 14 0 4 36 9 29 128 60 0 292
Murwillumbah SYN 7 15 0 1 31 30 67 210 110 0 471
Maximum 31 19 1 18 36 142 209 744 377 12 1,519

TC Oswald Floods – January 2013
Bureau of Meteorology, Queensland Page 29 http://www.bom.gov.au/hydro/flood/qld/fld_reports/reports.shtml © Copyright Commonwealth of Australia 2013, Bureau of Meteorology (ABN 92 637 533 532)
24 hour rainfall to 9am on
January Total
Station Name
21 22 23 24 25 26 27 28 29 30 (mm)
Coomera Binna Burra AL * 4 5 1 5 8 74 149 415 131 0 792 Illinbah TM * 2 8 0 2 6 14 172 435 108 0 747 Tyungun AL * 7 4 0 0 8 55 87 380 57 0 598 Canungra Army AL * 1 5 3 2 8 74 90 451 68 0 702 Mt Tamborine 1 20 0 0 11 71 134 407 90 0 735 Mt Tamborine AL * 0 12 1 1 12 53 103 401 68 2 653 Clagiraba Road AL * 0 8 1 0 13 44 83 364 61 0 574 Wongawallan AL * 2 7 0 1 11 48 61 217 35 0 382 Oxenford 1 6 0 10 12 21 51 175 52 0 329 Oxenford Weir AL * 1 5 0 5 12 25 53 202 51 0 354 Coomera 3 5 in 2 0 8 16 40 126 30 0 233 Monterey Keys AL * 1 5 0 5 10 12 37 117 57 0 244
Coomera Shores AL * 1 4 1 0 12 17 46 169 67 0 317
Maximum 7 20 3 10 13 74 172 451 131 2 792
24 hour rainfall to 9am on
January Total
Station Name 21 22 23 24 25 26 27 28 29 30 (mm)
Pimpama Luscombe AL * 1 3 0 1 6 35 60 187 16 0 309 Hotham Creek AL * 1 3 0 2 5 27 37 54 27 0 156 Norwell AL * 1 3 0 2 2 7 10 14 9 0 48 Kerkin Road AL * 0 3 0 1 4 24 34 75 23 1 165
Steiglitz Wharf AL * 3 1 0 0 5 22 41 110 40 0 222
Maximum 3 3 0 2 6 35 60 187 40 1 309
24 hour rainfall to 9am on
January Total
Station Name 21 22 23 24 25 26 27 28 29 30 (mm)
Logan-Albert Darlington AL * 2 2 0 0 1 0 0 0 1 0 6 O'Reillys AL * 6 9 0 3 5 55 184 382 139 0 783 Lumeah AL * 7 4 0 0 5 13 57 103 19 0 208 Nindooinbah Dam AL * 2 2 0 0 4 12 62 108 16 0 206 Nindooindah TM * 2 1 0 0 4 2 50 112 18 0 189 Benobble AL * 1 2 0 0 8 57 102 523 49 0 742 Laheys Lookout AL * 0 6 0 0 9 55 116 481 83 1 751 Bromfleet AL * 0 8 0 0 4 26 50 247 22 0 357 Bromfleet TM * 0 1 0 0 0 0 0 0 0 0 1 Wolffdene AL * 0 1 1 0 4 39 61 203 16 1 326 Bahrs Scrub AL * 1 2 2 0 3 58 55 203 16 0 340 Canungra 1 3 0 0 7 54 105 407 85 0 662 Forest Home TM * 0 2 0 0 4 3 60 259 28 0 356 Maroon Dam AL * 0 0 0 24 4 8 75 215 22 0 348
TC Oswald Floods – January 2013
Bureau of Meteorology, Queensland Page 30 http://www.bom.gov.au/hydro/flood/qld/fld_reports/reports.shtml © Copyright Commonwealth of Australia 2013, Bureau of Meteorology (ABN 92 637 533 532)
Maroon Dam 0 1 0 23 3 6.8 68 215 27 0 344 Palen Creek AL * 0 1 0 20 2 5 61 257 45 0 391 Mt Barney TM * 0 2 0 14 2 2 62 244 41 0 367 Ward Road TM * 0 0 0 3 2 6 26 152 25 0 214 Rathdowney AL * 0 2 0 0 3 11 54 161 28 1 260 Rathdowney TM * 0 2 0 0 2 2 32 13 2 1 54 Upper Running Ck TM * 1 4 6 4 2 0 88 89 27 3 224 Dieckmans Bridge AL * 0 4 0 9 2 4 0 0 0 0 19 Dieckmans Bridge TM * 0 4 0 8 2 3 61 141 28 0 247 Foxley AL * 0 1 1 0 3 7 74 98 18 0 202 Rudds Lane AL * 0 2 0 0 3 9 45 110 16 0 185 Tramway Lane TM * 0 3 0 0 2 3 51 131 17 0 207 Tamrookum TM * 0 3 0 0 3 2 56 203 22 0 289 Knapps Peak AL * 0 0 0 3 4 16 74 258 31 0 386 Kooralbyn AL * 2 3 0 0 5 24 77 323 26 0 460 Round Mountain TM * 1 1 0 0 3 2 51 193 23 0 274 Round Mountain AL * 1 2 0 0 3 15 58 235 31 0 345 Beaudesert Drumley Street AWS * 2 2 0 0 6 19 50 175 26 0 280 Beaudesert AL * 3 3 0 0 5 23 55 213 27 0 329 Bromelton Dam AL * 4 2 0 0 4 21 50 25 0 0 106 Walker Rd TM * 22 2 0 0 3 7 59 148 21 0 262 Undullah Rd TM * 11 2 0 0 7 2 52 173 15 0 262 Wilsons Peak AL * 0 2 0 15 6 24 142 434 151 0 774 Wilsons Peak AL-P * 1 2 0 11 6 22 131 413 145 0 731 Carneys Creek 0 2 0 22 4 6.4 64 258 50 0 406 Croftby TM * 0 0 0 13 4 4 74 237 36 0 368 Croftby AL * 0 0 0 13 6 11 78 240 36 0 384 Grimsey Rd TM * 0 2 1 0 4 3 60 115 18 0 203 Mt Sugarloaf AL * 0 1 0 0 4 19 68 0 22 0 114 Boonah AL * 1 2 0 0 4 15 61 149 18 0 250 Coulson AL * 0 2 1 0 3 19 61 230 28 0 344 Coulson TM * 0 3 0 0 5 7 64 226 16 0 321 Wyaralong Dam AL * 19 14 0 0 5 39 64 219 30 0 390 Romani AL * 7 2 0 0 9 38 62 213 24 0 355 Yarrahappini TM * 1 4 0 0 9 2 49 156 21 0 242 Yarrahappini AL * 1 4 0 0 10 34 58 188 26 0 322 Maclean Bridge 1 2 0 0 5 29 55 172 21 0 285 Maclean Bridge AL * 1 2 0 0 5 33 59 145 22 0 267 Logan Village AL * 0 1 0 0 4 48 51 204 20 0 328 Waterford AL * 3 3 13 1 5 51 57 183 18 0 334 Stretton(Gowan Rd) AL * 1 2 2 0 12 44 38 158 15 0 272 Underwood(Millers Rd) AL * 1 1 7 0 15 42 37 130 17 0 250 Slacks Ck(Reserve Pk) AL * 2 4 2 0 10 45 43 150 19 0 275 Hillcrest(Wine Glass) AL * 2 1 2 0 5 49 38 152 15 0 264 Logan City SYN 4 2 10 1 7 47 52 192 16 0 329 Marsden (First Ave) AL * 4 5 5 0 9 44 46 147 23 0 283 Slacks Ck(Loganlea Rd) AL * 3 4 5 0 8 46 47 158 17 0 288 Carbrook AL * 4 4 0 0 7 53 57 138 10 0 273 Carbrook(Riedel Road) AL * 3 3 0 1 4 38 46 100 11 0 206 Priestdale AL * 3 4 10 0 10 51 44 111 14 0 247 Burbank AL * 0 2 13 1 10 48 46 135 19 0 274

TC Oswald Floods – January 2013
Bureau of Meteorology, Queensland Page 31 http://www.bom.gov.au/hydro/flood/qld/fld_reports/reports.shtml © Copyright Commonwealth of Australia 2013, Bureau of Meteorology (ABN 92 637 533 532)
Mt Cotton West AL * 3 4 5 0 9 63 60 161 17 0 322 Rochedale South AL * 2 3 11 1 16 64 46 152 25 0 320 Dunwich Airport TM * 0 0 0 0 0 0 0 0 0 0 0
Dunwich AL * 7 1 4 25 7 43 34 143 44 0 308
Maximum 22 14 13 25 16 64 184 523 151 3 783
24 hour rainfall to 9am on
January Total
Station Name 21 22 23 24 25 26 27 28 29 30 (mm)
Stanley/Upper Brisbane
Peachester 0 0 0 1 43 82 279 208 7 0 621 Peachester AL * 0 2 3 3 40 68 268 199 3 0 586 Ferris Knob AL * 0 2 3 1 34 62 195 0 0 0 297 Woodford 0 1 2 1 31 52 172 101 3 0 363 Woodford AL-P * 0 0 2 1 29 55 174 89 3 0 353 Woodford AL-B * 0 0 2 1 29 55 174 92 4 0 357 Lindfield 0 0 2 1 22 28 205 109 5.2 0 372 Lindfield AL * 0 0 2 0 24 32 230 132 6 0 426 Mt Kilcoy Weir TM * 0 0 0 0 17 17 96 89 4 0 223 Kilcoy AL * 0 0 0 0 15 22 169 111 5 0 322 Westvale AL * 2 1 0 0 12 39 128 79 4 0 265 Hazeldean AL * 4 1 0 1 14 29 91 57 7 0 204 Somerset Dam 4 0 0 0 14 38 77 73 7 0 214 Somerset Dam Hw AL-P * 3 0 1 0 12 39 52 26 5 0 138 Somerset Dam Hw AL-B * 3 0 1 0 12 39 52 26 5 0 138 Top Of Brisbane AL * 0 0 0 1 18 15 181 38 7 0 260 Monsildale AL * 0 0 1 0 22 27 277 74 10 0 411 Mt Stanley AL * 0 0 4 0 14 19 145 45 6 0 233 Blackbutt 1 0 0 0 14 31 195 100 9.6 0 350 Blackbutt AL * 0 0 0 0 15 37 205 107 9 0 373 Yarraman AL * 0 0 0 0 11 14 130 53 6 0 214 Cooyar Creek AL * 0 0 0 0 12 22 176 44 7 0 261 Linville TM * 0 0 0 0 10 17 38 59 6 12 142 Linville AL * 0 0 0 0 12 24 153 65 6 0 260 Devon Hills AL * 0 0 0 1 13 18 105 19 5 0 161 St Aubyns AL * 0 0 0 0 14 20 177 98 8 0 317 Mt Binga AL * 0 0 0 0 19 29 188 102 17 0 355 Nukinenda AL * 0 0 0 0 15 20 161 111 11 0 318 Boat Mountain TM * 1 0 0 0 12 16 126 100 12 0 267 Boat Mountain AL * 1 0 1 1 12 22 137 107 13 0 294 Glendale TM * 1 0 0 0 12 14 106 90 9 0 232 Pohlman Range AL * 1 1 0 2 9 20 110 63 12 0 218 Gregor Ck AL-P * 1 0 0 2 11 18 151 80 17 0 280 Gregor Ck AL-B * 1 0 0 2 10 18 146 78 16 0 271 Crows Nest 2 2 0 0 17 62 182 160 14 0 442 Crows Nest AL * 0 1 0 0 13 46 148 127 14 0 349 Perseverance AL * 1 1 0 0 12 53 117 110 8 0 302 Ravensbourne AL * 4 4 0 0 19 104 197 204 13 0 545 Cressbrook Dam AL * 0 2 0 0 8 41 84 66 14 0 215 Redbank Creek AL * 3 2 1 0 15 77 161 166 20 0 445

TC Oswald Floods – January 2013
Bureau of Meteorology, Queensland Page 32 http://www.bom.gov.au/hydro/flood/qld/fld_reports/reports.shtml © Copyright Commonwealth of Australia 2013, Bureau of Meteorology (ABN 92 637 533 532)
Eskdale AL * 2 0 0 0 16 62 197 168 19 0 464 Rosentreters Bridge TM * 4 0 0 0 15 16 139 100 16 0 290 Rosentreters Bridge AL * 5 0 0 0 15 54 150 99 17 0 340 Toogoolawah 3 0 0 0 13 35 109 76 15 0 251 Toogoolawah AL * 2 0 0 0 15 41 120 87 17 0 282 Mt Byron TM * 3 1 0 0 14 11 106 97 3 0 235 Caboonbah AL * 2 1 0 0 13 70 107 65 6 0 264 Esk 4 1 1 1 14 0 186 102 15 0 329 Glen Esk AL * 3 1 0 0 13 66 76 44 9 0 212 Bryden AL * 2 2 0 0 11 37 51 37 5 0 145 Hays Landing AL * 0 1 0 1 14 44 60 67 3.6 0 191 Wivenhoe Dam Hw AL-B * 0 1 0 0 8 43 35 30 4 0 121 Wivenhoe Dam Tw AL-P * 0 1 0 0 9 47 48 52 4 0 161
Maximum 5 4 4 3 43 104 279 208 20 12 621
24 hour rainfall to 9am on
January Total
Station Name
21 22 23 24 25 26 27 28 29 30 (mm)
Lower Brisbane Toowoomba AL * 2 1 0 0 17 53 168 161 18 0 420 Spring Bluff AL * 2 0 0 0 15 41 127 135 10 0 330 Fifteen Mile AL * 2 1 0 0 11 42 107 101 13 0 277 Paradise Creek Road AL * 1 1 0 0 9 44 123 108 9 0 295 Upper Lockyer AL * 1 0 0 0 10 46 120 117 14 0 308 Withcott AL * 1 2 0 0 15 25 89 70 33 0 235 Helidon TM * 0 0 0 0 10 3 83 108 11 0 215 Helidon AL * 1 0 0 0 11 40 99 133 13 0 297 Gormans Gap AL * 1 2 0 0 14 33 90 122 30 0 292 Flagstone Ck Bore TM * 1 1 0 0 11 2 42 94 12 0 163 Flagstone Creek AL * 0 2 0 0 9 20 59 105 14 0 209 Upper Sandy Creek AL * 2 1 0 0 15 86 163 201 18 0 486 Sandy Creek Road AL * Tr 1 0 0 13 17 80 65 17 0 193 West Haldon AL * 0 1 0 0 9 9 72 130 22 0 243 West Woodbine AL * 0 0 0 0 8 5 97 136 21 0 267 Little Egypt AL * 0 1 0 0 10 11 65 122 25 0 234 Ma Ma Creek AL * 1 2 0 0 14 29 75 160 26 0 307 Goltz Road AL * 0 1 0 0 8 16 119 149 35 0 328 Upper Blackfellow AL * 1 0 0 5 8 51 164 296 33 0 558 Junction View AL * 0 0 0 0 9 12 113 157 27 0 318 Upper Tenthill AL * 1 2 0 0 16 93 173 408 57 0 750 Mt Sylvia AL * 0 1 0 0 14 13 79 172 20 0 299 Mt Petersen AL * 0 1 0 0 13 13 42 63 21 0 153 Tenthill TM * 0 0 0 0 1 0 0 0 0 0 1 Tenthill AL * 0 0 0 0 12 18 46 92 20 0 188 Tenthill Bore TM * 0 0 0 0 11 4 53 121 24 0 213 Gatton AL * 2 1 0 0 14 83 76 148 17 0 341 Gatton Uq AWS * 3 0 0 0 12 45 59 110 13 0 243 Mt Castle AL * 4 5 0 37 17 134 233 709 85 0 1224 Rockside Mt AL * 1 5 0 0 18 30 97 160 33 0 344 Moon Road AL * 0 2 0 0 18 28 74 128 23 0 273

TC Oswald Floods – January 2013
Bureau of Meteorology, Queensland Page 33 http://www.bom.gov.au/hydro/flood/qld/fld_reports/reports.shtml © Copyright Commonwealth of Australia 2013, Bureau of Meteorology (ABN 92 637 533 532)
Forest Hill AL * 2 1 0 0 12 24 58 117 15 0 229 Stony Ck Rd TM * 0 5 0 0 14 19 180 501 45 0 764 Thornton AL * 1 4 0 0 16 61 169 404 59 0 714 Mulgowie AL * 0 1 0 0 12 35 126 210 26 0 410 Schultz Lookout AL * 0 2 0 0 17 17 51 71 21 0 179 Showground Weir Hw TM * 4 1 0 0 15 40 61 105 15 0 241 Showground Weir AL * 4 1 0 0 15 40 62 106 14 0 242 Bill Gunn Dam AL * 7 2 0 0 16 36 62 119 15 0 257 Bill Gunn Dam TM * 7 2 0 0 15 37 62 119 15 0 257 Warrego Highway AL * 2 1 0 0 12 38 65 117 12 0 247 Lake Clarendon AL * 1 0 0 0 10 51 66 114 11 0 253 Lake Clarendon Hw TM * 1 0 0 0 10 50 66 114 11 0 252 Glenore Grove AL * 0 7 1 0 8 46 60 105 15 0 242 Batzloffs Rd TM * 0 1 0 0 10 13 58 79 7 1 169 Lyons Bridge AL-P * 0 1 0 0 9 38 44 45 8 0 145 Buaraba AL * 0 1 0 0 8 58 110 148 12 0 338 Atkinson Dam AL * 0 1 0 0 8 40 76 92 9 0 226 Atkinson Dam Hw TM * 0 1 0 0 8 40 76 92 9 0 226 O'Reilly's Weir AL * 0 1 1 0 8 41 43 40 4 0 138 Lowood Pump Station AL-B * 0 0 0 0 7 27 40 31 5 0 110 Lowood 0 0 0 0 10 44 58 53 7 0 172 Fernvale - Burns St 1 3 1 0 19 40 51 85 7 0 206 Savages Crossing AL * 0 2 0 0 14 41 51 99 6 0 213 Marburg AL * 0 1 1 0 10 26 77 78 6 0 199 Lake Manchester 0 5 0 0 14 0 0 0 259 0 278 Lake Manchester Hw TM * 0 5 0 0 13 29 33 47 4 0 131 Lake Manchester AL * 0 5 0 0 14 29 33 46 4 0 131 Mt Crosby TM * 0 4 0 0 20 39 74 223 3 0 363 Mt Crosby AL * 0 4 0 0 21 39 74 223 5 0 366 Colleges Crossing AL * 1 4 0 0 16 37 95 213 6 0 372 Karalee 4 4 0 0 14 35 79 214 12 0 362 Adams Bridge TM * 0 3 0 0 10 5 69 232 13 0 332 Adams Bridge AL * 0 3 0 0 9 36 66 210 11 0 335 Lower Mt Walker AL * 2 5 0 0 8 25 81 118 7 0 246 Spressers Bridge AL * 2 4 0 0 13 23 78 107 6 0 233 Grey's Plains Road AL * 0 2 0 0 12 35 105 215 28 0 397 Franklyn Vale AL * 3 4 0 0 11 32 102 165 24 0 340 Grandchester AL * 8 4 0 0 19 37 96 161 18 0 343 Kuss Road AL * 2 4 0 0 15 32 101 128 8 0 290 Kuss Road TM * 2 3 0 0 14 16 93 121 8 0 257 Tallegalla AL * 1 3 0 0 17 38 92 106 7 0 264 Rosewood Wwtp AL * 1 5 0 0 4 27 60 68 3 1 169 Rosewood Detention Basin AL * 1 1 0 0 13 25 81 111 7 0 239 Rosewood AL-B * 0 3 0 0 12 26 89 121 6 0 257 Rosewood AL * 0 3 0 0 11 24 78 113 6 0 235 Walloon AL-P * 1 1 0 0 10 23 68 102 4 0 209 Tarome 1 2 0 1 9 43 112 298 17 0 483 Tarome AL-P * 1 1 0 1 8 39 105 286 17 0 458 Moogerah Dam 0 1 0 2 5 23 84 293 33 0 441 Moogerah Dam Hw AL * 0 1 0 2 5 35 88 304 19 0 454 Toohills Crossing AL * 1 1 0 0 9 34 103 250 13 0 411

TC Oswald Floods – January 2013
Bureau of Meteorology, Queensland Page 34 http://www.bom.gov.au/hydro/flood/qld/fld_reports/reports.shtml © Copyright Commonwealth of Australia 2013, Bureau of Meteorology (ABN 92 637 533 532)
Toohills Crossing TM * 1 2 0 0 9 34 101 250 14 0 411 Kalbar TM * 0 1 0 0 6 27 66 170 14 0 285 Kalbar Weir AL * 0 2 0 0 6 25 80 189 8 0 310 Kalbar Weir Hw TM * 0 2 0 0 6 25 78 190 8 0 309 Harrisville AL * 0 2 0 0 8 20 51 113 3 0 197 Harrisville AL-B * 0 1 0 0 8 18 44 99 3 0 173 Amberley (Derm) TM * 1 2 0 0 9 10 74 150 5 0 251 Amberley AWS * 1 3 0 0 9 31 73 147 7.2 0 270 Washpool AL * 0 10 0 0 6 32 55 147 6 0 256 Peak Crossing AL * 4 8 0 0 7 30 53 146 8 0 256 Loamside AL * 1 1 0 0 9 28 55 170 6 0 270 Berrys Lagoon AL * 1 6 0 0 8 34 79 165 5 0 298 One Mile Bridge AL * 0 3 0 0 7 29 66 119 3 0 227 Brassall(Hancocks Br) AL * 0 3 0 0 11 28 72 156 3 0 273 Moggill AL-P * 1 2 1 0 14 43 71 145 6 0 283 Jindalee AL * 2 2 0 0 16 41 72 252 5 0 390
Brisbane City AL * 2 1 0 0 0 0 0 20 3 0 26
Maximum 8 10 1 37 21 134 233 709 259 1 1224
24 hour rainfall to 9am on
January Total
Station Name
21 22 23 24 25 26 27 28 29 30 (mm)
Ipswich/Brisbane Creeks Churchill AL * 0 4 0 0 7 39 81 164 5 0 300 Lyons AL * 4 3 0 0 6 41 65 237 13 0 370 Ripley AL * 2 3 0 0 8 43 47 218 11 0 332 Bundamba (Barclay St) AL * 0 8 1 0 8 33 52 161 8 0 271 Springfield Lakes AL * 2 8 1 0 8 49 49 190 5 0 312 Carole Park AL * 3 1 8 0 11 39 44 191 3 0 300 Wacol AL * 1 0 1 0 13 50 48 170 3 0 286 Greenbank(Thompson Rd) AL * 2 8 0 0 9 62 52 215 10 0 358 Greenbank 3 5 1 0 8 52 44 189 11 0 313 Forestdale(Johnson Rd) AL * 2 1 0 0 7 50 43 179 16 0 298 Calamvale AL * 2 2 3 0 12 50 46 165 12 0 292 Salisbury AL * 3 2 2 1 10 49 54 210 5 0 336 Archerfield AWS * 3 3 4 0 11 32 41 157 3.4 0 255 Inala AL * 2 3 5 0 11 35 42 176 4 0 278 Corinda High AL * 3 1 4 0 11 39 40 138 1 0 237 Holland Park West AL * 2 2 1 0 17 47 54 179 4 0 306 Greenslopes 2 21 in 4 80 in 2 152 in 3 268 East Brisbane AL * 1 2 2 0 18 48 56 181 3 0 311 Eight Mile Plains AL * 1 2 8 0 10 50 54 167 16 0 308 Wishart(Greenwood St) AL * 1 3 9 0 9 38 58 154 16 0 288 Mansfield AL * 1 3 1 1 12 54 52 159 12 0 295 Bulimba AL * 3 3 0 1 37 44 60 164 3 0 315 Carindale AL * 1 3 0 2 15 51 48 143 6 0 269 Camp Hill AL * 0 3 0 0 18 51 53 160 4 0 289 Lytton AL * 4 3 0 3 22 27 42 122 4 1 228 Hemmant AL * 1 1 0 1 16 43 39 120 2 0 223 Ransome AL * 2 2 0 1 16 50 55 142 16 2 286

TC Oswald Floods – January 2013
Bureau of Meteorology, Queensland Page 35 http://www.bom.gov.au/hydro/flood/qld/fld_reports/reports.shtml © Copyright Commonwealth of Australia 2013, Bureau of Meteorology (ABN 92 637 533 532)
Manly 8 in 4 days 0 16 34 33 115 12 0 219 Manly AL * 2 2 0 0 15 38 38 130 12 0 237 Wynnum Bowls Club AL * 2 1 0 0 14 31 55 116 8 7 234 Pullenvale AL * 1 2 0 0 24 44 84 277 4 0 436 Kenmore Hills AL * 0 3 0 0 33 50 86 299 8 0 479 Gold Ck Reservoir Hw TM * 0 4 1 0 42 66 87 329 15 0 544 Gold Ck Reservoir AL * 0 4 1 0 42 68 87 328 15 0 545 Green Hill Res AL * 1 5 0 0 36 49 73 280 5 0 449 Toowong AL * 2 5 0 0 43 40 93 224 5 0 412 Three Ways AL * 0 3 0 0 29 96 118 352 15 0 613 Enoggera Dam Hw TM * 0 4 0 0 48 57 69 312 8 1 499 Enoggera Dam AL * 0 4 0 0 48 58 70 312 8 1 501 Mt Coot-Tha AL * 1 5 0 0 43 66 92 319 8 0 534 Alderley AL * 2 6 0 1 42 42 66 202 1 0 362 Bowen Hills AL * 3 5 0 0 41 41 53 148 2 0 293 Brighton AL * 8 5 0 0 29 31 44 131 2 0 250 Upper Kedron AL * 1 5 0 2 42 72 67 277 7 0 473 Mitchelton(Osborne Rd) AL * 1 4 0 0 55 60 67 253 2 1 443 Alderley 3 5 0 0 50 120 in 2 221 2 0 409 Toombul(Nudgee Rd) AL * 3 5 0 4 37 41 53 139 2 0 284 Hendra AL * 3 6 0 3 36 37 51 153 2 0 291 Brisbane Ap AWS * 6 4 0 0 32 29 38 122 2.2 2 236 Luggage Point AL * 8 2 0 1 34 36 50 138 2 0 271 Frank Sleeman Park AL * 5 3 0 3 50 39 45 174 1 3 323 Geebung AL * 3 2 0 0 62 47 55 186 1 0 356 Boondall 9 2 0 2 46 32 46 157 2.6 4 301 Everton Hills AL * 2 4 0 1 44 49 63 246 3 0 412 Aspley Reservoir AL * 3 2 0 1 58 50 67 199 2 0 382
Deagon AL * 8 1 0 1 33 35 53 184 2 0 317
Maximum 9 8 9 4 62 96 118 352 16 7 613
24 hour rainfall to 9am on
January Total
Station Name
21 22 23 24 25 26 27 28 29 30 (mm)
Pine/Caboolture Mt Glorious AL-P * 4 3 1 6 31 167 182 406 22 0 822 Mt Nebo 4 3 0 1 38 128 112 406 12 0 705 Mt Nebo AL * 3 3 0 2 40 134 115 447 13 0 757 Highvale 2 3 1 1 26 88 88 317 12 0 536 Cedar Ck Rd AL * 2 4 1 3 30 101 84 291 17 0 533 Samford AL * 1 4 0 1 30 74 81 256 14 0 461 Samford Village AL * 2 4 0 0 21 50 65 152 13 0 307 Clear Mountain AL * 2 2 1 1 30 67 44 104 7 0 258 Drapers Crossing AL * 2 3 0 1 26 58 73 220 4 0 387 Cash's Crossing AL * 3 2 0 0 26 51 62 213 4 0 361 Albany Creek AL * 3 2 0 1 28 48 57 220 3 0 362 Normanby Way AL * 5 2 0 0 33 49 55 150 8 1 303 Kluvers Lookout AL * 5 2 2 0 20 100 96 138 5 1 369 Raynbird Creek AL * 9 1 1 2 29 118 168 311 10 0 649 Laceys Creek AL * 5 2 1 1 20 92 121 204 7 0 453

TC Oswald Floods – January 2013
Bureau of Meteorology, Queensland Page 36 http://www.bom.gov.au/hydro/flood/qld/fld_reports/reports.shtml © Copyright Commonwealth of Australia 2013, Bureau of Meteorology (ABN 92 637 533 532)
Baxters Creek AL * 5 1 3 0 22 88 203 264 5 0 591 Dayboro AL * 6 2 5 0 21 95 132 278 9 0 548 Dayboro Wwtp AL * 5 3 12 0 29 71 117 262 6 0 505 Mt Samson Rd AL * 3 3 5 1 36 74 114 268 5 0 509 North Pine Dam AL * 1 1 3 1 46 17 20 36 1 0 126 North Pine Dam AL-B * 1 1 3 1 46 17 20 39 1 0 129 Narangba 20 4 12 21 0 51 90 184 4 0 386 Browns Creek Road AL * 13 3 31 0 23 54 90 189 5 0 408 Lake Kurwongbah Hw TM * 3 2 6 2 54 42 51 165 2 0 327 Lake Kurwongbah AL * 3 3 5 0 0 42 53 164 2 0 272 Youngs Crossing AL * 3 1 6 1 70 49 96 165 2 0 393 Todds Road AL * 4 0 5 1 62 61 57 185 4 0 379 Lawnton AL * 4 1 0 1 59 45 45 142 4 1 302 John Bray Park AL * 6 4 0 1 5 44 56 165 6 2 289 Murrumba Downs AL * 6 2 0 0 36 48 57 160 3 0 312 Lipscombe Rd AL * 21 6 0 0 25 32 47 140 4 0 275 Woody Point AL * 10 3 0 0 42 39 42 109 2 0 247 Redcliffe AWS * 26 4 0 0 30 25 31 92 1 0 209 Mount Mee TM * 8 3 2 1 21 61 178 169 5 0 448 Mt Mee AL-P * 12 4 2 3 27 145 189 188 5 0 575 Mt Mee AL-B * 12 4 2 1 29 145 189 188 5 0 575 Moorina AL * 21 2 1 1 23 91 88 179 9 0 415 Oakey Flat Rd AL * 21 5 4 0 20 65 94 186 3 0 398 Burpengary(Rowley Rd) AL * 14 4 7 5 20 67 83 142 1 0 343 Burpengary (Dale St) AL * 15 2 2 0 17 53 76 144 2 0 311 Deception Bay AL * 18 4 0 0 18 32 49 145 2 0 268 Round Mt Reservoir AL * 3 2 1 1 20 54 85 134 5 0 305 Wamuran AL * 4 2 4 3 22 74 110 148 5 0 372 Upper Caboolture TM * 11 3 1 0 17 41 93 172 10 0 348 Upper Caboolture AL * 10 3 1 0 17 89 94 182 9 0 405 Caboolture Wtp AL * 10 1 1 0 18 72 112 148 3 0 365 Morayfield AL * 14 2 8 1 15 65 84 155 2 0 346 Sheepstation Creek AL * 11 2 6 0 15 55 88 174 2 0 353 Williams Rd AL * 3 3 1 1 4 71 102 162 10 0 357 Pumicestone Road AL * 5 4 5 0 12 62 88 168 3 0 347 Riversleigh Road AL * 16 2 4 0 15 44 83 163 2 0 329 Beachmere AL * 11 0 0 0 16 33 65 257 3 0 385 Bribie Island AL * 0 0 0 0 18 24 48 134 1 0 225 Godwin Beach 5 0 0 0 16 33 72 156 2 0 284 Bribie Island Quarry TM * 0 0 0 0 16 17 57 148 1 0 239 Westaways Creek TM * 0 5 0 2 28 29 80 143 3 0 290 Beerburrum AWS * 0 3 1 1 23 76 104 168 8 0 384
Rose Creek Road AL * 1 2 0 3 29 66 109 130 4 0 344
Maximum 26 6 31 21 70 167 203 447 22 2 822
24 hour rainfall to 9am on
January Total
Station Name 21 22 23 24 25 26 27 28 29 30 (mm)
Mooloolah Bald Knob AL * 0 1 2 2 43 57 179 118 6 0 408
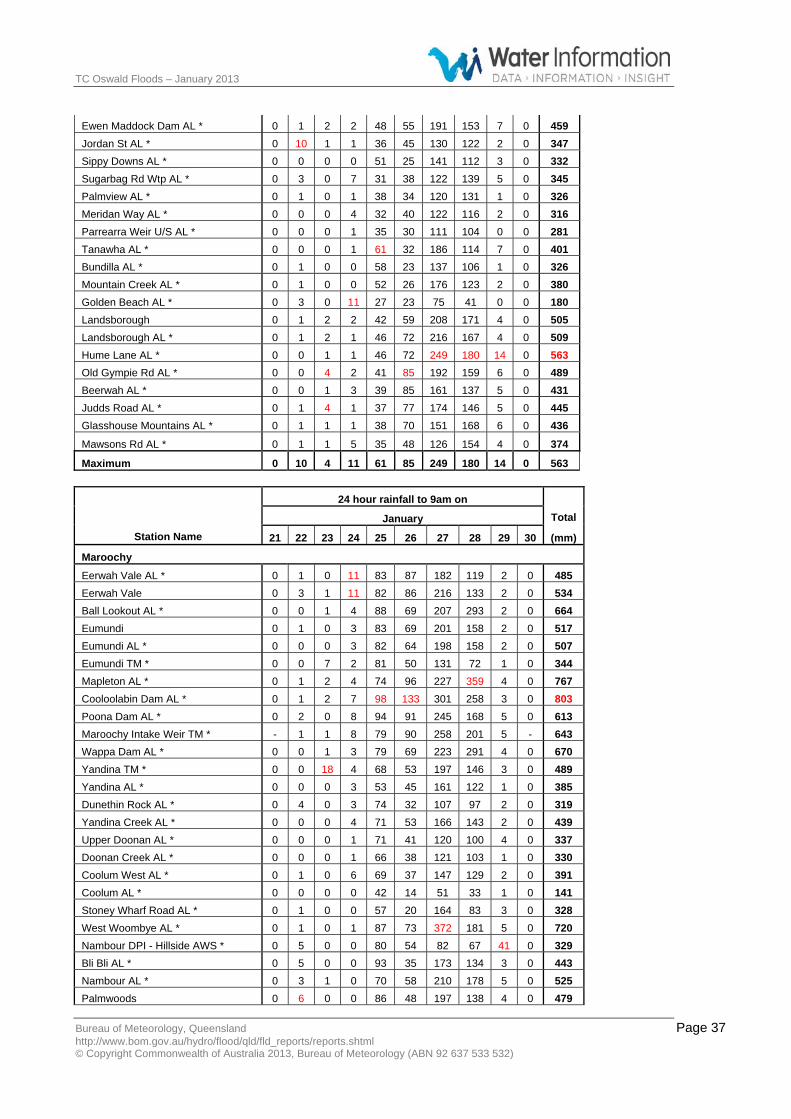
TC Oswald Floods – January 2013
Bureau of Meteorology, Queensland Page 37 http://www.bom.gov.au/hydro/flood/qld/fld_reports/reports.shtml © Copyright Commonwealth of Australia 2013, Bureau of Meteorology (ABN 92 637 533 532)
Ewen Maddock Dam AL * 0 1 2 2 48 55 191 153 7 0 459 Jordan St AL * 0 10 1 1 36 45 130 122 2 0 347 Sippy Downs AL * 0 0 0 0 51 25 141 112 3 0 332 Sugarbag Rd Wtp AL * 0 3 0 7 31 38 122 139 5 0 345 Palmview AL * 0 1 0 1 38 34 120 131 1 0 326 Meridan Way AL * 0 0 0 4 32 40 122 116 2 0 316 Parrearra Weir U/S AL * 0 0 0 1 35 30 111 104 0 0 281 Tanawha AL * 0 0 0 1 61 32 186 114 7 0 401 Bundilla AL * 0 1 0 0 58 23 137 106 1 0 326 Mountain Creek AL * 0 1 0 0 52 26 176 123 2 0 380 Golden Beach AL * 0 3 0 11 27 23 75 41 0 0 180 Landsborough 0 1 2 2 42 59 208 171 4 0 505 Landsborough AL * 0 1 2 1 46 72 216 167 4 0 509 Hume Lane AL * 0 0 1 1 46 72 249 180 14 0 563 Old Gympie Rd AL * 0 0 4 2 41 85 192 159 6 0 489 Beerwah AL * 0 0 1 3 39 85 161 137 5 0 431 Judds Road AL * 0 1 4 1 37 77 174 146 5 0 445 Glasshouse Mountains AL * 0 1 1 1 38 70 151 168 6 0 436
Mawsons Rd AL * 0 1 1 5 35 48 126 154 4 0 374
Maximum 0 10 4 11 61 85 249 180 14 0 563
24 hour rainfall to 9am on
January Total
Station Name 21 22 23 24 25 26 27 28 29 30 (mm)
Maroochy Eerwah Vale AL * 0 1 0 11 83 87 182 119 2 0 485 Eerwah Vale 0 3 1 11 82 86 216 133 2 0 534 Ball Lookout AL * 0 0 1 4 88 69 207 293 2 0 664 Eumundi 0 1 0 3 83 69 201 158 2 0 517 Eumundi AL * 0 0 0 3 82 64 198 158 2 0 507 Eumundi TM * 0 0 7 2 81 50 131 72 1 0 344 Mapleton AL * 0 1 2 4 74 96 227 359 4 0 767 Cooloolabin Dam AL * 0 1 2 7 98 133 301 258 3 0 803 Poona Dam AL * 0 2 0 8 94 91 245 168 5 0 613 Maroochy Intake Weir TM * - 1 1 8 79 90 258 201 5 - 643 Wappa Dam AL * 0 0 1 3 79 69 223 291 4 0 670 Yandina TM * 0 0 18 4 68 53 197 146 3 0 489 Yandina AL * 0 0 0 3 53 45 161 122 1 0 385 Dunethin Rock AL * 0 4 0 3 74 32 107 97 2 0 319 Yandina Creek AL * 0 0 0 4 71 53 166 143 2 0 439 Upper Doonan AL * 0 0 0 1 71 41 120 100 4 0 337 Doonan Creek AL * 0 0 0 1 66 38 121 103 1 0 330 Coolum West AL * 0 1 0 6 69 37 147 129 2 0 391 Coolum AL * 0 0 0 0 42 14 51 33 1 0 141 Stoney Wharf Road AL * 0 1 0 0 57 20 164 83 3 0 328 West Woombye AL * 0 1 0 1 87 73 372 181 5 0 720 Nambour DPI - Hillside AWS * 0 5 0 0 80 54 82 67 41 0 329 Bli Bli AL * 0 5 0 0 93 35 173 134 3 0 443 Nambour AL * 0 3 1 0 70 58 210 178 5 0 525 Palmwoods 0 6 0 0 86 48 197 138 4 0 479

TC Oswald Floods – January 2013
Bureau of Meteorology, Queensland Page 38 http://www.bom.gov.au/hydro/flood/qld/fld_reports/reports.shtml © Copyright Commonwealth of Australia 2013, Bureau of Meteorology (ABN 92 637 533 532)
Palmwoods AL * 0 5 0 0 85 45 190 141 6 0 472 Palmwoods Sportsground AL * 0 5 0 1 95 54 202 134 6 0 497 Diddillibah AL * 0 1 0 1 78 39 164 119 3 0 405 Eudlo AL * 0 0 0 1 61 49 189 120 5 0 425 Eudlo Flats Rd AL * 0 4 0 0 86 37 184 123 6 0 440 Maroochydore Depot AL * 0 5 0 1 62 23 106 0 0 0 197
Picnic Point AL * 0 2 0 0 72 21 249 110 0 0 454
Maximum 0 6 18 11 98 133 372 359 41 0 803
24 hour rainfall to 9am on
January Total
Station Name
21 22 23 24 25 26 27 28 29 30 (mm)
Noosa Rainbow Beach SYN 0 0 0 2 121 56 127 73 0 0 379 Coops Corner AL * 0 0 0 1 104 55 135 98 3 0 396 Coops Corner TM * 0 0 0 1 107 62 161 89 3 0 423 Mount Elliot AL * 0 0 2 8 136 63 215 65 1 0 490 Mount Wolvi AL * 0 0 0 6 94 59 176 100 5 0 440 Black Pinch Road AL * 0 1 0 3 120 71 189 117 3 0 504 Boreen Point AL * 0 0 0 3 75 53 139 161 1 0 432 Lake Cooroibah AL * 0 1 0 2 81 55 138 89 2 0 368 Mount Tinbeerwah AL * 0 1 0 12 98 81 193 136 5 0 526 Tewantin AWS * 0 1 0 4 74 43 122 88 2 0 334 Tewantin AL * 0 0 0 4 73 42 121 90 1 0 331
Noosa Heads AL * 0 0 0 4 79 40 160 80 2 0 365
Maximum 0 1 2 12 136 81 215 161 5 0 526
24 hour rainfall to 9am on
January Total
Station Name
21 22 23 24 25 26 27 28 29 30 (mm)
Mary Maleny AL * 1 0 0 2 59 108 312 287 8 0 777 Maleny 0 2 1 2 63 111 242 259 48 0 728 Baroon Boat Ramp AL * 0 3 2 1 85 94 275 257 4 0 721 Obi Lookout AL * 0 2 0 2 61 91 243 150 7 0 556 West Bellthorpe AL * 0 0 1 2 32 62 192 152 11 0 452 Bellthorpe (Gap Rd) AL * 0 1 1 2 43 77 216 113 6 0 459 Harper Creek AL * 0 1 2 1 43 53 173 121 9 0 403 Grigor Road AL * 0 0 2 3 41 41 169 114 4 0 374 Conondale AL * 0 0 1 1 54 60 198 122 3 0 439 Bellbird Creek AL * 0 2 2 1 51 59 186 122 5 0 428 Bellbird Creek TM * 0 2 2 1 53 62 173 119 6 0 418 Coolabine Creek AL * 0 1 0 2 53 60 189 231 5 0 541 Kenilworth H/S AL * 0 0 1 2 49 48 151 120 4 0 375 Moy Pocket AL * 0 0 1 3 62 67 305 126 6 0 570 Moy Pocket TM * 0 0 0 3 53 55 146 80 5 0 342 Jimna Forestry AWS * 0 0 0 0 27 42 207 - 11 0 287 Jimna AL * 0 0 0 0 25 36 176 105 10 0 352 Sunday Creek AL * 0 0 0 2 30 76 317 148 12 0 585 Borumba Dam Hw TM * 0 1 2 1 58 55 248 175 4 0 544

TC Oswald Floods – January 2013
Bureau of Meteorology, Queensland Page 39 http://www.bom.gov.au/hydro/flood/qld/fld_reports/reports.shtml © Copyright Commonwealth of Australia 2013, Bureau of Meteorology (ABN 92 637 533 532)
Borumba Dam Hw AL * 0 1 1 5 57 55 255 175 4 0 553 Borumba Dam 0 1 2 1 67 46 243 199 4 0 563 Imbil P.O 0 0 5 12 70 57 183 168 0 2 497 Mortimer TM * 0 0 1 2 49 87 197 103 9 0 448 Zachariah TM * 0 0 0 5 82 71 285 124 3 0 570 Dagun Pocket AL * 0 0 0 5 71 44 163 73 1 0 357 Cooroy AL * 0 0 0 25 91 86 224 261 2 0 689 Pomona AL * 0 0 0 10 99 60 239 148 0 0 556 Lake Macdonald Dam AL * 0 0 0 10 108 90 209 135 5 0 557 Cooran TM * 0 2 0 6 95 66 187 164 0 0 520 Cooran AL * 0 1 0 8 105 77 228 182 1 0 602 Cedar Pocket Dam AL * 0 0 1 5 75 56 234 91 1 0 463 Gympie AWS * 0 1 0 5 74 43 239 61 3 0 426 Gympie AL * 0 0 0 6 83 50 352 71 2 1 565 Fishermans Pocket TM * 0 0 0 5 98 53 281 74 3 0 514 Brooyar TM * 0 0 0 9 36 36 254 54 1 1 391 Brooweena TM * 0 0 0 17 97 60 247 3 2 0 426 Mt Joseph TM * 0 0 0 10 101 73 251 13 1 0 449 Marodian TM * 0 2 0 12 73 80 347 28 3 0 545 Home Park TM * 0 0 0 19 67 69 306 21 1 0 483 Tiaro Po 0 1 0 24 65 75 209 17 3 0 394 Goomboorian 0 0 2 2 98 55 188 93 2 0 440 Goomboorian TM * 0 0 1 5 100 59 220 51 1 0 437 Maryborough AWS * 0 0 0 8 97 88 259 12 0 0 464 Ghost Hill AL * 0 0 0 7 63 101 220 6 0 0 397 Booral Road AL * 0 0 0 8 73 94 257 8 0 0 440 Black Swamp AL * 0 0 0 8 69 104 296 11 1 0 489
Riverheads 0 0 0 6 59 56 152 13 0 0 286
Maximum 1 3 5 25 108 111 352 287 48 2 777
24 hour rainfall to 9am on
January Total
Station Name 21 22 23 24 25 26 27 28 29 30 (mm)
Burrum/Cherwell Fairlies Knob TM * 0 0 0 11 75 71 252 6 1 0 416 Musket Flat Mt AL * 0 0 0 12 84 56 288 2 0 0 442 Lenthalls Dam AL * 0 0 0 6 72 73 305 7 0 0 463 Howard AL * 0 0 0 10 63 73 312 10 1 0 469 Torbanlea AL * 0 0 0 9 70 85 376 15 0 0 555 Childers South 0 0 0 4 101 102 260 2 0 0 469 Upper Cherwell AL * 0 0 0 8 78 86 269 1 1 0 443 Railway Bridge AL * 0 0 0 6 76 88 288 4 0 0 462 Hervey Bay AWS * 0 0 0 16 59 71 174 10 0 0 331 Burrum Highway TM * 0 0 2 20 121 134 215 3 0 0 495 Leesons TM * 0 0 0 10 127 114 291 1 0 0 543 Woodgate Store 0 0 0 20 91 100 309 0 0 0 505
Takura Reservoir AL * 0 0 0 10 56 97 355 11 0 0 529
Maximum 0 0 2 20 127 134 376 15 1 0 555

TC Oswald Floods – January 2013
Bureau of Meteorology, Queensland Page 40 http://www.bom.gov.au/hydro/flood/qld/fld_reports/reports.shtml © Copyright Commonwealth of Australia 2013, Bureau of Meteorology (ABN 92 637 533 532)
24 hour rainfall to 9am on
January Total
Station Name
21 22 23 24 25 26 27 28 29 30 (mm)
Burnett Upper Monal TM * 0 0 0 18 163 201 219 2 0 0 603 Dakiel TM * 0 0 2 7 150 28 156 0 1 0 344 Monto Township SYN 0 0 0 19 139 96 185 0 1 0 440 Abercorn 0 0 0 10 77 71 175 2 1 0 336 Colodan 0 0 0 9 94 88 98 2 0 0 291 Wuruma Dam 0 0 0 7 68 66 150 7 0 0 298 Eidsvold Bridge 0 0 0 0 44 47 170 1 1 0 262 Glenwood - - - - 28 30 198 - - - 256 Dykehead TM * 0 0 0 1 25 34 218 11 0 - 289 Brovinia TM * 0 0 0 0 19 3 242 6 0 0 270 Durong South 0 0 0 0 14 4 172 41 0 0 231 Kingaroy AWS * 0 0 0 0 16 15 234 62 5 0 332 Proston 3 0 0 0 19 245 in 2 62 in 2 0 310 Proston TM * 0 0 0 0 19 14 285 77 1 0 396 Dunollie 0 0 0 0 25 21 230 17 0 0 293 Cooranga TM * 0 0 0 0 19 19 233 15 0 0 286 Mundubbera 0 0 0 0 38 27 315 6 0 0 386 Reid Creek TM * 0 0 0 12 75 69 269 2 0 0 427 Gayndah Ap AWS * 0 0 0 2 39 39 283 4 1 0 368 Dandabah TM * 0 0 0 0 13 17 193 175 13 0 411 Brooklands TM * 0 0 0 0 7 3 138 63 7 0 218 Embreys Bridge 0 0 0 0 16 0 202 66 17 0 301 Nanango 0 0 0 0 16 11 183 58 6 0 274 Glenmore TM * 0 0 0 0 19 11 205 24 3 0 262 West Barambah TM * 0 0 0 0 20 16 200 19 6 0 261 Ban Ban TM * 0 0 0 2 53 24 291 12 3 0 385 Brian Pastures 0 0 0 0 42 29 268 5 3 0 347 Mt Lawless TM * 0 0 0 0 0 0 0 0 0 0 0 Dingle Dell TM * 0 1 0 6 84 97 322 2 0 0 512 Mt Perry 0 0 0 11 89 112 345 3 0 0 561 Mt Yeatman TM * 0 0 0 2 46 54 294 2 0 0 398 Byrnestown TM * 0 0 0 1 41 25 252 3 1 0 323 Biggenden 0 0 0 9 56 47 296 2 0 0 410 Biggenden TM * 0 0 0 7 3 21 325 1 0 0 357 Coringa TM * 0 0 0 5 60 57 334 2 1 0 459 Paradise Dam Hw TM * 0 0 0 10 61 58 378 3 0 1 511 Fig Tree TM * 0 0 0 16 76 74 407 2 0 0 575 Walla TM * 0 0 0 6 76 86 480 1 0 0 649 Woongarra TM * 0 0 0 18 104 138 240 0 0 0 501
Bundaberg AWS * 0 0 0 12 102 118 252 0 0 0 484
Maximum 3 1 2 19 163 201 480 175 17 1 649
24 hour rainfall to 9am on
January Total
Station Name
21 22 23 24 25 26 27 28 29 30 (mm)

TC Oswald Floods – January 2013
Bureau of Meteorology, Queensland Page 41 http://www.bom.gov.au/hydro/flood/qld/fld_reports/reports.shtml © Copyright Commonwealth of Australia 2013, Bureau of Meteorology (ABN 92 637 533 532)
Kolan Mt Wallaby - - 8 26 177 182 356 - - - 749 Springfield TM * 0 0 9 20 182 215 314 0 0 0 740 Monduran - - 9 29 97 141 245 - - - 521 Gin Gin - - - 18 100 147 - - - - 265
Bucca Weir Hw TM * 0 0 0 21 102 137 349 1 0 0 610
Maximum 0 0 9 29 182 215 356 1 0 0 749
24 hour rainfall to 9am on
January Total
Station Name
21 22 23 24 25 26 27 28 29 30 (mm)
Baffle Miriam Vale TM * 1 2 5 66 175 250 237 0 0 0 736 Makowata 4 0 10 52 183 318 274 1 1 0 843 Mimdale TM * 1 2 4 53 168 265 276 0 0 0 769 Ampthill TM * - 2 7 26 136 200 147 0 0 0 518 Rosedale - 3 9 32 140 - - - - 0 184 Captain Creek TM * 1 4 6 97 225 399 275 0 0 0 1007 Rapleys TM * 3 4 8 76 189 297 223 0 - - 800
Town Of 1770 0 1 0 35 99 290 117 0 0 0 542
Maximum 4 4 10 97 225 399 276 1 1 0 1007
24 hour rainfall to 9am on
January Total
Station Name
21 22 23 24 25 26 27 28 29 30 (mm)
Boyne Builyan 0 3 3 33 144 218 249 1 0 0 651 Nagoorin TM * 0 1 1 38 176 257 215 0 0 0 688 Milton TM * 0 0 0 45 228 302 190 0 0 0 765 Gladstone Radar AWS * 0 0 0 162 254 228 176 - 0 0 821
Gladstone Airport AWS * 0 0 1 147 272 220 111 - 0 0 751
Maximum 0 3 3 162 272 302 249 1 0 0 821
24 hour rainfall to 9am on
January Total
Station Name
21 22 23 24 25 26 27 28 29 30 (mm)
Calliope Hazeldean 0 0 0 98 262 233 121 1 0 0 715 Castlehope TM * 1 0 0 104 306 273 152 0 0 0 836
Mt Larcom 0 0 0 134 270 422 in 2 0 0 0 826
Maximum 1 0 0 134 306 273 152 1 0 0 836
24 hour rainfall to 9am on
January Total
Station Name
21 22 23 24 25 26 27 28 29 30 (mm)
Dawson Westgrove TM * 0 0 0 2 0 22 3 0 0 0 27 Boxvale TM * 0 0 0 0 18 19 28 1 0 0 66 Waddy Brae TM * 0 0 0 0 12 9 40 3 0 0 64

TC Oswald Floods – January 2013
Bureau of Meteorology, Queensland Page 42 http://www.bom.gov.au/hydro/flood/qld/fld_reports/reports.shtml © Copyright Commonwealth of Australia 2013, Bureau of Meteorology (ABN 92 637 533 532)
Injune SYN 0 0 0 0 6 3 26 3 0 0 38 Injune TM * 0 0 0 0 5 3 23 5 0 0 36 Utopia Downs TM * 0 0 0 0 30 7 72 0 0 0 109 Pine Hills TM * 0 0 0 0 4 0 21 6 1 0 31 Peekadoo TM * 0 0 0 0 11 3 31 0 0 0 45 Eurombah Creek TM * 0 0 0 0 12 2 32 1 0 0 47 Tarana Crossing 0 0 0 0 19 8 44 0 0 0 71 Giligulgul TM * 0 0 0 0 10 1 90 7 0 0 109 Woleebee 0 0 0 0 13 0 52 5 0 0 70 Windamere TM * 0 0 0 0 15 6 64 1 0 0 86 Currajong 0 0 0 0 33 20 69 2 0 0 124 The Sandstone 0 0 0 0 41 36 108 4 0 0 189 Taroom SYN 0 0 0 0 20 16 57 3 1 0 96 Taroom TM * 21 0 0 0 10 1 1 0 0 0 33 Broadmere TM * 0 0 0 0 22 20 35 0 0 0 77 La Palma TM * 1 0 0 0 12 12 39 2 0 0 66 Cockatoo Ck TM * 0 0 0 0 8 9 50 4 1 0 72 Camboon 0 0 0 75 62 58 19 6 0 0 220 Theodore - - - 3 55 76 37 4 - - 175 Woodleigh TM * 0 0 0 1 73 128 72 9 0 0 283 Moura 0 0 0 15 93 101 77 4 0 0 290 Blackboy Creek TM * 0 0 0 18 97 113 20 0 0 0 248 Bauhinia Downs 4 - - 9 71 64 17 - - - 165 Redcliffe TM * 0 0 0 15 109 89 40 0 0 0 253 Roundstone Creek TM * 0 0 0 7 77 123 65 1 0 0 273 Bindaree TM * 0 0 0 11 105 78 68 2 0 0 264 Banana 0 0 0 0 113 107 in 4 days 0 220 Baralaba SYN - - - 33 151 147 84 2 - - 417 Beckers TM * 0 0 0 35 163 103 80 2 0 0 383 Blue Hills TM * 0 0 0 13 170 259 93 8 1 0 544
South Kariboe Creek TM * - - 0 3 99 59 82 2 0 0 245 Callide Dam Inflow TM * 0 0 0 22 117 141 38 3 0 0 321 Boolaroo Tops TM * 0 3 4 44 395 497 468 13 2 0 1426 Kroombit Tops TM * 0 1 2 41 281 373 199 6 3 0 906 Thangool Ap SYN 1 0 2 11 116 109 67 3 0 0 308 Biloela Townsite 2 - 2 17 129 - 47 - - - 197 Folding Hills TM * 40 0 0 - 98 138 71 4 0 0 351 Red Hill TM * 0 0 1 17 120 115 40 2 0 0 295 Besch's Hill TM * 18 0 1 77 451 302 88 3 0 0 940 Kingsborough TM * 0 0 0 35 199 122 14 1 0 0 371 Doreen TM * 0 0 0 33 189 140 17 0 0 0 379 Jambin 0 0 0 32 160 81 23 0 0 0 296 Craiglands TM * - - - 28 122 74 56 5 0 0 285 Goovigen TM * 0 0 0 22 178 117 17 0 0 0 334 Upper Dee TM * 0 0 2 157 587 315 41 0 0 0 1102 Mundic Gully TM * 0 0 0 104 284 - - 0 0 0 388 Number 7 Dam TM * 0 0 0 95 332 - - 0 0 0 427 Kenbula TM * 0 0 0 95 369 161 25 1 0 0 651 Wura TM * 0 0 0 69 233 130 14 0 0 0 446 Wowan 0 0 0 46 243 in 3 0 0 0 289 Wowan Cemetry Rd TM * 0 0 0 51 206 - - - - - 257

TC Oswald Floods – January 2013
Bureau of Meteorology, Queensland Page 43 http://www.bom.gov.au/hydro/flood/qld/fld_reports/reports.shtml © Copyright Commonwealth of Australia 2013, Bureau of Meteorology (ABN 92 637 533 532)
Alma Ck Bore TM * 0 0 0 40 209 149 36 1 0 0 435 Rannes TM * 0 0 0 23 142 111 50 1 0 0 327
Duaringa 0 0 48 163 257 62 0 0 0 0 530
Maximum 40 3 48 163 587 497 468 13 3 0 1426
24 hour rainfall to 9am on
January Total
Station Name
21 22 23 24 25 26 27 28 29 30 (mm)
Mackenzie Rewan 4 0 0 0 22 22 27 0 0 0 75 Rewan TM * 1 0 0 10 6 11 0 0 0 28 Wyseby 0 0 0 0 22 49 23 0 0 0 94 Lake Brown TM * 7 - 0 0 12 33 14 1 0 0 67 The Crescent AL * 0 0 0 2 35 34 66 0 0 0 137 Mt Panorama AL * 0 0 0 2 41 99 4 0 0 0 146 Rolleston AL * 0 0 0 1 30 44 56 0 0 0 131 Rolleston Airport AWS * 0 0 0 1 28 85 9 - - 0 123 Katrina Downs TM * 0 0 0 3 27 38 16 0 0 0 84 Somerby 0 0 0 0 34 36 18 0 0 0 88 Red Rock TM * 0 0 0 2 32 30 7 1 0 0 72 Humboldt AL * 0 0 0 2 42 29 4 1 0 0 77 Helen Downs TM * 0 0 0 0 19 36 24 0 0 0 79 Arcturus Downs AL * 0 0 0 0 22 34 4 0 0 0 60 Springsure SYN 0 0 0 0 24 77 10 0 0 0 112 Roddas Lookout AL * 1 0 0 0 30 61 5 1 0 0 98 Springsure TM * 0 0 0 0 21 75 11 0 0 0 107 Cowley TM * 0 0 0 0 15 26 8 1 0 0 50 Springsure Creek Junction TM * 0 0 0 0 26 46 15 0 0 0 87 Springsure Creek Junction AL * 0 0 0 1 40 43 14 0 0 0 98 Blackdown Tableland TM * 1 0 0 15 123 241 30 0 0 0 410 Glenora Road TM * 0 0 0 0 29 38 5 0 0 0 72 Blackdown Tableland AL * 2 0 0 23 168 195 23 1 0 0 412 Comet Weir TM * 0 0 0 0 41 52 5 0 0 0 98 Comet Weir AL * 0 0 0 2 44 27 5 0 0 0 78 Comet 0 0 0 2 43 55 5 0 0 0 105 Upper Claude River AL * 0 0 0 0 0 0 0 0 0 0 0 Mantuan Downs TM * 0 0 0 0 2 3 0 7 0 1 13 Wharton Creek 7 0 0 0 7 0 0 0 0 0 14 Glen Rock AL * 0 0 0 0 1 6 0 0 0 0 7 Echo Hills AL * 0 0 0 0 1 23 0 0 0 0 24 Raymond AL * 0 0 0 0 2 10 1 0 0 0 13 Upper Van Dyke AL * 1 0 0 0 2 2 1 0 0 0 6 Penjobe TM * 4 0 0 0 2 2 1 0 0 0 9 Heathwood AL * 1 0 0 0 18 20 5 0 0 0 44 Van Dyke Creek AL * 0 0 0 0 11 18 5 0 0 0 34 Bogantungan TM * 0 0 0 1 23 34 3 0 0 0 62 Green Valley AL * 0 0 0 0 18 24 0 0 0 0 42 Billaboo AL * 0 0 0 8 64 49 4 0 0 0 125 Mt Mayde AL * 0 0 0 0 15 16 0 0 0 0 31 Lochington AWS * 2 0 0 0 5 17 1 - - 0 25

TC Oswald Floods – January 2013
Bureau of Meteorology, Queensland Page 44 http://www.bom.gov.au/hydro/flood/qld/fld_reports/reports.shtml © Copyright Commonwealth of Australia 2013, Bureau of Meteorology (ABN 92 637 533 532)
Ducabrook AL * 1 0 0 0 7 20 0 0 0 0 29 Kulumur Range AL * 0 0 0 0 23 45 8 0 0 0 76 Craigmore TM * - - - 0 13 21 6 0 0 0 40 Craigmore AL * 1 0 0 0 17 20 3 0 0 0 41 Avocet AL * 0 0 0 1 28 36 6 0 0 0 71 Fairbairn Dam AL * 0 0 0 2 26 19 0 0 0 0 47
Emerald Ap AWS * 0 0 0 3 34 23 2 0 0 62 Emerald AL * 0 0 1 2 37 16 3 0 0 0 58 Emerald Radar AL * 0 0 0 3 43 21 2 0 0 0 69 Peakvale 0 0 25 0 43 30 0 0 0 0 98 Sunny Park AL * 0 0 2 9 67 10 22 0 0 0 110 Tieri AL * 0 0 0 1 11 0 2 0 0 0 14 West Wolfang Creek TM * 0 0 0 13 72 21 3 0 0 0 109 Clermont TM * 0 0 0 8 79 37 4 0 0 0 128 Clermont 0 0 0 6 90 47 0 0 0 0 143 Sandy Creek Bridge TM * 0 0 0 6 80 44 2 0 0 0 132 Florence Vale AL * 0 0 7 1 43 29 2 0 0 0 81 Valeria AL * 0 0 0 1 75 7 2 0 0 0 85 Valeria TM * 0 0 0 1 79 46 3 0 0 0 129 Capella (Rowe's Hill) AL * 0 0 0 2 118 21 3 0 0 0 145 Capella 0 0 0 4 105 39 8 0 0 0 156 Anakie 0 0 0 0 33 45 10 0 0 0 88 Keilambete AL * 0 0 0 1 34 44 3 0 0 0 81 Keilambete TM * 0 0 0 1 34 54 4 0 0 0 93 Sapphire AL * 0 0 0 0 27 20 0 0 0 0 47 Rubyvale AL * 0 0 0 1 47 29 2 0 0 0 79 Gregory Highway AL * 0 0 1 2 60 2 2 0 0 0 67 Duckponds TM * 0 0 0 2 64 56 6 0 0 0 128 Duckponds AL * 0 0 0 3 69 38 3 0 0 0 113 Riley's Crossing TM * 0 0 0 1 59 44 27 0 0 0 131 Rileys Crossing AL * 0 0 0 2 64 29 27 1 0 0 123 Bedford Weir Tw AL * 0 0 0 5 104 29 12 0 0 0 150 Middlemount AL * 0 0 1 21 296 13 12 1 0 0 344 Middlemount TM * 0 0 1 21 278 16 9 0 0 0 325 Bingegang Weir AL * 0 0 0 12 149 3 56 2 0 0 222 Mt Ewan TM * 0 0 0 73 106 6 10 0 0 0 195 Isaac River Bridge TM * 0 0 3 33 100 8 2 0 0 0 145 Mt Spencer TM * 0 3 8 131 208 5 0 0 0 0 355 Deverill TM * 0 0 0 54 112 12 4 0 0 0 182 Dysart AL * 0 0 0 18 136 0 - - 0 0 154 Carfax 0 0 14 45 202 12 8 0 0 0 281 Mt Bridget TM * 0 6 2 107 245 20 10 0 0 0 390 Cardowan 0 0 0 102 218 25 0 0 0 0 345 Doraville 0 12 7 141 204 1 4 0 0 0 368 Blue Mountain 1 10 18 149 145 5 in 2 0 0 0 328 Prospect Creek TM * 0 4 17 150 148 7 6 0 0 0 332 Funnel Creek TM * - - 1 77 170 24 8 - - - 280 Braeside TM * 0 - - 71 174 15 6 0 0 - 266 Nebo TM * 0 0 1 66 109 9 26 0 0 0 211 Cockenzie TM * 0 0 4 60 148 18 5 0 0 0 235 Bee Creek TM * 0 0 3 60 150 21 8 0 0 0 242

TC Oswald Floods – January 2013
Bureau of Meteorology, Queensland Page 45 http://www.bom.gov.au/hydro/flood/qld/fld_reports/reports.shtml © Copyright Commonwealth of Australia 2013, Bureau of Meteorology (ABN 92 637 533 532)
Upper Bee Ck TM * 0 0 12 219 232 0 7 0 0 0 470 Pink Lagoon TM * 0 0 0 0 0 0 0 0 0 0 0 St Lawrence SYN 0 4 1 107 224 21 in 4 days 0 357 St Lawrence [1] AWS * 0 6 0 119 209 20 1 - 0 0 355 Yatton TM * - 1 - 34 285 - 4 - - - 324
Coolmaringa TM * 0 0 0 11 162 104 30 0 0 0 307
Maximum 7 12 25 219 296 241 66 7 0 1 470
24 hour rainfall to 9am on
January Total
Station Name
21 22 23 24 25 26 27 28 29 30 (mm)
Fitzroy Riverslea TM * 0 0 0 42 221 168 26 0 0 0 457 Melrose 0 0 1 17 213 125 8 1 0 0 366
Westwood TM * 0 0 0 77 252 92 10 0 0 0 431 The Gap TM * 0 1 0 14 172 86 16 0 0 0 289 Yaamba 0 0 0 44 314 41 13 0 0 0 412 Hedlow Airfield TM * 0 0 0 108 205 - - - - - 314 Samuel Hill AWS * 0 1 4 103 370 - 76 - 0 1 556 The Glen TM * 0 0 4 51 190 33 4 0 0 0 283 South Yaamba TM * 0 0 0 48 330 42 23 0 0 0 443 Glenlands - - - 168 459 183 41 - - - 851 Rockhampton AWS * 0 0 0 118 349 49 29 Tr 0 0 545 Rockley Station 116 350 193 659 Raglan Ck TM * 0 0 1 93 237 165 51 0 0 0 547 Byfield 3 12 110 427 62 72 686 Pacific Heights 63 557 75 82 777
Yeppoon AWS * 0 1 0 94 0 0 95
Maximum 3 1 12 168 557 193 94 1 0 1 851
24 hour rainfall to 9am on
January Total
Station Name
21 22 23 24 25 26 27 28 29 30 (mm) Plane Carmila TM * 2 2 7 119 276 19 1 0 0 0 426 Mt Christian TM * 0 0 0 0 0 0 0 0 0 0 0 Koumala TM * 2 4 16 152 173 2 6 0 0 0 355 Sarina - - - - 112 3 3 - - - 118 Kinchant Dam TM * 0 8 5 122 134 0 0 0 7 0 276
Mt Vince West TM * 0 9 5 136 130 0 0 0 0 0 280
Maximum 2 9 16 152 276 19 6 0 7 0 426
24 hour rainfall to 9am on
January Total
Station Name
21 22 23 24 25 26 27 28 29 30 (mm) Pioneer
Greenmount AL * 0 10 6 112 94 0 0 0 0 0 222 Plevna AL * 1 13 10 141 125 23 11 0 0 1 325 Ridgelands AL * 0 14 10 150 120 12 12 0 0 0 318

TC Oswald Floods – January 2013
Bureau of Meteorology, Queensland Page 46 http://www.bom.gov.au/hydro/flood/qld/fld_reports/reports.shtml © Copyright Commonwealth of Australia 2013, Bureau of Meteorology (ABN 92 637 533 532)
Teemburra Ck TM * 0 17 6 160 97 0 1 0 0 1 282
Teemburra Dam AL * 0 9 5 - 76 0 1 0 0 4 95 Whiteford's TM * 0 7 1 112 132 2 2 0 0 2 258 Whiteford's AL * 0 7 1 111 122 1 1 0 0 2 245 Hannaville AL * 0 12 13 153 200 0 3 0 0 6 387 Sarich's AL * 0 7 3 130 107 1 1 0 0 0 249 Mt William TM * - 2 25 134 156 2 - - - - 319 Clarke Range AL * 0 17 29 112 90 21 6 0 0 0 275 Clarke Range2 AL * 1 18 31 113 94 20 6 0 0 0 283 Eungella AL * 0 40 10 153 131 22 21 0 0 0 377 Finch Hatton AL * 0 24 11 159 99 0 5 0 0 3 301 Gargett AL * 0 16 9 164 3 0 0 0 0 0 192 Septimus TM * 0 8 - 129 78 0 0 0 0 0 215 Dow's Creek AL * 0 18 8 159 82 0 2 0 0 5 274 Mirani Weir TM * 0 15 4 127 64 0 2 0 0 0 212 Mirani Weir AL * 0 17 5 143 69 1 1 0 0 0 236 Mirani 0 9.5 5 128 162 1 2 - - 0 308 Marian-Eton Rd TM * 0 13 - 147 141 0 0 0 0 0 301 Dumbleton Rocks AL * 0 8 6 141 70 0 1 0 0 0 226 Hospital Bridge AL * 1 4 4 208 82 0 2 0 0 0 301 Mackay AWS * 0 0 8 159 75 0 1 0 - 0 243 Mackay Ap AWS * 0 3 5 189 84 0 1 0 0 0 282 Mackay AL * 0 1 2 219 78 0 1 0 0 0 301 Rowallan Park AL * 0 2 3 163 82 0 1 0 0 0 251 Gooseponds AL * 0 3 2 224 84 0 2 0 0 0 315 Bakers Creek AL * 0 2 5 195 76 0 1 0 0 0 279 Brightley TM * 0 7 7 166 163 0 0 0 0 0 343 Homebush TM * 2 8 11 135 133 0 0 0 0 0 289 Munburra Rd TM * 0 12 7 187 103 1 2 0 0 0 312 Mt Roy TM * 0 5 7 109 78 1 3 0 0 0 203 Mt Jukes - 15 10 124 242 5 2 - - - 398 Mt Charlton - 9 10 162 82 - - - - - 263 Calen TM * 0 2 4 121 40 0 0 0 0 0 167 Forbes Road TM * 3 1 0 130 54 1 4 0 0 21 214
Jochheims TM * 3 2 2 222 84 0 2 0 0 0 315
Maximum 3 40 31 224 242 23 21 0 0 21 398
24 hour rainfall to 9am on
January Total
Station Name
21 22 23 24 25 26 27 28 29 30 (mm) Proserpine
Hecate 1 2 35 157 102 2 - - - 2 301 Hecate TM * - - 8 157 78 - 1 - - - 244 Crystal Brook - - 15 159 51 - - - - - 225 Proserpine Ap AWS * 0 2 14 178 45 0 17 0 0 3 259 Proserpine Fuller St - 2 14 151 29 1 - - - 6 203
Lower Gregory TM * 0 1 15 159 32 0 34 0 0 0 241
Maximum 1 2 35 178 102 2 34 0 0 6 301
Station Name 24 hour rainfall to 9am on Total

TC Oswald Floods – January 2013
Bureau of Meteorology, Queensland Page 47 http://www.bom.gov.au/hydro/flood/qld/fld_reports/reports.shtml © Copyright Commonwealth of Australia 2013, Bureau of Meteorology (ABN 92 637 533 532)
January 21 22 23 24 25 26 27 28 29 30 (mm)
Don
Upper Don AL * 0 1 4 123 78 2 4 0 0 0 212 Boundary Creek AL * 0 0 2 159 65 2 10 0 0 2 240 Pretty Bend TM * - - - 144 75 - 4 - - 25 248 Emu Creek AL * 0 0 7 141 101 1 19 0 0 1 270 Ida Creek TM * 0 2 5 153 68 1 16 0 0 3 248 Ida Creek AL * 0 2 5 163 79 1 17 0 0 3 270 Moss Vale AL * 0 1 4 137 59 0 13 0 0 10 224 Mt Dangar AL * 0 1 9 136 63 0 16 0 0 0 225
Warden Bend - - 10 177 78 0.6 20 - -
2.0 in 2 288
Roma Peak - 4 6 159 99 2 16 - 3 - 289 Roma Peak AL * 0 1 4 148 84 2 15 0 0 3 257 Reeves AL * 0 0 8 156 83 0 17 0 0 3 267 Bowen Pump Station AL * 0 0 22 124 48 0 12 0 0 0 206 Bowen SYN 0 0 24 131 34 1.2 11 0 0 0 201
Guthalungra TM * 0 0 25 164 38 1 16 1 1 0 246
Maximum 0 4 25 177 101 2 20 1 3 25 289
24 hour rainfall to 9am on
January Total
Station Name
21 22 23 24 25 26 27 28 29 30 (mm) Burdekin
Glen Harding 2 30 48 109 7 8 - - - - 204 Lake Lucy TM * 1 4 16 79 32 0 0 0 0 0 132 Lucky Springs - - 3 37 9 4 - - - - 53 Greenvale Town - - 6 45 12 2 - - - - 65 Blue Range TM * 0 0 5 66 10 0 0 0 0 0 81 Mt Fullstop TM * 0 0 3 95 21 0 0 0 0 0 119 Mt Bradley TM * 0 0 15 147 11 0 0 0 0 0 173 Laroona TM * 0 0 8 186 18 0 0 0 0 0 212 Paluma AL * 17 15 129 347 27 0 0 0 0 0 535 Paluma 185 in 3 405 32 - 1 - - - 623 Paluma Dam AL * 14 35 203 328 23 0 1 0 0 0 604 Bluff Downs TM * 0 0 1 73 8 0 0 0 0 0 82 Gainsford TM * 0 0 0 103 14 0 0 0 0 0 117 Keelbottom TM * - - 17 168 52 - - - - - 237 Charters Towers SYN 0 0 2 138 7 0 0 0 0 0 148 Sellheim AL * 0 0 1 127 10 1 3 0 0 0 142 Ravenswood AL * 0 0 1 147 24 2 1 0 0 0 175 Ravenswood - - 2 133 27 2 3 - - - 167 Violet Grove TM * 0 0 0 0 0 3 0 0 0 0 3 Ulcanbah - - - - 14 7 0 - - - 21 Winvic - - - 6 48 20 - - - - 74 Twin Hills TM * - - - - - 9 3 - 0 0 12 Belyando Crossing TM * 0 0 0 20 45 11 3 0 0 0 79 Eaglefield TM * 0 0 0 42 114 8 7 0 0 0 171 Dooruna Downs - - - - 88 14 - - - - 102

TC Oswald Floods – January 2013
Bureau of Meteorology, Queensland Page 48 http://www.bom.gov.au/hydro/flood/qld/fld_reports/reports.shtml © Copyright Commonwealth of Australia 2013, Bureau of Meteorology (ABN 92 637 533 532)
Bowen Development Rd TM * 0 0 0 19 64 11 4 0 0 0 98
St Anns TM * 0 0 0 53 62 4 0 0 0 0 119 St Anns AL * 0 0 0 62 68 4 0 0 0 0 134 Scartwater AL * 0 0 0 69 58 11 1 0 0 0 139 Mt Mcconnel - - - 82 82 7 - - - - 171 Pentland TM * 0 0 0 13 11 1 0 0 0 0 25 Betts Creek TM * 0 0 0 12 5 0 0 0 0 0 17 Broadleigh Downs - - - 69 41 - - - - - 110 Balfes Creek - - - 72 35 - - - - - 107 Taemas AL * 0 0 0 52 32 4 0 0 0 0 88 Taemas - - - 45 - - - - - - 45 Taemas TM * 0 0 0 2 41 4 0 0 0 0 47 Burdekin Dam - - - 72 32 6 1 - - - 111 Burdekin Dam AL * 0 0 0 55 25 5 1 0 0 0 86 Turrawalla Station - 1 - 89 101 3 4 - - - 199 Blenheim AL * 0 1 0 81 97 9 5 0 0 0 193 Old Racecourse TM * - 4 - 70 63 5 17 - - - 159 Eungella Dam AL * 0 5 5 104 114 24 14 0 0 0 266 Ernest Creek TM * - - - 114 71 3 - - - - 188 Urannah TM * - - - 105 106 2 - - - - 213 Sutherland AL * 0 0 1 122 108 7 5 0 0 2 245 The Stonewall AL * 0 0 0 101 85 8 4 0 0 0 198 Jacks Creek AL * 0 0 0 108 101 2 5 0 0 0 216 Weetalaba AL * 0 0 0 96 148 4 0 0 0 0 248 Collinsville SYN 0 0 0 109 122 7 13 0 0 0 251 Myuna AL * 0 0 0 118 122 2 1 0 0 0 243 Dalbeg AL * 0 0 1 134 61 1 0 0 0 0 197 Expedition Pass AL * 0 0 3 213 84 0 4 0 0 21 325 Upper Bogie AL * 0 0 2 144 105 6 10 0 0 0 267 Mt Pleasant AL * 0 1 4 178 95 0 6 0 0 0 284 Eton Vale AL * 0 0 3 138 96 4 2 0 0 0 243 Strathbogie AL * 0 0 6 108 - - - - - - 114 Millaroo AL * 0 0 2 174 30 0 7 0 0 0 213 Landers Creek AL * 0 0 3 209 49 0 5 0 0 0 266 Clare AL * 0 0 14 197 30 0 28 0 0 0 269 Mt Kelly AL * 0 2 19 146 10 3 0 0 0 0 180 Ayr AL * 0 3 27 203 8 2 0 1 0 0 244 Inkerman Bridge AL * 0 2 18 147 6 1 2 0 5 0 181 Brandon AL * 4 0 22 175 6 5 4 0 0 0 216 Yellow Gin Creek AL * 0 0 17 140 23 2 17 0 15 0 214 Rita Island AL * 0 1 25 164 23 1 5 0 21 0 240 Groper Creek AL * 0 4 17 126 18 1 6 0 3 0 175
Home Hill
2 in 3 6 21 158 11 20 in 4 - 218
Ayr DPI AWS * 0 2 20 179 7 5 1 0 0 0 216
Alva Beach AWS * 2 4 36 156 11 1 6 0 1 0 217
Maximum 17 35 203 405 148 24 28 1 21 21 623
24 hour rainfall to 9am on Station Name
January Total

TC Oswald Floods – January 2013
Bureau of Meteorology, Queensland Page 49 http://www.bom.gov.au/hydro/flood/qld/fld_reports/reports.shtml © Copyright Commonwealth of Australia 2013, Bureau of Meteorology (ABN 92 637 533 532)
21 22 23 24 25 26 27 28 29 30 (mm) Haughton
Mingela AL * 0 0 3 165 27 0 18 0 0 0 213 Upper Reid AL * 0 0 8 161 31 0 0 0 0 0 200 Cameron Hill AL * 0 0 7 194 21 0 14 0 0 0 236 Four Mile AL * 0 0 3 237 56 0 14 0 0 0 310 Mt Piccaninny TM * 0 0 8 197 19 0 10 0 0 11 245 Mt Piccaninny AL * 0 0 8 197 18 0 10 0 0 13 246 Donnington Airpark AL * 0 1 13 161 27 0 0 0 0 0 202 Upper Major Creek AL * 0 6 40 302 42 2 0 0 0 0 392 Major Creek AL * 0 1 13 249 37 1 22 0 0 0 323 Major Creek TM * 0 0 12 226 34 1 18 0 0 0 291 Powerline TM * 0 2 16 184 20 1 12 0 0 0 235 Powerline AL * 0 2 15 172 17 1 12 0 0 0 219 Giru North - - 26 246 15 - - - - - 287 Giru AL * 0 2 28 220 14 0 0 0 2 0 266
Upper Barrattas AL * 0 0 4 202 29 0 3 0 6 1 245
Maximum 0 6 40 302 56 2 22 0 6 13 392
24 hour rainfall to 9am on
January Total
Station Name
21 22 23 24 25 26 27 28 29 30 (mm) Ross/Bohle
Cungulla AL * 3 3 39 142 8 0 0 0 3 0 198 Whites Creek AL * 0 2 37 182 16 1 0 0 0 0 238 Alligator Creek AL * 0 1 31 141 20 0 1 0 0 0 194 Stuart AL * 0 0 40 234 9 0 0 0 0 0 283 Stuart Creek AL * 0 1 34 203 14 0 0 0 0 0 252 Calcium AL * 0 0 15 191 19 0 4 0 0 0 229 Nettlefield AL * 0 0 15 166 21 0 0 0 0 0 202 Woodlands AL * 0 0 32 178 23 1 0 0 0 0 234 Brabons AL * 1 0 20 293 23 0 1 0 0 0 338 Mcdonalds AL * 0 0 11 129 20 1 0 0 0 0 161 Cormacks AL * 1 0 23 150 16 0 0 0 0 0 190 Gleesons Mill AL * 2 1 24 257 18 0 0 0 0 0 302 Ross River Dam AL * 0 0 16 223 20 0 0 0 0 0 259 The Pinnacles AL * 0 0 30 272 14 0 4 0 9 0 329 Black Weir (Riverway) AL * 1 1 39 184 13 0 2 0 0 0 240 Kirwan AL * 2 0 44 179 11 0 1 0 0 0 237 Aplin Weir AL * 1 0 40 200 13 0 3 0 0 0 257 Rooney's Bridge AL * 0 4 58 226 11 0 2 0 0 0 301 Mysterton AL * 0 2 58 205 10 0 2 0 0 0 277 Castle Hill AL * 4 2 73 178 10 0 0 0 0 0 267 Louisa Creek AL * 0 3 63 167 6 0 0 0 0 0 239 Cluden AL * 2 1 45 218 9 0 1 0 0 0 276 North Ward AL * 5 1 80 185 9 0 0 0 0 0 280 Pallarenda AL * 12 3 90 181 11 0 0 0 0 0 297 South Townsville AL * 4 4 67 211 9 0 1 0 0 0 296 Mt Margaret AL * 2 0 34 237 36 0 2 0 0 0 311 Deeragun AL * 2 1 59 221 16 0 0 0 0 0 299
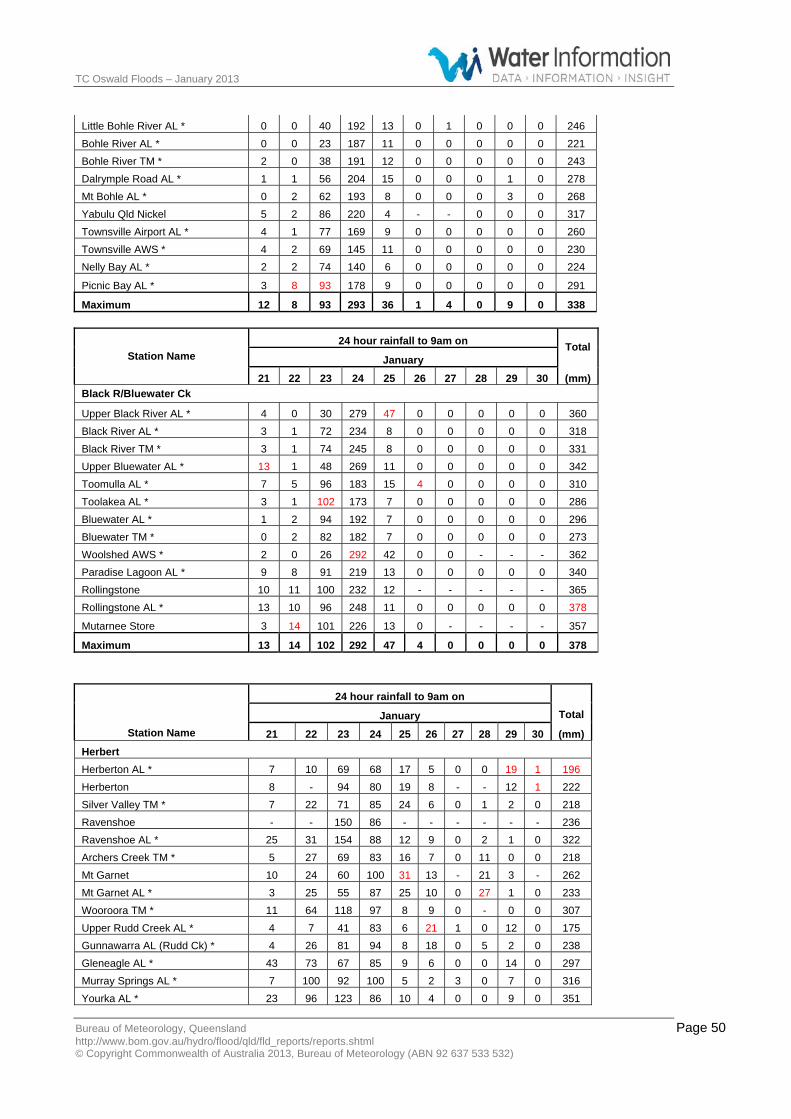
TC Oswald Floods – January 2013
Bureau of Meteorology, Queensland Page 50 http://www.bom.gov.au/hydro/flood/qld/fld_reports/reports.shtml © Copyright Commonwealth of Australia 2013, Bureau of Meteorology (ABN 92 637 533 532)
Little Bohle River AL * 0 0 40 192 13 0 1 0 0 0 246
Bohle River AL * 0 0 23 187 11 0 0 0 0 0 221 Bohle River TM * 2 0 38 191 12 0 0 0 0 0 243 Dalrymple Road AL * 1 1 56 204 15 0 0 0 1 0 278 Mt Bohle AL * 0 2 62 193 8 0 0 0 3 0 268 Yabulu Qld Nickel 5 2 86 220 4 - - 0 0 0 317 Townsville Airport AL * 4 1 77 169 9 0 0 0 0 0 260 Townsville AWS * 4 2 69 145 11 0 0 0 0 0 230 Nelly Bay AL * 2 2 74 140 6 0 0 0 0 0 224
Picnic Bay AL * 3 8 93 178 9 0 0 0 0 0 291
Maximum 12 8 93 293 36 1 4 0 9 0 338
24 hour rainfall to 9am on
January Total
Station Name
21 22 23 24 25 26 27 28 29 30 (mm) Black R/Bluewater Ck
Upper Black River AL * 4 0 30 279 47 0 0 0 0 0 360 Black River AL * 3 1 72 234 8 0 0 0 0 0 318 Black River TM * 3 1 74 245 8 0 0 0 0 0 331 Upper Bluewater AL * 13 1 48 269 11 0 0 0 0 0 342 Toomulla AL * 7 5 96 183 15 4 0 0 0 0 310 Toolakea AL * 3 1 102 173 7 0 0 0 0 0 286 Bluewater AL * 1 2 94 192 7 0 0 0 0 0 296 Bluewater TM * 0 2 82 182 7 0 0 0 0 0 273 Woolshed AWS * 2 0 26 292 42 0 0 - - - 362 Paradise Lagoon AL * 9 8 91 219 13 0 0 0 0 0 340 Rollingstone 10 11 100 232 12 - - - - - 365 Rollingstone AL * 13 10 96 248 11 0 0 0 0 0 378
Mutarnee Store 3 14 101 226 13 0 - - - - 357
Maximum 13 14 102 292 47 4 0 0 0 0 378
24 hour rainfall to 9am on
January Total Station Name 21 22 23 24 25 26 27 28 29 30 (mm)
Herbert Herberton AL * 7 10 69 68 17 5 0 0 19 1 196 Herberton 8 - 94 80 19 8 - - 12 1 222 Silver Valley TM * 7 22 71 85 24 6 0 1 2 0 218 Ravenshoe - - 150 86 - - - - - - 236 Ravenshoe AL * 25 31 154 88 12 9 0 2 1 0 322 Archers Creek TM * 5 27 69 83 16 7 0 11 0 0 218 Mt Garnet 10 24 60 100 31 13 - 21 3 - 262 Mt Garnet AL * 3 25 55 87 25 10 0 27 1 0 233 Wooroora TM * 11 64 118 97 8 9 0 - 0 0 307 Upper Rudd Creek AL * 4 7 41 83 6 21 1 0 12 0 175 Gunnawarra AL (Rudd Ck) * 4 26 81 94 8 18 0 5 2 0 238 Gleneagle AL * 43 73 67 85 9 6 0 0 14 0 297 Murray Springs AL * 7 100 92 100 5 2 3 0 7 0 316 Yourka AL * 23 96 123 86 10 4 0 0 9 0 351
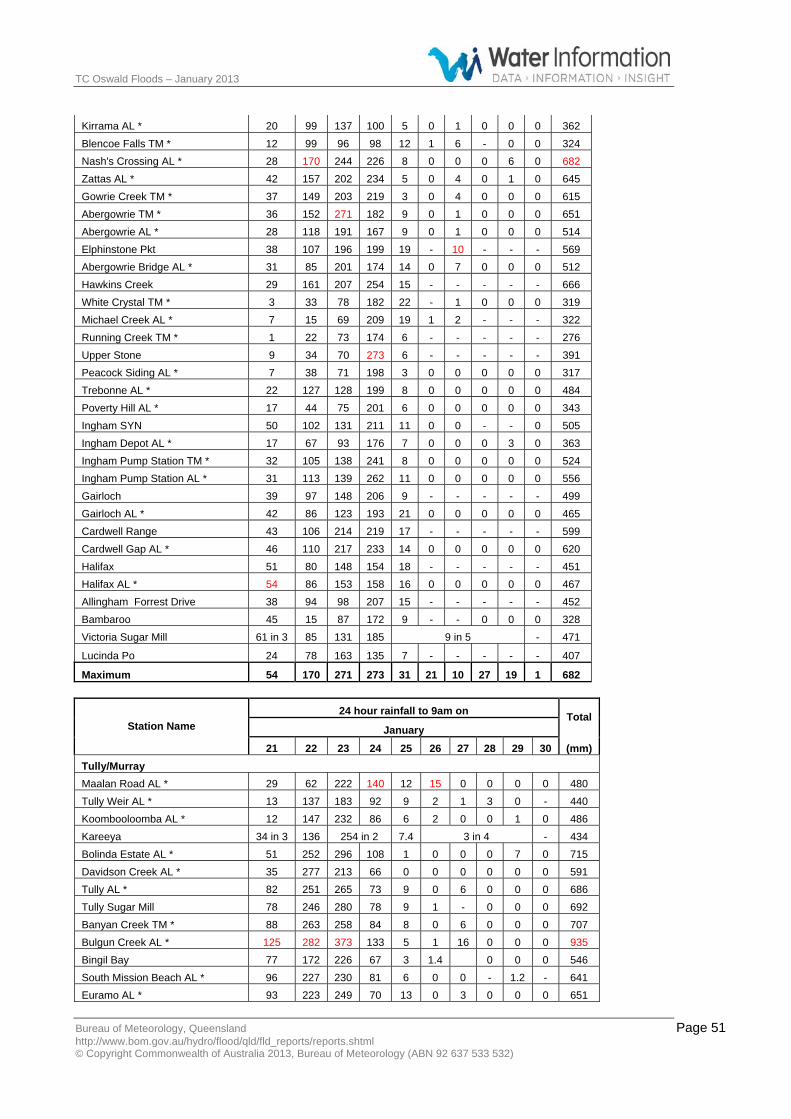
TC Oswald Floods – January 2013
Bureau of Meteorology, Queensland Page 51 http://www.bom.gov.au/hydro/flood/qld/fld_reports/reports.shtml © Copyright Commonwealth of Australia 2013, Bureau of Meteorology (ABN 92 637 533 532)
Kirrama AL * 20 99 137 100 5 0 1 0 0 0 362
Blencoe Falls TM * 12 99 96 98 12 1 6 - 0 0 324 Nash's Crossing AL * 28 170 244 226 8 0 0 0 6 0 682 Zattas AL * 42 157 202 234 5 0 4 0 1 0 645 Gowrie Creek TM * 37 149 203 219 3 0 4 0 0 0 615 Abergowrie TM * 36 152 271 182 9 0 1 0 0 0 651 Abergowrie AL * 28 118 191 167 9 0 1 0 0 0 514 Elphinstone Pkt 38 107 196 199 19 - 10 - - - 569 Abergowrie Bridge AL * 31 85 201 174 14 0 7 0 0 0 512 Hawkins Creek 29 161 207 254 15 - - - - - 666 White Crystal TM * 3 33 78 182 22 - 1 0 0 0 319 Michael Creek AL * 7 15 69 209 19 1 2 - - - 322 Running Creek TM * 1 22 73 174 6 - - - - - 276 Upper Stone 9 34 70 273 6 - - - - - 391 Peacock Siding AL * 7 38 71 198 3 0 0 0 0 0 317 Trebonne AL * 22 127 128 199 8 0 0 0 0 0 484 Poverty Hill AL * 17 44 75 201 6 0 0 0 0 0 343 Ingham SYN 50 102 131 211 11 0 0 - - 0 505 Ingham Depot AL * 17 67 93 176 7 0 0 0 3 0 363 Ingham Pump Station TM * 32 105 138 241 8 0 0 0 0 0 524 Ingham Pump Station AL * 31 113 139 262 11 0 0 0 0 0 556 Gairloch 39 97 148 206 9 - - - - - 499 Gairloch AL * 42 86 123 193 21 0 0 0 0 0 465 Cardwell Range 43 106 214 219 17 - - - - - 599 Cardwell Gap AL * 46 110 217 233 14 0 0 0 0 0 620 Halifax 51 80 148 154 18 - - - - - 451 Halifax AL * 54 86 153 158 16 0 0 0 0 0 467 Allingham Forrest Drive 38 94 98 207 15 - - - - - 452 Bambaroo 45 15 87 172 9 - - 0 0 0 328 Victoria Sugar Mill 61 in 3 85 131 185 9 in 5 - 471
Lucinda Po 24 78 163 135 7 - - - - - 407
Maximum 54 170 271 273 31 21 10 27 19 1 682
24 hour rainfall to 9am on
January Total
Station Name
21 22 23 24 25 26 27 28 29 30 (mm) Tully/Murray Maalan Road AL * 29 62 222 140 12 15 0 0 0 0 480 Tully Weir AL * 13 137 183 92 9 2 1 3 0 - 440 Koombooloomba AL * 12 147 232 86 6 2 0 0 1 0 486 Kareeya 34 in 3 136 254 in 2 7.4 3 in 4 - 434 Bolinda Estate AL * 51 252 296 108 1 0 0 0 7 0 715 Davidson Creek AL * 35 277 213 66 0 0 0 0 0 0 591 Tully AL * 82 251 265 73 9 0 6 0 0 0 686 Tully Sugar Mill 78 246 280 78 9 1 - 0 0 0 692 Banyan Creek TM * 88 263 258 84 8 0 6 0 0 0 707 Bulgun Creek AL * 125 282 373 133 5 1 16 0 0 0 935 Bingil Bay 77 172 226 67 3 1.4 0 0 0 546 South Mission Beach AL * 96 227 230 81 6 0 0 - 1.2 - 641 Euramo AL * 93 223 249 70 13 0 3 0 0 0 651

TC Oswald Floods – January 2013
Bureau of Meteorology, Queensland Page 52 http://www.bom.gov.au/hydro/flood/qld/fld_reports/reports.shtml © Copyright Commonwealth of Australia 2013, Bureau of Meteorology (ABN 92 637 533 532)
Euramo TM * 87 213 235 67 12 0 1 2 1 0 618
Upper Murray AL * 32 155 165 81 1 0 0 - 0 0 434 Upper Murray TM * 30 145 145 71 1 0 0 0 0 0 392 Russell-Henry Rd TM * 68 156 200 76 11 1 0 0 0 0 512 Murray Flats AL * 108 173 216 74 18 0 2 4 0 0 595 Kennedy Valley TM * 26 212 7 132 2 0 0 0 8 0 387 Bilyana AL * 54 218 233 92 2 1 0 0 8 0 608
Cardwell SYN 22 197 144 139 2.6 0 33 0 0 0 538
Maximum 125 282 373 140 18 15 33 4 8 0 935
24 hour rainfall to 9am on
January Total
Station Name
21 22 23 24 25 26 27 28 29 30 (mm) Johnstone Malanda AL * 23 26 108 67 2 5 0 0 11 0 242 Glen ALlyn TM * 32 30 191 65 4 4 0 0 11 0 337 Mckell Road AL * 17 31 143 89 8 8 0 1 3 0 300 Topaz AL * 45 35 223 52 3 1 0 0 0 0 359 Bartle View AL * 22 49 250 75 1 3 0 0 0 0 400 Greenhaven 28 52 236 125 10 12 - 1 0.6 - 465 Greenhaven AL * 27 48 220 116 9 11 0 1 0 0 432 Millaa Millaa AL * 30 52 192 61 3 2 0 0 0 0 340 Crawfords Lookout AL * 65 121 172 87 1 1 0 0 2 0 449 Fisher Ck TM * 128 162 128 45 0 2 0 - 15 0 480 Rankin Creek TM * 79 100 180 65 1 3 0 0 1 0 429 Nerada AL * 66 75 204 82 0 2 0 0 1 0 430 Tung Oil TM * 138 181 161 73 0 2 0 - 1 0 556 Tung Oil AL * 136 178 168 71 0 2 0 0 1 0 556 Mcavoy Bridge AL * 85 140 160 56 2 2 0 0 0 0 445 Daradgee 67 143 175 25 2.2 4 0 0 0 - 416 Saltwater Creek AL * 69 145 143 49 2 1 0 0 0 0 409 Sutties Creek AL * 26 110 203 82 5 3 0 0 0 0 429 Menavale AL * 31 292 178 85 1 0 0 0 1 0 588 Corsis AL * 101 189 210 67 1 1 0 0 5 0 574 Central Mill TM * 109 275 152 64 1 0 0 0 0 0 601 Central Mill AL * 113 287 172 64 0 0 0 0 0 0 636 Mourilyan Mill AL * 86 239 197 45 1 0 0 0 0 0 568 Mourilyan Bore TM * 82 213 185 42 1 0 0 0 0 0 523 South Johnstone AWS * 99 288 173 58 1 0.4 0 0 0.2 0 620 Sweeney Creek U/S AL * 67 153 140 52 1 1 0 0 0 0 414 Marco Street AL * 118 204 152 64 1 1 0 0 0 0 540 Innisfail SYN 58 148 135 51 1.8 2 0 0 0 0 396 Innisfail Wharf AL * 62 153 127 40 0 2 0 0 0 0 384 Japoonvale TM * 50 297 230 91 2 0 0 - - 0 670
Lower Liverpool TM * 60 332 166 65 4 0 0 0 0 0 627
Maximum 138 332 250 125 10 12 0 1 15 0 670
24 hour rainfall to 9am on
January Total
Station Name
21 22 23 24 25 26 27 28 29 30 (mm)

TC Oswald Floods – January 2013
Bureau of Meteorology, Queensland Page 53 http://www.bom.gov.au/hydro/flood/qld/fld_reports/reports.shtml © Copyright Commonwealth of Australia 2013, Bureau of Meteorology (ABN 92 637 533 532)
Mulgrave/Russell Goldsborough Valley AL * 37 30 186 103 4 10 0 2 5 0 377 The Fisheries TM * 42 19 137 84 4 2 1 - 9 0 298 The Fisheries AL * 43 20 156 85 4 3 2 0 10 0 323 Gillies Lookout AL * 34 19 181 86 8 9 3 3 19 0 362 Peets Bridge TM * 34 15 149 85 4 1 2 - 23 0 313 Peets Bridge AL * 35 15 175 86 4 5 2 11 25 0 358 Gordonvale AL * 30 8 150 44 4 8 1 4 20 0 269 Simmonds Creek TM * 16 5 139 28 4 1 0 - 26 0 219 Hills Creek TM * 13 6 162 27 17 - - - - - 225 Mt Sophia 13 18 181 85 5 5 - - 64 - 371 Bucklands TM * 46 45 116 34 3 6 0 - - 0 250
Babinda 183 in
3 26 146 73 - - - - - - 428
Clyde Rd AL * 71 39 133 61 2 4 0 6 0 0 316
Maximum 71 45 186 103 17 10 3 11 64 0 428
24 hour rainfall to 9am on
January Total
Station Name
21 22 23 24 25 26 27 28 29 30 (mm) Barron Leslie Ck TM * 10 20 120 63 4 18 1 0 12 0 248 Atherton Solar Crescent 13 16 125 110 20 20 - - 15 - 319 Boar Pocket AL * 23 23 206 125 8 7 1 3 18 0 414 Bones Knob AL * 8 14 94 109 27 20 2 0 6 0 280 Tinaroo Dam AL * 7 12 68 54 14 20 8 0 4 1 188 Walkamin DPI 72 in 3 8 73 - - 46 in 4 0 81 Mareeba Ap AWS * 15 7 89 77 16 5 1 0 4 0 214 Mareeba TM * 32 5 87 59 27 0 0 0 1 0 211 Mareeba AL * 31 5 86 57 25 0 0 0 1 0 205 Emerald Crest AL * 21 11 93 68 18 1 0 0 3 0 215 Bilwon AL * 20 43 112 36 52 0 1 0 2 0 266 Bolton Road AL * 9 7 86 38 33 0 0 0 5 0 178 Mona Mona AL * 34 21 177 50 47 3 0 0 38 0 370 Flaggy Creek AL * 26 31 174 55 51 0 0 2 14 0 353 Myola AL * 25 31 229 61 45 0 2 0 11 0 404 Kuranda Railway Station - - 235 - - - - - - - 235 Kamerunga Br AL * 15 19 208 91 32 2 0 0 7 0 374 Saddle Mountain AL * 21 18 182 26 28 0 1 1 14 0 291 Copperlode Dam AL * 9 8 248 123 14 1 0 0 6 4 413 Brinsmead AL * 10 13 146 37 25 0 0 0 5 0 236 Cairns Ap AWS * 8 12 112 24 27 3 0 3 8 2 200 Cairns Airport AL * 10 16 117 22 27 6 0 1 7 1 207 Tamarind Gdns 30 27 166 57 6 2 - - 6 - 295 Mossman South 139 79 158 14 11 1 - - 10 - 412 Port Douglas Warner St - 89 95 20 12 - - 6 13 - 235 Reef Park 88 69 138 31 27 in 3 - - - 353
Black Mt TM * 18 12 183 46 17 - - - 5 - 281
Maximum 139 89 248 125 52 20 8 6 38 4 414

TC Oswald Floods – January 2013
Bureau of Meteorology, Queensland Page 54 http://www.bom.gov.au/hydro/flood/qld/fld_reports/reports.shtml © Copyright Commonwealth of Australia 2013, Bureau of Meteorology (ABN 92 637 533 532)
24 hour rainfall to 9am on
January Total
Station Name
21 22 23 24 25 26 27 28 29 30 (mm) Daintree/Endeavour O'Donoghue Rd TM * 198 44 155 10 9 2 0 0 10 0 428 Whyanbeel Ck TM * 126 48 217 28 8 3 0 3 17 0 450 Bairds TM * 44 73 126 22 16 0 9 2 1 0 293 Daintree Village 45 60 113 21 12 13 - - 11 - 275 Daintree Tea 76 60 126 13 - - - - - - 275 China Camp TM * 53 102 132 11 58 3 0 0 3 0 362 Hazelmere 112 90 70 21 50 7 - - - - 350 Flaggy TM * 74 9 1 1 1 0 1 0 0 0 87 Beesbike TM * 66 91 71 27 33 0 0 - 0 0 288
Cooktown Ap AWS * 58 108 60 6.2 28 3 0 0 - 0 263
Maximum 198 108 217 28 58 13 9 3 17 0 450

TC Oswald Floods – January 2013
Appendix 3. Hydrographs Shown below are selected hydrographs from key stations recorded during the Ex-Tropical Cyclone Oswald event.
Tully River at Euramo Alert
Herbert River at Abergowrie Bridge Alert
Herbert River at Ingham Pump Station Alert
Bureau of Meteorology, Queensland Page 55 http://www.bom.gov.au/hydro/flood/qld/fld_reports/reports.shtml © Copyright Commonwealth of Australia 2013, Bureau of Meteorology (ABN 92 637 533 532)

TC Oswald Floods – January 2013
Bureau of Meteorology, Queensland Page 56
Herbert River at Gairloch Alert
Herbert River at Gairloch Manual
First Observation
Herbert River at Halifax Alert
http://www.bom.gov.au/hydro/flood/qld/fld_reports/reports.shtml © Copyright Commonwealth of Australia 2013, Bureau of Meteorology (ABN 92 637 533 532)

TC Oswald Floods – January 2013
Bureau of Meteorology, Queensland Page 57
Haughton River at Giru Alert
Haughton River at Giru Manual
First Observation
Don River at Mt Dangar Alert
http://www.bom.gov.au/hydro/flood/qld/fld_reports/reports.shtml © Copyright Commonwealth of Australia 2013, Bureau of Meteorology (ABN 92 637 533 532)

TC Oswald Floods – January 2013
Bureau of Meteorology, Queensland Page 58
Don River at Bowen Pump Station Alert
Fitzroy River at Yaamba Manual
First Observation
Fitzroy River at Rockhampton Manual
First Observation
http://www.bom.gov.au/hydro/flood/qld/fld_reports/reports.shtml © Copyright Commonwealth of Australia 2013, Bureau of Meteorology (ABN 92 637 533 532)

TC Oswald Floods – January 2013
Bureau of Meteorology, Queensland Page 59
Calliope River at Castlehope TM
Boyne River at Awoonga Dam Hw TM
Minor
Baffle Creek at Mimdale TM
http://www.bom.gov.au/hydro/flood/qld/fld_reports/reports.shtml © Copyright Commonwealth of Australia 2013, Bureau of Meteorology (ABN 92 637 533 532)

TC Oswald Floods – January 2013
Bureau of Meteorology, Queensland Page 60
Kolan River at Springfield TM
Kolan River at Fred Haigh Dam TM
Kolan River at Gin Gin Creek TM
http://www.bom.gov.au/hydro/flood/qld/fld_reports/reports.shtml © Copyright Commonwealth of Australia 2013, Bureau of Meteorology (ABN 92 637 533 532)

TC Oswald Floods – January 2013
Bureau of Meteorology, Queensland Page 61
Kolan River at Bucca Weir Hw TM
Kolan River at Gooburrum Pump Station TM
Burnett River at Abercorn TM
http://www.bom.gov.au/hydro/flood/qld/fld_reports/reports.shtml © Copyright Commonwealth of Australia 2013, Bureau of Meteorology (ABN 92 637 533 532)

TC Oswald Floods – January 2013
Bureau of Meteorology, Queensland Page 62
Burnett River at Ceratodus TM
Burnett River at Marriages TM
Burnett River at Mundubbera Manual
http://www.bom.gov.au/hydro/flood/qld/fld_reports/reports.shtml © Copyright Commonwealth of Australia 2013, Bureau of Meteorology (ABN 92 637 533 532)
First Observation

TC Oswald Floods – January 2013
Bureau of Meteorology, Queensland Page 63
Burnett River at Gayndah Flume TM
Burnett River at Mt Lawless TM
Burnett River at Paradise Dam TM and Manual
http://www.bom.gov.au/hydro/flood/qld/fld_reports/reports.shtml © Copyright Commonwealth of Australia 2013, Bureau of Meteorology (ABN 92 637 533 532)

TC Oswald Floods – January 2013
Bureau of Meteorology, Queensland Page 64
Burnett River at Fig Tree TM
Burnett River at Walla TM
Burnett River at Bundaberg Manual
First Observation
http://www.bom.gov.au/hydro/flood/qld/fld_reports/reports.shtml © Copyright Commonwealth of Australia 2013, Bureau of Meteorology (ABN 92 637 533 532)

TC Oswald Floods – January 2013
Bureau of Meteorology, Queensland Page 65
Cherwell River at Pacific Haven AL
Burrum River at Howard AL
Mary River at Gympie AL
http://www.bom.gov.au/hydro/flood/qld/fld_reports/reports.shtml © Copyright Commonwealth of Australia 2013, Bureau of Meteorology (ABN 92 637 533 532)

TC Oswald Floods – January 2013
Bureau of Meteorology, Queensland Page 66
Mary River at Miva TM
Mary River at Tiaro Manual
First Observation
Mary River at Maryborough Manual
http://www.bom.gov.au/hydro/flood/qld/fld_reports/reports.shtml © Copyright Commonwealth of Australia 2013, Bureau of Meteorology (ABN 92 637 533 532)
First Observation

TC Oswald Floods – January 2013
Bureau of Meteorology, Queensland Page 67
Bremer River at Ipswich AL
Brisbane River at Brisbane AL
Logan River at Round Mountain AL
http://www.bom.gov.au/hydro/flood/qld/fld_reports/reports.shtml © Copyright Commonwealth of Australia 2013, Bureau of Meteorology (ABN 92 637 533 532)

TC Oswald Floods – January 2013
Bureau of Meteorology, Queensland Page 68
Logan River at Macleans Bridge Manual
First Observation
Logan River at Waterford Bridge AL
Logan River at Eagleby Manual
http://www.bom.gov.au/hydro/flood/qld/fld_reports/reports.shtml © Copyright Commonwealth of Australia 2013, Bureau of Meteorology (ABN 92 637 533 532)
First Observation

TC Oswald Floods – January 2013
Bureau of Meteorology, Queensland Page 69
Appendix 4. DNRM Usage Agreement
User Licence for Digital Data Permitted use:
• You may use the data for your own purposes (including supply to consultants for a specific consultancy project for you, but the consultants must return or destroy the data when the project is finished). You must not sell or distribute the data.
• You must display this copyright notice on any copies of the data, however altered, reformatted or redisplayed, if you supply the data to a consultant or copy it for backup purposes:“© The State of Queensland (Department of Natural Resources and Mines) [2013]”.
• You may create and distribute hardcopy products and non-editable digital images (e.g. pdf files) based on or containing the data, provided all the following conditions are met:
o The product(s) must be distributed at no charge, and revenue cannot be generated to offset any free distribution (e.g. advertising/sponsorship).
o You must display this acknowledgment on the product(s): “Based on or contains data provided by the State of Queensland (Department of Natural Resources and Mines) [year]. In consideration of the State permitting use of this data you acknowledge and agree that the State gives no warranty in relation to the data (including accuracy, reliability, completeness, currency or suitability) and accepts no liability (including without limitation, liability in negligence) for any loss, damage or costs (including consequential damage) relating to any use of the data. Data must not be used for direct marketing or be used in breach of the privacy laws.”
o You must include metadata with the product(s) and the metadata must incorporate as a minimum the metadata supplied with this data.
Obligations:
• You must not use the data for direct marketing or in breach of the privacy laws. • If you wish to distribute the data or distribute product(s) for a charge you must organise a
different licence, by contacting the Department of Natural Resources and Mines (Phone: [email protected]).
Ownership: The State of Queensland, as represented by the Department of Natural Resources and Mines (NRM), is the owner of the intellectual property rights in and to the data, or has the right to make this data available under licence arrangements. External contributors to data are listed on the website http://www.nrm.qld.gov.au/water/monitoring/index.html . Disclaimer and indemnity: You agree to accept all responsibility and risks associated with the use of the data. NRM makes no representations or warranties in relation to the data, and, you agree that, to the extent permitted by law, all warranties relating to accuracy, reliability, completeness, currency or suitability for any particular purpose and all liability for any loss, damage or costs (including consequential damage) incurred in any way (including but not limited to that arising from negligence) in connection with any use of or reliance on the data are excluded or limited. You agree to continually indemnify the State of Queensland and NRM (and their officers and employees) against any loss, cost, expense, damage and liability of any kind (including consequential damage and liability in negligence) arising directly or indirectly from or related to any claim relating to your use of the data or any product made from the data.
http://www.bom.gov.au/hydro/flood/qld/fld_reports/reports.shtml © Copyright Commonwealth of Australia 2013, Bureau of Meteorology (ABN 92 637 533 532)