ewrg-iiscwgbis.ces.iisc.ernet.in/.../11_sandeepbanerjee...r.pdf · sandeep banerjee...
TRANSCRIPT

LAKE 2014: Conference on Conservation andSustainable Management of Wetland Ecosystems in
Western GhatsDate: 13th -15th November 2014
Symposium Web: http://ces.iisc.ernet.in/energy
97Sahyadri Conservation Series 47, ETR 87
AN ECOLOGICAL CRITIC OF THE DEVELOPMENT PARADIGMAS MANIFESTED IN RAJAN COMMITTEE’S COMPOSITE
DEVELOPMENT INDEXING AND SOME RECENT RELEVANTDEVELOPMENTALIST LITERATURE
Sandeep Banerjee
ABSTRACT
Nowadays, policy makers swear by“Sustainable Development” and air thatdevelopment must go hand in hand withenvironmental conservation. But when it comesto development discourse and policy making,environmental considerations, often, do takebackseat; rather their absence can be felt. InSeptember 2013 the report of the RaghuramRajan Committee was tabled. This committeesuggested indicators of the relativebackwardness of the States for equitableallocation of Central funds. If that “compositedevelopment index” and its methodology areexamined it can be seen that ‘development’, asdepicted there, does not take into cognizancethe environmental degradation and the
consequent looming crisis. Then, in the draftproposal for the imminent tax regime in India,the GST, the theme ‘EnvironmentalDegradation’ and Pigouvian taxes to confrontthat were conspicuously absent. The same istrue for the development roadmap prepared byMc Kinsey for India. Those literatures depicted‘development’ in a way that is tantamount toenvironmental degradation. Consequently,such ‘development’ leads to jeopardise the veryexistence of those for whom ‘development’ issupposedly planned. Therefore, it is necessaryto develop an alternate development index withecological footprint embedded in it; moreover,environmental ethics education for our futureeconomists is of paramount importance.
INTRODUCTION
Ruining ecosphere and Nature by economicdevelopmental processes was vividly positingthemselves in the second half of twentiethcentury when economic affluence was alsoflamboyantly flaunting itself in the post-warboom phase. This grave contradiction wasbehind the creation of the Club of Rome and itsactivities, the chalking out of Our CommonFuture and the formation of UNEP in the late1960s and early 1970s. SustainableDevelopment has since then became acatchword.
India took a memorable role in the first everinternational conference regarding environmentand development. And since then Indian
statesmen and particularly the Heads of the Staterepeatedly reminded the policy framers theirrole in safeguarding the narrow space calledecosphere where all life-forms inhabit. In theturn of this century, H.E. K R Narayanan warnedin his 2001 Republic Day Speech, “Let it not besaid of India that this great Republic in a hurryto develop itself is devastating the green motherearth and uprooting our tribal populations.”[1]And this year, H.E. the President addressed jointsession of both houses of the parliament saying,“While putting the country on a high growthpath, my government will keep sustainability atthe core of our planning process.”[2]It is not that our eminent economists,development planners and policymakers in
EWRG-II
Sc
LAKE 2014: Conference on Conservation andSustainable Management of Wetland Ecosystems in
Western GhatsDate: 13th -15th November 2014
Symposium Web: http://ces.iisc.ernet.in/energy
98Sahyadri Conservation Series 47, ETR 87
general do not know the necessity of‘sustainable development’ or ‘conservation ofnature’ or it is not that they are unaware of thesevere environmental degradation, which eachday is becoming severer. But when they take upplanning process or themes that can indirectlyaffect environment and/or Nature, surprisingly,many a time, they exclude this yardstick, whichin turn, indirectly, fuel a public discourse ondevelopment that is oblivious of this vitalperspective.This paper wants to examine in brief a fewdevelopment discourses and/or embeddedviewpoints, which, we want or not, are going toexert much influence on our lives and on Naturein near future. In a bit detail the CompositeDevelopment Indexing system of the panel ledby RBI Governor Raghuram Rajan will beexamined vis-à-vis effects of this ‘development’on human beings and Nature. Then, the McKinsey blueprint for development of India willbe taken up for a very brief critical study. Lastlythe issue of non-inclusion of much-talked-aboutPolluters Pay Principle or Pigouvian taxes in thedraft proposal for the upcoming Goods andService Tax (GST) regime will be raised. Beforethat, here is a brief introduction for theabovementioned three literatures.
It can be assumed that Rajan’s Index will be aguideline for the union government forallocating central funds to states for‘development’. Previously, development orunderdevelopment was measuredmonochromatically or based on a singleeconomic measure – GDP. How much is theGDP and what is the quantity of GDP per persongave idea as to how much progress had beenmade or how much to strive for a ‘better future’.In the second half of the past century, when‘inequality’ became a vibrant issue in academicdiscourse, GDP, GDP per capita etc weresupplemented with inequality measures inincome and wealth (like Gini coefficient). Later,the concept of ‘Human Development’ came to
limelight, where issue like health and educationwere also taken into consideration, not just‘income’ alone. Side by side, the genderquestion was also acknowledged institutionallyand Gender Inequality Index was alsodeveloped. In their report: “Report of theCommittee for Evolving a CompositeDevelopment Index of States” submitted inSeptember 2, 2013 [3] , the Rajan Panel tried topresent an integrated or composite whole ofsocial parameters in development indexingwhich includes Quantum of BackwardPopulation (like Scheduled-Castes/Scheduled-Tribes), Infant Mortality, Female Literacy Rate,% of household with Amenities (like drinkingwater connection at home, electricity, sanitation,banking facility, etc),Connectivity (differenttypes of roads & railway), Urbanisation etc. Thisway, it developed a composite developmentmeasure with several parameters connected withthe lives of citizens. It may naturally be arguedthat in the view of the members of the committeethis list of parameters chosen is exhaustive.Now, the nature and relation of thesedevelopment parameters with parameters ofdegradation of Nature needs to be examined.
Mc Kinsey, as their website says, is “the trustedadvisor and counsellor to many of the world’smost influential businesses and institutions”.They advise many First-World governmentsincluding that of the United States of America,and the Left led Govt of WB (1977-2011) alsoappointed them as a permanent counsellor forindustrialisation in 1999. They developdevelopment policies, business policies etc fortheir client governments. In February 2014 theypublished “From poverty to empowerment:India’s imperative for jobs, growth, andeffective basic services” [4]. They introduced aprogram that would purportedly help Indiaaccelerate her performance now, after twodecades of liberalisation. Citizens of India maythank them for contra-posing “EmpowermentLine” vis-à-vis the “Poverty Line” which (the
EWRG-II
Sc

LAKE 2014: Conference on Conservation andSustainable Management of Wetland Ecosystems in
Western GhatsDate: 13th -15th November 2014
Symposium Web: http://ces.iisc.ernet.in/energy
99Sahyadri Conservation Series 47, ETR 87
latter) only shows abject poverty or survival-minimum and not what a citizen needs for adecent life in this twenty-first century. Theyboldly stated, “The Empowerment Line revealsthat 56 percent of India’s population lacks themeans for a minimum acceptable standard ofliving” and calculated, in “business-as-usual”scenario, “some 470 million people, or 36percent of India’s population, would remainbelow the Empowerment Line in 2022 and asmuch as 12 percent would remain below theofficial poverty line”. They prescribe a higherGDP growth rate, almost 85% higher than whatthey term, ‘stalled reform’ phase, that is presentphase. But how that development envisioned bythem is related to Nature is a question thatnaturally is very crucial for everybody.The GST regime is waiting in the wings forsome 5 years. In 2009, the then Finance
Minister, who happens to be the President ofIndia now, announced in the parliament that asingle and simple tax system GST would beintroduced and would be placed for thediscussion soon. GST will replace the VAT. Thedesignated committee placed the first draft of itfor discussion in 2009 [5]. As India did not haveany comprehensive Environmental Tax system,positive or negative, apart from in a round-aboutor unsaid ways like coal tax, quickerdepreciation rate for greening or greenertechnologies etc, it would not perhaps be a greatexpectation to see environmental taxesincorporated or embedded into the GST frame.These three discourses are very important asthese will influence, in one way or other, theNatural scenario and life in India.
METHODData used by Rajan Committee could beavailed, thanks to Prof Bharat Ramaswami formaking public the dataset [6]. Other dataregarding it could be availed by the FinanceMinistry website [7]. Related economic andenvironmental datasets were acquired from theWorld Bank resource [8]. Data regarding
environmental and other effects were acquiredfrom accredited academic sources and peerreviewed journals apart from resource base ofinternational institutions [10-15]. Simple andstandard statistical calculations that can easilybe done in spreadsheet were used for the sakeof simplicity and brevity of this treatise.
RESULTS & DISCUSSIONThe overt and also unsaid rush for growth andresulting environmental degradation was thecentral theme of the now famous publication forthe Club of Rome: Limits to Growth [16]. Therethey repeatedly highlighted the ‘exponential’nature of growth and the resultant dilapidation.They suggested conscious de-growth as thenecessary step. Though the authoring group andthe name of the publication became acommonplace jargon, what was said by thecelebrated Club remained obscure in mandevelopment treatises of economists today.Sustainable development was pledged, we gotdevelopment as 1 to 1 correlated with
degradation, and the exponential growth is stillthreatening in many aspects.
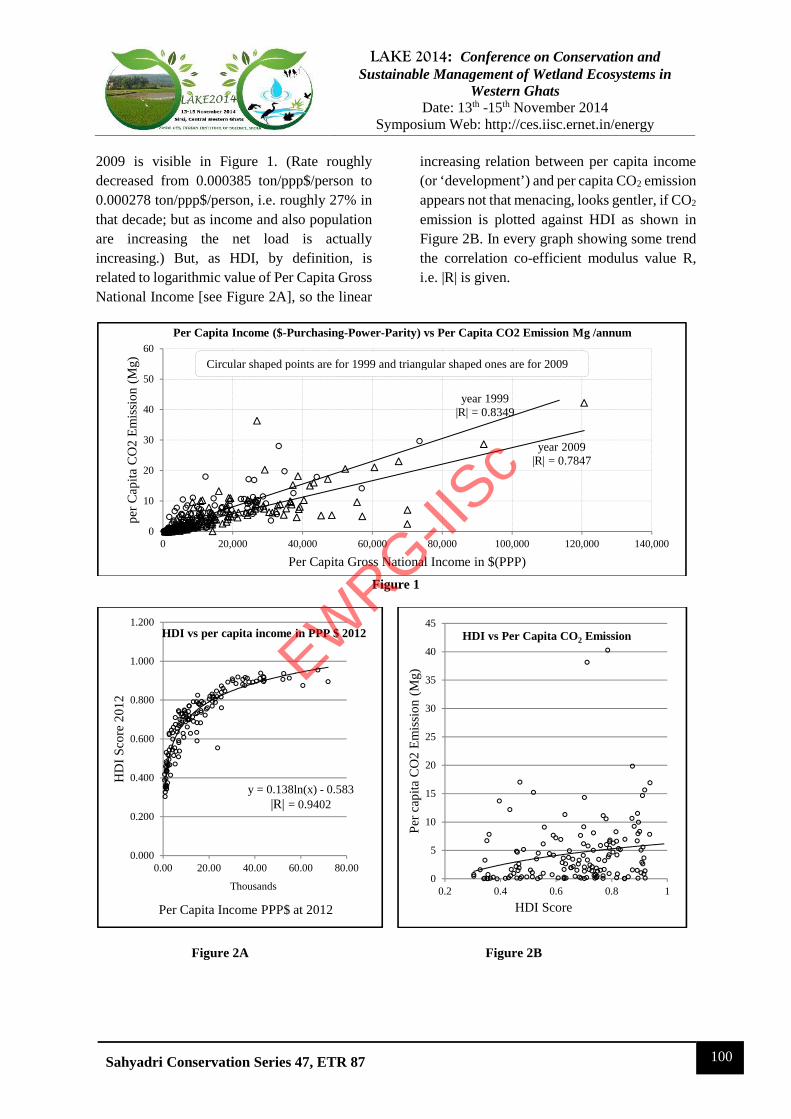
We have seen the Gross Domestic Product (orGross National Income) centric approach andthe Human Development approach ofdevelopment measurers and planners. If GDPor GNI per capita in PPP (purchasing powerparity) dollars is plotted against tons of CO2
emitted per person, then the straight line trendis obvious. This is shown in Figure 1. As Figure1 reveals, the rate of increase of per capita CO2
emission with respect to rising income isslowing down only very marginally over years;the change in post Kyoto decade, that is 1999 –
EWRG-II
Sc
LAKE 2014: Conference on Conservation andSustainable Management of Wetland Ecosystems in
Western GhatsDate: 13th -15th November 2014
Symposium Web: http://ces.iisc.ernet.in/energy
100Sahyadri Conservation Series 47, ETR 87
2009 is visible in Figure 1. (Rate roughlydecreased from 0.000385 ton/ppp$/person to0.000278 ton/ppp$/person, i.e. roughly 27% inthat decade; but as income and also populationare increasing the net load is actuallyincreasing.) But, as HDI, by definition, isrelated to logarithmic value of Per Capita GrossNational Income [see Figure 2A], so the linear
increasing relation between per capita income(or ‘development’) and per capita CO2 emissionappears not that menacing, looks gentler, if CO2
emission is plotted against HDI as shown inFigure 2B. In every graph showing some trendthe correlation co-efficient modulus value R,i.e. |R| is given.
Figure 1
Figure 2A Figure 2B
year 1999|R| = 0.8349
year 2009|R| = 0.7847
0
10
20
30
40
50
60
0 20,000 40,000 60,000 80,000 100,000 120,000 140,000
per
Cap
ita C
O2
Em
issi
on (
Mg)
Per Capita Gross National Income in $(PPP)
Per Capita Income ($-Purchasing-Power-Parity) vs Per Capita CO2 Emission Mg /annum
y = 0.138ln(x) - 0.583|R| = 0.9402
0.000
0.200
0.400
0.600
0.800
1.000
1.200
0.00 20.00 40.00 60.00 80.00
HD
I Sc
ore
2012
Per Capita Income PPP$ at 2012
Thousands
HDI vs per capita income in PPP $ 2012
0
5
10
15
20
25
30
35
40
45
0.2 0.4 0.6 0.8 1
Per
cap
ita C
O2
Em
issi
on (
Mg)
HDI Score
HDI vs Per Capita CO2 Emission
Circular shaped points are for 1999 and triangular shaped ones are for 2009
EWRG-II
Sc
LAKE 2014: Conference on Conservation andSustainable Management of Wetland Ecosystems in
Western GhatsDate: 13th -15th November 2014
Symposium Web: http://ces.iisc.ernet.in/energy
101Sahyadri Conservation Series 47, ETR 87
Figure 3A Figure 3B
Figure 3C Figure 3D
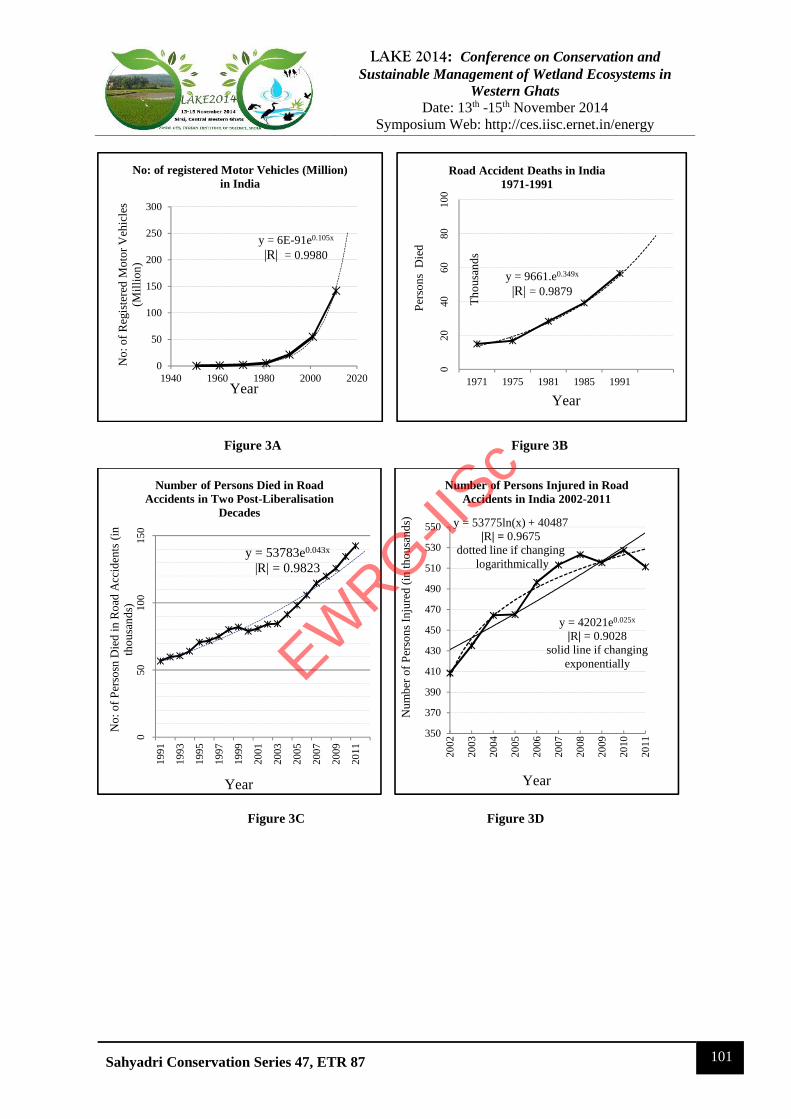
y = 6E-91e0.105x
|R| = 0.9980
0
50
100
150
200
250
300
1940 1960 1980 2000 2020
No:
of
Reg
iste
red
Mot
or V
ehic
les
(Mil
lion
)
Year
No: of registered Motor Vehicles (Million)in India
y = 9661.e0.349x
|R| = 0.9879
020
4060
8010
0
1971 1975 1981 1985 1991
Per
sons
Die
d
Tho
usan
ds
Year
Road Accident Deaths in India1971-1991
y = 53783e0.043x
|R| = 0.9823
050
100
150
1991
1993
1995
1997
1999
2001
2003
2005
2007
2009
2011
No:
of
Per
sosn
Die
d in
Roa
d A
ccid
ents
(in
thou
sand
s)
Year
Number of Persons Died in RoadAccidents in Two Post-Liberalisation
Decades
y = 42021e0.025x
|R| = 0.9028solid line if changing
exponentially
y = 53775ln(x) + 40487|R| = 0.9675
dotted line if changinglogarithmically
350
370
390
410
430
450
470
490
510
530
550
2002
2003
2004
2005
2006
2007
2008
2009
2010
2011
Num
ber
of P
erso
ns I
njur
ed (
in th
ousa
nds)
Year
Number of Persons Injured in RoadAccidents in India 2002-2011
EWRG-II
Sc
LAKE 2014: Conference on Conservation andSustainable Management of Wetland Ecosystems in
Western GhatsDate: 13th -15th November 2014
Symposium Web: http://ces.iisc.ernet.in/energy
102Sahyadri Conservation Series 47, ETR 87
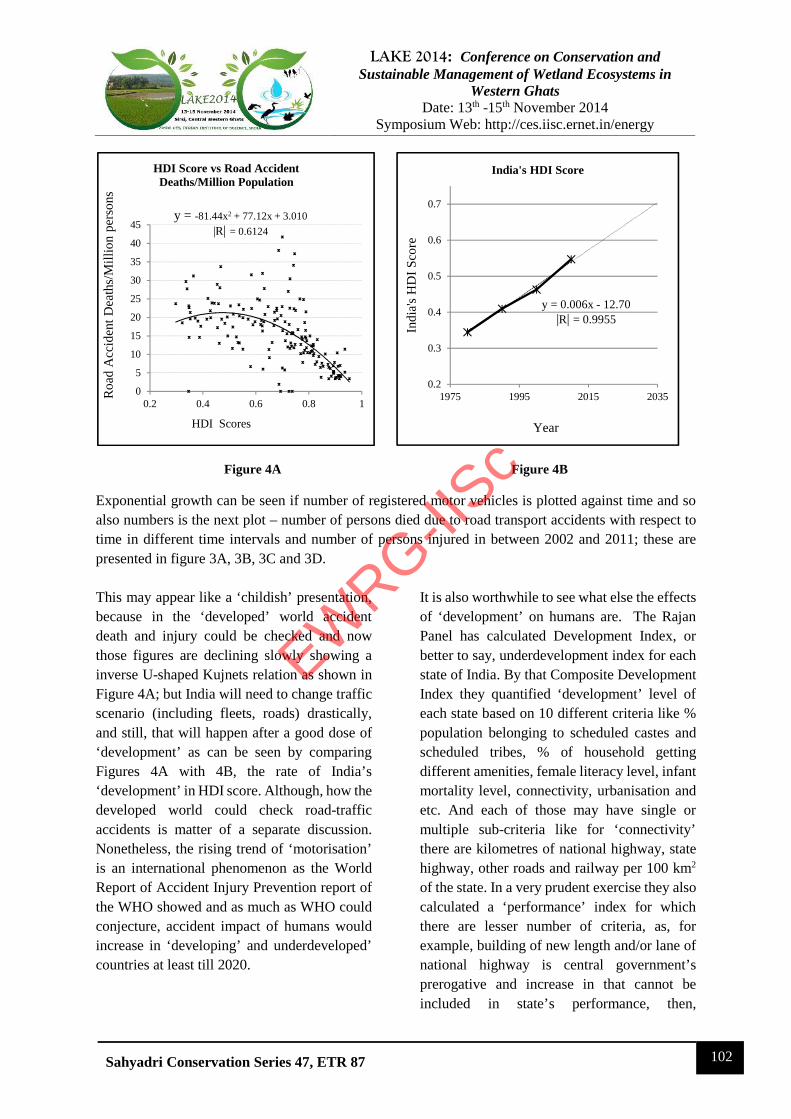
Figure 4A Figure 4B
Exponential growth can be seen if number of registered motor vehicles is plotted against time and soalso numbers is the next plot – number of persons died due to road transport accidents with respect totime in different time intervals and number of persons injured in between 2002 and 2011; these arepresented in figure 3A, 3B, 3C and 3D.
This may appear like a ‘childish’ presentation,because in the ‘developed’ world accidentdeath and injury could be checked and nowthose figures are declining slowly showing ainverse U-shaped Kujnets relation as shown inFigure 4A; but India will need to change trafficscenario (including fleets, roads) drastically,and still, that will happen after a good dose of‘development’ as can be seen by comparingFigures 4A with 4B, the rate of India’s‘development’ in HDI score. Although, how thedeveloped world could check road-trafficaccidents is matter of a separate discussion.Nonetheless, the rising trend of ‘motorisation’is an international phenomenon as the WorldReport of Accident Injury Prevention report ofthe WHO showed and as much as WHO couldconjecture, accident impact of humans wouldincrease in ‘developing’ and underdeveloped’countries at least till 2020.
It is also worthwhile to see what else the effectsof ‘development’ on humans are. The RajanPanel has calculated Development Index, orbetter to say, underdevelopment index for eachstate of India. By that Composite DevelopmentIndex they quantified ‘development’ level ofeach state based on 10 different criteria like %population belonging to scheduled castes andscheduled tribes, % of household gettingdifferent amenities, female literacy level, infantmortality level, connectivity, urbanisation andetc. And each of those may have single ormultiple sub-criteria like for ‘connectivity’there are kilometres of national highway, statehighway, other roads and railway per 100 km2
of the state. In a very prudent exercise they alsocalculated a ‘performance’ index for whichthere are lesser number of criteria, as, forexample, building of new length and/or lane ofnational highway is central government’sprerogative and increase in that cannot beincluded in state’s performance, then,
y = -81.44x2 + 77.12x + 3.010
|R| = 0.6124
0
5
10
15
20
25
30
35
40
45
0.2 0.4 0.6 0.8 1
Roa
d A
ccid
ent D
eath
s/M
illio
n pe
rson
s
HDI Scores
HDI Score vs Road AccidentDeaths/Million Population
y = 0.006x - 12.70|R| = 0.9955
0.2
0.3
0.4
0.5
0.6
0.7
1975 1995 2015 2035In
dia'
s H
DI
Scor
eYear
India's HDI Score
EWRG-II
Sc

LAKE 2014: Conference on Conservation andSustainable Management of Wetland Ecosystems in
Western GhatsDate: 13th -15th November 2014
Symposium Web: http://ces.iisc.ernet.in/energy
103Sahyadri Conservation Series 47, ETR 87
percentage of persons belonging to SC and STcategories is not a function of developmentworks of the state, and etcetera. But this newlydeveloped indexing system was seen todisregard environmental parameters as far asdevelopment and/or deterioration of conditionsof life of human beings are concerned. As forRajan’s Index = 0 we get highest possible‘development’ and for Rajan’s Index = 1 we getlowest possible ‘development’, for the sake ofconvenience 1 – Rajan’s Index (1 minusRajan’s Index) was plotted against pollutiongenerated from one of the 10 criteria consideredby Rajan’s panel, i.e. Connectivity by surfacetransport, for the states. Figures 5A to 5Dpresent the conditions. It can be seen that the
more a state ‘develops’ and gain more byRajan’s Index Score (developed means nearerto zero), the more number of registered motorvehicles it will likely have, a move moretowards private transport, and which will, in alllikelihood, increase pollution loads of differentkinds – main greenhouse gas, CO2, ParticulateMatters (PM10, PM2.5), Noxious gases (likecarbon monoxide or CO, nitrogen oxides orNOX, sulphur oxides or SOX, hydrocarbons)and etc. Thus development will lead todeterioration of environment and increasedsufferings of humans, even if we do not reckonother life-forms.
Figure 5A
Figure 5B Figure 5C
Incidentally, it can be seen that the new Rajan’sIndices have a striking correlation with the old
HDI counts of states as shown in the Figure 6,and HDI score doesn’t depend on a country’s
y = 346.4x - 39.46|R| = 0.6768 solid line
y = 38.02e2.082x
|R| = 0.6364 dotted line0
100
200
300
400
500
600
0 0.2 0.4 0.6 0.8 1
No:
of
Reg
iste
red
Mot
orV
ehic
les/
1000
per
sons
1 - Rajan's (under) Development Index
Rajan's Index and No. of Motor Vehicles/thousand Persons
y = 0.424x - 0.106|R| = 0.7469
00.050.1
0.150.2
0.250.3
0.350.4
0.45
0 0.5 1
Tot
al G
aseo
us E
mis
sion
/km
2
1 - Rajan's (under) Development Index
Rajan's Index and Gasous Emission fromTransport, Gg/km2
y = 0.287x - 0.077|R| = 0.7655
0
0.05
0.1
0.15
0.2
0.25
0.3
0.35
0 0.5 1Par
ticu
late
Mat
ter
Em
issi
on/k
m2
1 - Rajan's (under) Development Index
PM Emission from Transport, Mg/km2
EWRG-II
Sc
LAKE 2014: Conference on Conservation andSustainable Management of Wetland Ecosystems in
Western GhatsDate: 13th -15th November 2014
Symposium Web: http://ces.iisc.ernet.in/energy
104Sahyadri Conservation Series 47, ETR 87
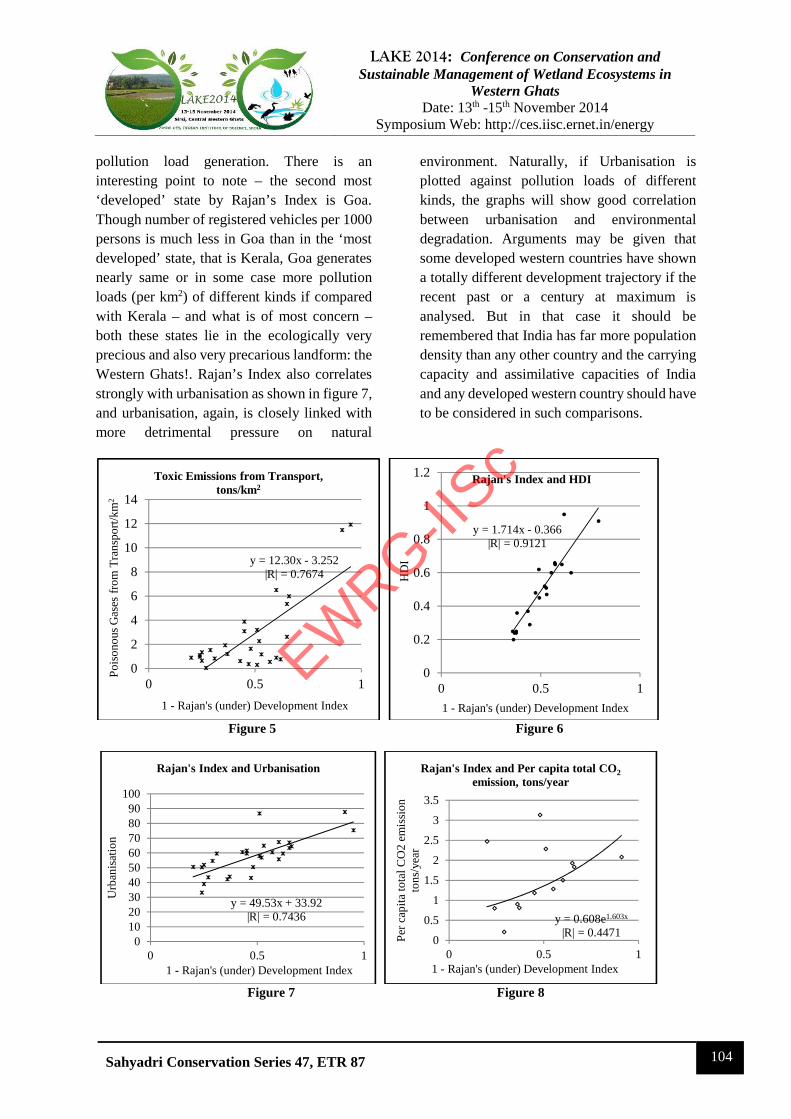
pollution load generation. There is aninteresting point to note – the second most‘developed’ state by Rajan’s Index is Goa.Though number of registered vehicles per 1000persons is much less in Goa than in the ‘mostdeveloped’ state, that is Kerala, Goa generatesnearly same or in some case more pollutionloads (per km2) of different kinds if comparedwith Kerala – and what is of most concern –both these states lie in the ecologically veryprecious and also very precarious landform: theWestern Ghats!. Rajan’s Index also correlatesstrongly with urbanisation as shown in figure 7,and urbanisation, again, is closely linked withmore detrimental pressure on natural
environment. Naturally, if Urbanisation isplotted against pollution loads of differentkinds, the graphs will show good correlationbetween urbanisation and environmentaldegradation. Arguments may be given thatsome developed western countries have showna totally different development trajectory if therecent past or a century at maximum isanalysed. But in that case it should beremembered that India has far more populationdensity than any other country and the carryingcapacity and assimilative capacities of Indiaand any developed western country should haveto be considered in such comparisons.
Figure 5 Figure 6
Figure 7 Figure 8
y = 12.30x - 3.252|R| = 0.7674
0
2
4
6
8
10
12
14
0 0.5 1
Poi
sono
us G
ases
fro
m T
rans
port
/km
2
1 - Rajan's (under) Development Index
Toxic Emissions from Transport,tons/km2
y = 1.714x - 0.366|R| = 0.9121
0
0.2
0.4
0.6
0.8
1
1.2
0 0.5 1
HD
I
1 - Rajan's (under) Development Index
Rajan's Index and HDI
y = 49.53x + 33.92|R| = 0.7436
0102030405060708090
100
0 0.5 1
Urb
anis
atio
n
1 - Rajan's (under) Development Index
Rajan's Index and Urbanisation
y = 0.608e1.603x
|R| = 0.44710
0.5
1
1.5
2
2.5
3
3.5
0 0.5 1
Per
cap
ita
tota
l CO
2 em
issi
onto
ns/y
ear
1 - Rajan's (under) Development Index
Rajan's Index and Per capita total CO2emission, tons/year
EWRG-II
Sc

LAKE 2014: Conference on Conservation andSustainable Management of Wetland Ecosystems in
Western GhatsDate: 13th -15th November 2014
Symposium Web: http://ces.iisc.ernet.in/energy
105Sahyadri Conservation Series 47, ETR 87
As Rajan’s Index has two parameters,‘Connectivity’ and ‘Urbanisation’, and both ofwhich directly imply surface transport, it mayseem obvious that Rajan’s Index would havecorrelation with surface transport drivenpollution. But what about pollutions which arearising from other economic activities? RashmiArora of Bradford University in her recentpublication presented per capita carbonemission from economic activities (not onlytransport) of most of the Indian states [17] andif the emission figures of the states for the latestavailable year there is compared with Rajan’sindex of states then a disquieting picture, that ofexponentially increasing emission trend vis-à-vis ‘development’, emerges, as presented inFigure 8, albeit with somewhat ‘weakcorrelation’, with |R| <0.5.
McKinsey Global Institute, in February 2014published their India report titled: “Frompoverty to empowerment: India’s imperativefor jobs, growth, and effective basic services”.Its executive summary may attract attention byits pronounced bold departure from the conceptof ‘Poverty Line’, saying that this poverty isabject poverty, just ‘living’ with this or thatmuch ‘calorie’, as if to drag an inhumanexistence, and it is not acceptable to shrink thetarget of development to improve this muchonly. Rather for a minimum humane existenceanother target level was fixed by Mc Kinseyteam – the Empowerment Line – where peoplewill be able to avail “basic services”. Theyhighlighted huge investment drive ininfrastructures related to roads, ports, railway,electricity and irrigation. But in that veryexecutive summary they separated themselvesfrom what is believed to be a cornerstone ofecological economics, that smaller is better interms of scale. In p6, they characterise Indianeconomy as one operating with sub-optimalscale. To picturize, they gave number of Indianfirms with less than 50 employees, whichturned out to be 84% of the firms, where the
same figure for China is 25%, for Indonesia itis 65% etc. Their envisaged higher investment higher growth higher revenue higherinvestment ... cycle will ‘empower’ India as thereport said. This growth-ist model banks onleadership given by industry, which may break-apart India’s vicious cycle by creating morejobs in construction and manufacturing. As theyemphatically stood against ‘small-scale’, itmight be inferred that what their reportsuggested was large-scale construction andmanufacturing. But construction,manufacturing etc. are material dependent andtherefore the this model takes for granted moresteel, more cement, and etc. which again in turnmeans more and more ‘harvest’ of naturalresources including mineral deposits andenergy.
It sounds very reasonable and humane whenthey mention: “A slum dweller …if she couldafford it, she could move into a pucca buildingwith water supply and toilet …a rural farmercould improve …upgrading from mud andthatch to cement and bricks; he could alsoinstall a personal tube well ….”. But suchdiscourses, simultaneously, do not warn readersand persons who could manage straw-roofedhome for another decade or so that even ifwaste-energy utilisation, less energyconsuming techniques etc are adopted, 1 toncement will mean ≈1 ton CO2 and ≈1.6 tonslimestone, which, if procured from limestonequarries from Gujarat, may mean moving 0.95m3 earth, and if procured from Meghalaya orsome other hilly state, may require diggingsome 1.6-1.8 m3 earth, a process which isalready threatening devastation in theecologically fragile and a ‘biodiversity hotspot’Eastern Himalaya. In some NE states mineralextraction is also giving rise to AMD (acidmine drainage) which is threatening water andsoil health in many NE states and evenpoisoning water of many tributaries in the statesof North East India[18-19]. However, the Mc
EWRG-II
Sc
LAKE 2014: Conference on Conservation andSustainable Management of Wetland Ecosystems in
Western GhatsDate: 13th -15th November 2014
Symposium Web: http://ces.iisc.ernet.in/energy
106Sahyadri Conservation Series 47, ETR 87
Kinsey report did not ponder such naturaleffects of growth.
It may also be noted that the words ‘emission’,‘pollution’, did not occur at all in the Mc Kinseyreport. The word ‘nature’ appeared only tomean ‘sort of’ or ‘kind of’ things;‘environment’ is used generally to mean workenvironment, though twice this word appearedfor raising the question of environmental-‘clearance’ – once for complaining the delay etcin clearance and once again to formulate thetask of high power SPVs or Special PurposeVehicles: “The SPV would be responsible fordeveloping a master plan for the zone, engaging
a developer, obtaining environmentalclearances, promoting investment, …”.Moreover, a map of Industrial Clusters ispresented in page 146 of their publication andthe map envisions 7 such clusters in the NorthEast and quite a lot of such clusters in the SouthWest of India dotting through the WesternGhats states. The report suggests, “Targetedgovernment investment in high-qualitytransportation and power infrastructure, as wellas social infrastructure, could accelerate theirdevelopment.” Therefore, for growth, fordevelopment, for empowerment and such loftygoals, the Mc Kinsey report stresses on such anenvironment.
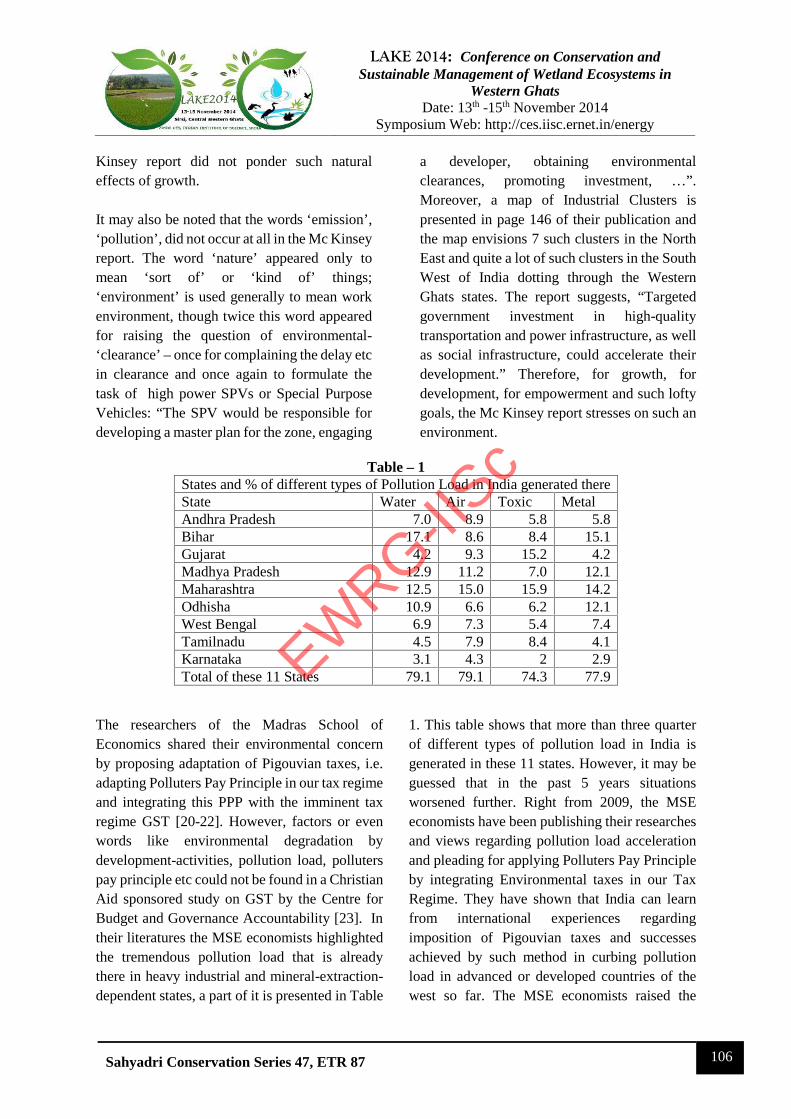
Table – 1States and % of different types of Pollution Load in India generated thereState Water Air Toxic MetalAndhra Pradesh 7.0 8.9 5.8 5.8Bihar 17.1 8.6 8.4 15.1Gujarat 4.2 9.3 15.2 4.2Madhya Pradesh 12.9 11.2 7.0 12.1Maharashtra 12.5 15.0 15.9 14.2Odhisha 10.9 6.6 6.2 12.1West Bengal 6.9 7.3 5.4 7.4Tamilnadu 4.5 7.9 8.4 4.1Karnataka 3.1 4.3 2 2.9Total of these 11 States 79.1 79.1 74.3 77.9
The researchers of the Madras School ofEconomics shared their environmental concernby proposing adaptation of Pigouvian taxes, i.e.adapting Polluters Pay Principle in our tax regimeand integrating this PPP with the imminent taxregime GST [20-22]. However, factors or evenwords like environmental degradation bydevelopment-activities, pollution load, polluterspay principle etc could not be found in a ChristianAid sponsored study on GST by the Centre forBudget and Governance Accountability [23]. Intheir literatures the MSE economists highlightedthe tremendous pollution load that is alreadythere in heavy industrial and mineral-extraction-dependent states, a part of it is presented in Table
1. This table shows that more than three quarterof different types of pollution load in India isgenerated in these 11 states. However, it may beguessed that in the past 5 years situationsworsened further. Right from 2009, the MSEeconomists have been publishing their researchesand views regarding pollution load accelerationand pleading for applying Polluters Pay Principleby integrating Environmental taxes in our TaxRegime. They have shown that India can learnfrom international experiences regardingimposition of Pigouvian taxes and successesachieved by such method in curbing pollutionload in advanced or developed countries of thewest so far. The MSE economists raised the
EWRG-II
Sc
LAKE 2014: Conference on Conservation andSustainable Management of Wetland Ecosystems in
Western GhatsDate: 13th -15th November 2014
Symposium Web: http://ces.iisc.ernet.in/energy
107Sahyadri Conservation Series 47, ETR 87
matters and discussed with the appropriateauthorities, however any changed/revised versionof discussion papers on GST was not seen to bepublished by the finance ministry. Therefore, it isnot clear whether the govt has taken up the issueof taxing environmentally non-benign ormalignant economic activities.
In this case, however, there may appear a riderregarding applying PPP for the farmers asbecause conversion to green revolution measuresof intensive cultivation and consequentapplication of high doses of chemicals andextraction of ground water and etc whichengendered extreme environmental load, was nota free-choice of the farmers; rather theagricultural extension policies of the governmentlured the farmers to that path.From the discussion so far on Rajan Panel’sreport, the Mc Kinsey report and the GST
proposal for discussion, it may not be anaspersion if from the report given by the RajanCommittee, the Mc Kinsey report and the GSTproposal submitted by appropriate committee ofthe finance ministry it is inferred that in generaldevelopment-centric or growth-centriceconomists of top echelon cannot be expected tobe sensitive to environmental degradation causedbe economic activities, at least when they designtheir development course, which are veryimportant and influential document for the fate ofbillions, although, they may of course expresstheir environmental concern in differentdiscourses for different target audiences. On theother hand, economists like those of the MSE arekeen to curb environmental loading as much asmainstream economics can permit them to do sowith the aid of environmental economics insidethe arena of economics and policy making.
CONCLUSION
1 litre of petrol or diesel use in cars gives theenvironment more than 2.5 kg CO2, 16 g CO etcand add more than 9000 kcal heat in thesurroundings. A single 1 ton AC machine,besides contributing greenhouse gas emission atthe power-plant, rewards >3000 calories everyhour to the environment outside the cooled room.This list can be lengthened by pages. It doesn’tmatter. Mumbai spends more than a third of itselectricity just for cooling. That also doesn’tmatter. This is development, and growth ismeasured in terms of growth in volume sales ofpersonal cars, ACs and etc. Even if that meanscontributing massive heat in the surroundingatmosphere, which is not owned by the user,giving rise to ‘urban heat islands’ in cities andaffecting millions outside, besides increasingGHG load. What is more, there are technicaladvancements; ostensibly ‘green’ hydrogendriven cars are coming, and developmentalists donot bother that if hydrogen comes from naturalgas where will the carbon go and how much
energy will be consumed. If opposed, it will besaid that persons using these are taking informed-decision, moreover, the omnipotent invisiblehand of the market is taking care and societycannot and should not go backward. As if theUSA of Robert Frost and John Steinbeck wasworse off.
Ecologists need to ‘develop’ a new developmentindex that will incorporate and give due weight tothe deterioration caused by anthropogenic nature-degrading activities. There is a measure –Environmental Performance Index, which wasdeveloped by Yale University. But clearly thatsystem is biased towards high income countries[24] a fact that puts to question its credibility. TheEnvironmental Sustainability Index developed inIndia by IFMR [25] is not yet foolproof, as somehigher polluting states may get some cushioning,but that is another subject. To develop adevelopment index with ecological footprintembedded in it is no doubt an interesting project.
EWRG-II
Sc
LAKE 2014: Conference on Conservation andSustainable Management of Wetland Ecosystems in
Western GhatsDate: 13th -15th November 2014
Symposium Web: http://ces.iisc.ernet.in/energy
108Sahyadri Conservation Series 47, ETR 87
Ecological Footprint computation [26] might bean appropriate point to start. Here the question of‘value education’ comes. Economics, as much asthe mainstream ‘economics’ curriculum isconcerned, do not deal with ethics; rather takefree market ‘rationality’ as the guiding principle.And essentially it opposes any ‘restriction’ or‘control’ imposed on market as imperfection.Hence Ecological Ethics need to be separatelystudied. Paul Sweezy and Paul Baran in theirdiscussion on Monopoly Capital expressed theview that “automobiles are the most irrationalmeans of transport” [27]. These US professorsmight have a specific political orientation, butrevered Japanese religious thinker Daisaku Ikedaand celebrated historian Arnold Toynbee alsoopined for public transport, preferably running onelectricity and restricting smaller vehicles onlyfor urgent cases like ambulance and fire-fighting[28]; though they did not share Baran andSweezy’s ideology. These varied individualsconverged to a same point because of one
common perception, a perception of man as asocial animal and human as a part of nature.Nature is not just an ‘object’ external to us towork upon to produce utilities and get rawmaterials; Nature is not a just space to situatefirms and farms. ‘Valuating’ nature and ‘ability’of economics to put price tags on objects of naturegive a false impression that environmental‘wrongs’ can be compensated monetarily. “Rightto pollute” can be bought and sold! If the conceptsof ecological ethics that humanity developedthrough centuries can properly be transmitted tothe future generation through education, thenonly perhaps future economists will seedevelopment differently. If our future economistsconsider how much ecological footprint everystep of ‘development’ is implying and how muchis there to spare (which is presently negative) thenit can be said that our education system had donea great job.
ACKNOWLEDGEMENT:Author is indebted to Shwetmala of CES IISc(Bangalore) for sharing data on surfacetransport generated pollution [10]. Author
would like to thank Sujay Singh, Secretary,Naihati Prolife for resources and support.
REFERENCES
1. President K R Narayanan’s Speech on 25/01/2001available at http://mea.gov.in/
2. Speech of President Pranab Mukherjee available athttp://presidentofindia.nic.in/pdfs/sp090614.pdf
3. Raghuram Rajan, Tuhin Pandey, Niraja G Jayal,Bharat Ramaswami and Shaibal Gupta (2013)“Report of ohe Committee for Evolving aComposite Development Index of States”,Ministry of Finance, GOI,
4. Rajat Gupta, Shirish Sankhe, Richard Dobbs,Jonathan Woetzel, Anu Madgavkar and AshwinHasyagar (2014), “From poverty to empowerment:India’s imperative for jobs, growth, and effectivebasic services”, Mc Kinsey Global Institute
5. First Discussion Paper On Goods and Services TaxIn India – The Empowered Committee Of StateFinance Minister,
http://finmin.nic.in/gst/Empowered%20Committee%20of%20SFM%20%20First%20Discussion%20paper.pdf
6. Bharat Ramaswami (2014) “CompositeDevelopment Index: An Explanatory Note”,Yojana, May 2014
7. Open Government Data Platform, India,http://data.gov.in/
8. World Bank data, available at(http://data.worldbank.org/).
9. Motor Vehicle Writeup (), Ministry of Statistics &PI, GOI available at http://mospi.nic.in/
10. T.V. Ramachandra and Shwetmala (2009)“Emissions from India’s transport sector:Statewise synthesis”doi:10.1016/j.atmosenv.2009.07.01, pp1-8
EWRG-II
Sc
LAKE 2014: Conference on Conservation andSustainable Management of Wetland Ecosystems in
Western GhatsDate: 13th -15th November 2014
Symposium Web: http://ces.iisc.ernet.in/energy
109Sahyadri Conservation Series 47, ETR 87
11. Mary Tahir, Tahir Hussain and Mushir Ali (2013)“Road Transport and Environmental Deteriorationin India” International Journal of EnvironmentalSciences, 2(1), pp1-11
12. Manisha Ruikar (2013), “National statistics of roadtraffic accidents in India”, Journal of Orthopaedics,Traumatology and Rehabilitation, 6(1), pp 1-6
13. Dinesh Mohan, “Traffic Safety and Health inIndian Cities”, p82, IIT-Delhi publication,available athttp://tripp.iitd.ernet.in/publications/paper/safety/aitd02.PDF
14. Dinesh Mohan (2009) “Road Accident in India”,IATSS Research, 33(1), pp 75-79
15. Dinesh Mohan (2004) “The Road Ahead TrafficInjuries and Fatalities in India”, TransportationResearch and Injury Prevention Programme, IITDelhi
16. Donella H. Meadows, Dennis L. Meadows, JǿrgenRanders and William W. Behrens II (1972), “TheLimits To Growth - A Report for the Club ofRome's Project on the Predicament of Mankind”,Potomac Associates, Washington
17. Rashmi Umesh Arora (2014) “Inequality inCarbon Emissions at Sub-National Level in India”,T h e Journal of Developing Areas Volume 48(2)
18. Sumarlin Swer and O.P. Singh (2008), “CoalMining Impacting Water Quality and AquaticBiodiversity in Jaintia Hills District ofMeghalaya”, ENVIS Bulletin, 11(2) : HimalayanEcology, pp1-8
19. Lamare R. Eugene and Singh O.P. (2014),“Degradation in Water Quality due to LimestoneMining in East Jaintia Hills, Meghalaya, India”,International Research Journal of EnvironmentSciences, 3(5), pp13-20
20. U Sankar (2009), “Ecology, Environment andSustainable Development in Indian FiscalFederalism”, Madras School Of Economics,Chennai
21. D K Srivastava, K S Kavi Kumar, C Bhujanga Rao,Brijesh C Purohit and Bodhisattva Sengupta(2010), “Integrating Pollution-abating EconomicInstruments in Goods and Service Tax (GST)regime”, Madras School of Economics, Chennai
22. D K Srivastava and C Bhujanga Rao (2010),“Reforming Indirect Taxes in India: Role ofEnvironmental Taxes”, Madras School OfEconomics, Chennai
23. Sankhanath Bandyopadhyay (2011), “A Primer onGoods and Services Tax in India”, Centre forBudget and Governance Accountability, NewDelhi
24. Environmental Performance Indexhttp://epi.yale.edu/, and http://epi.yale.edu/epi,retrieved 12:40 17/06/2014
25. http://www.greenindiastandards.com/index.php26. vide Ecological Footprint Network
(http://www.footprintnetwork.org/en/index.php/GFN/) and then, WWF(http://wwf.panda.org/about_our_earth/teacher_resources/webfieldtrips/ecological_balance/eco_footprint/)
27. Paul Baran & Paul Sweezy (1966) “MonopolyCapital: An Essay on American Economic andSocial Order”, MR Books, NY
28. Daisaku Ikeda and Arnold Toynbee (1976)
“Choose Life: A Dialogue”, I. B. Tauris, London
EWRG-II
Sc