evolutionary patterns in early tetrapods. i. rapid initial diversification followed by decrease in...
TRANSCRIPT
Evolutionary Patterns in Early Tetrapods. I. Rapid Initial Diversification Followed by Decreasein Rates of Character ChangeAuthor(s): Marcello Ruta, Peter J. Wagner and Michael I. CoatesSource: Proceedings: Biological Sciences, Vol. 273, No. 1598 (Sep. 7, 2006), pp. 2107-2111Published by: The Royal SocietyStable URL: http://www.jstor.org/stable/25223575 .
Accessed: 15/06/2014 23:50
Your use of the JSTOR archive indicates your acceptance of the Terms & Conditions of Use, available at .http://www.jstor.org/page/info/about/policies/terms.jsp
.JSTOR is a not-for-profit service that helps scholars, researchers, and students discover, use, and build upon a wide range ofcontent in a trusted digital archive. We use information technology and tools to increase productivity and facilitate new formsof scholarship. For more information about JSTOR, please contact [email protected].
.
The Royal Society is collaborating with JSTOR to digitize, preserve and extend access to Proceedings:Biological Sciences.
http://www.jstor.org
This content downloaded from 185.44.78.129 on Sun, 15 Jun 2014 23:50:36 PMAll use subject to JSTOR Terms and Conditions
PROCEEDINGS -OF-TfT) Proc. R. Soc. B (2006) 273, 2107-2111
THE ROYAL pf\ doi:10.1098/rspb.2006.3577
SOCIETY J..UI/ Published online 16 May 2006
Evolutionary patterns in early tetrapods. I. Rapid initial diversification followed
by decrease in rates of character change Marcello Ruta1*5*, Peter J. Wagner1** and Michael I. Coates2*
1 Department of Geology, Field Museum of Natural History, 1400 South Lake Shore Drive,
Chicago, IL 60605-2496, USA
2Department of Organismal Biology and Anatomy, The University of Chicago, 1027 East 57th Street,
Chicago, IL 60637-1508, USA
Although numerous studies have examined morphological diversification during major radiations of marine taxa, much less attention has been paid to terrestrial radiations. Here, we examine rates of character
change over phylogeny and over time for Palaeozoic limbed tetrapods. Palaeozoic tetrapods show
significant decreases in rates of character change whether the rate is measured per sampled cladistic branch
or per million years along phylogeny. Given changes per branch, rates decrease significantly from the
Devonian through the Pennsylvanian, but not from the Pennsylvanian through the Permian. Given
changes per million years, rates decrease significantly over each boundary, although the decrease is least
significant over the Pennsylvanian-Permian boundary. Decreasing rates per million years through the
Permian might be an artefact of the method being able to ascribe longer durations to Permian branches
than to Carboniferous ones; however, it is difficult to ascribe the general pattern of decreasing rates of
change over time to sampling biases or methodological biases. Thus, the results implicate biological
explanations for this pattern.
Keywords: Palaeozoic; lissamphibians; amniotes; diversity; disparity; rates
1. INTRODUCTION Morphological diversification studies are fundamental to
investigations of macroevolutionary patterns and their
underlying causes. Large-scale analyses of morphological
changes and diversification rates of terrestrial organisms
lag considerably behind analyses of comparable magni
tude in marine organisms. Conspicuously absent from the
literature is a study of disparity and diversification rates
over time for Palaeozoic tetrapods. The early diversifica
tion of tetrapods from the Late Devonian onwards
coincides with the emergence of a new body plan and
the colonization of terrestrial habitats. Moreover, Palaeo
zoic tetrapods underwent two subsequent episodes of
major diversification: a stem-lissamphibian radiation
within the aquatic habitats occupied by basal tetrapods and a stem-amniote radiation marking the first expansion into fully terrestrial habitats. Thus, we have reasons to
expect high rates of morphological change not only early in
tetrapod evolution, but also later in the clade's history
(Simpson 1944; Valentine 1978, 1980; Valentine St Erwin
1987; Gould 1989). There are further theoretical and practical reasons for
investigating rates of morphological change among Palaeo
zoic tetrapods. First, empirical evidence suggests that the
* Authors for correspondence on cladistic analysis (m.ruta@bristol. ac.uk; [email protected]). ** Author for correspondence on rates analysis (pwagner@ fieldmuseum.org). ''"Current address: Department of Earth Sciences, University of
Bristol, Wills Memorial Building, Queen's Road, Bristol, BS8 1RJ, UK.
morphological variation among limb characters was unu
sually high very early in tetrapod history (Coates St Clack
1990; Coates et al 2002; Shubin et al 2004). Second,
although numerous studies of morphological diversification
(i.e. rates of change and ranges of morphological variation)
have focused on clade origins (e.g. Foote 1997), the association between terrestrialization and morphological
diversification has been explored in detail only for
arthropods (Stockmeyer Lofgren et al 2003). Many hypotheses predict that the colonization of new ecospace
induces high rates of morphological change followed by reduced rates of change as ecological partitioning becomes
more specific (e.g. Valentine 1980). Third, Ruta St Coates's
(2006) phylogenetic analyses of Palaeozoic tetrapods
provide both the morphological data and the phylogenetic framework for assessing rates of character change (e.g.
Briggs et al. 1992; Anstey & Pachut 1995; Wagner 1995a,b, 1997; Sidor St Hopson 1998; Smith St Lieberman 1999;
Cotton 2001). The latter issue is especially important because it allows us to test the statistical null hypothesis of
consistent rates across phylogeny, and thus to assess whether
over-attention to particular novelties (e.g. early tetrapod limb features) exaggerates depictions of overall morphologi cal change (e.g. Wills et al. 1994).
Finally, two aspects of tetrapod diversification allow us to
contrast predictions of intrinsic constraint (i.e. develop mental or genetic) or ecological restriction (i.e. filling of
general ecospace) models for reducing rates of morphologi cal change. First, Ruta St Coates's (2006) results suggest that post-Devonian tetrapods evolved from a single Late
Devonian/Early Carboniferous taxon. This phylogenetic
Received 30 March 2006 2107 ? 2006 The Royal Society Accepted 5 April 2006
This content downloaded from 185.44.78.129 on Sun, 15 Jun 2014 23:50:36 PMAll use subject to JSTOR Terms and Conditions
2108 M. Ruta and others Evolutionary patterns in early tetrapods. I
'bottleneck' (sensu Jablonski 2002) yields a second radiation into similar (i.e. semi-aquatic) ecospace; thus, if ecology
alone is responsible for rates of morphological change, then we expect Early Carboniferous rates to mimic Devonian
rates; however, if intrinsic constraints accumulated in the
interim, then we do not. Second, the diversification of stem
and basal crown-amniotes in the Late Carboniferous
represents a second invasion into a new ecospace (i.e. fully
terrestrial environments). If ecological restrictions affect
rates of morphological change more strongly than intrinsic
constraints do, then we expect to see additional high rates of
change of tetrapod diversification. Conversely, if intrinsic constraints accumulated prior to this radiation, then we
might see increased disparity due to diversification, but no
increase in rates.
2. MATERIAL AND METHODS (a) Tetrapod data
Our analyses use a dataset of 339 skeletal characters coded for
95 species of Palaeozoic tetrapods (19 stem-tetrapods; 51
stem-amniotes; 3 crown-amniotes; 22 stem-lissamphibians).
They are grouped by age as follows: 6 Middle-Late
Devonian; 19 Lower Carboniferous; 31 Upper Carbonifer
ous; 6 Upper Carboniferous and/or Lower Permian (this
category includes taxa with either extended stratigraphie
range or uncertain stratigraphie position); 30 Lower Permian;
3 Upper Permian.
The present study excludes early fish-like members of the
tetrapod total group (see Ruta et al. 2003; Laurin St Anderson
2004) because they are ecologically and structurally different
from limbed members which form the focus of our
investigation. We also exclude Stereospondyli, a large
monophyletic radiation of (mostly) Upper Permian and
Lower Triassic temnospondyls (Schoch St Milner 2000;
Stayton & Ruta 2006). Again, because our primary focus is
on contrasting the initial diversification of Palaeozoic
tetrapod diversity with subsequent diversifications, exclusion
of stereospondyls should not affect our major conclusions. If
their eventual inclusion did affect our results then this
probably would reflect unusual features about stereospondyl
evolution rather than about Palaeozoic tetrapod evolution.
(b) Rates of character change
We assess frequencies of change using a model tree (Ruta St
Coates 2006), obtained from a maximum parsimony analysis
in PAUP* v. 4.0M0 (Swofford 2002). We treated all characters as equally informative and assumed unordered
evolution among states. The analysis produced 324 shortest
trees (1584 steps; Consistency Index = 0.22; Retention
Index=0.67; Rescaled Consistency Index=0.15). We present
results based exclusively upon the first tree output by PAUP*,
but identical results are obtained when other trees are used.
Minimum steps parsimony assumes that character change is
equally probable on all tree branches (Edwards & Cavalli
Sforza 1964). This will bias our results only if there is a
temporal trend towards declining preservation rates, such
that (say) Pennsylvanian and Permian branches span more
evolution than do Devonian and Mississippian branches: if
so, then the null hypothesis is that there should be a higher
probability of change on Pennsylvanian and Permian
branches than on Devonian and Mississippian branches
rather than equal probabilities as assumed by parsimony.
Fortunately, studies (e.g. Smith et ah 1992; Sidor St Hopson
unit
*_ =
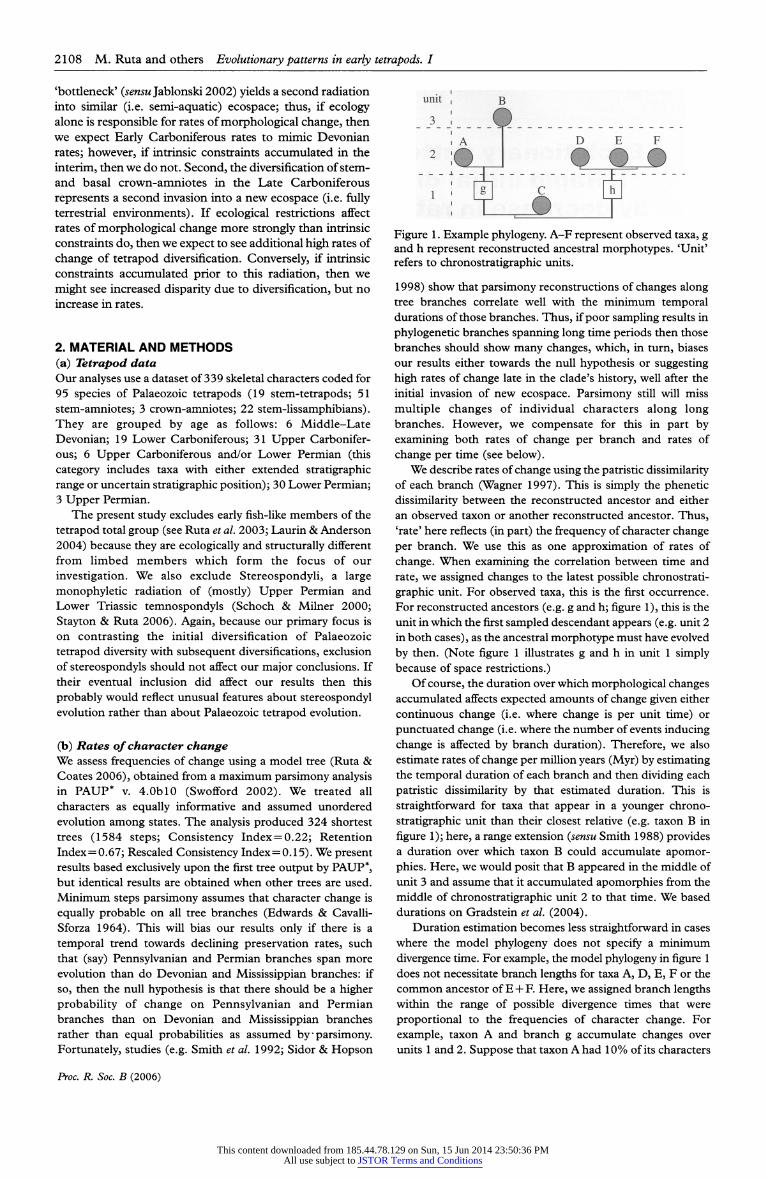
Figure 1. Example phylogeny. A-F represent observed taxa, g
and h represent reconstructed ancestral morphotypes. 'Unit'
refers to chronostratigraphic units.
1998) show that parsimony reconstructions of changes along
tree branches correlate well with the minimum temporal
durations of those branches. Thus, if poor sampling results in
phylogenetic branches spanning long time periods then those
branches should show many changes, which, in turn, biases
our results either towards the null hypothesis or suggesting
high rates of change late in the clade's history, well after the
initial invasion of new ecospace. Parsimony still will miss
multiple changes of individual characters along long
branches. However, we compensate for this in part by
examining both rates of change per branch and rates of
change per time (see below).
We describe rates of change using the patristic dissimilarity
of each branch (Wagner 1997). This is simply the phenetic dissimilarity between the reconstructed ancestor and either
an observed taxon or another reconstructed ancestor. Thus,
'rate' here reflects (in part) the frequency of character change
per branch. We use this as one approximation of rates of
change. When examining the correlation between time and
rate, we assigned changes to the latest possible chronostrati
graphic unit. For observed taxa, this is the first occurrence.
For reconstructed ancestors (e.g. g and h; figure 1), this is the
unit in which the first sampled descendant appears (e.g. unit 2
in both cases), as the ancestral morphotype must have evolved
by then. (Note figure 1 illustrates g and h in unit 1 simply because of space restrictions.)
Of course, the duration over which morphological changes
accumulated affects expected amounts of change given either
continuous change (i.e. where change is per unit time) or
punctuated change (i.e. where the number of events inducing
change is affected by branch duration). Therefore, we also
estimate rates of change per million years (Myr) by estimating
the temporal duration of each branch and then dividing each
patristic dissimilarity by that estimated duration. This is
straightforward for taxa that appear in a younger chrono
stratigraphic unit than their closest relative (e.g. taxon B in
figure 1); here, a range extension (sensu Smith 1988) provides
a duration over which taxon B could accumulate apomor
phies. Here, we would posit that B appeared in the middle of
unit 3 and assume that it accumulated apomorphies from the
middle of chronostratigraphic unit 2 to that time. We based
durations on Gradstein et al. (2004).
Duration estimation becomes less straightforward in cases
where the model phylogeny does not specify a minimum
divergence time. For example, the model phylogeny in figure 1
does not necessitate branch lengths for taxa A, D, E, F or the
common ancestor of E + F. Here, we assigned branch lengths
within the range of possible divergence times that were
proportional to the frequencies of character change. For
example, taxon A and branch g accumulate changes over
units 1 and 2. Suppose that taxon A had 10% of its characters
Proc. R. Soc. B (2006)
This content downloaded from 185.44.78.129 on Sun, 15 Jun 2014 23:50:36 PMAll use subject to JSTOR Terms and Conditions
Evolutionary patterns in early tetrapods. I M. Ruta and others 2109
-400 -375 -350 -325 -300 -275 -250
Myr
-400 -375 -350 -325 -300 -275 -250
Myr
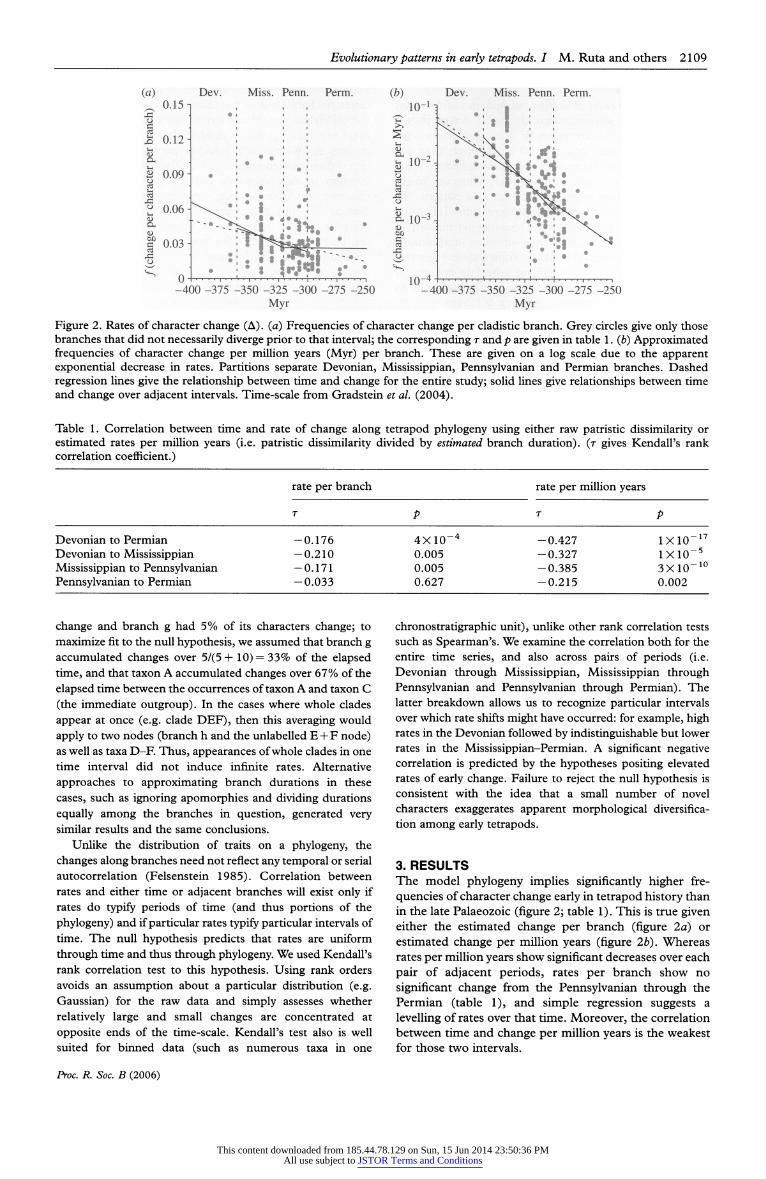
Figure 2. Rates of character change (A), (a) Frequencies of character change per cladistic branch. Grey circles give only those
branches that did not necessarily diverge prior to that interval; the corresponding r and p are given in table 1. (b) Approximated
frequencies of character change per million years (Myr) per branch. These are given on a log scale due to the apparent
exponential decrease in rates. Partitions separate Devonian, Mississippian, Pennsylvanian and Permian branches. Dashed
regression lines give the relationship between time and change for the entire study; solid lines give relationships between time
and change over adjacent intervals. Time-scale from Gradstein et ah (2004).
Table 1. Correlation between time and rate of change along tetrapod phylogeny using either raw patristic dissimilarity or
estimated rates per million years (i.e. patristic dissimilarity divided by estimated branch duration), (r gives Kendall's rank
correlation coefficient.)
rate per branch rate per million years
Devonian to Permian
Devonian to Mississippian
Mississippian to Pennsylvanian
Pennsylvanian to Permian
-0.176
-0.210
-0.171
-0.033
4X10"
0.005
0.005
0.627
-0.427
-0.327
-0.385
-0.215
1X10 1X10 3X10 0.002
-17
-5
-10
change and branch g had 5% of its characters change; to
maximize fit to the null hypothesis, we assumed that branch g
accumulated changes over 5/(5+ 10) = 33% of the elapsed
time, and that taxon A accumulated changes over 67% of the
elapsed time between the occurrences of taxon A and taxon C
(the immediate outgroup). In the cases where whole clades
appear at once (e.g. clade DEF), then this averaging would
apply to two nodes (branch h and the unlabelled E + F node) as well as taxa D-F. Thus, appearances of whole clades in one
time interval did not induce infinite rates. Alternative
approaches to approximating branch durations in these
cases, such as ignoring apomorphies and dividing durations
equally among the branches in question, generated very
similar results and the same conclusions.
Unlike the distribution of traits on a phylogeny, the
changes along branches need not reflect any temporal or serial
autocorrelation (Felsenstein 1985). Correlation between
rates and either time or adjacent branches will exist only if
rates do typify periods of time (and thus portions of the
phylogeny) and if particular rates typify particular intervals of
time. The null hypothesis predicts that rates are uniform
through time and thus through phylogeny. We used Kendall's
rank correlation test to this hypothesis. Using rank orders
avoids an assumption about a particular distribution (e.g.
Gaussian) for the raw data and simply assesses whether
relatively large and small changes are concentrated at
opposite ends of the time-scale. Kendall's test also is well
suited for binned data (such as numerous taxa in one
chronostratigraphic unit), unlike other rank correlation tests
such as Spearman's. We examine the correlation both for the
entire time series, and also across pairs of periods (i.e.
Devonian through Mississippian, Mississippian through
Pennsylvanian and Pennsylvanian through Permian). The
latter breakdown allows us to recognize particular intervals
over which rate shifts might have occurred: for example, high
rates in the Devonian followed by indistinguishable but lower
rates in the Mississippian-Permian. A significant negative
correlation is predicted by the hypotheses positing elevated
rates of early change. Failure to reject the null hypothesis is
consistent with the idea that a small number of novel
characters exaggerates apparent morphological diversifica
tion among early tetrapods.
3. RESULTS The model phylogeny implies significantly higher fre
quencies of character change early in tetrapod history than
in the late Palaeozoic (figure 2; table 1). This is true given either the estimated change per branch (figure 2a) or
estimated change per million years (figure 2b). Whereas rates per million years show significant decreases over each
pair of adjacent periods, rates per branch show no
significant change from the Pennsylvanian through the Permian (table 1), and simple regression suggests a
levelling of rates over that time. Moreover, the correlation
between time and change per million years is the weakest
for those two intervals.
Proc. R. Soc. B (2006)
This content downloaded from 185.44.78.129 on Sun, 15 Jun 2014 23:50:36 PMAll use subject to JSTOR Terms and Conditions
2110 M. Ruta and others Evolutionary patterns in early tetrapods. I
4. DISCUSSION Our estimates of rates of change per million years suggest
that rates were approximately 10 times lower in the
Permian than in the Devonian. If one reconstructed the
phylogeny with basal branches 10 times longer than our
analyses reconstruct them, then the difference between the
Devonian and Permian would dissipate. Thus, one might
wonder if sampling might account for this pattern. We
consider this unlikely for the following reasons. Terrestrial
ecosystems prior to the Middle Devonian are unlikely to
be conducive to the existence of even amphibious
vertebrates. Moreover, the earliest known closest relatives
of tetrapods among 'osteolepiform fishes' do not appear
until the late Early Devonian, i.e. about 20 Myr prior to
the earliest limbed tetrapods (Ahlberg St Johanson 1998; Zhu St Ahlberg 2004). Because 'osteolepiforms' are
paraphyletic relative to tetrapods, positing an earlier origin
of the latter necessarily implies earlier origins for
numerous other taxa in the marine realm. Finally,
asserting additional tens of millions of years over which Devonian taxa might have evolved does nothing to explain
the significant decrease in rates after the Devonian.
One might worry that including only the best-known
Devonian tetrapods distorts apparent rates. However,
fragmentary remains allow only a few characters to be
compared, and the few differences used to recognize
distinct taxa yield large pairwise dissimilarities. Thus, their
inclusion probably would exaggerate the patterns illus
trated here. Ultimately, one must invoke a 'special
pleading' model in which the fossil record somehow
selectively preserved outliers of Devonian tetrapod
morphospace to attribute either the rate or disparity
pattern to geological rather than biological factors.
Two fairly different rate metrics lead to almost identical
conclusions. Alternative approaches (not discussed here)
also yield almost identical conclusions. Thus, it is difficult to dismiss decreasing rates over time to methodological
artefacts. The one finding that one might call into question
is that rates of change per million years decreased from the
Pennsylvanian through the Permian. Reconstructed line
age durations over which change might have occurred are
not randomly distributed through time, with the longest
durations occurring among Permian taxa (r =
0.392; p =
10-14); however, the late appearing taxa necessarily are
the ones with the longest possible range extensions, and
error in phylogenetic reconstruction tends to exaggerate
reconstructed ranges (Wagner 2000). Moreover, because
we used parsimony optimizations, we could not account
for multiple changes per individual character (Felsenstein
1973). Thus, this particular method probably is biased
towards underestimating rates among the latest appearing
taxa.
In the absence of geological or methodological
explanations, we require biological explanations. Workers
have offered two general non-exclusive hypotheses for
accelerated morphological evolution: (i) reduced intrinsic
constraints (e.g. developmental or phylogenetic) and (ii) reduced ecological restrictions (Valentine 1969, 1980).
The initial burst of morphological diversification could
easily represent 'relaxation' in both types of constraints.
The decrease of rates in Mississippian suggests increased
intrinsic constraints: if there was a phylogenetic
bottleneck, then ecospace should have been nearly as
available as it was in the Devonian. Moreover, the
Pennsylvanian-Permian radiation of amniotes into fully
terrestrial habitats does not induce an increase in rates, as
the ecological restrictions hypothesis predicts. Note that there are many possible mechanisms for intrinsic con
straints (see Wagner 2001), and future work might be able to test these models against one another. Moreover, even if
invasion of new ecospace did not accelerate rates of
character evolution among early amniotes, we cannot
dismiss the idea that increasing ecological restrictions
played a role in tetrapod evolution. In particular, the
continued decrease of rates from the Mississippian into
the Pennsylvanian is consistent with ecological restrictions
playing some role in slowing rates of character change.
5. CONCLUSIONS Tetrapods display decreasing rates of anatomical change over time. Although this pattern has been documented for
marine taxa, this is the first time that it has been
documented for terrestrial vertebrates. It is difficult to contrive a scenario in which the rate pattern is an artefact
of poor sampling of the earliest tetrapods. The observed
patterns are consistent with ideas about low intrinsic/
extrinsic constraints early in the history of a major clade.
Future studies on increasing constraints on particular
aspects of the skeletal system might generate testable
predictions for developmental and functional biologists to test.
This work was funded by a John Caldwell Meeker Research
Fellowship (Department of Geology, Field Museum of Natural History, Chicago) (M.R.), NSF grant EAR
0207874 (PJ.W.) and the Faculty Research Fund, Pritzker School of Medicine, University of Chicago (M.I.C.). Comments from D. McShea and S. K. Lyons helped clarify the focus of this paper. M. Benton provided additional useful
comments.
REFERENCES Ahlberg, P. E. St Johanson, Z. 1998 Osteolepiforms and the
ancestry of tetrapods. Nature 395, 792-794.
Anstey, R. L. St Pachut, J. F. 1995 Phylogeny, diversity history and speciation in Paleozoic bryozoans. In New approaches to studying speciation in the fossil record (?d. D. H. Erwin &
R. L. Anstey), pp. 239-284. New York, NY: Columbia
University Press.
Briggs, D. E. G., Fortey, R. A. St Wills, M. A. 1992
Morphological disparity in the Cambrian. Science 256,
1670-1673.
Coates, M. I. St Clack, J. A. 1990 Polydactyly in the earliest
known tetrapod limbs. Nature 347, 66-69. (doi: 10.1038/
347066a0) Coates, M. I., Jeffery, J. E. & Ruta, M. 2002 Fins to limbs:
what the fossils say. Evol. Dev. 4, 390-401. (doi: 10.1046/
J.1525-142X.2002.02026.x)
Cotton, T. J. 2001 The phylogeny and systematics of blind
Cambrian ptychoparoid trilobites. Palaeontology 44,
167-207. (doi:10.1111/1475-4983.00176) Edwards, A. W F. St Cavalli-Sforza, L. L. 1964 Reconstruc
tion of evolutionary trees. In Phenetic and phylogenetic
classification (ed. J. H. Heywood & J. McNeil), pp. 67-76.
London, UK: Systematic Association.
Felsenstein, J. 1973 Maximum-likelihood and minimum
steps methods for estimating evolutionary trees from data
on discrete characters. Syst. Zooh 22, 240-249.
Felsenstein, J. 1985 Phylogenies and the comparative
method. Am. Nat. 125, 1-15. (doi: 10.1086/284325)
Proc. R. Soc. B (2006)
This content downloaded from 185.44.78.129 on Sun, 15 Jun 2014 23:50:36 PMAll use subject to JSTOR Terms and Conditions
Evolutionary patterns in early tetrapods. I M. Ruta and others 2111
Foote, M. 1997 The evolution of morphologic diversity.
Annu. Rev. Ecol. Evol. 28, 129-152. (doi:10.1146/annurev.
ecolsys.28.1.129)
Gould, S. J. 1989 Wonderful life. New York, NY: W. W.
Norton.
Gradstein, F., Ogg, J. & Smith, A. 2004 A geologic time scale
2004. Cambridge, UK: Cambridge University Press.
Jablonski, D. 2002 Survival without recovery after mass
extinctions. Proc. Nati Acad. Sei. USA 99, 8139-8144.
(doi: 10.1073/pnas. 102163299) Laurin, M. St Anderson, J. S. 2004 Meaning of the name
Tetr?poda in the scientific literature. Syst. Biol. 53, 68-80.
(doi:10.1080/10635150490264716) Ruta, M. & Coates, M. I. 2006 Dates, nodes, and character
conflict: addressing the amphibian origin problem. J. Syst. Paleontol. 4.
Ruta, M., Coates, M. I. & Quicke, D. L. J. 2003 Early
tetrapod relationships revisited. Biol. Rev. 78, 251-345.
(doi:10.1017/S1464793102006103) Schoch, R. R. St Milner, A. R. 2000 Handbuch der
Pal?oherpetologie: Teil 3B, Stereospondyli. Munich, Germany: Pfeil.
Shubin, N. H., Daeschler, E. B. & Coates, M. I. 2004 The
early evolution of the tetrapod hum?rus. Science 304,
90-93. (doi: 10.1126/science. 1094295) Sidor, C. A. & Hopson, J. A. 1998 Ghost lineages and
"mammalness": assessing the temporal pattern of char
acter acquisition in the Synapsida. Paleobiology 24, 254-273.
Simpson, G. G 1944 Tempo and mode in evolution. New York, NY: Columbia University Press.
Smith, A. B. 1988 Patterns of diversification and extinction in
early Palaeozoic echinoderms. Palaeontology 31, 799-828.
Smith, L. H. St Lieberman, B. S. 1999 Disparity and
constraint in olenelloid trilobites and the Cambrian
radiation. Paleobiology 25, 459-470.
Smith, A. B., Lafay, B. St Christen, R. 1992 Comparative variation of morphological and molecular evolution
through geologic time: 28S ribosomal RNA versus
morphology in echinoids. Phil. Trans. R. Soc. B 338, 365-382.
Stayton, C. T. & Ruta, M. 2006 Geometric morphometrics of
the skull roof of stereospondyls (Amphibia: Temnospon
dyli). Palaeontology 49, 307-337. (doirlO.l 11 l/j.1475 4983.2006.00523.x)
Stockmeyer Lofgren, A., Plotnick, R. E. St Wagner, P. J. 2003
Morphological diversity of Carboniferous arthropods and
insights on disparity patterns of the Phanerozoic. Paleo
biology 29, 350-369.
Swofford, D. L. 2002 PAUP*: phylogenetic analysis using
parsimony C and other methods) version 4.0b 10. Sunder
land, MA: Sinauer Associates.
Valentine, J. W. 1969 Patterns of taxonomic and ecological structure of the shelf benthos during Phanerozoic time.
Palaeontology 12, 684-709.
Valentine, J. W. 1978 The evolution of multicellular plants and animals. Sei. Am. 239, 140-158.
Valentine, J. W. 1980 Determinants of diversity in higher taxonomic categories. Paleobiology 6, 444-450.
Valentine, J. W. St Erwin, D. H. 1987 Interpreting great
developmental experiments: the fossil record. In Develop ment as an evolutionary process (?d. R. A. Raff& E. C. Raff),
pp. 71-107. New York, NY: Liss Press.
Wagner, P. J. 1995a Systematics and the fossil record?a
review. Palaios 10, 383-388.
Wagner, P. J. 19956 Testing evolutionary constraint hypoth eses with early Paleozoic gastropods. Paleobiology 21, 248-272.
Wagner, P. J. 1997 Patterns of morphologic diversification
among the Rostroconchia. Paleobiology 23, 115-150.
Wagner, P. J. 2000 The quality of the fossil record and the
accuracy of phylogenetic inferences about sampling and
diversity. Syst. Biol. 49, 65-86. (doi:10.1080/106351500
50207393) Wagner, P. J. 2001 Constraints on the evolution of form. In
Palaeobiology II (ed. D. E. G. Briggs & P. R. Crowther),
pp. 154-159. Oxford, UK: Blackwell.
Wills, M. A., Briggs, D. E. G. & Fortey, R. A. 1994 Disparity as an evolutionary index: a comparison of Cambrian and
Recent arthropods. Paleobiology 20, 93-131.
Zhu, M. & Ahlberg, P. E. 2004 The origin of the internal
nostril of tetrapods. Nature 432, 94-97.
Proc. R. Soc. B (2006)
This content downloaded from 185.44.78.129 on Sun, 15 Jun 2014 23:50:36 PMAll use subject to JSTOR Terms and Conditions