evolution of human diversity• the 3a4 allele is more frequent in african populations...
TRANSCRIPT

Evolution of human diversity
Genetics of human uniqueness
1

Human and chimp genome
2
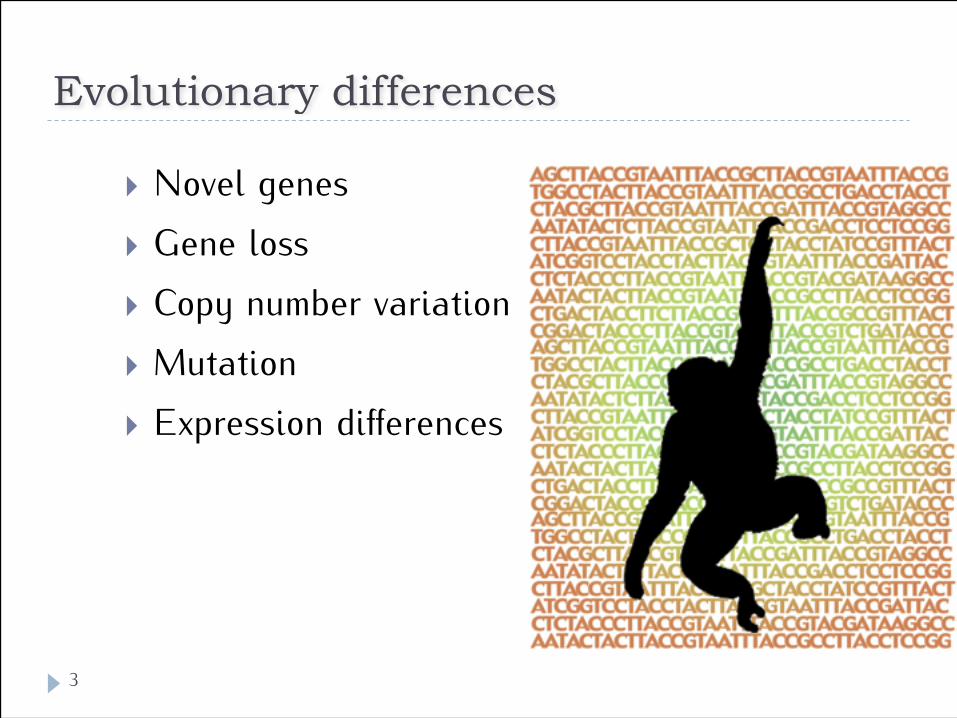
Evolutionary differences
} Novel genes } Gene loss } Copy number variation } Mutation } Expression differences
3

Human and chimp gene repertoire
4
} Most human genes present in chimp and vice versa } Some genes lost in humans (e.g. many olfactory
receptors), rare gene gain (Morpheus – unknown function, miR-941 - miRNA)
} Human/chimp differences are not due to the presence or absence of a single “humanity gene”

Sequence variation
} 1.6% nucleotide differences: } 35 mln substitutions } 5 mln deletions, insertions, duplications
5

Protein sequence differences} An average human protein differs from chimpanzee by 2
amino acids
} 29% proteins identical
6

Gene differences - how to study
} Mutations accumulate since the split of lineages
} Looking for genes where the rate of evolution in one lineage is significantly different (violating the molecular clock)
} Looking for traces of positive selection (deviations in Ka/Ks (ω); McDonald-Kreitman test, likelihood models)
7

The fundamental question of molecular evolution
8
} What is the contribution of drift and selection to sequence diversity } population (polymorphisms) } species
} This is about quantitative differences! } Adaptations are always a result of selection!

Selection or drift?
9
} Selectionism } most fixed mutations were selected for } most polymorphisms maintained by selection
} balancing selection, overdominance, frequency-dependent selection
} Neutralism (Kimura, 1968) } most fixed mutations are a result of drift } most polymorphisms are a result of drift } selected mutations are rare, do not affect the quantitative
analysis of diversity
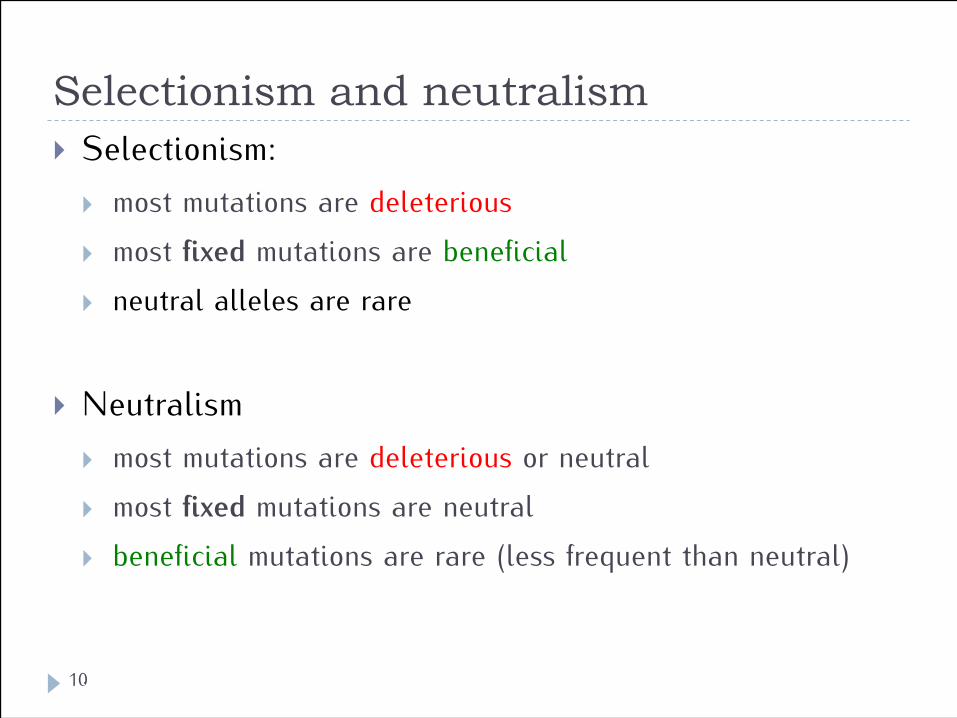
Selectionism and neutralism
10
} Selectionism: } most mutations are deleterious } most fixed mutations are beneficial } neutral alleles are rare
} Neutralism } most mutations are deleterious or neutral } most fixed mutations are neutral } beneficial mutations are rare (less frequent than neutral)

Gene differences
} In ~ 500-600 genes – significant deviations in evolutionary rates - accelerated substitutions in human lineage
} ~ 200 noncoding Human Accelerated Regions (HARs) – often regulatory
11

The speech gene
Verbal dyspraxia:
Rare disorder - affected individuals incapable of speech, anatomy of larynx and vocal cords is normal
Gene: FOXP212

FOXP2 – rapid evolution
Enard et al. (2002) Nature 418, 869-7213

Not just in humans} FOXP2 expression levels correlate with the
complexity of vocalizations in birds } FOXP2 mutations affect vocal communication
in mice
14

MYH16
} One of the myosin heavy chains
} Mutation ~ 2.5 MYA – evolution of skull (weaker facial skeleton, allowing for the larger neurocranium)
15

Microcephalin
Affected 13 years Normal 11 years
Accelerated evolution in human lineage
Microcephaly
Kouprina et al., PLoS Biology, 2004, 5:E126
16

Regulatory sequences
} HACNS1 enhancer (Human Accelerated Conserved Noncoding Sequence 1) } 546bp sequence conserved in terrestrial vertebrates } 16 human-chimp differences (vs. 4 expected under neutral model,
p=1,3×10⁻⁶)
Prabhakar et al., 2008, Science 321:1346-5017

HACNS1 function} Reporter gene controlled by human, chimp and rhesus HACNS1
● Only human HACNS1 expressed in developing limbs
● 13 of 16 human-specific nucleotides are responsible
● Human-specific hand morphology (opposable thumbs) – Homo faber
● Human-specific foot morphology (short toes, inflexible) - bipedality
Prabhakar et al., 2008, Science 321:1346-5018

miR-941
19

miR-941
20
} A human-specific miRNA gene } one of about 10 such miRNAs } the only one with strong expression in CNS
} Appeared between 6-7 and 1 million years ago } found in Denisovians, but not chimps
} Variable copy number in humans (2-11) } decreasing copy number after migration from
Africa
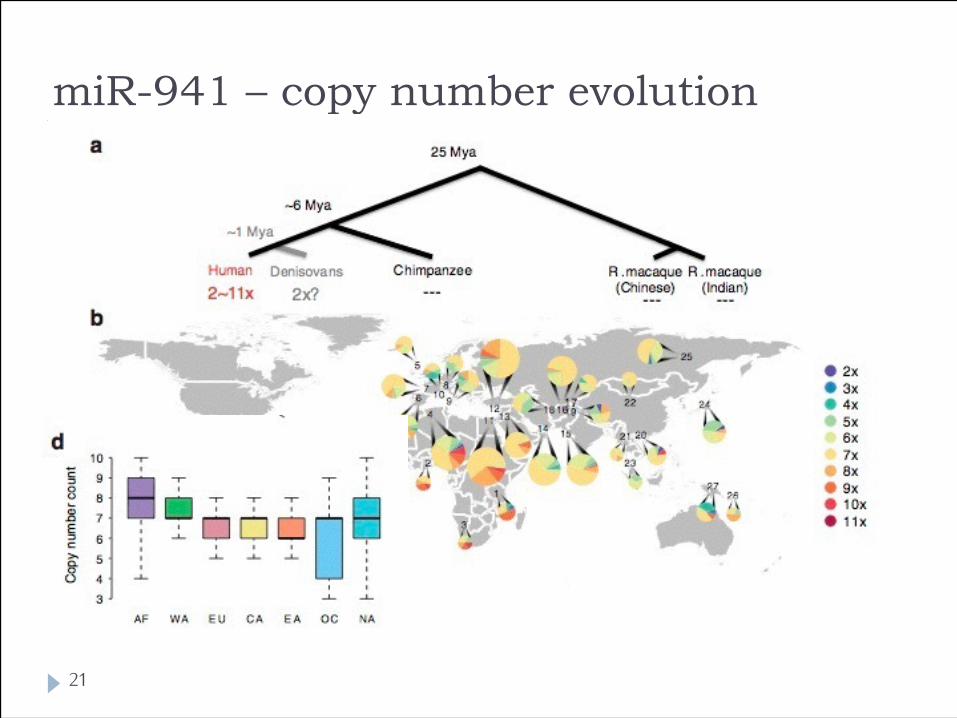
miR-941 – copy number evolution
21

miR-941 - function
22
} downregulation of the hedgehog and insulin pathways
} could influence lifespan

Summary} There is no single “humanity gene” } The differences between humans and other primates are
a result of many small differences in hundreds of genes } A small sequence difference could have a strong
phenotypic effect } Regulatory differences - hard to compare expression
between species
23

Human population variability
Medical consequences - polymorphisms and associations
24

Human genetic variability
} Sequence differences (genes, noncoding regions)
} Copy number variation
25
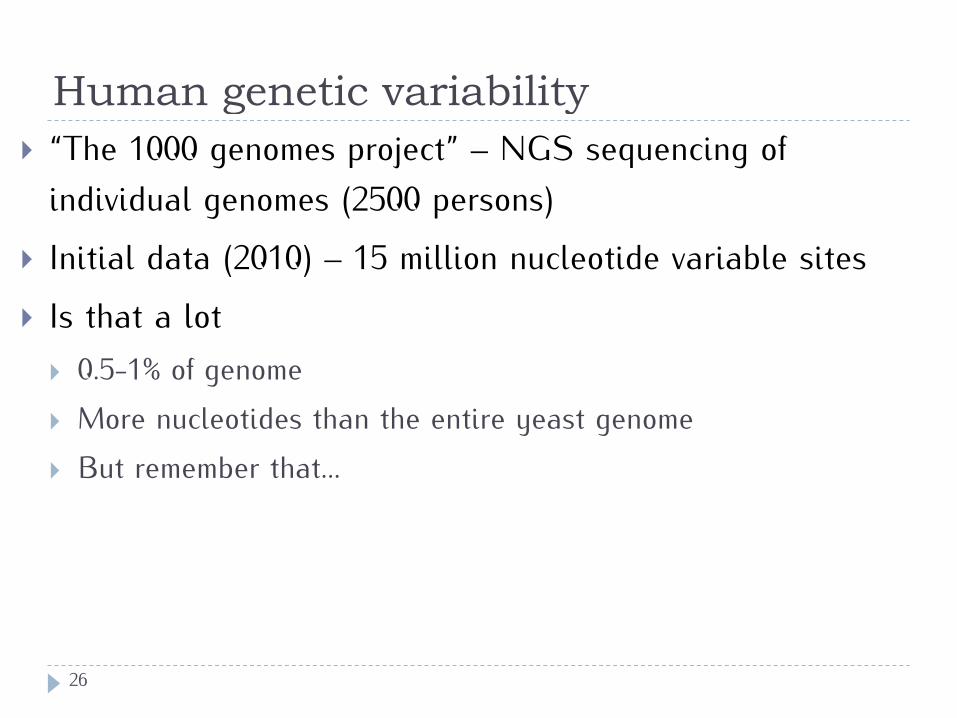
Human genetic variability} “The 1000 genomes project” – NGS sequencing of
individual genomes (2500 persons) } Initial data (2010) – 15 million nucleotide variable sites } Is that a lot
} 0.5-1% of genome } More nucleotides than the entire yeast genome } But remember that...
26
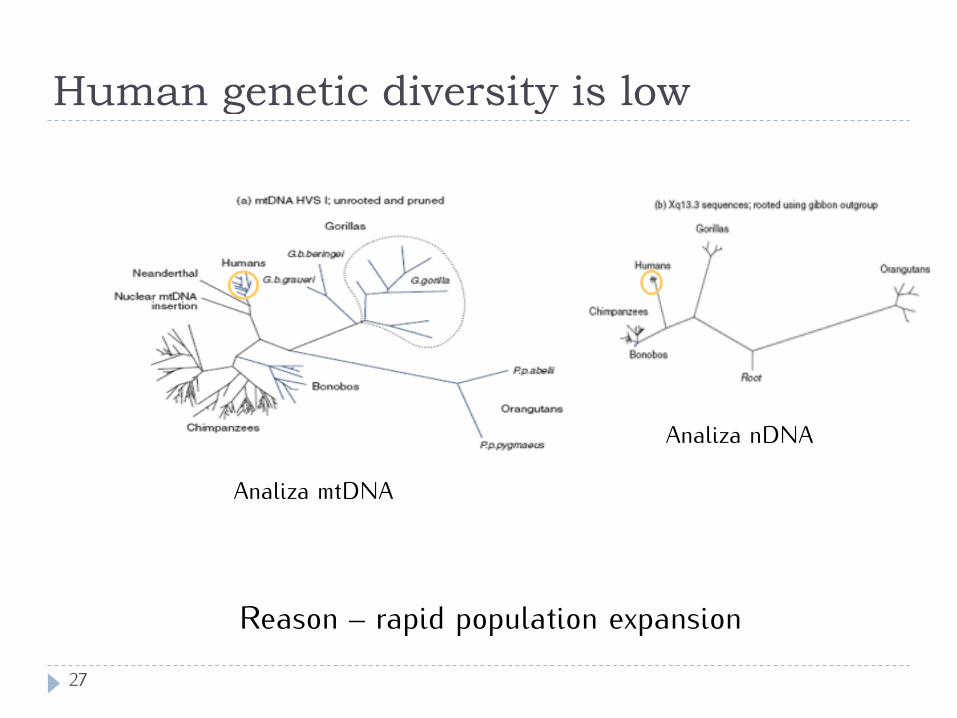
Human genetic diversity is low
Reason – rapid population expansion
Analiza mtDNA
Analiza nDNA
27
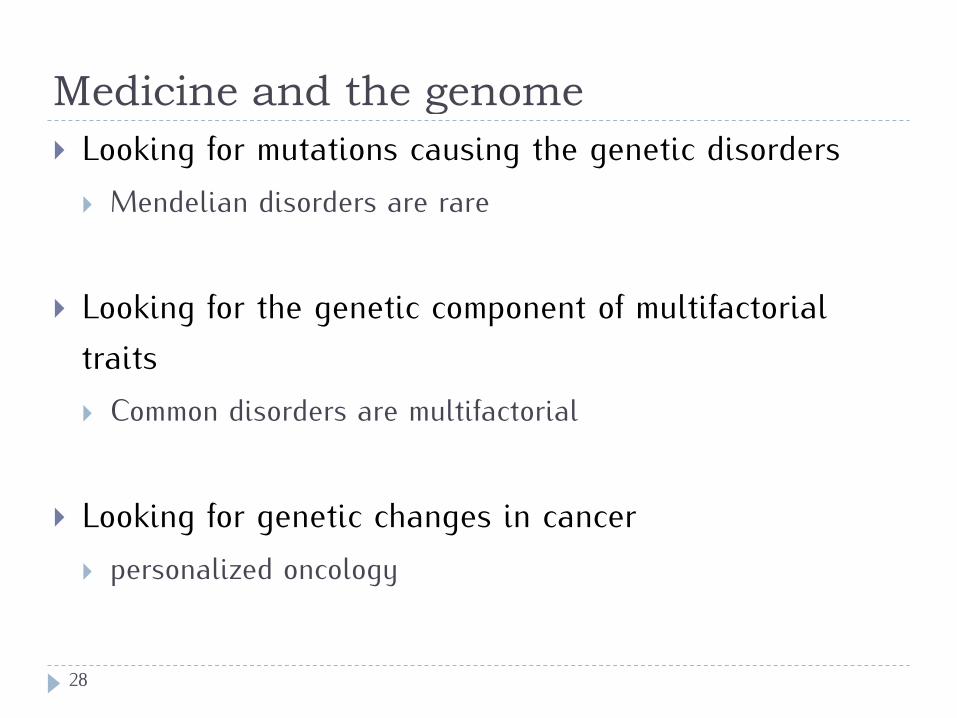
Medicine and the genome} Looking for mutations causing the genetic disorders
} Mendelian disorders are rare
} Looking for the genetic component of multifactorial traits } Common disorders are multifactorial
} Looking for genetic changes in cancer } personalized oncology
28

Multifactorial traits
29

Mendelian and multifactorial traits
30
Mendelian Multifactorial
Simple genetics: single gene mutations, high penetrance
Complex genetics: many contributing factors, each of them with a low penetrance
Mutation causes the disease Gene polymorphisms influence risk (increase or decrease)
Studied using: parametric linkage analysis, sequencing
Studied using: multiple statistical methods, mostly nonparametric
Rare disorders Many common disorders and traits

Heritability
31
} Each phenotype is the product of the interaction between genotype and environment
} Heritability: the proportion of phenotypic variation due to genotypic variation } twin studies
} Monozygotic (MZ) vs. dizygotic (DZ)
} adoption studies } familial aggregation
} are the 1st degree relatives affected more often than nonrelated individuals?
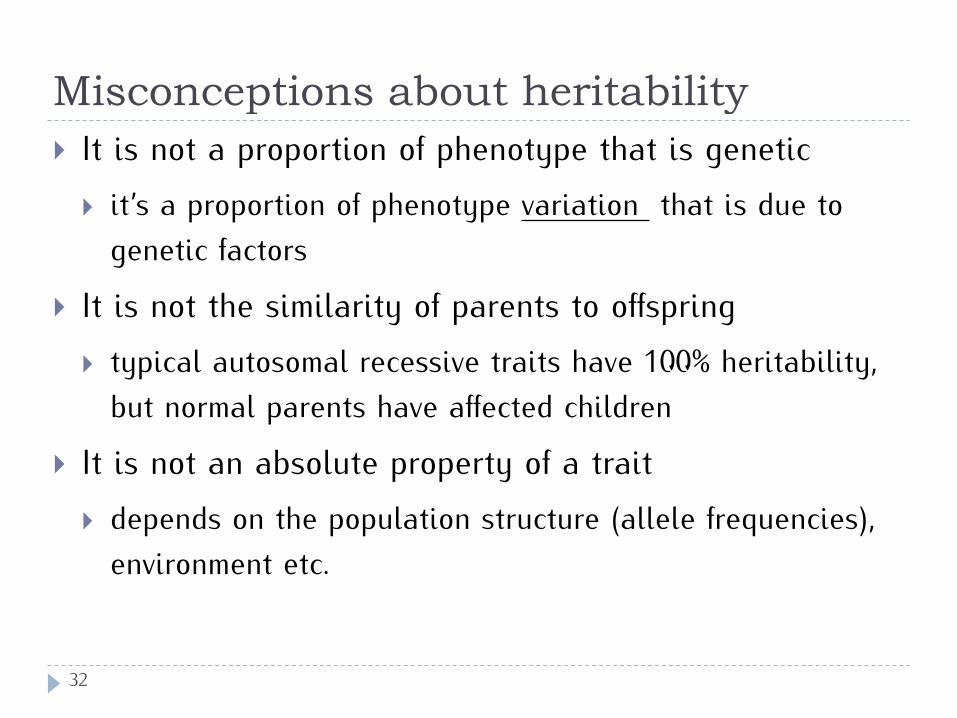
Misconceptions about heritability
32
} It is not a proportion of phenotype that is genetic } it’s a proportion of phenotype variation that is due to
genetic factors
} It is not the similarity of parents to offspring } typical autosomal recessive traits have 100% heritability,
but normal parents have affected children
} It is not an absolute property of a trait } depends on the population structure (allele frequencies),
environment etc.

Familial aggregation
33
} Affective disorders (mood disorders) } unipolar (depression) } bipolar (manic-depressive disorder)
} Unipolar } population risk ~3 % (men) ~5-9% (women) } 1st degree relatives of an affected person – risk~10% } relatively low heritability
} Bipolar } population risk ~1% } 1st degree relatives of an affected person – risk ~ 20% } significant heritability

Familial aggregation
34

Familial aggregation
35
λS = population risk
risk for 1st degree relatives of affected individuals
E.g.
population 0.8
1st degree relatives 8.5
λS = 10,6
λS – recurrence risk ratio
Familial aggregation
36
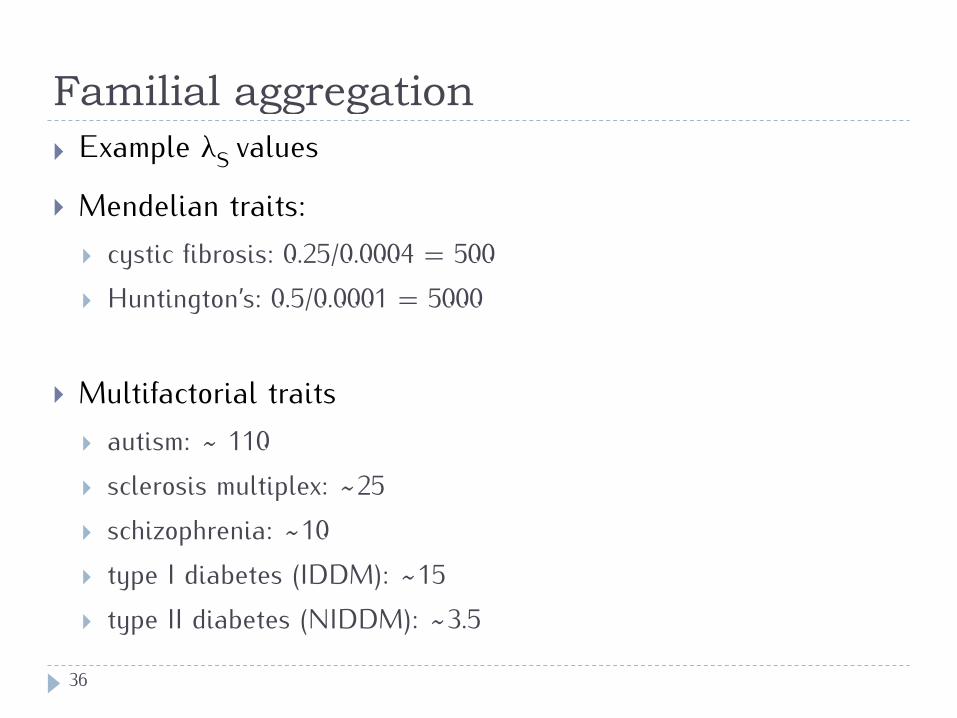
} Example λS values
} Mendelian traits: } cystic fibrosis: 0.25/0.0004 = 500 } Huntington’s: 0.5/0.0001 = 5000
} Multifactorial traits } autism: ~ 110 } sclerosis multiplex: ~25 } schizophrenia: ~10 } type I diabetes (IDDM): ~15 } type II diabetes (NIDDM): ~3.5

Association
} Nonrandom correlation of alleles and phenotypes in a population
} Is it always a causal relationship? } Does it always have a diagnostic/predictive value? } Does it reveal “genes for ....”?

Associations can be misleading
} the 3A4 allele of cytochrome P450 (CYP3A) and prostate cancer (worse prognosis, more advanced at diagnosis)
} CYP3A can influence the rate of testosterone hydroxylation - a causal relationship?
• The 3A4 allele does not influence testosterone metabolic rates • The 3A4 allele is more frequent in African populations (African-
American), than Eurasian • Similar correlations were observed for other alleles that are more
frequent in Africans • Worse prognosis of prostate cancer in African-Americans (socio-
economical causes - health care quality dependent on income)?
38

Association} Functional dependence
} often involving MHC (HLA) alleles - immune function, autoimmune disorders
} looking for associations for common SNP alleles } pharmacogenetics and pharmacogenomics – polymorphisms
and drugs } CRHR1 (corticotropin receptor) - response of asthma to
corticosteroid treatment } HLA-B27 - sensitivity to Abcavir side effects } HTR2A (serotonin 2A) - reaction to antidepressants
39

Ankylosing spondylitis
40

Strong association - example} HLA-B27 and autoimmune disease - ankylosing
spondylitis (90% of patients are positive)
Affected Healthy
HLA-B27 + 90 1000
HLA-B27 - 10 9000
Fisher exact test:
p≈2·10-76
41
Risk 8%
Risk 0.11%
Population risk ~1%

Genes for …?
42

In fact ...
43

For comparison} HLA-B27 and autoimmune disease - ankylosing
spondylitis
€
OR =
901000109000
= 81
44
Affected Healthy
HLA-B27 + 90 1000
HLA-B27 - 10 9000
Fisher exact test:
p≈2·10-76

Important!
45
} Association is not a “gene for...”! } Diagnostic value not certain, particularly for rare traits
} Could be useful in differential diagnosis
} Odds ratios are useless without a context of population risk

Causes of association
Need to study homogenous populations
Population structure (hidden variable)
Many artifacts
Simpson’s paradox: A trend that appears in different groups of data disappears when these groups are combined, and the reverse trend appears for the aggregate data
46

Simpson’ paradox
} A simplified example: the university should not discriminate against women applying for graduate studies
Mężczyźni KobietyHistory 1/5 (20%) 2/8 (25%)
Geography 6/8 (75%) 4/5 (80%)
Total 7/13 (54%) 6/13 (46%)
47

University of California, Berkeley, 1973
Dept. Men (admitted) Women (admitted)
A 825 62% 108 82% B 560 63% 25 68% C 325 37% 593 34% D 417 33% 375 35% E 191 28% 393 24% F 272 6% 341 7% Total 8442 44% 4321 35%
More women applied for more harder departments
Graduate school admissions
48

A medical exampleTwo therapies for kidney stones compared
Therapy A Therapy B
78 % (273/350) 83% (289/350)
But:
Therapy A Therapy BSmall stones 93% (81/87) 87% (234/270)
Large stones 73% (192/263) 69% (55/80)
Total 78 % (273/350) 83% (289/350)
Therapy A used more frequently for larger stones (more difficult to cure)
49

Double blind testing
50
} In drug and treatment studies } treatment vs. placebo; new treatment vs. old, etc.
} Neither patient, nor the physician should know, which group an individual is in

Genetic risk factors} GWAS – genome wide association studies } Correlating genetic variation with disease risk } Many correlations found, but no major causal agents } The missing heritability problem
51

Wellcome Trust study 2005-2007
52
} GWA – genome-wide association } 7 common multifactorial disorders, 17 000
participants (affected and healthy), 200 researchers, 9 million UK pounds
} One of several recent large GWA studies

The results of the Wellcome Trust study
53
} Bipolar disorder } Many correlations, none very significant
} Coronary heart disease } Several loci strongly influencing risk, one locus on chr. 9 by
50% in heterozygotes and twofold in homozygotes
} Crohn disease } Variants in 3 genes (RGM, NKX2-3 i PTPN2) increasing
risk and a new region containing 7 new genes

The results of the Wellcome Trust study
54
} Hypertension } No strong causation - many polymorphism with small
individual effects
} Rheumatoid arthritis } New risk factors found } correlation with heart disease and type I diabetes

The results of the Wellcome Trust study
55
} Type I diabetes } 4 new risk factors, including PTPN2 (Crohn disease) } At least 10 genes known
} Type II diabetes } Kilka nowych czynników ryzyka } FTO - indirect effect, obesity risk factor } CDKAL1, CDKN2A, IGF2BP2 - direct effect } Confirmed earlier known associations ~10 genes in total

Reproducibility of association studies
56

Missing heritability
57
} Many multifactorial traits show high heritability in twin and familial studies
} Genomic association studies show a slight increase in risk for any single polymorphism (e.g. any single polymorphism explains no more than 5% of differences in height)
} Heritability has to be explained by genetic interactions (epistatic)

Missing heritability} “dark matter” of the genome } known associations explain ~5% of heritability } possible explanations:
} other, rare variants } whole-genome sequencing, 1000 genome project
} genetic interactions } systems biology approach, interaction networks
} copy number variation
58

Copy number variation
59
} CNV is common and can include gene sequences } Associations found, e.g. with autism } Evolutionary studies
} e.g. higher copy number of amylase gene (AMY1) in populations of farming ancestry (high-starch diet) than hunter-gatherer ancestry (low-starch diet)

“One gene – one trait”?} Simpe one gene - one trait (Mendelian) relationship is rare } Most phenotypic traits are a result of interactions of many
genes (and environment) } Complex interaction networks – biological complexity is
built by evolution using combinatorics, not by increasing complexity of individual parts
60

Example - human height} Variation in least 150 loci influence
this, relatively simple trait
61

Perspectives
62
} Go beyond studying single loci
} Genome-wide studies on multiple loci

Analysis using 1000 SNPs in skin cancer
63

Evolutionary medicine
64