evolution and quality analysis algorithm of consumer
TRANSCRIPT

Research ArticleEvolution and Quality Analysis Algorithm of Consumer OnlineReviews Based on Data Fusion and Multiobjective Optimization
Hu Wang,1 Tianbao Liang ,1,2 and Yanxia Cheng 1
1School of Management, Wuhan University of Technology, Wuhan, 430070 Hubei, China2School of Management, Zhongkai University of Agriculture and Engineering, Guangzhou, 510225 Guangdong, China
Correspondence should be addressed to Tianbao Liang; [email protected]
Received 10 August 2021; Revised 17 September 2021; Accepted 15 October 2021; Published 2 November 2021
Academic Editor: Mu Zhou
Copyright © 2021 Hu Wang et al. This is an open access article distributed under the Creative Commons Attribution License,which permits unrestricted use, distribution, and reproduction in any medium, provided the original work is properly cited.
With the rise of network strategies, various businesses using the Internet as a platform have been vigorously developed, amongwhich the scale of e-commerce transactions has increased on a large scale. In order to deeply explore the role and advantagesof data fusion and multiobjective optimization technology in consumer online reviews, this paper uses the new and oldevaluation model comparison method, algorithm design method, and multiobject research method to collect samples, analyzethe technical model, and streamline the algorithm. And it will create an analysis algorithm model that can improve andoptimize the consumer’s current online reviews. First, we choose the electricity supplier on the platform of a total of fourmobile phones grabbed 32,145 comments. Based on this research on the number of online comment fields of consumers, theresults show that 78% of the comments are less than 55 words, indicating that most of the online comments left by consumersare short comments; at the same time, a small number of consumers have left detailed comments. Description, the longest of isreached 612 words. On this basis, further study the efficiency and function analysis of the algorithm proposed in this paper,and we can see that DCDG-MOMA is used in 14-7 and 28-7 use cases as 1 and 2, respectively, which is the least, and at 40-7and 50-7, the time used is 15 and 20 which is close to PBI, but it is also much less time than the MOMAD algorithm. Thisfurther shows that the algorithm really plays an effective role in the actual decision-making process. It has basically realized amore efficient algorithm for consumer online reviews under the background of applying data fusion and multiobjectiveoptimization technology.
1. Introduction
In the past few decades, due to the rapid development ofcomputer technology, each network platform to get a goodleveraging some of scalable online business also has a corre-sponding increase. Among them, online shopping hasbecome an important driving force for the development ofe-commerce in our country. Online purchasing platform iswhere all is not well, that is, the problem undetected onlinepurchasing presence. Based on this, this approach to reducethe information asymmetry mechanism of both parties to thetransaction has become the first choice of major e-commerceplatforms, and online reviews are currently widely adoptedby various online shopping platforms. Online comment isone that can be evaluated for their customers to buy theproduct after shopping on the web electronic business plat-
form and buy the product for consumers to purchase thefollow-up to provide reference. However, with the rapiddevelopment of the Internet, this approach has also exposedits own bottlenecks, requiring the integration of new technol-ogies for optimization.
Multiobjective optimization, as a research direction inmulticriteria decision-making, refers to a multiobjectiveoptimization problem in which the number of objects to beoptimized is more than one, and the optimization shouldbe carried out at the same time. When the variable domainof the problem is a finite set, we call this type of problem amultiobjective combinatorial optimization problem. Multi-objective optimization problems exist in a large number inthe real world and have important research significance.How to design corresponding algorithms to solve suchproblems has also attracted more and more attention from
HindawiJournal of SensorsVolume 2021, Article ID 6252425, 14 pageshttps://doi.org/10.1155/2021/6252425

scholars. This paper further proposes a multimodal sensordata fusion algorithm based on adaptive feedback adjust-ment. This method has good generalization ability, can moreaccurately estimate the mobile phone displacement, anddynamically adjust the screen display position, so that themobile phone screen content is displayed smoothly andreduces frequent focus of the eyes, to achieve the effect ofsoothing visual fatigue. At the same time, it has great signif-icance for online reviews and quality analysis.
Consumers have also been greatly facilitated in thedevelopment of science and technology, especially the com-bination of online reviews with data fusion and multiobjec-tive optimization technology has made this advantagemore obvious. Many scholars have done research here. In2020, Jain and Vaidya reviewed most of the works reportedby various authors about the use of social media during ter-rorist attacks in the past 10 years, how to conduct postattacksocial media analysis, and how to use social media analysisto detect terrorism, unrest, and hate behavior. For this goal,they used this review as a future antiterrorism research.However, this research path did not use technology [1]. In2021, Lee and Hong used an online survey to collect dataon 560 Amazon Mechanical Turk users. The results showthat both perceived time pressure and perceived purchaseuncertainty are positively correlated with the heuristic pro-cessing of online reviews, but negatively correlated with thesystematic processing of online reviews. Their researchfinally discussed practical and academic significance, as wellas future research directions. Although the research is com-plete, it lacks data support [2]. In 2016, Balakrishnan et al.conducted a bibliometric analysis based on more than20,000 articles from Web of Science to study how knowledgeabout the two important multienergy systems of microgridsand smart grids has developed. Their findings identify areasthat have been underresearched so far, provide a method fordata fusion between different multienergy systems, and pro-vide practical guidance for the implementation of multie-nergy system data fusion. Practicality is guaranteed, but thetheory is somewhat inadequate [3]. In 2020, Park et al. intro-duced the publication of the second edition of IntegratedHierarchical Classification (ILC2), a free-side knowledgeorganization system (KOS), and reviewed the main changesintroduced compared to the first edition (ILC1). Thechanges introduced in ILC2 include the following: the namesand order of some major categories and the development ofsubcategories of various phenomena. The system can beaccessed online for free via a PHP browser and SKOS for-mat. However, there are deviations in the research process[4]. In 2019, Arora proposed that Industry 4.0 is the fourthindustrial evolution: “The interconnection of the value crea-tion process transcends the boundaries of a single com-pany.” To achieve this, there must be strong Internetaccess. Integration should not stay at the company bound-ary, but should also involve customers and serve as a digitalbusiness partner in Industry 4.0. It is a pity that it can onlyact on the industrial field and limit its development [5]. In2016, Brill focused on theoretical issues, current develop-ments, and emerging trends in all areas of the field, includ-ing detailed reviews of relevant recent literature. The
editorial board and advisory board are composed of scholarsand practitioners in the fields of public international law andEuropean law to ensure that the review fully reflects theinterrelationship between current developments and thecontinued development of this important legal theory andpractice field. But based on this research, he did not under-stand [6]. In 2016, Meza et al. proposed a multiobjectiveoptimization strategy based on particle swarm behavior withrotation and linear motion. The combination of exploration-utilization led to the proposed cognitive algorithm, whichwas tested by multiple multiobjective optimization func-tions. Through statistical analysis, the proposed algorithmis compared with the standard particle swarm optimizationmultiobjective algorithm. Although the research process isquite inspiring, it is a pity that there is no conclusion [7].
The innovations of this article are as follows: (1) thisresearch provides new research methods and ideas forexploring the impact of online reviews and also helps com-panies refine the impact of online reviews, so as to take tar-geted marketing measures; (2) how the price (favorable andbad comments) of online comments integrated by the newmethod acts on the evolution of consumer attitude is closerto reality and has stronger application value; (3) in termsof basic data acquisition, this article uses online commentsserve as sample data. Compared with the traditional method,the analysis conclusion will be more scientific and effective.Through the above work, the application of theories basedon data fusion and multiobjective optimization is more rea-sonable, and the model designed from this can better have anationwide guiding application for consumer online reviewsand quality analysis.
2. Implementation Method of Online Commentand Analysis Algorithm Research Based onData Fusion andMultiobjective Optimization
2.1. Consumer Online Reviews. With the rise of the Internet,the spread of word-of-mouth is no longer limited to the realworld but extends to the virtual Internet world. Virtual real-ity technology is a brand-new practical technology developedin the 20th century. Virtual reality technology includes com-puters, electronic information, and simulation technology,and its basic realization is that a computer simulates a virtualenvironment to give people a sense of environmental immer-sion. For example, foreign shopping platforms such as Ama-zon and e-Bay have launched product review functions asearly as the 1990s, which has also aroused scholars’ attentionto the impact of online word-of-mouth. Online reviews, alsoknown as online consumer reviews, are just one of the mainmanifestations of Internet word-of-mouth [8].
As a kind of online word-of-mouth, online reviews arenot only related to but different from traditional offlineword-of-mouth. From the perspective of connotation defini-tion, online reviews and traditional offline word-of-mouthare both informal and noncommercial evaluation informa-tion about products or services [9], but they are not justsimple common concepts. The connections and differences
2 Journal of Sensors

between the two are discussed below. The four commoncharacteristics of online reviews and traditional offlineword-of-mouth are as follows [10]:
(1) High reliability
Traditional offline word-of-mouth communication isgenerally carried out between relatives and friends, so recip-ients generally trust the source of information; online reviewsare reviews left by consumers about products, becausereviewers have no direct economic relationship with the mer-chants. The introduction of merchants is more objective andcredible [11].
(2) Two-way communication
Different from one-way publicity methods such as adver-tising, word-of-mouth communication is two-way, and fur-ther interactive communication can be carried out betweenthe communicator and the receiver, which can also beachieved by online reviews [12].
(3) Less interference
Compared with other communication methods, word-of-mouth information is less interfered by external factorsdue to word of mouth; online comments are generally kepton the Internet for more than one year, and the degree ofinterference is less [13].
(4) Uncontrollable
Online reviews are the same as traditional offline word-of-mouth communication. They are both intangible andintangible. Therefore, it is difficult for companies to controltheir communication. Moreover, in different industries, con-sumers have different dissemination intentions, which willaffect potential consumer growth rate.
The difference between online reviews and traditionaloffline word-of-mouth is also very obvious. There are threedifferences:
(1) Anonymity
Because online comments publish information on theInternet, they can express their opinions in the most truthfulmanner without violating the law without worrying aboutany stakes [14].
(2) Not limited by time and space
Different from traditional word-of-mouth, online reviewscan exist on shopping platforms for a long time and can beseen by anyone at any place and at any time, thus breakingthe time and space limitations of word-of-mouth communi-cation [15].
(3) Content format
Traditional offline word-of-mouth communication ismainly spread through language, facial expressions, body
movements, etc., while online reviews are mainly spreadthrough digital information such as text, pictures, and rat-ings [16].
Digital information dissemination technology includestheories, methods, technologies, and systems related to theacquisition, processing, storage, dissemination, manage-ment, security, and output of digital media information. Itincludes various information technologies such as computertechnology, communication technology, and informationprocessing technology. Comprehensive application technol-ogy, online comment is a process of information dissemina-tion from initiator to receiver, as shown in Figure 1. Theinitiator of the comment publishes the content of the com-ment on the Internet and is searched or received by thereceiver who needs the information. This is the communica-tion process of online comments.
As can be seen from Figure 1, the initiator of onlinereviews directly determines the origin of online reviewsand is also the basis for the spread of online reviews, whichwill also directly affect subsequent consumers’ perceptionsand behaviors of products [17]. Intelligent perception tech-nology can be divided into four categories according to dif-ferent objects and goals: perception technology based onhuman body analysis, perception technology based on vehi-cle analysis, perception technology based on behavior analy-sis, and perception technology based on image analysis. Atthe same time, theoretical combing is also critical. In viewof the existing analysis, this article summarizes the relevantresearch on online reviews, as shown in Figure 2.
Judging from Figure 2, this paper analyzes several ele-ments of online review research, the initiator (motivation,professionalism, etc.), the recipient (professionalism, net-work experience, etc.), the information processing process(ELM and HSM), and the dimensions of online commentsthemselves (quantity, valence, etc.) [18].
2.2. Data Fusion and Multiobjective Optimization Technology.Multimodal data fusion refers to the comprehensive use ofcomputer technology to process multimodal data, so as tomore accurately perceive information such as the state ofthe objective object and the environment in which it islocated. Data fusion technology refers to information pro-cessing technology that uses computers to automatically ana-lyze and synthesize several observation information obtainedin time series under certain criteria to complete the requireddecision-making and evaluation tasks. Data fusion technol-ogy includes the collection, transmission, synthesis, filtering,correlation, and synthesis of useful information from variousinformation sources to assist people in situation/environ-mental judgment, planning, detection, verification, and diag-nosis. The focus of multimodal data fusion research includesvarious modal data feature extraction methods and multi-modal data fusion algorithms. The focus of the fusion algo-rithm is to coordinate and complement different modaldata and improve the accuracy of decision-making for uncer-tain data. The data fusion center fuses information frommul-tiple sensors and can also fuse information from multiplesensors and the observation facts of the human-machineinterface (this fusion is usually a decision-level fusion).
3Journal of Sensors

Extract the symptom information, under the action of theinference engine. Match the symptoms with the knowledgein the knowledge base, make fault diagnosis decisions, andprovide them to users. Compared with single mode, multi-mode system has the following advantages:
(1) Improve system stability
(2) Improve the continuity of information
Nowadays, multiobjective optimization problems aremore and more widely used, involving many fields. In dailylife and engineering, more than one index is often requiredto be optimized, and multiple indexes are often required tobe optimized at the same time. A large number of problems
Network access
InternetInitiator Recipient
�e communicationenvironment of thecomment initiator
Comment recipient’scommunication
environment
CommentsComments
Figure 1: Online comment exchange process.
Motivation Professional Influenceetc.
Online comment
Professional Networkexperience
Involvementetc.
Buyingdecision
Informationprocessing
Comment length,commenter’s
information, etc.Content Valence Volume
Comment recipientComment recipient
Organization
Figure 2: Theoretical research on online reviews.
4 Journal of Sensors

can be attributed to a category of achieving multiple goals atthe same time under certain constraints.
Multisensor data fusion is shown in Figure 3 accordingto the level of fusion: according to the different levels offusion, it is divided into data layer fusion, feature layerfusion, and decision layer fusion [19].
As shown in Figure 3, multisensor data fusion can bedivided into the following:
(1) Data Layer Fusion. The data detected by all sensorsare fused, and the next step is performed from thefused data. This fusion method requires the sensorsto detect the same type of data without losing theoriginal data. The accuracy is high [20].
(2) Feature Layer Fusion. The data detected by each sen-sor is extracted separately, and then, these featuresare fused. This method compresses the original datato a certain extent, reduces the time required for sub-sequent processing, and improves the system’s per-formance real-time.
(3) Decision-Making Layer Fusion. After each sensordetects the data, it performs feature extraction andtarget recognition and then fuses each recognitionresult. This method is the most inaccurate, becausethe information of each sensor is a high degree ofconcentration.
“Video networking” technology is the current advancedreal-time high-definition video exchange technology, whichcan realize large-scale, high-quality, real-time, two-way,and symmetrical high-definition video full exchange. Atpresent, there is no universal fusion method for multisensordata fusion, and it generally needs to be determined accord-ing to the specific application background. Weighted averagemethod and neural network method are two classic datafusion methods based on measurement signals [21].
The weighted average method is the simplest and mostintuitive method for processing information and data fusion.The basic process is as follows:
Assuming that o sensors are used to measure a certainphysical quantity, the output data of the u-th sensor is auðu= 1, 2,⋯oÞ and the weighting coefficient is du, and then,the output value of each sensor is weighted and averaged,and the weighted average fusion result is obtained as follows:
�a = 〠o
u=1duau + 〠
k
u=2dac: ð1Þ
The weighted average method is the weighted average ofthe redundant information from each sensor, and the result isused as the fusion value. When applying this method, the sys-tem and the sensors used must be analyzed in detail to obtainthe correct weights �a.
The biggest difference between the multiobjective opti-mization algorithm and the single-objective evolutionaryalgorithm in the calculation process is the individual fitnessevaluation strategy. The use of a good individual fitness eval-
uation strategy and selection strategy has a great effect onthe performance of the evolutionary algorithm [22].
As an improvement of the NSGA algorithm, NSGAIIuses a fast nondominated sorting strategy to establish a non-dominated set. The method of constructing the nondomi-nated set is as follows: first, set two parameter variables tqand oq for all individuals in the group q, and put the set tmin the individuals of om − u = 0 are stored in them set. Whenlu = ∂, the above operations are performed in sequence untilall individuals are stratified and assigned a grade num-ber [23].
Use a mathematical formula to describe the crowdednessof the environment in which individuals in the group arelocated. Suppose the crowded distance of the individual uis wu, and the crowded distance of the nonboundary individ-ual u is calculated as follows:
wu =∑n
k=1 lk u − 1ð Þ − lk u + 1ð Þj j/lmink − lmax
k
n: ð2Þ
Among them, lkðu − 1Þ and lkðu + 1Þ are the objectivefunction values of u − 1 and u + 1 near the individual u onthe k-th target, lmin
k and lmaxk are the maximum and minimum
values of the k-th objective function, and n is the number ofobjective functions. Number, the k-th gene of the next gener-ation was obtained by simulating binary crossover [24].
b1′ kð Þ = 0:5 1 − τm kð Þð Þai′ kð Þ + 1 + τm kð Þð Þa1′ kð Þh i
,
b2′ kð Þ = 0:5 1 − τm kð Þð Þai′ kð Þ + 1 + τm kð Þð Þa2′ kð Þh i
,
τm kð Þ =2ρ kð Þð Þ1/oz+1 π kð Þ < 0:5,
12 1 − π kð Þð Þ� �1/oz+1
anyother:π kð Þ ∈ 0:1½ �,
8><>:ð3Þ
Polynomial transformation node can prevent the popula-tion due to conversion into a building partially optimizedmode. Let asuðkÞ be the k-th gene of the u-th generation ofindividuals, and aouðkÞ and au′ðkÞ are the next and next gener-ations of ai1ðkÞ. Individual asuðkÞ mutates to produce off-spring biuðkÞ. Among them, ρn is a custom parameter,adjusted according to the actual situation, called the variationdistribution index [25].
bsu kð Þ = au′ kð Þ + aoi kð Þ − ai′ kð Þ� �
τm kð Þ,
τm kð Þ = 2�π kð Þ1/πn−1 �π kð Þ < 0:5,1 − 2 1 − �π kð Þð Þ½ �1/πn−1 another:
�π kð Þ < 0:5,(
ð4Þ
Among them, τmðkÞ is the exponential growth value, and�πðkÞ < 0:5 is the discrimination criterion.
The performance evaluation of multiobjective optimiza-tion algorithm mainly adopts two aspects: convergence of
5Journal of Sensors

solution set and distribution breadth of solution set. In orderto truly reflect the performance of the evolutionary algo-rithm, the following three evaluation indexes are mainly usedin this paper, where the generation distance (GD) measuresthe algorithm convergence effect; the spatial distribution(SP) mainly evaluates the uniformity of the nondominantsolution set distribution results, and the maximum spreadcloth (MS) mainly analyzes the distribution universality ofthe nondominant solution set [26].
GD is used to evaluate the distance between the Paretooptimal front (PF) and the nondominated solution set front(PF) obtained by the algorithm in the ideal state of uniformdistribution. The value is defined as follows:
GD = 〠exp
uc
hk +1o
〠o
u=1w2
u
!1/2
: ð5Þ
For a specific optimization problem, o is the number ofindividuals in PF, and wu is the Euclidean distance between
the u-th point in PF and the nearest point in PF in the targetspace. The uniformity of SP’s main evaluation algorithmresult set distribution is defined as follows:
SP = 1ws
1o〠o
u=1w′ − �w′� �2" #1/2
,w′ = 1o〠o
u=1ws
u: ð6Þ
Among them, w′ represents the Euclidean distancebetween the u-th individual in PF and its nearest, and o isthe number of individuals in PF [27]. MS is mainly used tomeasure the breadth of the distribution of nondominatedsolution sets obtained by evolutionary algorithms and isdefined as follows:
MS =
ffiffiffiffiffiffiffiffiffiffiffiffiffiffiffiffiffiffiffiffiffiffiffiffiffiffiffiffiffiffiffiffiffiffiffiffiffiffiffiffiffiffiffiffiffiffiffiffiffiffiffiffiffiffiffiffiffiffiffiffiffiffiffiffiffiffiffiffiffiffiffiffiffiffiffiffiffiffiffiffiffiffiffiffi1n〠n
u=1
max lminu , lmin
u
n o−min lmax
u , lmaxuf g
lminu − lmax
u
8<:9=;
vuuut : ð7Þ
Feature layerfusion
Decision-makingfusion
Data layer fusion
Sensor 1 Sensor 2 Sensor 1n
Sensor 1 Sensor 2 Sensor n
Sensor 1 Sensor 2 Sensor n
Feature extraction
Featureextraction
Featureextraction
Feature extraction
Featureextraction
Featureextraction
Featureextraction
Fusion Fusion Identify Identify Identify
Identify Identify Fusion
Figure 3: Schematic diagram of data fusion classification.
6 Journal of Sensors

Among them, n represents the number of targets, lminu
and lmaxu , respectively, represent the maximum and mini-
mum values of the u-th dimension objective function inthe PF, and lmin
u and lmaxu , respectively, represent the maxi-
mum and minimum values of the i-dimensional objectivefunction in the PF.
2.3. Algorithm
2.3.1. Time Series Prediction Technology. Time series is a setof data points arranged in chronological order. Time seriesare very common in daily life. For example, the weekly aver-age temperature of a certain place, the number of peopledining in a week in a restaurant, and the stock price of a cer-tain stock in one year can all be abstracted into time seriesfor analysis. Time series forecasting technology is actually aregression forecasting method, which belongs to quantitativeforecasting. Its basic principle is as follows: On the one hand,it recognizes the continuity of the development of things,uses past time series data for statistical analysis, and infersthe development trend of things.
2.3.2. LSTM. LSTM is a variation of the cyclic neural net-work. Traditional RNN has the problem of disappearing gra-dients in terms of long-term dependence, which means thatit will forget information that is far away from the timeseries. And LSTM gains the ability to learn long-term depen-dence by introducing three kinds of thresholds (forgettingthreshold, input threshold, and output threshold) and hasthe ability to learn time series distance information. A sim-ple LSTM network structure is shown in Figure 4.
As shown in Figure 4, the input is A, the output is G, andthe information of the neural network will be passed to thenext state through the cyclic structure X. On this basis,Figure 5 describes the internal principles of LSTM in detail.
As shown in Figure 5, in the figure, u represents the sig-moid activation function, with a value range of 0 to 1. Nowlet us introduce the forgetting gate of LSTM. The forgettinggate receives the output gs−1 at the previous moment and thecurrent input as and then passes through a sigmoid layer tochoose to forget some information. If the sigmoid output is0, it will be completely forgotten; if the output is 1, it willbe completely reserved [28].
ls = σ dl ∗ gs−1, as½ � + ylð Þ: ð8Þ
LSTM input gate: first, the last output gs−1 and the cur-rent input as will pass through the sigmoid layer and out-put us. us represents the probability of updating the state.Then, the last output gs−1 and the current input as willpass through the tanh layer to output the candidate newstate ezs .
us = σ du ∗ gs−1, as½ � + yuð Þ,ezs = cos g dz ∗ gs−1, as½ � + yzð Þ:ð9Þ
Subsequently, a new state zs needs to be generated,which is calculated from the output ls of the forget gate,
the candidate new state ezs of the input gate, and theupdate probability us.
zs = ls ∗ zs−1 + us ∗ zs +ffiffiffiffiffizsd
dp ̌
: ð10Þ
Output gate: the last output gs−1 and the current inputas will pass through the sigmoid layer, output ps, anddetermine which new state information will be output.Then, the new state zs is processed and multiplied by psto determine the information gs output by the new state.
ps = σ dp ∗ gs−1, as½ � + yp� �
+ dp ∗ gs−1, as½ � + yp� �
,
gs = ps ∗ sin g zs + ∐u=1
zdc + onð Þ
� �:
ð11Þ
2.3.3. Linear Regression. Regression is a predictive modelingtechnique in which the estimated target variable is continu-ous [29]. The main forecasting technology models are linearregression model, moving average model, exponentialsmoothing model, trend extrapolation model, ARIMA fore-casting model, Markov forecasting model, input-output fore-casting model, grey forecasting model, artificial neuralnetwork forecasting model, etc. In reality, there are manyapplications of regression technology, such as forecastingstock market index, forecasting rainfall, road traffic, etc. Lin-ear regression is divided into simple linear regression andmultiple linear regressions. A variable to estimate the targetvariable is a simple linear regression (one-variable linearregression). For example, a data set w = fðau, buÞ/u = 1, 2, 3⋯ og of N observation data is collected, and a linear modelis used to fit the observation data.
l að Þ = d1a + do +Y0g=1
xg: ð12Þ
Among them, lðaÞ is the data observation value, such that
max 〠o
u=1bu − l að Þ½ �b2: ð13Þ
Among them, d1 and do are the regression coefficients ofsimple linear regression. This method is also called the leastsquare method. It tries to minimize the error between theestimated target variable and the real target variable throughthe appropriate regression coefficients d1 and do.
Finding the regression coefficient d0,d1,⋯dh makes thefollowing:
b̂ = d0 + d1a1 + d2a2+⋯+dhah,
max 〠o
u=1bu − b̂h i
+a c
b d
!= uk:
ð14Þ
Among them, bu − b̂ is an equation from the beginningto the end, and the above algorithm is established.
7Journal of Sensors

ASAS
8 U
A2A1A0
7 U7 U7 U
7 U
x zA
GS
9 U9 U 9 U 9 U
G0A
G1A
G2A
GSA
Figure 4: Schematic diagram of recurrent neural network LSTM.
Z
AS-1A
GS-1AC
AS AS+1
A
T
f1f2
𝜋ß
Figure 5: Schematic diagram of the LSTM structure of the recurrent neural network.
8 Journal of Sensors

3. Based on Data Fusion and MultiobjectiveOptimization of Online Reviews and AnalysisAlgorithm Research Design andImplementation Method Experimentsand Conclusions
3.1. Experimental Setup. In order to verify the effectivenessof the algorithm MSIMOPSO proposed in this paper, threemultiobjective optimization algorithms will be used as thecomparison algorithm for this simulation experiment. Theseare the multiobjective evolutionary algorithm (MOEA/D)based on decomposition idea and the genetic algorithmbased on fast nondominated sorting, NSGAII, and multi-strategy improved multiobjective particle swarm optimiza-tion (MIMOPSO). And it adopts ZDT, DTLZ, and someUF test functions which are set as test functions. The param-eter settings of each comparison algorithm and the corre-sponding population size and evaluation times of each testfunction are set as shown in Table 1.
Table 2 shows the setting method of the test function:The above algorithms are run 30 times independently on
the i5 processor, 8G RAM, and MATLAB2014a platform.
3.2. Model Simulation. In order to determine the value ofeach parameter in the model, this article obtained a seriesof data on a well-known domestic e-commerce website.According to the refined processing model (ELM), whenconsumers do not have time to carefully consider each pieceof review information, their decision-making is usuallyquick and simple. This method usually only needs to extractthe hidden meaning of the information to quickly make achoice, and the detailed description can be seen in the exper-iment, and the analysis can be seen below. Research showsthat the number of reviews is one of the bases for many con-sumers to make quick decisions. In order to explore theinfluence of the number of reviews on consumer decision-making, this article collected reviews of these two categoriesof products from the mall using “laptop” and “flat-panelTV” as keywords, mainly including the number of reviewsand praise rate.
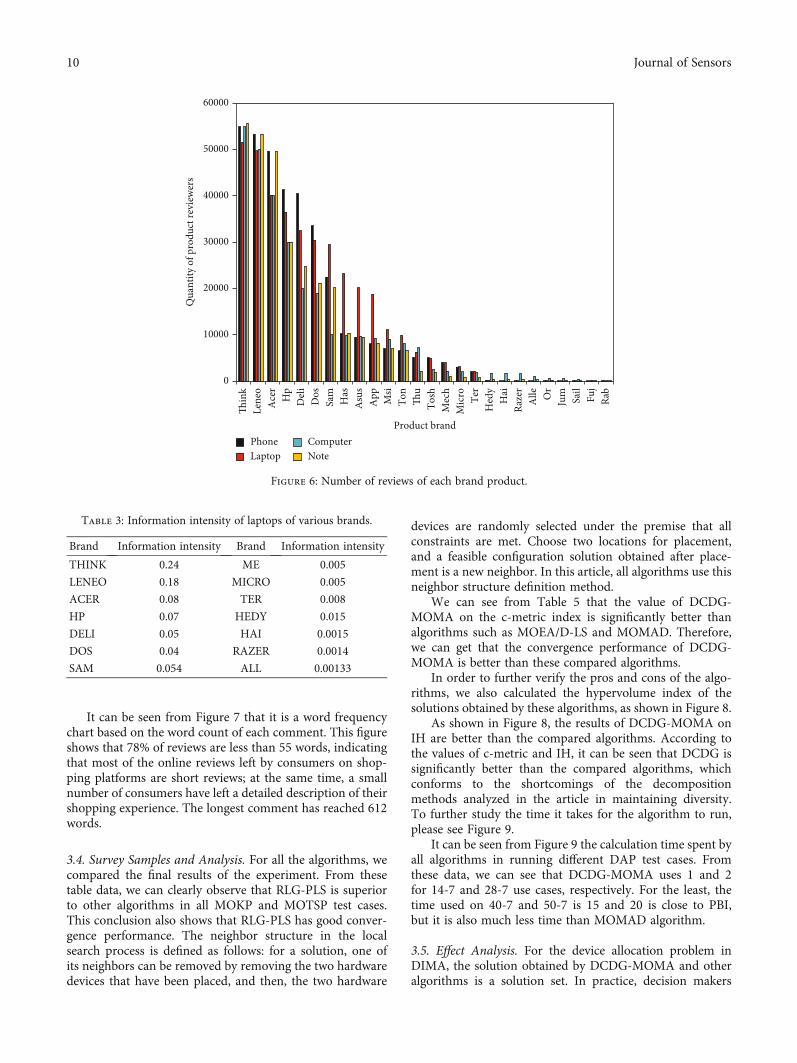
This article first takes “laptop” as an example. A total of785 products have been searched in the mall, of which 728products have online reviews. Therefore, this article has col-lected a total of 258,473 online reviews of 728 products.Because some products under the same brand, althoughthe models are different, there is little difference in configu-ration, and some products have less than 5 reviews, so theproducts can be reclassified. In order to calculate the infor-mation intensity of each product, this article classifies the728 products collected by 30 brands, that is, each brand rep-resents a product, and calculates the information intensity ofeach product based on this. Of course, the informationintensity of each commodity can also be calculated sepa-rately, and the result does not affect the actual meaning ofthe information intensity calculation method. In the simula-tion of this article, each brand is regarded as a product, andreviews of products under the same brand are included inthe reviews of that brand. The data is shown in Figure 6.
It can be seen from Figure 6 that under the support ofthe data parameters in the figure, the information intensityof each brand product is calculated by the calculation for-mula, and the results are shown in Table 3.
In order to determine the influence of information inten-sity on consumer acceptance-acceptance probability, thispaper selected 3 products from 30 products for simulation,namely, THINK, n = 0:24; Samsung, n = 0:054; and Jumper,n = 0:00024. The information intensity of these three com-modities, respectively, represents the high informationintensity, medium information intensity, and low informa-tion intensity of the online review information of theseproducts.
3.3. Data Collection. This article uses the GooSeeker webcrawler software developed based on Python to obtainonline comment data on the four popular smartphones ofdomestic A mobile phone, domestic B mobile phone, foreignA mobile phone, and foreign B mobile phone on the onlineshopping platform. This article crawls the user name, userrating, evaluation time, number of likes, number of replies,and details of the comment text of the comment. The com-ment interface and comment data acquisition methods ofthe other three mobile phones are similar, so I will not repeatthem here.
As shown in Table 4, there are a total of 32,145 com-ments on the four mobile phones crawled in this paper:domestic A mobile phone, domestic B mobile phone, foreignA mobile phone, and foreign B mobile phone. Among them,15,487 comments were obtained from the x platform and16,658 comments were obtained from the y platform. Thenumber of comments on each mobile phone was basicallythe same, and the number of comments on foreign mobilephones was slightly larger. The time span of the commentis nearly 6 months, which is basically consistent with thecurrent life cycle of mobile phones.
Then, study the number of words used in their com-ments, as shown in Figure 7.
Table 1: Comparison algorithm parameter settings.
Algorithmname
Parameter settingsGroupname
Possibility
MSIW1 = 0:3, W2 = 0:8, Z1 =
Z2 = 3 A 95.2%
NSG PC = 0:8, PN =O B 96.4%
MOE T = 0:1N , ZE = 0:9 C 91.8%
MIM W = 0:108, Z1 = Z2 = 1:88 D 93.5%
Table 2: Test function settings.
Functionname
Populationsize
External archivesize
Evaluationtimes
ZDT 90 90 30000
DTLZ 140 140 100000
UF 190 190 300000
9Journal of Sensors
It can be seen from Figure 7 that it is a word frequencychart based on the word count of each comment. This figureshows that 78% of reviews are less than 55 words, indicatingthat most of the online reviews left by consumers on shop-ping platforms are short reviews; at the same time, a smallnumber of consumers have left a detailed description of theirshopping experience. The longest comment has reached 612words.
3.4. Survey Samples and Analysis. For all the algorithms, wecompared the final results of the experiment. From thesetable data, we can clearly observe that RLG-PLS is superiorto other algorithms in all MOKP and MOTSP test cases.This conclusion also shows that RLG-PLS has good conver-gence performance. The neighbor structure in the localsearch process is defined as follows: for a solution, one ofits neighbors can be removed by removing the two hardwaredevices that have been placed, and then, the two hardware
devices are randomly selected under the premise that allconstraints are met. Choose two locations for placement,and a feasible configuration solution obtained after place-ment is a new neighbor. In this article, all algorithms use thisneighbor structure definition method.
We can see from Table 5 that the value of DCDG-MOMA on the c-metric index is significantly better thanalgorithms such as MOEA/D-LS and MOMAD. Therefore,we can get that the convergence performance of DCDG-MOMA is better than these compared algorithms.
In order to further verify the pros and cons of the algo-rithms, we also calculated the hypervolume index of thesolutions obtained by these algorithms, as shown in Figure 8.
As shown in Figure 8, the results of DCDG-MOMA onIH are better than the compared algorithms. According tothe values of c-metric and IH, it can be seen that DCDG issignificantly better than the compared algorithms, whichconforms to the shortcomings of the decompositionmethods analyzed in the article in maintaining diversity.To further study the time it takes for the algorithm to run,please see Figure 9.
It can be seen from Figure 9 the calculation time spent byall algorithms in running different DAP test cases. Fromthese data, we can see that DCDG-MOMA uses 1 and 2for 14-7 and 28-7 use cases, respectively. For the least, thetime used on 40-7 and 50-7 is 15 and 20 is close to PBI,but it is also much less time than MOMAD algorithm.
3.5. Effect Analysis. For the device allocation problem inDIMA, the solution obtained by DCDG-MOMA and otheralgorithms is a solution set. In practice, decision makers
0
10000
20000
30000
40000
50000
60000
�in
kLe
neo
Ace
rH
pD
eli
Dos
Sam
Has
Asu
sA
pp Msi
Ton
�u
Tosh
Mec
hM
icro Te
rH
edy
Hai
Raze
rA
lle Or
Jum Sail
Fuj
Rab
Qua
ntity
of p
rodu
ct re
view
ers
Product brandPhoneLaptop
ComputerNote
Figure 6: Number of reviews of each brand product.
Table 3: Information intensity of laptops of various brands.
Brand Information intensity Brand Information intensity
THINK 0.24 ME 0.005
LENEO 0.18 MICRO 0.005
ACER 0.08 TER 0.008
HP 0.07 HEDY 0.015
DELI 0.05 HAI 0.0015
DOS 0.04 RAZER 0.0014
SAM 0.054 ALL 0.00133
10 Journal of Sensors

often choose one of these solutions as the final implementa-tion plan without any preference. In this article, EMU will beused to determine the solution of interest, and the selectedsolution will be compared with the solution generated bythe greedy strategy, and the practical application of DCDG-MOMA will be analyzed. As shown in Figure 10, for thetwo use cases 14-7 and 28-7, 25 independent runs, the IH isthe median solution using EMU.
As shown in Figure 10, the target value (mass, OIC) cor-responding to the selected solution and the target value cor-responding to the three solutions generated by the greedystrategy are displayed. According to these target values, thesolution obtained by DCDG-MOMA is much better thanthe solution generated by the greedy random method, espe-cially in the 28-7 example, which further shows that DCDG-
MOMA does play a role in the actual decision-makingprocess.
4. Discussion
By using a number of comments in the above survey ofonline reviews, we discuss the key factors influencingchanges in consumer experience a sense of online reviews.I am here with two complete description of direct review.The research results show that the information intensity ofonline reviews has a very important impact on consumers’receiving experience. Specifically, they are less affected byonline reviews. In terms of experience changes, they have ahigher probability of receiving review information, but alower probability of accepting the information. This has
Table 4: Statistical description.
Mobile phone brands Time to market x platform y platform Total Comment time
Domestic A mobile phone 2016.3.1 3000 3600 6600
2015.9-2016.10Domestic B mobile phone 2015.12.9 2000 2400 4400
Foreign A mobile phone 2015.9.9 5487 6658 12145
Foreign B mobile phone 2016.8.3 5000 4000 9000
Number of comments 15,487 16,658 32,145
0
200
400
600
800
1000
1200
20 40 80 100 120 140 160 180 200
Freq
uenc
y
Byte
Domestic A mobile phoneDomestic B mobile phone
Foreign A mobile phoneForeign B mobile phone
20 40 80 100 120 140 160 180 200Byte
0
200
400
600
800
1000
1200
Freq
uenc
y
Figure 7: Frequency statistics of online comments.
Table 5: c-metric (%) of DCDG-MOMA, MOEA/D-LS, and MOMAD on DAP.
Test caseMOEA/D WS MOEA/D TCH MOEA/D PBI MOMADZ X, Yð Þ Z Y , Xð Þ Z X, Yð Þ Z Y , Xð Þ Z X, Yð Þ Z Y , Xð Þ Z X, Yð Þ Z Y , Xð Þ
13-7 70.1 0.28 67.89 2.98 69.8 0.11 77.58 3.11
22-7 6.12 4.3 18.56 3.98 28.56 3.6 99 4.11
42-7 17.25 18.8 44.85 40.21 48.25 18.25 44.12 20.15
48-7 44.25 9.96 44.36 9.58 55.36 9.9 22.14 11.54
11Journal of Sensors

00.5
11.5
22.5
33.5
4
Hyp
ervo
lum
e
Algorithms
DCD
G
WS
TCH
PBI
MO
MA
D
Algorithms
DCD
G
WS
TCH
PBI
MO
MA
D
28 to 714 to 7
40 to 750 to 7
0123456789
10
Hyp
ervo
lum
e
Figure 8: DCDG-MOMA, MOEA/D-LS, and MOMAD overvolume index results of 20 runs on all test cases.
28 to 714 to 7
50 to 740 to 7
DCDG-MOMA
WS
TCH
PBI
MOMAD
Time (s)
Alg
orith
ms
0 5 10 15 20 0 5 10 15 20 25 30
DCDG-MOMA
WS
TCH
PBI
MOMAD
Time (s)
Alg
orith
ms
Figure 9: Running time of DCDG-MOMA, MOEA/D-LS, and MOMAD on different test cases.
0
100
200
300
400
500
600
700
800
OIC
MASS
NONSOL-INSOL-PERE
NON SOL-PERESOLLSOL-IN
0
1000
2000
3000
4000
5000
6000
7000
600 700 800 900 1000 1100 3000 4000 5000 6000 7000
OIC
MASS
Figure 10: Diagram of the solution obtained by EMUr.
12 Journal of Sensors

similar conclusions to the previous study by Park et al. It canbe seen that consumers are more inclined to use marginalinformation processing methods to process review informa-tion, that is, to grasp the key points of review informationand make decisions quickly. It can be seen from the researchresults of this article that the number of online reviews is animportant factor influencing consumer decision-making. Atthe same time, previous studies have found that consumersare more likely to form a corresponding impression of theproduct in the early stage and are basically no longer affectedby online reviews in the later stage. The research results ofthis article found that individual consumers are more likelyto receive relevant information but are basically unaffectedduring the acceptance stage, which further reflects the inde-pendence of their comments.
First of all, in view of the impact of online reviews onconsumer attitudes, companies should take measures to vig-orously promote the increase in the number of reviews,because a product with a large number of reviews willincrease consumers’ acceptance of review information,prompting them to pay more attention to the product. Onlywhen the product attracts the attention of consumers can itfurther encourage consumers to have certain existing ten-dencies and encourage them to further accept the product.Second, enhance the guiding nature of online reviews. Con-sumers who use the new algorithm have a higher probabilityof receiving and accepting review information, whichenhances the guidance of reviews, while presenting products,such as under the product picture, some product praises aredisplayed, so that consumers can closely compare reviewsand products. Combining them will further deepen con-sumers’ impression of the product and increase their likeli-hood of accepting the product.
5. Conclusions
With the rise of e-commerce, online communities, etc.,online reviews have become an important area for academicsand companies to discuss consumer behavior. This articleuses a variety of scientific methods, such as parameter com-parison method, data fusion method, and algorithm optimi-zation method; the purpose is to collect data and design areasonable algorithm model. The algorithm proposed in thispaper has good efficiency and ability to serve consumers.The shortcomings of this article are as follows: first, the algo-rithm has excellent performance in solving two goals, but asthe number of goals increases, the effectiveness of the solu-tion selection part will be weakened even when the threegoals are reached. Secondly, this algorithm works well in rel-atively regular network scenarios, but it is not obvious inother irregular scenarios, with insufficient generalizationability and insufficient flexibility. Therefore, in the next stepof research, we need to increase the algorithm’s segmentpoints to make the algorithm more universal, to accept awider range of goals, and to enhance its stability, and its effi-ciency will not change with environmental changes. In theend, realizing the algorithm model proposed in this papercan have wider applications.
Data Availability
The data that support the findings of this study are availablefrom the corresponding author upon reasonable request.
Conflicts of Interest
The authors declared no potential conflicts of interest withrespect to the research, authorship, and/or publication ofthis article.
Acknowledgments
This work was supported by the National Social ScienceFoundation of China (16BGL089).
References
[1] P. Jain and A. S. Vaidya, “Analysis of social media based onterrorism — a review,” Vietnam Journal of Computer Science,vol. 8, no. 1, pp. 1–21, 2020.
[2] J. Lee and I. B. Hong, “The influence of situational constraintson consumers' evaluation and use of online reviews: aheuristic-systematic model perspective,” Journal of Theoreticaland Applied Electronic Commerce Research, vol. 16, no. 5,pp. 1517–1536, 2021.
[3] D. Balakrishnan, A. B. Haney, and J. Meuer, “What a MES(s)!A bibliometric analysis of the evolution of research on multi-energy systems,” Electrical Engineering, vol. 98, no. 4, pp. 1–6, 2016.
[4] Z. Park, C. Gnoli, and D. P. Morelli, “The second edition of theintegrative levels classification: evolution of a KOS,” Journal ofData and Information Science, vol. 5, no. 1, pp. 39–50, 2020.
[5] C. Arora, “Digital business leadership: digital transformation,business model innovation, agile organization, change man-agement,” Computing Reviews, vol. 60, no. 4, pp. 162–162,2019.
[6] Brill, “Austrian review of international and European law,”Austrian Review of International & European Law Online,vol. 1, no. 1, pp. 121–143, 2016.
[7] J. Meza, H. Espitia, C. Montenegro, and R. G. Crespo, “Statis-tical analysis of a multi-objective optimization algorithm basedon a model of particles with vorticity behavior,” Soft Comput-ing, vol. 20, no. 9, pp. 3521–3536, 2016.
[8] S. Otto, “Religion in science fiction: the evolution of an ideaand the extinction of a genre, Steven Hrotic, Bloomsbury,2014 (ISBN 978-1-4725-3355-5), ix + 225 pp., hb £65,” Reviewsin Religion & Theology, vol. 23, no. 3, pp. 323–326, 2016.
[9] M. Zhou, Y. X. Long, W. P. Zhang et al., “Adaptive geneticalgorithm-aided neural network with channel state informa-tion tensor decomposition for indoor localization,” IEEETransactions on Evolutionary Computation, vol. 25, 2021.
[10] H. Kaneko, Y. Otsuka, Y. Kubota, and G. Wakabayashi, “Evo-lution and revolution of laparoscopic liver resection in Japan,”Annals of Gastroenterological Surgery, vol. 1, no. 1, pp. 33–43,2017.
[11] G. C. Nunez‐Mir, B. V. Iannone III, B. C. Pijanowski, N. Kong,and S. Fei, “Automated content analysis: addressing the bigliterature challenge in ecology and evolution,” Methods inEcology & Evolution, vol. 7, no. 11, pp. 1262–1272, 2016.
13Journal of Sensors

[12] D. Guido, H. B. Song, and S. Anke, Big Data Analytics forCyber-Physical Systems: Machine Learning for the Internet ofThings, Elsevier, 2019.
[13] B. T. P. Chern and F. B. S. Ahmad, “Supply chain evolution. Astudy of opportunities and challenges of virtual kitchens inMalaysia,” Journal of Critical Reviews, vol. 7, no. 16, pp. 361–368, 2020.
[14] F. Vigneron and P. V. Ca, “Evolution in the chemical makingof gold oxidation catalysts,” ChemInform, vol. 47, no. 19,pp. 192–198, 2016.
[15] M. Zhou, Y. M. Wang, Z. S. Tian, Y. H. Lian, Y. Wang, andB. Wang, “Calibrated data simplification for energy-efficientlocation sensing in internet of things,” IEEE Internet of ThingsJournal, vol. 6, no. 4, pp. 6125–6133, 2019.
[16] D. C. Adams and M. L. Collyer, “Phylogenetic comparativemethods and the evolution of multivariate phenotypes,”Annual Review of Ecology Evolution and Systematics, vol. 50,no. 1, pp. 1–21, 2019.
[17] S. K. Kamalakarababu, A. Sam, and S. Varghese, “Clinical pro-file and short-term outcome of acute nephritic syndrome inchildren,” Journal of Evolution of Medical and Dental Sciences,vol. 6, no. 88, pp. 6157–6160, 2017.
[18] Y. Hu, C. Hu, S. Fu et al., “Survey on popularity evolution anal-ysis and prediction,” Journal of Electronics & InformationTechnology, vol. 39, no. 4, pp. 805–816, 2017.
[19] H. Fan, H. Zhan, S. Cheng, and B. Mi, “Research and applica-tion of multi-objective particle swarm optimization algorithmbased on α-stable distribution,” Xibei Gongye Daxue Xuebao/-Journal of Northwestern Polytechnical University, vol. 37, no. 2,pp. 232–241, 2019.
[20] Q. Zhou, C. Zhang, S. X. Zhao, and B. Chen, “Measuring bookimpact based on the multi-granularity online review mining,”Scientometrics, vol. 107, no. 3, pp. 1435–1455, 2016.
[21] Y. Guo, P. Yan, D. Wu, H. Zhou, Y. Shi, and R. Yi, “Analysismethod for factors influencing gear hobbing quality based ondensity peak clustering and improved multi-objective differen-tial evolution algorithm,” International Journal of ComputerIntegrated Manufacturing, vol. 34, no. 4, pp. 1–22, 2021.
[22] Y. Hou, H. G. Han, and J. Qiao, “Adaptive multi-objective dif-ferential evolution algorithm based on the dynamic parame-ters adjustment,” Control and Decision, vol. 32, no. 11,pp. 1985–1990, 2017.
[23] M. Zhou, Y. X. Lin, N. Zhao, Q. Jiang, X. L. Yang, and Z. S.Tian, “IndoorWLAN intelligent target intrusion sensing usingray-aided generative adversarial network,” IEEE Transactionson Emerging Topics in Computational Intelligence, vol. 4,no. 1, pp. 61–73, 2020.
[24] L. N. Deng and X. F. Yao, “Research on the fusion algorithm ofinfrared and visible images based on non-subsampled shearlettransform,” Tien Tzu Hsueh Pao/Acta Electronica Sinica,vol. 45, no. 12, pp. 2965–2970, 2017.
[25] Z. Hao, Z. Lou, and Y. Fan, “Study on the evolution mecha-nism of subsurface defects in nickel-based single crystal alloyduring atomic and close-to-atomic scale cutting,” Journal ofManufacturing Processes, vol. 68, no. 3, pp. 14–33, 2021.
[26] H. Xie, “Research and case analysis of apriori algorithm basedon mining frequent item-sets,” Open Journal of Social Sciences,vol. 9, no. 4, pp. 458–468, 2021.
[27] X. Xu, D. Cui, Y. Li, and Y. Xiao, “Research on ship trajectoryextraction based on multi-attribute DBSCAN optimisation
algorithm,” Polish Maritime Research, vol. 28, no. 1, pp. 136–148, 2021.
[28] C. You, Q. Li, W. Li, and B. Xu, “Research on healthy evolutionand driving mechanism of cultivated land utilization system inChongqing based on PSR-TOPSIS model,” Advance in Agri-culture Science, vol. 2, no. 4, pp. 149–165, 2020.
[29] H. Jia, Z. Wei, X. He, and M. Li, “A research on lane markingdetection algorithm based on neural network and least squaresmethod,” Qiche Gongcheng/Automotive Engineering, vol. 40,no. 3, pp. 363–368, 2018.
14 Journal of Sensors