evidence report/technology assessment no. 176: … report/technology assessment number 176 maternal...
TRANSCRIPT

Evidence Report/Technology Assessment Number 176
Maternal and Neonatal Outcomes of Elective Induction of Labor Prepared for: Agency for Healthcare Research and Quality U.S. Department of Health and Human Services 540 Gaither Road Rockville, MD 20850 www.ahrq.gov Contract No. 290-02-0017 Prepared by: Stanford University–UCSF Evidence-based Practice Center, Stanford, CA Investigators Aaron B. Caughey, M.D., M.P.P., M.P.H., Ph.D. Vandana Sundaram, M.P.H. Anjali J. Kaimal, M.D. Yvonne W. Cheng, M.D., M.P.H. Allison Gienger, B.A. Sarah E. Little, M.D. Jason F. Lee, M.P.H. Luchin Wong, MD, M.P.H. Brian L. Shaffer, M.D. Susan H. Tran, M.D. Amy Padula, M.P.H. Kathryn M. McDonald, M.M. Elisa F. Long, Ph.D. Douglas K. Owens, M.D., M.S. Dena M. Bravata, M.D., M.S. AHRQ Publication No. 09-E005 March 2009


This document is in the public domain and may be used and reprinted without permission except those copyrighted materials noted for which further reproduction is prohibited without the specific permission of copyright holders.
Suggested Citation: Caughey AB, Sundaram V, Kaimal AJ, Cheng YW, Gienger A, Little SE, Lee JF, Wong L, Shaffer BL, Tran SH, Padula A, McDonald KM, Long EF, Owens DK, Bravata DM. Maternal and Neonatal Outcomes of Elective Induction of Labor. Evidence Report/Technology Assessment No. 176. (Prepared by the Stanford University-UCSF Evidenced-based Practice Center under contract No. 290-02-0017.) AHRQ Publication No. 09-E005. Rockville, MD.: Agency for Healthcare Research and Quality. March 2009.
The investigators do no have any affiliations or financial involves that conflict with the material presented in this report.
ii

Preface The Agency for Healthcare Research and Quality (AHRQ), through its Evidence-Based Practice Centers (EPCs), sponsors the development of evidence reports and technology assessments to assist public- and private-sector organizations in their efforts to improve the quality of health care in the United States. The reports and assessments provide organizations with comprehensive, science-based information on common, costly medical conditions and new health care technologies. The EPCs systematically review the relevant scientific literature on topics assigned to them by AHRQ and conduct additional analyses when appropriate prior to developing their reports and assessments. To bring the broadest range of experts into the development of evidence reports and health technology assessments, AHRQ encourages the EPCs to form partnerships and enter into collaborations with other medical and research organizations. The EPCs work with these partner organizations to ensure that the evidence reports and technology assessments they produce will become building blocks for health care quality improvement projects throughout the Nation. The reports undergo peer review prior to their release. AHRQ expects that the EPC evidence reports and technology assessments will inform individual health plans, providers, and purchasers as well as the health care system as a whole by providing important information to help improve health care quality. We welcome comments on this evidence report. They may be sent by mail to the Task Order Officer named below at: Agency for Healthcare Research and Quality, 540 Gaither Road, Rockville, MD 20850, or by e-mail to [email protected].
Margaret Coopey, R.N., M.G.A., M.P.S. EPC Program Task Order Officer Agency for Healthcare Research and Quality
Jean Slutsky, P.A., M.S.P.H. Director, Center for Outcomes and Evidence Agency for Healthcare Research and Quality
Carolyn M. Clancy, M.D. Director Agency for Healthcare Research and Quality
Beth A. Collins Sharp, Ph.D., R.N. Director, EPC Program Agency for Healthcare Research and Quality
iii

Acknowledgments
We thank Marilyn Tinsley at the Stanford University Lane Library for her help with the literature searches. We also acknowledge with much gratitude our expert advisors and peer reviewers who are listed in Appendix E.
iv

Structured Abstract Background. Induction of labor is on the rise in the U.S., increasing from 9.5 percent in 1990 to 22.1 percent in 2004. Although, it is not entirely clear what proportion of these inductions are elective (i.e. without a medical indication), the overall rate of induction of labor is rising faster than the rate of pregnancy complications that would lead to a medically indicated induction. However, the maternal and neonatal effects of induction of labor are unclear. Many studies compare women with induction of labor to those in spontaneous labor. This is problematic, because at any point in the management of the woman with a term gestation, the clinician has the choice between induction of labor and expectant management, not spontaneous labor. Expectant management of the pregnancy involves nonintervention at any particular point in time and allowing the pregnancy to progress to a future gestational age. Thus, women undergoing expectant management may go into spontaneous labor or may require indicated induction of labor at a future gestational age. Objectives. The Stanford-UCSF Evidence-Based Practice Center examined the evidence regarding four Key Questions: 1) What evidence describes the maternal risks of elective induction versus expectant management? 2) What evidence describes the fetal/neonatal risks of elective induction versus expectant management? 3) What is the evidence that certain physical conditions/patient characteristics are predictive of a successful induction of labor? and 4) How is a failed induction defined? Methods. We performed a systematic review to answer the Key Questions. We searched MEDLINE® (1966-2007) and bibliographies of prior systematic reviews and the included studies for English language studies of maternal and fetal outcomes after elective induction of labor. We evaluated the quality of included studies. When possible, we synthesized study data using random effects models. We also evaluated the potential clinical outcomes and cost-effectiveness of elective induction of labor versus expectant management of pregnancy labor at 41, 40, and 39 weeks’ gestation using decision-analytic models. Results. Our searches identified 3,722 potentially relevant articles, of which 76 articles met inclusion criteria. Nine RCTs compared expectant management with elective induction of labor. We found that overall, expectant management of pregnancy was associated with an approximately 22 percent higher odds of cesarean delivery than elective induction of labor (OR 1.22, 95 percent CI 1.07-1.39; absolute risk difference 1.9, 95 percent CI: 0.2-3.7 percent). The majority of these studies were in women at or beyond 41 weeks of gestation (OR 1.21, 95 percent CI 1.01-1.46). In studies of women at or beyond 41 weeks of gestation, the evidence was rated as moderate because of the size and number of studies and consistency of the findings. Among women less than 41 weeks of gestation, there were three trials which reported no difference in risk of cesarean delivery among women who were induced as compared to expectant management (OR 1.73; 95 percent CI: 0.67-4.5, P=0.26), but all of these trials were small, non-U.S., older, and of poor quality. When we stratified the analysis by country, we found that the odds of cesarean delivery were higher in women who were expectantly managed compared to
v

elective induction of labor in studies conducted outside the U.S. (OR 1.22; 95 percent CI 1.05-1.40) but were not statistically different in studies conducted in the U.S. (OR 1.28; 95 percent CI 0.65-2.49). Women who were expectantly managed were also more likely to have meconium-stained amniotic fluid than those who were electively induced (OR 2.04; 95 percent CI: 1.34-3.09). Observational studies reported a consistently lower risk of cesarean delivery among women who underwent spontaneous labor (6 percent) compared with women who had an elective induction of labor (8 percent) with a statistically significant decrease when combined (OR 0.63; 95 percent CI: 0.49-0.79), but again utilized the wrong control group and did not appropriately adjust for gestational age. We found moderate to high quality evidence that increased parity, a more favorable cervical status as assessed by a higher Bishop score, and decreased gestational age were associated with successful labor induction (58 percent of the included studies defined success as achieving a vaginal delivery anytime after the onset of the induction of labor; in these instances, induction was considered a failure when it led to a cesarean delivery).
In the decision analytic model, we utilized a baseline assumption of no difference in cesarean delivery between the two arms as there was no statistically significant difference in the U.S. studies or in women prior to 41 0/7 weeks of gestation. In each of the models, women who were electively induced had better overall outcomes among both mothers and neonates as estimated by total quality-adjusted life years (QALYs) as well as by reduction in specific perinatal outcomes such as shoulder dystocia, meconium aspiration syndrome, and preeclampsia. Additionally, induction of labor was cost-effective at $10,789 per QALY with elective induction of labor at 41 weeks of gestation, $9,932 per QALY at 40 weeks of gestation, and $20,222 per QALY at 39 weeks of gestation utilizing a cost-effectiveness threshold of $50,000 per QALY. At 41 weeks of gestation, these results were generally robust to variations in the assumed ranges in univariate and multi-way sensitivity analyses. However, the findings of cost-effectiveness at 40 and 39 weeks of gestation were not robust to the ranges of the assumptions. In addition, the strength of evidence for some model inputs was low, therefore our analyses are exploratory rather than definitive. Conclusions. Randomized controlled trials suggest that elective induction of labor at 41 weeks of gestation and beyond may be associated with a decrease in both the risk of cesarean delivery and of meconium-stained amniotic fluid. The evidence regarding elective induction of labor prior to 41 weeks of gestation is insufficient to draw any conclusion. There is a paucity of information from prospective RCTs examining other maternal or neonatal outcomes in the setting of elective induction of labor. Observational studies found higher rates of cesarean delivery with elective induction of labor, but compared women undergoing induction of labor to women in spontaneous labor and were subject to potential confounding bias, particularly from gestational age. Such studies do not inform the question of how elective induction of labor affects maternal or neonatal outcomes. Elective induction of labor at 41 weeks of gestation and potentially earlier also appears to be a cost-effective intervention, but because of the need for further data to populate these models our analyses are not definitive. Despite the evidence from the prospective, RCTs reported above, there are concerns about the translation of such findings into actual practice, thus, there is a great need for studying the translation of such research into settings where the majority of obstetric care is provided.
vi

Contents Executive Summary ........................................................................................................................ 1 Chapter 1. Introduction ................................................................................................................. 21
Gestational Age and Elective Induction of Labor..................................................................... 23 Key Questions and Analytic Framework.................................................................................. 25 Organization of This Report ..................................................................................................... 26
Chapter 2. Systematic Review of Elective Induction of Labor ................................................... 27
Systematic Review Methods..................................................................................................... 27 Topic Development............................................................................................................... 27 Search Strategy ..................................................................................................................... 27 Study Selection ..................................................................................................................... 27 Data Extraction ..................................................................................................................... 28 Quality Assessment and Applicability of Included Studies.................................................. 29 Data Synthesis....................................................................................................................... 33 Peer Review .......................................................................................................................... 34
Systematic Review Results ....................................................................................................... 35 Elective Induction of Labor Studies ..................................................................................... 36 Overall Quality and Applicability of Included Studies......................................................... 41 Key Question 1: What evidence describes the maternal risks of elective induction versus expectant management?............................................................................................. 43
Randomized controlled trials of elective induction of labor............................................. 43 Observational studies of elective induction of labor......................................................... 54
Summary of evidence addressing Key Question 1: What evidence describes the maternal risks of elective induction versus expectant management? ................................... 64 Key Question 2: What evidence describes the fetal/neonatal risks of elective induction versus expectant management?............................................................................. 67
Randomized controlled trials of elective induction of labor............................................. 67 Observational studies of elective induction of labor......................................................... 74 Summary of evidence addressing Key Question 2: What evidence describes the fetal/neonatal risks of elective induction versus expectant management?........................ 81
Key Question 3: What is the evidence that certain physical conditions/patient characteristics (e.g., parity, cervical dilatation, previous pregnancy outcome) are predictive of a successful induction of labor?....................................................................... 82 Summary of evidence assessing Key Question 3: What is the evidence that certain physical conditions/patient characteristics (e.g., parity, cervical dilatation, previous pregnancy outcome) are predictive of a successful induction of labor?............................... 89 Key Question 4: Definition of Successful Labor Induction.................................................. 90
Chapter 3. Decision Analytic Model of Elective Induction of Labor.......................................... 93
Decision Analytic Model Methods ........................................................................................... 93 Decision Analytic Model Results ........................................................................................... 105
Induction of labor at 41 weeks versus expectant management from 41-42 weeks......... 105 Induction of labor at 40 weeks versus expectant management from 40-41 weeks......... 111
vii

Induction of labor at 39 weeks versus expectant management from 39-40 weeks and expectant management from 39-41 weeks............................................................... 116
Chapter 4. Discussion ................................................................................................................. 125
Importance of Methodologic Differences Between Interventional and Observational Studies ............................................................................................................. 126
Preventive Induction of Labor ............................................................................................ 127 Predictors of Mode of Delivery in the Setting of Induction ................................................... 129
Gestational Age at Delivery................................................................................................ 130 Maternal Age ...................................................................................................................... 130 Obesity ................................................................................................................................ 130
Diagnostic Bias with Identifying Predictors of a Successful Induction of Labor................... 131 How Successful Induction of Labor was Defined .................................................................. 131 Decision Analytic Outcomes .................................................................................................. 132 Elective Induction of Labor—From Evidence to Actual Practice .......................................... 135 Limitations of This Report...................................................................................................... 137
Limitations of the Review................................................................................................... 137 Limitations of the Existing Evidence.................................................................................. 137 Limitations of Decision Analysis........................................................................................ 138
Future Research Considerations ............................................................................................. 139 Elective Induction of Labor Versus Expectant Management of Pregnancy ....................... 139 Study Design....................................................................................................................... 142 Stratified Randomization .................................................................................................... 143 Data Analysis ...................................................................................................................... 143 Predictors of a Successful Induction of Labor.................................................................... 143 Definitions of a Successful Induction of Labor .................................................................. 144
Conclusions............................................................................................................................. 144 References and Included Studies ................................................................................................ 145 List of Acronyms and Abbreviations.......................................................................................... 153 Tables Table A. Definition of induction of labor success .......................................................................... 7 Table B. Clinical outcomes per 10,000 women for induction of labor at 41 weeks versus expectant management.................................................................................................................. 11 Table C. Clinical outcomes per 10,000 women for induction of labor at 40 weeks versus expectant management until 41 weeks ......................................................................................... 12 Table D. Clinical outcomes per 10,000 women for induction of labor at 39 weeks versus expectant management until 40 or 41 weeks ................................................................................ 12 Table E. Sample Size Estimates for Prospective Trial of Elective Induction of Labor as Compared to Expectant Management of Pregnancy..................................................................... 15 Table 2.1. RCTs of elective induction of labor: Study information ............................................. 37
viii

Table 2.2. Observational studies of elective induction of labor: Study information .................... 38 Table 2.3. RCTs of elective induction of labor studies: Other maternal outcomes ...................... 53 Table 2.4. RCTs of elective induction of labor studies: Other maternal outcomes among multiparous women....................................................................................................................... 53 Table 2.5. Observational studies of elective induction of labor: Other maternal outcomes......... 62 Table 2.6. Observational studies of elective induction of labor in nulliparous women: Other maternal outcomes .............................................................................................................. 63 Table 2.7. Observational studies of elective induction of labor in multiparous women: Other maternal outcomes .............................................................................................................. 64 Table 2.8. RCTs of elective induction of labor versus expectant management: Other neonatal outcomes......................................................................................................................... 73 Table 2.9. Observational studies of elective induction of labor versus spontaneous labor: Other neonatal outcomes............................................................................................................... 79 Table 2.10. Cohort studies of elective induction of labor versus spontaneous labor in nulliparous women: Other neonatal outcomes.............................................................................. 80 Table 2.11. Cohort studies of elective induction of labor versus spontaneous labor in multiparous women: Other neonatal outcomes............................................................................. 80 Table 2.12. Cesarean deliveries (following induction of labor) by Bishop score......................... 87 Table 2.13. Cesarean deliveries (following induction of labor) by gestational age ..................... 89 Table 2.14. Cesarean deliveries (following induction of labor) by amniotic fluid index (AFI) ............................................................................................................................................. 89 Table 2.15. Definition of Induction of Labor Success.................................................................. 91 Table 3.1. Probability estimates.................................................................................................. 101 Table 3.2. Utility estimates ......................................................................................................... 104 Table 3.3. Cost estimates ............................................................................................................ 104 Table 3.4. Decision analytic results for induction of labor at 41 weeks versus expectant management ................................................................................................................................ 105 Table 3.5. Clinical outcomes per 10,000 women for induction of labor at 41 weeks versus expectant management................................................................................................................ 106 Table 3.6. Decision analytic results with varying assumptions in cesarean delivery rates ........ 107 Table 3.7. Clinical outcomes with various assumptions in the cesarean delivery rate............... 107 Table 3.8. Cost-effectiveness of an induction versus expectant management at 41 weeks under various cesarean delivery rate assumptions ...................................................................... 108 Table 3.9. Decision analytic results for induction of labor at 41 weeks versus expectant management ................................................................................................................................ 111 Table 3.10. Clinical outcomes per 10,000 women for induction of labor at 40 weeks versus expectant management until 41 weeks ............................................................................ 111 Table 3.11. Decision analytic results with varying assumptions in cesarean delivery rates ...... 112 Table 3.12. Clinical outcomes with various assumptions in the cesarean delivery rate............. 112 Table 3.13. Cost and Cost-Effectiveness for induction versus expectant management under various cesarean delivery rate assumptions ...................................................................... 113 Table 3.14. Decision analytic results for induction of labor at 39 weeks versus expectant management ................................................................................................................................ 116 Table 3.15. Clinical outcomes per 10,000 women for induction of labor at 39 weeks versus expectant management until 40 or 41 weeks................................................................... 116 Table 3.16. Decision analytic results with varying assumptions in cesarean delivery rates ...... 117
ix

Table 3.17. Clinical outcomes with various assumptions in the cesarean delivery rate............. 118 Table 3.18. Cost and cost-effectiveness for induction versus expectant management under various cesarean delivery rate assumptions ................................................................................ 119 Table 4.1. Upper Limit of Optimal Time of Delivery Calculation Table................................... 128 Table 4.2. Sample size estimates for prospective trial of elective induction of labor as compared to expectant management of pregnancy..................................................................... 142 Figures Figure A. Schematic of Decision Tree for 41 week model............................................................. 9 Figure B. Mode of delivery for 39, 40, and 41 week models ...................................................... 10 Figure 1.1.A. Comparison of induction of labor to controls by week of gestation ...................... 24 Figure 1.1.B. Comparison of induction of labor to expectant management ................................. 24 Figure 2.1. Literature search ......................................................................................................... 37 Figure 2.2. Quality assessment of RCTs of elective induction of labor ....................................... 41 Figure 2.3. Quality assessment of observational studies of elective induction of labor............... 42 Figure 2.4. Maternal outcomes reported ....................................................................................... 43 Figure 2.5. RCTs of elective induction of labor versus expectant management: Cesarean delivery ......................................................................................................................................... 45 Figure 2.6. RCTs of elective induction of labor versus expectant management: Cesarean delivery, stratified by gestational age ........................................................................................... 46 Figure 2.7. RCTs of elective induction of labor versus expectant management: Cesarean delivery, stratified by study year................................................................................................... 47 Figure 2.8. RCTs of elective induction of labor versus expectant management: Cesarean delivery, stratified by study location............................................................................................. 48 Figure 2.9. RCTs of elective induction of labor versus expectant management: Operative vaginal delivery............................................................................................................................. 51 Figure 2.10. RCTs of elective induction of labor versus expectant management: Operative vaginal delivery, stratified by study year ..................................................................... 52 Figure 2.11. Observational studies of elective induction of labor versus spontaneous labor: Cesarean delivery ............................................................................................................... 56 Figure 2.12. Observational studies of elective induction of labor versus spontaneous labor: Cesarean delivery among nulliparous women.................................................................... 57 Figure 2.13. Observational studies of elective induction of labor versus spontaneous labor: Cesarean delivery among multiparous women................................................................... 58 Figure 2.14. Observational studies of elective induction of labor versus spontaneous labor: Operative vaginal delivery.................................................................................................. 60 Figure 2.15. Observational studies of elective induction of labor versus spontaneous labor: operative vaginal delivery among nulliparous women....................................................... 61 Figure 2.16. Neonatal outcomes reported ..................................................................................... 67 Figure 2.17. RCTs of elective induction of labor versus expectant management: 5-minute Apgar score less than 7 ................................................................................................................. 70 Figure 2.18. RCTs of elective induction of labor versus expectant management: Meconium-stained amniotic fluid ................................................................................................. 71 Figure 2.19. RCTs of elective induction of labor versus expectant management: Meconium aspiration syndrome.................................................................................................... 72
x

Figure 2.20. Observational studies of elective induction of labor versus spontaneous labor: 5-minute Apgar score less than 7 ....................................................................................... 75 Figure 2.21. Observational studies of elective induction of labor versus spontaneous labor: Meconium-stained amniotic fluid....................................................................................... 76 Figure 2.22. Observational studies of elective induction of labor versus spontaneous labor: NICU admissions................................................................................................................ 78 Figure 2.23. Cesarean delivery predictors reported ...................................................................... 84 Figure 2.24. Cesarean deliveries (following induction) by parity: Cohort studies....................... 85 Figure 2.25. Nulliparity in expectant management and elective induction of labor groups and cesarean delivery odds ratio between the two groups............................................................ 86 Figure 2.26. Mean nulliparity rate and cesarean delivery odds ratio between the two groups............................................................................................................................................ 86 Figure 2.27. Mean maternal age in RCTs as a predictor of the odds of cesarean delivery between induced labor and expectant management...................................................................... 88 Figure 3.1. Schematic of Decision Tree for 41 week model ........................................................ 95 Figure 3.2. Mode of delivery for 39, 40, and 41 week models..................................................... 96 Figure 3.3. Maternal and Neonatal outcomes for 39, 40, and 41 week models............................ 97 Figure 3.4. Schematic of Decision Tree for 40 week model ........................................................ 98 Figure 3.5. Schematic of Decision Tree for 39 week model ...................................................... 100 Figure 3.6. Sensitivity analysis varying relative risk of cesarean delivery with induction ........ 108 Figure 3.7. Sensitivity analysis varying probability of spontaneous labor before 42 weeks...... 109 Figure 3.8. Incremental cost effectiveness for induction of labor compared with expectant management at 41 weeks ............................................................................................................ 110 Figure 3.9. Acceptability curve................................................................................................... 110 Figure 3.10. Sensitivity analysis varying relative risk of cesarean delivery with induction ...... 113 Figure 3.11. Sensitivity analysis varying probability of spontaneous labor ............................... 114 Figure 3.12. Monte Carlo simulation of induction of labor versus expectant management at 40 weeks of gestation.............................................................................................................. 115 Figure 3.13. Acceptability curve................................................................................................ 115 Figure 3.14. Sensitivity analysis on relative rate of cesarean delivery with IOL at 39 weeks........................................................................................................................................... 120 Figure 3.15. Sensitivity analysis on probability of Spontaneous Labor 39-40 weeks................ 120 Figure 3.16. Net monetary benefit (willingness to pay = 50000) sensitivity analysis on relative risk of cesarean delivery IOL at 39 weeks and probability of spontaneous labor at 39 weeks...................................................................................................................................... 121 Figure 3.17. New monetary benefit (willingness to pay = 50000) sensitivity analysis on relative risk of cesarean delivery IOL and additional cost of labor induction............................ 121 Figure 3.18. Net monetary benefit (willingness to pay = 50000) sensitivity analysis on probability of spontaneous labor and additional cost of labor induction.................................... 122 Figure 3.19. Cost-Effectiveness Induction of labor at 39 weeks versus expectant management until 40 weeks........................................................................................................ 122 Figure 3.20. Acceptability Curve................................................................................................ 123 Appendixes and Evidence Tables for this report are provided electronically at http://www.ahrq.gov/downloads/pub/evidence/pdf/elindlabor/eil.pdf.
xi

Executive Summary
Introduction Induction of labor is increasing in the U.S. The overall induction rate has increased
from 9.5 percent in 1990 to 22.1 percent in 2004. Induction of labor that is not indicated for a medical reason, also termed elective induction of labor, appears to be rising as well and at a rate even more rapidly than that of the overall induction of labor. Elective induction may be motivated by a variety of reasons. For example, pregnant women may wish to end their pregnancy because of physical discomfort, concern for rapidly progressing labor precluding timely arrival at the hospital or epidural placement, scheduling issues, or ongoing concerns for maternal, fetal, or neonatal complications. Clinicians who care for pregnant women (e.g., obstetricians, family-practice physicians, midwives) may have similar non-medical reasons for choosing elective induction of labor for their patients. They, too, may wish to end their patients’ physical discomfort or have concerns about either distance from the hospital or ongoing risk in the pregnancy. However, clinicians may also be incentivized to utilize elective induction for their own financial benefit and scheduling preferences. Thus, it is imperative to determine the potential outcomes associated with elective induction of labor.
Elective induction of labor necessarily reduces some risks of an ongoing pregnancy. Such risks include developing preeclampsia, oligohydramnios, macrosomia, or intrauterine fetal demise at a later gestational age. However, the commonly held dogma regarding induction of labor is that it increases the risk of cesarean delivery, which in turn is associated with a host of maternal complications. Additionally, a cesarean delivery in the current pregnancy increases both maternal and neonatal risks in future pregnancies. Thus, determining the effect of elective induction of labor on cesarean delivery as well as other maternal and neonatal outcomes is important.
When evaluating the risks and benefits of elective induction of labor, it is essential that women having elective induction of labor be compared to women having expectant management of labor. Expectant management of the pregnancy involves nonintervention at any particular point in time and allowing the pregnancy to progress to a future gestational age. Thus, the woman undergoing expectant management may go into spontaneous labor or may require indicated induction of labor at a future gestation due to developing preeclampsia, nonreassuring antenatal testing, or postterm pregnancy. One methodologic problem with many studies of induction of labor, particularly observational studies, is that they often use women in spontaneous labor as a control group. This is problematic because at any point in the term pregnancy the clinician has the choice between induction of labor and expectant management, not spontaneous labor. Since increasing gestational age itself is associated with cesarean delivery, these studies are fundamentally flawed and can lead to misleading conclusions. Key Questions
With this background in mind, we sought to conduct a systematic review and decision analysis utilizing the existing literature in order to answer several questions regarding the
1

effects of elective induction of labor. Specifically, we sought to answer the following Key Questions: Key Question 1: What evidence describes the maternal risks of elective induction versus expectant management? Key Question 2: What evidence describes the fetal/neonatal risks of elective induction versus expectant management? Key Question 3: What is the evidence that certain physical conditions/patient characteristics (e.g., parity, cervical dilatation, previous pregnancy outcome) are predictive of a successful induction of labor? Key Question 4: How is failed induction defined?
Systematic Review of Elective Induction of Labor Methods
We searched MEDLINE® to identify English-language studies of induction of labor published from January 1966 to May 2007. We also manually reviewed the reference lists of included articles and bibliographies of systematic reviews of induced labor to identify relevant articles.
Inclusion criteria. We included randomized controlled trials (RCT), cohort and case-control studies that compared women who had undergone induced labor without a specific indication, prior to 42 0/7 weeks gestational age, with women who were either managed expectantly or had spontaneous labor. We defined elective induction as induction of labor at or after 37 0/7 weeks and prior to 42 0/7 weeks of gestation without a maternal or fetal indication. Elective induction of labor studies were included only if the article reported mode of delivery (cesarean, vaginal or operative), maternal or neonatal outcomes. We also included all induction of labor studies (irrespective of whether or not the induction was elective) if the article reported predictors of success or failure for induction. Multiple articles on the same population were included once in our analysis. .
Data extraction. Two authors independently reviewed the title and abstract of each study to assess whether the article met inclusion criteria. Conflicts regarding data abstraction were resolved by re-review and discussion. From each included article, we extracted the following information: Study period, location and setting of study, whether or not the induction was elective, induction method, study design, definition of successful induction, inclusion and exclusion criteria (for elective induction of labor studies), mode of delivery, maternal and neonatal outcomes for all patients and stratified by parity (for elective induction of labor studies), predictors of failed induction (for all induction of labor studies) and quality assessment information.
Quality assessment. Consistent with the AHRQ draft Methods Guide for Conducting Comparative Effectiveness Reviews, we developed specific criteria for evaluating the quality of the individual included studies and for assessing the applicability of these studies to the Key Questions. We then graded the overall quality of the literature addressing each of the Key Questions. For our quality assessment, individual studies were evaluated with respect to study design, measurement of outcomes, sample size, and
2

statistical analyses. These assessments were summarized as a good, fair, or poor rating for each individual study. We assessed the applicability of the individual studies to the Key Questions by evaluating the population studied, place and time the study was conducted, and methods of induction utilized. Individual applicability was assessed as good, fair, or poor. To grade the overall strength of evidence, we considered the quality and applicability of the individual studies, the consistency of the results across the included studies, and volume of the literature for each of the Key Questions. We assigned a grade of high, moderate, low, or insufficient to each of the items.
Data analysis. To evaluate the maternal and fetal/neonatal risks of elective induction versus expectant management, we computed two summary effect sizes for each outcome of interest that was reported in more than four studies using random effects models: A summary odds ratio and a summary risk difference. To minimize heterogeneity, we synthesized studies on the basis of study design. We assessed statistical heterogeneity for summary effects by calculating the Q statistic (considered Q statistics with p <0.05 as heterogeneous) and I2 statistic (considered I2 statistics greater than 50 percent as heterogeneous). We also performed sensitivity analyses to evaluate the robustness of our results and assessed our results for publication bias. Systematic Review Results
We reviewed 3,722 articles of which 76 met inclusion criteria: 34 studies examined elective induction of labor and associated outcomes, including 11 RCTs which compared women with elective induction of labor to expectant management (nine studies) or spontaneous labor (two studies). We identified 42 observational studies of induction of labor and predictors of induction success (nearly all of which compared women who had elective induction of labor to women with spontaneous labor). We present our results below as responses to the Key Questions. Key Question 1: What evidence describes the maternal risks of elective induction versus expectant management?
Cesarean delivery. Of the nine RCTs that compared cesarean delivery among women who had elective induction of labor with those with expectant management, the combined summary odds ratio slightly favored elective induction of labor. Expectant management of pregnancy was associated with an approximately 22 percent increase in cesarean delivery (OR=1.22; 95 percent CI 1.07-1.39, P=0.003) and an absolute risk difference of nearly two percent (95 percent CI: 0.2 percent to 4 percent, P=0.033). The majority of these studies were in women at or beyond 41 0/7 weeks of gestation (OR 1.21, 95 percent CI 1.01-1.46). Three trials reported no difference in risk of cesarean delivery among women who were induced at less than 41 0/7 weeks gestational age (OR 1.73, 95 percent CI: 0.67-4.5, P=0.26) but all of these trials were of poor quality, thus there is insufficient evidence to make conclusions as to outcomes before 41 0/7 weeks. Only three studies addressed whether parity affected the risk of cesarean delivery between expectant management and electively induced labor; these studies reported no difference in risk for nulliparas and there was insufficient information to draw any conclusions on the risk for multiparas. When we stratified the studies to those conducted
3
in or prior to 1990 and those conducted after 1990, there was no statistically significant difference in the odds of cesarean delivery for either of the two groups. When we stratified the analysis by country, we found moderate evidence that the odds of cesarean delivery were higher in women who were expectantly managed compared to elective induction of labor in studies conducted outside the U.S. (OR 1.21; 95 percent CI 1.05-1.40) but were not different in studies conducted in the U.S. (OR 1.28; 95 percent CI 0.65-2.49). The observational studies reported a consistently lower risk of cesarean delivery among women who underwent spontaneous labor (six percent) compared with women who had an elective induction of labor (eight percent) with a statistically significant decrease when combined (OR 0.63; 95 percent CI: 0.49-0.79). The principal reason for this difference in findings between the two types of studies is likely the different control groups used by the included studies. Since the clinical scenario faced by practitioners is induction of labor now versus expectant management with either induction or spontaneous labor at a later date, gestational age is an important confounding factor, which may bias the estimate of effect on induction when induction is compared to spontaneous labor.
Operative vaginal delivery. An operative vaginal delivery consists of either a forceps- or vacuum-assisted vaginal delivery. Most of the six RCTs that examined the effect of elective induction of labor on operative vaginal delivery were small to medium-sized studies (only one study had 1700 women in each arm). There is moderate evidence that the odds of operative vaginal delivery were not statistically significantly different between women who were electively induced or expectantly managed (OR=0.91; 95 percent CI 0.79-1.04, P=0.18). Three RCTs reported no difference in the risk of operative vaginal delivery among women who were induced at less than 41 0/7 weeks gestational age (OR 0.71, 95 percent CI: 0.41-1.21, P=0.21), but all of these trials were of poor quality. For the seven observational studies, there was no significant difference in the risk of operative vaginal delivery between women in spontaneous labor compared to elective labor induction (OR=0.91; 95 percent CI 0.78-1.05, P=0.18). Although the observational studies involved more women, they were heterogeneous. Given the consistency of the findings in both RCTs and observational studies for a lack of difference in the risk of operative vaginal delivery, there is only moderate evidence regarding the relationship between elective induction of labor and operative vaginal delivery.
Length of labor. None of the included studies evaluated “prolonged labor” as a primary outcome. One RCT from Norway that included 508 women evaluated “prolonged first and second stages of labor” and found no statistically significant difference between women who were electively induced or expectantly managed. Four observational studies examined “mean duration of first and second stages of labor.” Only one of these studies that included 253 women in each group found a significant difference in the mean length of the first stage of labor in women who had elective induction of labor compared to spontaneous labor (6.0 versus 7.2 hours, respectively; P=0.008); the others reported no difference in length of labor. Given the limited evidence further information is needed to evaluate the effect of elective labor induction on the duration of labor. No studies reported or compared the median duration of labor. Thus, there is insufficient evidence addressing length of labor and elective induction of labor.
Maternal infections. Six studies (three RCTs and three observational) reported presence or absence of maternal infection; however, none provided detailed quantitative
4

data such as risk ratios or risk differences. Four studies (two RCTs, two observational) provided some evidence that elective induction was not associated with an increased risk of chorioamnionitis and two observational studies provided some evidence that elective induction was not associated with an increased risk of endomyometritis. Thus, given the consistency in these findings, but the modest amount of available data, there is low quality evidence regarding the association of maternal infections and elective induction of labor. Maternal blood loss and hemorrhage. Four studies (one RCT and three observational) evaluated the association between elective induction and postpartum hemorrhage and found no association. However, these studies likely lacked adequate statistical power to detect a difference. One RCT examined rates of blood transfusion between elective induction (2/265 [0.75 percent]) versus expectant management (3/175 [1.7 percent]) and found no statistically significant difference. No studies reported mean estimated blood loss as an outcome of interest. Thus, given the minimal amount of data and the lack of statistical power to examine this question, there is insufficient evidence to assess the assocation of maternal blood loss and elective induction of labor. Key Question 2: What evidence describes the fetal/neonatal risks of elective induction versus expectant management?
Meconium stained amniotic fluid. There were six RCTs with a total of 5,478 women that examined whether the presence of meconium-stained amniotic fluid was associated with elective induction of labor. Women who were expectantly managed were more likely to have meconium stained amniotic fluid than those electively induced (OR 2.04; 95 percent CI 1.34-3.09). However, a high degree of heterogeneity existed among these studies. Only one randomized controlled trial evaluated this outcome among women who were induced at less than 41 0/7 weeks gestation and found a lower risk for the presence of meconium among women who were electively induced. Given the consistency of the findings and the quality of the individual studies, which ranged from poor to good, there is moderate evidence regarding the increased presence of meconium with elective induction of labor.
Meconium aspiration syndrome. Five RCTs, which ranged in size from 300 to 3000 participants and were of poor to good quality, provided somewhat conflicting results regarding the effect of elective induction on meconium aspiration syndrome. While two of the studies found higher rates of meconium aspiration in the setting of expectant management, these differences were not quite statistically significant and the other three studies found no difference. Overall, there was no difference in the risk of meconium aspiration syndrome to neonates between the two groups of women (OR 1.39; 95 percent CI 0.71-2.72). Thus, there are insufficient data to fully characterize the presence and strength of this association
Apgar score less than 7 at 5 minutes. Thirteen studies (four RCTs and nine observational) provided some evidence that the rate of 5-minute Apgar score less than 7 was no different between women with elective induction of labor compared to expectant management/spontaneous labor. The summary odds ratio from the RCTs was 1.18 (95 percent CI: 0.67-2.06). None of the RCTs reported this outcome among women who were induced at less than 41 0/7 weeks gestation. Given the relatively wide confidence
5

interval, the fact that this outcome is relatively uncommon and maybe lacking adequate power, and the individual quality ratings of the studies, the overall evidence regarding this outcome was rated as low.
Umbilical arterial pH and umbilical arterial base excess. One good and one fair RCT provided evidence that elective induction of labor was not associated with higher rates of neonatal acidemia as measured by umbilical cord gases indicated by umbilical arterial pH (<7.0 or <7.1) and umbilical arterial base excess (<-12). However, there is insufficient evidence to draw conclusions about this a relatively uncommon outcome.
Fetal distress. While two poor-quality, small observational studies reported no difference in rates of fetal distress, one large, good-quality, RCT reported lower rates of fetal distress favoring elective induction of labor. Given the disagreement between the study findings, there is insufficient evidence to describe the association of elective induction of labor and fetal distress.
Respiratory distress syndrome. There is insufficient evidence from one poor quality large cohort study involving 4,472 women that did not observe any cases of respiratory distress syndrome in either group.
Transient tachypnea of the newborn. There is low quality evidence from three fair to good quality RCTs that the risk of transient tachypnea of the newborn was not different in women who had elective induction as compared to expectant management.
Neonatal sepsis. Two good quality, large RCTs examined both the risk of suspected neonatal sepsis and culture-proven sepsis. These two studies did not find that the rates of suspected neonatal sepsis were different in women with elective induction versus expectant management. Given the consistency of these two RCTs, the evidence was rated as low.
Hypoxic-ischemic encephalopathy. No studies designated hypoxic-ischemic encephalopathy as an outcome of interest and the evidence was rated as insufficient.
Birthweight. One RCT involving 302 women reported that the rate of large-for-gestational-age (LGA) neonates was lower in women who were electively induced compared to expectant management. However, three poor quality observational studies provided conflicting results regarding the effect of elective induction of labor on rates of birthweight greater than 4,000 grams.
Three fair to good quality RCTs provided evidence that elective induction of labor reduces the rate of macrosomia (birthweight greater than 4,500 grams). Four observational studies provided conflicting data regarding the effect of elective induction on incidence of birthweight less than 2,500 grams. There is low overall evidence that elective induction of labor reduces LGA and macrosomia.
Neonatal seizures. The two RCTs provided low quality evidence that there is no difference in the risk of neonatal seizure between women who were electively induced or expectantly managed.
Hypoglycemia. The two RCTs (one large and good quality and one medium sized and fair quality) provided low quality evidence that hypoglycemia was not associated with elective induction of labor.
Neonatal jaundice. The tree poor to fair quality studies (two small RCTs and one larger observational case-control) provided low-quality evidence that the risk of neonatal jaundice was not higher in women undergoing elective induction of labor.
6

Neonatal polycythemia. The two relatively large RCTs provided low-quality evidence that the risk of neonatal polycythemia was not different between women undergoing elective induction of labor compared to those who are managed expectantly.
Breastfeeding. One relatively small, poor quality, cohort study from the Netherlands provided insufficient evidence of higher rates of breastfeeding in women who had spontaneous labor than those who had induction of labor. Key Question 3: What is the evidence that certain physical conditions/patient characteristics are predictive of a successful induction of labor?
Whereas the focus of our analysis for the preceding Key Questions focused on the comparative effectiveness of elective induction of labor and expectant management, for this Key Question we included studies of women undergoing induction of labor and also included those that used women in spontaneous labor as the control group as we were only examining the women who were induced.
Parity. Twenty-three studies examined parity as a predictor of cesarean delivery in women undergoing induction of labor. In three RCTs, there was a decreased risk of cesarean delivery among the multiparous women when compared with the nulliparous women (OR 0.21; 95 percent CI: 0.06-0.72). Among the 20 cohort studies, the rate of cesarean delivery was 28 percent among the nulliparous women compared with 10 percent among the multiparous women. When we combined the cohort studies, there was a decreased risk of cesarean delivery among the multiparous women when compared to the nulliparous women (OR 0.27; 95 percent CI 0.16-0.45). Thus, there is high-quality evidence of a decreased risk of cesarean delivery among multiparous women undergoing induction of labor compared with nulliparous women.
Cervical status. Twelve observational studies measured Bishop scores to evaluate cervical status as a predictor of cesarean delivery in women undergoing induction of labor. These studies differed by study design and patient population; however, all reported that the frequency of cesarean delivery was inversely related to Bishop scores such that a higher rate of cesarean delivery was observed in women with a lower Bishop score compared to women with more favorable cervix as represented by higher Bishop scores. Thus, there is moderate evidence that Bishop score is a predictor of cesarean delivery among women undergoing elective induction of labor.
Maternal age. Two observational studies presented conflicting data to support maternal age as a predictor of cesarean delivery in the setting of induction of labor. Thus, the direction of effect could not be adequately determined based on the current literature reviewed and the evidence was rated as insufficient.
Maternal body-mass index. We identified one small prospective cohort study that examined maternal body-mass index as a predictor of cesarean delivery in the setting of induction of labor. The authors found that women with a BMI greater than or equal to 30kg/m2 had a higher frequency of cesarean delivery. We rated the strength of evidence as insufficient given the small-sized, single study of the topic.
Gestational age. Four cohort studies had consistent evidence to provide moderate-quality evidence that increasing gestational age was associated with increased rates of cesarean delivery in the setting of induction of labor.
Amniotic fluid index. Three studies presented conflicting results regarding the level
7

of amniotic fluid index at time of induction of labor and its effect on mode of delivery. The evidence was insufficient to support any conclusions regarding the direction of effect. Key Question 4: How is failed induction defined?
We abstracted the definition of a successful labor induction from our included studies (n=76). While a majority of studies specifically defined successful labor induction, most of them defined failure in terms of mode of delivery (Table A). Just over half the studies (58 percent) defined success as achieving a vaginal delivery anytime after the onset of the induction of labor; in these instances, induction was considered a failure when it led to a cesarean delivery. Other definitions of success included a spontaneous vaginal delivery or achieving a vaginal delivery in a specified amount of time, most commonly 24 hours (but also 6, 12, or 18 hours). One study defined induction of labor success as the onset of labor within 12 hours. Only one study defined induction of labor success as achieving active labor. Table A. Definition of induction of labor success
Definition n/N (%) Vaginal delivery 44/76 (57.9%)1-44 Spontaneous vaginal delivery 16/76 (21.1%)11, 15, 22, 25, 27, 28, 31, 43, 45-52 Vaginal delivery within 24 hours 9/76 (11.8%)1, 5, 13, 53-58 Not Specified 17/76 (22.4%)59-75 Miscellaneous Definitions Used: Vaginal delivery within 6 hours Vaginal delivery within 12 hours Vaginal delivery within 18 hours Labor within 12 hours Active Labor Achieved Delivery within 48 hours of scheduled Induction
1/76 (1.3 %) 76 1/76 (1.3 %) 24 1/76 (1.3 %) 13 1/76 (1.3 %) 41 1/76 (1.3 %) 44 1/76 (1.3 %) 25
Note: Fourteen studies report more than one measure of induction of labor success. 1, 5, 11, 13, 15, 22, 24, 25, 27, 28, 31, 41, 43, 44 Decision Analytic Model of Elective Induction of Labor
While the clinical constraints of the obstetric population limit the number of
management options that can be investigated in a prospective fashion, decision analysis and cost-effectiveness analysis have been used to model the impact of induction strategies on clinical outcomes or cost in certain populations.77, 78 We constructed decision analytic models in order to identify aspects of elective induction of labor that warrant further investigation in future prospective studies. These models were specifically stratified at 39, 40, and 41 weeks of gestation and compared elective induction of labor to expectant management of the pregnancy.
Methods. To address the question of the consequences of induction of labor, and specifically examine what particular outcomes may drive this clinical situation, decision trees were constructed to simulate clinical scenarios in which elective induction of labor might be considered as an alternative to expectant management of the pregnancy. Since medical comorbidities of pregnant women may lead to an indicated induction of labor at
8

any gestational age, the hypothetical cohort entering the decision tree consisted of women with low risk, singleton, vertex gestations. In addition, since nulliparous women tend to incur increased costs during labor, and have a higher likelihood of cesarean delivery in comparison to multiparous patients, in order to provide the most conservative estimate of the consequences of induction of labor, all patients were considered to have the increased risks associated with nulliparity.
Induction of labor for postterm pregnancy is one of the current recommended strategies by the American College of Obstetricians and Gynecologists at 42 0/7 weeks gestation, so the first strategy assessed was induction of labor at 41 0/7 weeks versus expectant management of the pregnancy (Figures A and B) until 42 0/7 weeks gestation. Other theoretical models were created comparing elective induction of labor at 39 0/7, 40 0/7, or 41 0/7 weeks of gestation.
Figure A. Schematic of Decision Tree for 41 week model
Existing literature supports that there is an ongoing risk of both intrauterine fetal
demise and experiencing a hypertensive complication of pregnancy which increases by week of gestational age beyond 39 weeks of gestation, so women undergoing expectant management could enter spontaneous labor, have an intrauterine fetal demise, or develop preeclampsia requiring induction of labor. As one of the primary clinical concerns with continuing pregnancy beyond term is the development of placental insufficiency leading to neonatal compromise or death, women undergoing expectant management are frequently subjected to antenatal testing consisting of a nonstress test and measurement of
9

amniotic fluid volume in order to assess fetal well being and placental function. Women undergoing antenatal testing could therefore develop indications for induction based on antenatal testing.
10

Figure B. Mode of delivery for 39, 40, and 41 week models
We considered that women undergoing spontaneous or induced labor could
experience one or more of six possible events: 1) development of fetal macrosomia; 2) epidural placement; 3) mode of delivery, including spontaneous vaginal delivery, operative vaginal delivery, or cesarean delivery with potential for maternal mortality as a consequence; 4) severe perineal laceration, defined as a perineal laceration injuring the rectal sphincter; 5) shoulder dystocia with the possibility of brachial plexus injury or neonatal demise; and 6) meconium stained amniotic fluid with the possibility of meconium aspiration syndrome, potentially leading to neonatal demise. We obtained estimates for the probabilities of these outcomes as well as related costs and utilities# from the published literature and our systematic review, when possible.
We performed baseline analyses examining each of these six outcomes. Additionally, we evaluated the quality-adjusted life years (QALYs) and costs per QALY associated with each of the strategies.∗ We performed sensitivity analyses varying each of the inputs into the models
# Utilities are a measure of quality of life, usually expressed on a 0 to 1 scale, which assess how a patient values a health state state. ∗ QALYs are the product of life expectancy multiplied by the quality of life of the health states that a person experiences is a measure that combines both of these effects.
11

over potential ranges. These sensitivity analyses included univariate, multi-way, and Monte Carlo simulations. Decision Analysis Results
The results below provide information only for Key Questions 1 and 2, evidence describing the maternal or fetal and neonatal risks of elective induction versus expectant management.
Induction of labor at 41 weeks versus expectant management from 41-42 weeks: Our theoretical model of elective induction of labor at 41 0/7 weeks as opposed to expectant management leads to lower rates of neonatal demise, preeclampsia, macrosomia, shoulder dystocia, meconium-stained amniotic fluid, meconium aspiration syndrome, severe perineal lacerations, and operative vaginal deliveries (Table B). We found that elective induction of labor at 41 0/7 weeks is superior to expectant management with an increase in both maternal and neonatal QALYs; 96 percent of the QALYs benefit was due to reduced IUFD.
Elective induction of labor at 41 0/7 weeks is more expensive as compared to expectant management. The average cost per woman of an induction at 41 0/7 weeks is $10,139 as compared to $9770 for expectant management for an average incremental cost of $368 per induction. In terms of cost-effectiveness, we find that it would cost an additional $10,789 per additional QALY. Typically, interventions are considered cost-effective if they are less than $50,000 to $100,000 per QALY. Thus, induction of labor at 41 0/7 weeks is a cost-effective intervention by conventional thresholds for cost effectiveness.
Our results remained robust during sensitivity analysis. We did not find substantial changes in outcomes or cost-effectiveness in univariate sensitivity analyses. Even with adjustment of the cesarean delivery rate from the baseline where the cesarean delivery rates were equal, through no difference, to a 22 percent increase in cesarean delivery, the overall QALYs remained higher in the elective induction group and this strategy remained cost-effective. Table B. Clinical outcomes per 10,000 women for induction of labor at 41 weeks versus expectant management
Induction of labor at 41 weeks
Expectant management at 41 weeks
Cesarean delivery 2700 2700 Perinatal demise <1 11 Macrosomia 1200 1405 Shoulder dystocia 131 323 Meconium stained fluid 2240 2436 Meconium aspiration syndrome 80 170 Severe perineal lacerations 561 644 Operative vaginal deliveries 1330 1482 Preeclampsia 0 120
Induction of labor at 40 weeks versus expectant management from 40-41 weeks. Our theoretical model of elective induction of labor at 40 0/7 weeks as compared to
12

expectant management leads to a lower rate of all adverse obstetric outcomes, including cesarean delivery, neonatal demise, pre-eclampsia, macrosomia, shoulder dystocia, meconium-stained amniotic fluid, meconium aspiration syndrome, severe perineal lacerations and operative vaginal deliveries (Table C). Further, elective induction of labor at 40 0/7 weeks is superior to expectant management until 41 0/7 weeks, with an average of 56.916 total QALYs for an induction of labor at 40 0/7 weeks versus an average of 56.889 total QALYS for expectant management: An incremental gain of 0.027 QALYs.
Elective induction of labor at 40 0/7 weeks is more expensive as compared to expectant management. The average cost per woman of an induction at 40 0/7 weeks is $10,030 compared to $9760 for expectant management, for an average incremental cost of $269 per induction. In terms of cost-effectiveness, it would cost an additional $9932 per added QALY. Thus, induction of labor at 40 0/7 weeks is a cost-effective intervention in the baseline analysis.
Our results remained robust during univariate sensitivity analysis. However, incorporating uncertainty in multiple input variables through Monte Carlo simulation, elective induction of labor was cost-effective in approximately 55 percent of the cases.
Table C. Clinical outcomes per 10,000 women for induction of labor at 40 weeks versus expectant management until 41 weeks
Induction of labor at 40 weeks
Expectant management until 41 weeks
Cesarean delivery 2420 2420 Neonatal demise <1 9 Macrosomia 800 1105 Shoulder dystocia 109 330 Meconium-Stained Fluid 1700 1985 Meconium-Aspiration Syndrome 43 63 Severe perineal lacerations 426 514 Operative vaginal deliveries 1090 1270 Pre-eclampsia 0 120 Induction of labor at 39 weeks versus expectant management from 39-40 weeks and expectant management from 39-41 weeks. Our theoretical model of elective induction of labor at 39 0/7 weeks compared to expectant management until either 40 0/7 or 41 0/7 weeks leads to a lower rate of all adverse obstetric outcomes, including neonatal demise, pre-eclampsia, macrosomia, shoulder dystocia, meconium-stained amniotic fluid, meconium aspiration syndrome, severe perineal lacerations, and operative vaginal deliveries. Table D shows the clinical outcomes associated with each strategy for a cohort of 10,000 women. Table D. Clinical outcomes per 10,000 women for induction of labor at 39 weeks versus expectant management until 40 or 41 weeks
Induction of labor at 39
weeks
Expectant management until 40 weeks
Expectant management until
41 weeks Cesarean delivery 2230 2227 2349 Perinatal demise <1 5 12 Macrosomia 500 763 997 Shoulder dystocia 87 107 346 Meconium-Stained Fluid 1098 1699 1921
13
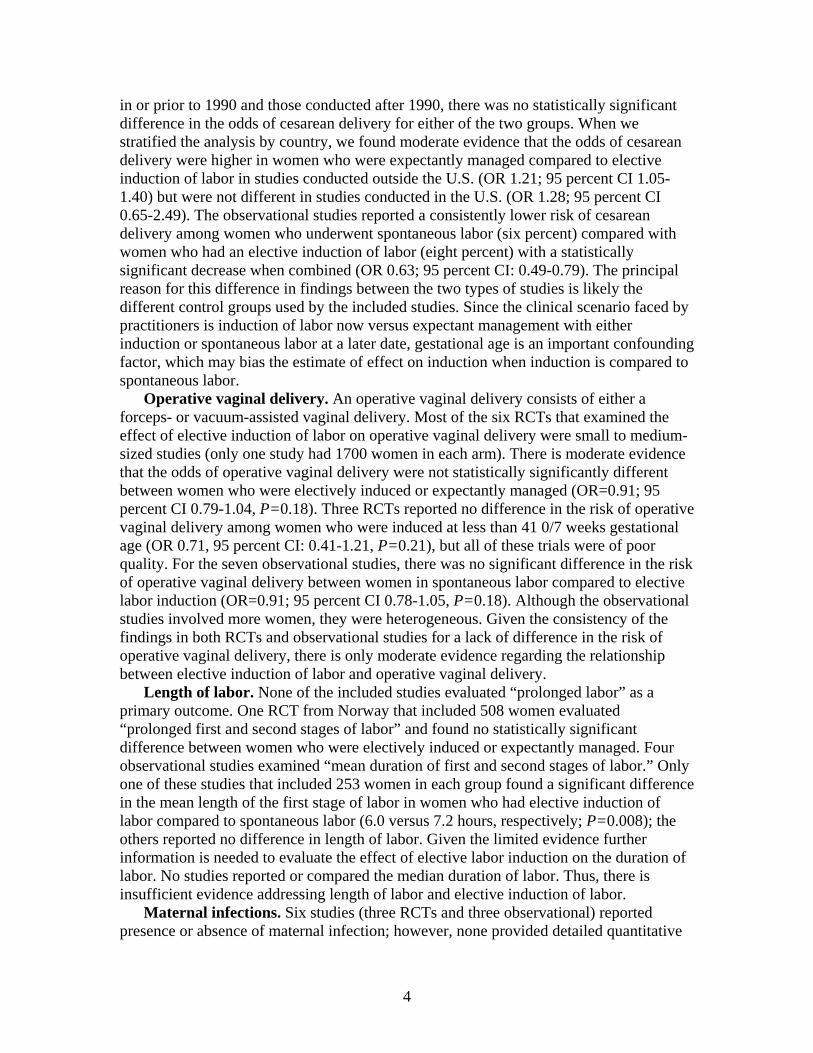
Meconium-Aspiration Syndrome 27 45 59 Severe perineal lacerations 380 430 506 Operative vaginal deliveries 966 1089 1270 Pre-eclampsia 0 90 210
Elective induction of labor at 39 0/7 weeks is more expensive compared to expectant management until either 40 0/7 or 41 0/7 weeks. The average cost per woman of an induction at 39 0/7 weeks is $9,568 versus $9253 for expectant management until 40 0/7 weeks and $8915 for expectant management until 41 weeks. Thus, the incremental cost per woman induced is $316 compared to expectant management to 40 0/7 weeks and $338 per woman expectantly managed to 40 0/7 weeks compared to expectant management until 41 0/7 weeks. In terms of cost-effectiveness, it costs an additional $20,222 per additional QALY compared to expectant management until 40 0/7 weeks and an additional $13,900 per additional QALY as compared to expectant management until 41 0/7 weeks. Thus, in our base-case analysis, elective induction of labor at 39 0/7 weeks reaches conventional thresholds for cost effectiveness. However, in sensitivity analysis, the cost-effectiveness of elective induction of labor was not particularly robust. When considering the effect on cesarean delivery, induction of labor is the dominant strategy if the rate of cesarean delivery is less than 75 percent of the cesarean rate with expectant management. Elective induction is cost-effective at $50,000 until the risk of cesarean delivery is 14 percent higher with an induction of labor. Elective induction is cost-effective at $100,000 until the risk of cesarean delivery is 22 percent higher with induction, and at an increased risk of 35 percent or higher, induction of labor is dominated (more expensive and less effective) as compared to expectant management until 40 wks.
In the probabilistic sensitivity analysis using a Monte Carlo simulation, in 29.5 percent of the trials induction of labor at 39 weeks was the dominant strategy (less expensive and more effective). In 25.7 percent of trials it was more effective but more costly, and in 44.8 percent of the trials it was dominated (less effective and more costly). Using a willingness-to-pay threshold of $100,000, induction of labor at 39 weeks is cost-effective in 52.5 percent of the trials. At a willingness to pay of $50,000, it is cost-effective in 49.5 percent of trials.
In summary, our cost-effectiveness analysis suggests that elective induction of labor at 41 weeks improves maternal and fetal outcomes and is cost effective. Our analyses also suggest that elective induction of labor prior to 41 weeks may improve outcomes and could reach conventional thresholds for cost effectiveness. However, there is additional uncertainty about outcomes for elective induction prior to 41 weeks because less evidence is available. All of our model-based analyses should be considered exploratory and hypothesis generating, rather than definitive, because the strength of evidence for model inputs is generally low. Discussion
The key finding of this review is that women undergoing elective induction of labor have the same or lower rates of cesarean delivery compared with women who are
14

managed expectantly. This result is consistent with other meta-analyses of randomized trials of induction of labor at term and postterm. It is, however, contrary to the commonly held dogma that induction of labor increases the risk of cesarean delivery. This belief is supported by the literature, which compares induction of labor to spontaneous labor, generally finding a higher rate of cesarean delivery among women who are induced. However, given that the actual choice faced by clinicians and their patients is either induction of labor or expectant management of the pregnancy, the comparison of induction of labor to spontaneous labor as a methodologic approach to elective induction of labor does not produce results that are clinically relevant or that can be utilized to counsel women prospectively.
There is a moderate amount of evidence from the current report and prior meta-analyses that elective induction of labor at 41 0/7 weeks of gestation leads to a lower rate of cesarean delivery and meconium-stained amniotic fluid. However, there is a paucity of evidence evaluating the cesarean delivery rate among women electively induced prior to 41 0/7 weeks of gestation. Furthermore, prior to 39 0/7 weeks of gestation, concern for potentially increasing neonatal morbidity with higher rates of respiratory distress syndrome is warranted, particularly in women with poor pregnancy dating.
It does appear that elective induction of labor at 41 0/7 weeks of gestation is supported by a moderate amount of evidence, although many maternal and neonatal outcomes have not been well studied. At gestational ages prior to 41 0/7 weeks, the evidence is insufficient. Moreover, translation of these findings to the population at large in various practice settings has not been well studied. How elective induction of labor may be utilized in non-study settings requires careful consideration by policymakers, clinicians, and patients alike to avoid an expensive intervention that actually may increase cesarean delivery and associated morbidity in current and future pregnancies.
Despite the findings of the current review, it is unclear how the results of such studies translate into clinical practice. As with many interventions, the practice in academic centers under study conditions may not represent the practice in the majority of community hospitals. In particular, there are concerns regarding the implications of such studies related to mode of delivery. Whether a cesarean delivery is the end result of a trial of labor is affected by numerous demographic and medical factors, but, ultimately it is the decision of the provider caring for the laboring woman. The time and financial pressures on clinicians may potentially affect how elective induction of labor affects the risk of cesarean delivery, and, in turn, other maternal and neonatal outcomes in current and future pregnancies. For example, in a practice setting which incorporates the use of laborists, practitioners dedicated to care in the labor and delivery unit (similar to hospitalists in internal medicine), being patient during an induction of labor has far less economic or time pressure on the practitioner. Alternatively, for clinicians who are charged with both in house obstetric care and simultaneously are providing care in the outpatient setting, there are both economic and time pressures to minimize the length of labor whether through augmentation or, in some cases, cesarean delivery.
Limitations of the systematic review. The existing evidence is limited in number of studies, number of well-designed studies, number of adequately powered studies, the breadth of reported outcomes, and analytic design. In terms of the identified literature, there was a wide distribution in terms of both geography and time. It is particularly concerning that one of the principal outcomes of interest was cesarean delivery, as
15

cesarean delivery rates are extremely culturally and time dependent over the last three decades. Thus, a study conducted in one decade may not necessarily inform practice in another decade with respect to cesarean delivery. In addition to the quality of evidence, the overall quantity of studies was also quite poor. For the vast majority of outcomes, there were no more than five studies. Synthesis of the literature with such few studies is challenging as a single study may affect the outcomes and introduce heterogeneity.
One of the most important limitations was the problem of study design. While most RCTs were properly designed to compare elective induction of labor to expectant management of pregnancy, several of the studies we identified used an analytic design which excluded women who were allocated to the expectant management arm and were ultimately induced, which makes interpretation difficult. While the studies examining induction of labor at 41 0/7 weeks of gestation as compared to expectant management were generally specific with respect to gestational age, the studies before 41 0/7 weeks of gestation did not have specific randomization arms at 39 0/7 and 40 0/7 weeks of gestation, so it is impossible to determine what particular strategy at 39 or 40 weeks of gestation will lead to the best overall outcomes utilizing the existing literature.
Limitations of decision analysis. There are a number of important limitations of using decision analysis and cost-effectiveness analysis to address this issue. First, we used models to represent clinical scenarios; these models are necessarily limited in scope and do not capture all relevant considerations for this decision. While a more complex model may get closer to representing the true clinical picture, such complexity increases the demand for evidence about inputs and may make the model difficult to interpret. Finally, for the analyses, there are limitations in the existing probability, cost, and utility data. While we conducted sensitivity analyses over wide ranges of these inputs, better probabilities, costs, and utilities would certainly facilitate more accurate estimates of the outcomes and cost-effectiveness of elective induction of labor. To address the uncertainty in model inputs, a wide range of sensitivity analyses were run to examine the outcomes and cost-effectiveness. Consistent with the clinical studies, the robustness of these analyses varied by gestational age. At 41 0/7 weeks of gestation, in these sensitivity analyses, it appears that our findings were generally robust to the potential benefits and cost-effectiveness of elective induction of labor. However, the results were less robust at 40 0/7 and 39 0/7 weeks of gestation indicating that further research to better characterize the potential outcomes of elective induction of labor at these gestational ages needs to be conducted before recommendation of policies at either of these gestational ages can be supported. We consider our analyses exploratory, and they confirm the potential value of clinical trials that address the outcomes associated with elective induction of labor.
Future research. There is a need for appropriately designed and powered studies to examine the effect of elective induction of labor as compared to expectant management of pregnancies, particularly prior to 41 weeks of gestation. The optimal study designs would be prospective, randomized, controlled trials. Such studies need to be stratified by parity and cervical status and examine a wide range of maternal and neonatal outcomes as well as costs. In addition, other important population characteristics to consider is variation by maternal age, race/ethnicity, and varying moderate risk conditions such as non-insulin dependent gestational diabetes. In order to be appropriately powered, consideration of the estimated samples sizes would indicate that a sample size between
16

2,000 and 15,000 would be necessary depending on whether the intent was to power for some rare neonatal outcomes (Table E). Since the practice of elective induction of labor is already being utilized at an increasing rate, such a study in the U.S. is long overdue. Table E. Sample Size Estimates for Prospective Trial of Elective Induction of Labor as Compared to Expectant Management of Pregnancy
Outcome Studied (baseline risk) Total Sample Size for 80% Power
Total Sample Size for 90% Power
Cesarean delivery, nulliparas (20%) 400 532 Cesarean delivery, nulliparas (15%) 556 742 Meconium (10%) 870 1,162 Cesarean delivery, multiparas (5%) 1,812 2,422 Neonatal acidemia (1%) 9,346 12,506
Cohort studies, either prospective or retrospective, are of some potential value. The validity of these studies depends upon proper study design, comparing women who were electively induced to those who were expectantly managed. In order to capture information on elective induction of labor, such a descriptor should be added to birth certificate data. In addition to study design, data analysis also requires careful attention to potential confounding in such studies. Confounders such as parity, cervical status, gestational age, and complications of pregnancy need to be considered closely and controlled for with multivariable statistical techniques. Such cohort studies can also examine the predictors of a successful induction.
When addressing issues involving elective induction of labor, one must consider the intended goal. Similar to the commentary in the AHRQ report on cesarean delivery by maternal request, (CDMR) which noted that since women may go into labor and deliver via one of three modes of delivery (a spontaneous vaginal delivery, operative vaginal delivery, or cesarean delivery), one must consider planned or intended modes of delivery. In the setting of elective induction of labor, the comparison group, which consisted of women whose pregnancy were expectantly managed, can experience either spontaneous labor, or subsequent development of complications of pregnancy that requires induction of labor. Further, these potential outcomes, i.e., spontaneous labor, complications of pregnancy, or induction of labor, can occur at any point in the future at a wide variety of gestational ages. It was surprising that even when the study design of prospective RCTs were appropriate, several authors analyzed the data by comparing induction of labor to spontaneous labor rather than induction of labor to expectant management as intention to treat. In both RCTs and observational studies, strict use of the appropriate control group, women being managed expectantly, is important.
Outcomes measured. In studies of elective induction of labor compared to expectant management, the focus should be on consistently reporting a wide variety of perinatal outcomes. While we anticipated examining a wide range of outcomes, in reality we obtained information only on a few and were able to synthesize information only on a handful. With respect to mode of delivery, the outcomes, cesarean and operative vaginal delivery, were usually recorded. However, to further determine the effect of labor induction on specific modes of delivery, it would be beneficial to report the indications for both cesarean delivery and operative vaginal delivery. In particular, if a “failed induction” is the indication for cesarean delivery, it would be helpful to report the
17
number of hours involved in the attempted labor induction, and the methods (e.g. prostaglandins, Foley bulb, oxytocin, AROM) utilized, as well as the timing of these methods relative to different phases/stages of labor. Further, since there is some evidence regarding induction and augmentation of labor and fetal position,79, 80 which, in turn, is associated with mode of delivery, fetal position should be recorded as an outcome.
Other maternal outcomes which should be routinely reported in studies of elective induction of labor include the following: Estimated blood loss, incidences of postpartum hemorrhage, blood transfusion, chorioamnionitis, endomyometritis, perineal lacerations, epidural use, length of hospital stay, as well as uncommon but severe morbidities such as pulmonary embolus, amniotic fluid embolus, hysterectomy, and mortality. Since these outcomes are both more severe and less frequent, it is difficult to garner sufficient power to evaluate in a single prospective RCT; thus larger health system or birth certificate data could include elective induction of labor, and large cohort studies could potentially accurately quantify these complications. Long term outcomes such as subsequent fertility, subsequent placentation, subsequent mode of delivery, and pelvic floor injury as represented by urinary incontinence, fecal incontinence, and pelvic organ prolapse should also be examined.
Neonatal outcomes that should be reported routinely in studies intending to examine the effects of labor induction include the following: Umbilical artery blood gases, 5-minute Apgar score, particularly 5-minute Apgar less than 4, respiratory distress syndrome, transient tachypnea of the newborn, presence of meconium-stained fluid, meconium aspiration syndrome, neonatal sepsis, admission to intensive care nursery (ICN), shoulder dystocia, birth trauma including brachial plexus injury, facial nerve palsy, skull fracture, other fractures, cephalohematoma, subgaleal hemorrhage, intracranial hemorrhage, hyperbilirubinemia, birthweight, IUGR, macrosomia, hypoglycemia, polycythemia, length of stay, breastfeeding, and mortality (antepartum, intrapartum, and neonatal). Long-term outcomes such as infant and childhood outcomes of behavior and intelligence should also be assessed. Similar to maternal outcomes, due to the low incidence rate of these outcomes, even large prospective trials are not adequately powered to assess these outcomes. If properly designed and well executed, large cohort studies may potentially overcome limited power and some of the inherent flaws of observational studies, potentially offering vital information to elucidate the rate of these outcomes in association with induction of labor.
In addition to the more traditional clinical outcomes, economic and quality-of-life measures such as patient preferences or utilities should also be considered in future studies of elective induction of labor. Qualitative studies of how women perceived their birth experience in the setting of elective and indicated induction of labor, how they felt their preferences were incorporated into the decision-making process, whether they felt pressured by providers to choose one clinical path or another, how they were counseled and consented, and how their birth experience affected their perceptions of quality of life in future pregnancies all need to be conducted. Specific quantitative measures of patient quality of life would also contribute to the discussion. Both measures of pain and utility on labor and delivery as well as quality of life measures throughout the short- and long-term postpartum periods would inform the understanding of how individuals perceive this intervention. Interestingly, while elective induction of labor allows for some control as to when labor will begin, it also may take the management of early labor out of the
18

parturient’s control. How women perceive this intervention will greatly inform the discussion regarding whether it should be routinely offered, and how it might be best conducted to optimize perinatal outcomes and maintain patient satisfaction. Specific economic measures such as micro-costing all of the labor, supplies, time costs, and overhead costs of the induction of labor experience should be examined. When determining how to use societal dollars to facilitate better health outcomes, allocation of these scarce resources cannot occur without reproducible estimates of these costs. In addition, these economic and quality of life issues should be estimated in subsequent pregnancies as these are affected by prior experiences and outcomes on labor and delivery.
Conclusions
In this systematic review and decision analysis of elective induction of labor, we found that overall elective induction of labor as compared to expectant management of the pregnancy was associated with an approximately 20 percent reduction in the rate of cesarean delivery and a 50 percent reduction in the presence of meconium in the amniotic fluid. However, the majority of these studies were in women at or beyond 41 0/7 weeks of gestation; prior to 41 weeks of gestation, there was insufficient evidence from the review to address these outcomes. These findings are consistent with other meta-analyses of induction of labor in postterm and term pregnancies, but are contrary to many observational studies. The existing literature is not powered to examine many of the other complications of pregnancy; however it is assumed that a number of complications must be reduced by elective induction of labor, simply because pregnancy complications such as preeclampsia or IUFD can no longer occur if the pregnancy is interrupted by induction of labor. These findings were reflected in the results of our exploratory decision-analytic models. Further, when we incorporated costs into the models, it appears that elective induction of labor is a cost-effective intervention at 41 weeks of gestation and may potentially be so at earlier gestations. The results prior to 41 weeks of gestation require further examination in a large, prospective randomized trial before routine adoption into clinical practice. Further, because of the heterogeneity in the management of labor induction, which varies widely between providers and institutions, careful examination of the impact of such policies in a wide variety of settings should be explored before elective induction of labor is routinely adopted as a potential policy to prevent complications of term pregnancies.
19

Evidence Report

22

Chapter 1. Introduction
There are a number of complications of pregnancy that confer significant ongoing risk to the mother or fetus (e.g., preeclampsia; preterm premature rupture of the membranes (PPROM); intrauterine growth restriction (IUGR); and postterm pregnancy (pregnancies that progress to and beyond 42 0/7 weeks, or 294 days, gestational age)). For these conditions, induction of labor is often the principal medical intervention utilized to decrease both maternal and neonatal morbidity and mortality. As the proportion of women with complications of pregnancy has increased in the U.S., the rate of medically indicated induction of labor has concomitantly risen from 9.5 percent in 1990 to 22.1 percent in 2004.81, 82 Over the last decade, pregnant women are older, more likely to be overweight or obese, and have higher rates of chronic illnesses such as diabetes and chronic hypertension.82 In turn, these women have higher risks of preeclampsia and IUGR necessitating induction of labor.
In addition to the rise in the rate of indicated induction of labor, it seems that there has also been an increase in the rate of induction of labor that is not indicated for a medical reason.83-85 For example, Zhang et al. report that while the overall rate of labor induction increased from 9.5 percent in 1990 to 19.4 percent in 1998, the increase for clinically indicated induction was less.84 This suggests that nonindicated induction of labor has risen even more rapidly than the overall rate.
When a medical indication for induction of labor cannot be identified, it is termed an elective induction of labor. Motivated by both patients and clinicians, elective induction of labor has been utilized for decades. Pregnant women may wish to end their pregnancy because of physical discomfort, concerns that their labor may progress too quickly to ensure timely arrival at the hospital (and perhaps have an epidural) before delivering, convenience of scheduling, or ongoing concerns that they or their baby may be at risk for complications.81 Clinicians (e.g., obstetricians, family-practice physicians, midwives) may have both non-medical and medical reasons for recommending elective induction of labor for their patients.82 For example, they too may wish to end their patients’ physical discomfort or have concerns about their patients’ distance from the hospital. Clinicians may also be concerned about the risk of developing either complications of pregnancy (e.g., preeclampsia) or intrauterine fetal demise.86, 87 Clinicians may also observe clinical signs or symptoms that may not quite meet strict criteria for a particular diagnosis and thus not have a medical indication for induction of labor. However, when individualized to that particular clinical scenario, it may be felt that induction of labor may provide a greater benefit over expectant management of the pregnancy. A specific example clinicians may use to recommend an induction could be an elevation in blood pressure higher than the patient’s baseline yet not diagnostic for gestational hypertension in a non-compliant patient at 40 0/7 weeks of gestation. Established guidelines generally recommend that in the absence of other signs and symptoms, or laboratory results indicative of preeclampsia, continued expectant management should be utilized in such patients.88 However, a clinician may reasonably decide that in such a patient at risk of developing gestational hypertension or preeclampsia who may not return for timely prenatal care, the benefits of labor induction may potentially outweigh the risks of expectant management. Using strict diagnostic criteria, such scenarios are classified as
23
elective induction of labor. Whether these types of inductions are beneficial for the patients is unclear.
Clinicians may also have real or perceived economic incentives to recommend elective induction of labor. Induction of labor, on average, generates greater reimbursements for the clinician only if it leads to higher cesarean delivery rates, and even then the marginal increase in reimbursement is generally quite small. As it is a widely held belief that induction of labor is associated with higher rates of cesarean delivery, providers may believe that they have an economic incentive to encourage induction of labor. However, as we discuss below, cesarean delivery rates may actually be lower in women who have elective induction of labor than those who have expectant management. Thus, clinicians’ economic incentives may not to be exclusively related to direct reimbursement. Many pregnant women prefer to have their doctor or midwife present at their delivery: When choosing a practice for prenatal care, a common question is, “Who will deliver my baby?” For many women, the answer of “Whomever is on call” is simply not satisfactory. These women may seek providers who will endeavor to be available for their delivery. Nine months later, clinicians who have agreed to be available for their patients’ deliveries have an incentive to induce labor during times when they are on call. In addition, offering such a practice as elective induction of labor may lead to attracting more patients, in general, to the practice leading to higher volume and greater reimbursements. Such supply-side incentives may lead to increases in elective induction of labor without specific changes in reimbursement, because of marginal time costs to the providers.
From a societal perspective, if elective induction of labor led to similar medical outcomes and costs as expectant management, such a practice could seem reasonable and acceptable. Whether medical outcomes are similar, however, is uncertain. The prevailing wisdom regarding elective induction of labor is that induction increases the risk of cesarean delivery.89 However, in prospective, randomized, controlled trials, several studies have compared the rates of cesarean delivery between women with induction of labor and expectant management, and generally concluded that the cesarean rate was unchanged or lower among the induced group.27, 74 A meta-analysis of postterm pregnancy that included women at both 41 0/7 and 42 0/7 weeks gestation found a reduction in the cesarean delivery rate among women who were induced (OR 0.88; 95 percent CI 0.78–0.99) compared to women who underwent expectant management.90 Similarly, a recent Cochrane review which stratified groups by gestational age demonstrated a non-significant decrease in the rate of cesarean delivery for women who underwent induction of labor (OR 0.92; 95 percent CI 0.76-1.12).91 Interestingly, a stratified analysis of the three studies of women at less than 41 0/7 weeks gestation showed a reduction in the rate of cesarean delivery in the elective induction group (OR 0.58; 95 percent CI 0.34-0.99).
The comparative costs of elective induction of labor and expectant management are also not well understood. Induction of labor has been associated with an increase of $1,237 per patient over expectant management.92 If elective induction of labor increases the rate of cesarean delivery, such a practice would be very costly. Alternatively, if, as
24

suggested by prior systematic reviews, elective induction of labor decreases the rate of cesarean delivery, it may instead be cost saving.1
Clearly, the effect of elective induction of labor on the frequency of cesarean delivery is a critical uncertainty that requires detailed analysis to help clinicians and policymakers determine the role for elective induction of labor in current obstetric practice. However, the majority of the available literature on the association between elective induction of labor and the cesarean delivery rate is subject to serious methodologic flaws that merit discussion. Similarly, while costs assessed at the individual level may appear to be higher in the short-term among those patients with elective induction of labor, considerations of both societal and long-term perspectives is warranted. In the next section, we discuss the key methodologic issues related to gestational age and pregnancy dating and how they can influence the estimates of the effects of labor induction on perinatal outcomes and costs to society.
Gestational Age and Elective Induction of Labor
Before going any further, it should be clarified that throughout this report, 41 0/7
week and 41 weeks of gestation will be utilized interchangeably. The same is true for 39 0/7 and 39, 40 0/7 and 40, and 42 0/7 and 42. We endeavor not to use the phrase ‘the 42nd week of pregnancy’ which can refer to either time period 41 0/7 until 41 6/7 or 41 1/7 until 42 0/7. When we are referring to a particular time period, we will delineate the time period by the starting and ending week of gestation around the time period such as 41 to 41 6/7 weeks of gestation.
Additionally, there are specific terms that are utilized to describe gestational age and the fetus or infant that we have attempted to use consistently throughout this report. A postterm pregnancy is one that is 42 0/7 weeks or beyond. The terms post-dates and prolonged pregnancy are poorly and inconsistently defined thus, we endeavor not to use these terms. We have attempted to use fetal to refer to pre-delivery outcomes, neonatal for outcomes that occur in the first 28 days of life, perinatal to capture the combined fetal and neonatal periods, and infant for outcomes beyond 28 days and prior to one year of life.
As mentioned above, there are many published studies which find a positive association between induction of labor and cesarean delivery.11, 20, 89 The majority of these studies employed either a retrospective cohort or case-control study design. Since many women who have an induction of labor do so for either late-term (41 0/7 to 41 6/7 weeks of gestation) or postterm (42 weeks of gestation and beyond) pregnancies, one problem with these studies is there is often a difference in gestational age between the women who undergo induction of labor and those in the control group, who are typically women experiencing spontaneous labor, with more women in the induction group being postterm.97 Further, the risk of cesarean delivery varies by week of gestational age in both 1Further, since the rate of vaginal birth after cesarean (VBAC) has fallen appreciably over the past decade, the vast majority of women who had cesarean delivery in a prior pregnancy will likely undergo repeat cesarean deliveries in subsequent pregnancies. These repeat cesareans are associated with higher risk of abnormal placentation, including placenta previa and accreta93 which, in turn, are associated with higher risks of maternal morbidity and mortality.94, 95 Prior cesareans have also been associated with higher rates of unexplained intrauterine fetal demise.96 Thus, if elective induction of labor leads to higher rates of cesarean delivery, it may lead to increases in perinatal complications and costs in both current and future pregnancies.
25

term and postterm pregnancies, increasing with increasing gestational age.98, 99 Thus, if women who are induced are compared to women experiencing spontaneous labor, gestational age is a confounding variable because it is associated with both the predictor (in this case, induction of labor) and the outcome of interest (cesarean delivery). While older studies did not generally use multivariable regression techniques to control for confounding bias,66, 74 more recent studies have done so.47, 48 Although this adjustment can decrease the bias in the effect estimates of labor induction on cesarean delivery, it does not entirely eliminate it. In contrast to these observational studies, there are a number of randomized controlled trials of induction of labor which found either a decrease or no difference in cesarean delivery rates. Studies of pregnancies at or beyond 41 weeks of gestation have demonstrated a decrease in cesarean delivery among women who have undergone induction of labor.27, 90 In women with diabetes100 and presumed macrosomia101 who have been induced, prospective trials report no statistically significant difference in rates of cesarean delivery.
How is such a difference in results between cohort and case-control studies and prospective randomized, controlled trials explained? In addition to bias due to residual confounding, another important reason is a fundamentally flawed study design present in most non-randomized studies: By either matching on gestational age or utilizing multivariable techniques, the investigators often make a direct comparison between women who have induction of labor at a given gestational age versus women who experience spontaneous labor at that same gestational age (Figure 1.1.A). Unfortunately, when caring for a pregnant woman at term, clinicians are not actually choosing between induction of labor and spontaneous labor; rather, the options clinicians and their patients face are either elective induction of labor now or continuing expectant management of the pregnancy. Expectant management of the pregnancy simply involves nonintervention at any particular point in time and allowing the pregnancy to progress to a future gestational age. Thus, it can result in either spontaneous labor or medically-indicated induction of labor at a greater gestational age (Figure 1.1.B). Furthermore, the indications for inductions of labor at a greater gestational age may include pregnancy or medical complications such as preeclampsia, oligohydramnios, intrauterine growth restriction, nonreassuring antenatal testing, or postterm pregnancy, all of which have also been associated with an increased risk of cesarean delivery.102-104 One recent study underscored this methodologic concern by finding that when compared to spontaneous labor, induction of labor was associated with an increased risk of cesarean delivery, but when compared to expectant management of the pregnancy, it was associated with a decreased risk of cesarean delivery. Figure 1.1.A. Comparison of induction of labor to controls by week of gestation Figure 1.1.A. In many observational studies, induction of labor is compared to controls by week of gestation which appears to (but does not actually) capture the confounding effect of gestational age. In these studies, one compares women induced at a given gestational age to those who experience spontaneous labor at the same gestational age.
26

Figure 1.1.B. Comparison of induction of labor to expectant management
Figure 1.1.B. In a prospective, randomized, controlled trial, induction of labor is actually compared to expectant management. Clinicians are deciding between induction of labor at the current gestational age versus expectant management leading to delivery at a greater gestational age. Source: Caughey AB, Nicholson JM, Cheng YW, Lyell DJ, Washington AE. Induction of labor and cesarean delivery by gestational age. Am J Obstet Gynecol. Sep 2006;195(3):700-705. Reprinted with permission.
Thus, when considering the clinical question of the effect of labor induction on the risk of cesarean delivery, gestational age cannot simply be controlled for using straightforward statistical techniques as is appropriate for other classic confounders. Rather, a study design comparing women undergoing induction of labor at a specific gestational age to women who deliver as a result of either spontaneous labor or induced labor at a greater gestational age is the only way non-randomized data should be utilized to examine the effect of induction of labor on mode of delivery. Similarly, if one wishes to examine the effect of induction of labor on other outcomes, this issue of gestational age needs to be examined. For example, if one was to examine the effect of induction of labor on preeclampsia by comparing rates of preeclampsia in induced women to those in spontaneous labor, since preeclampsia is an indication for induction of labor, it is assumed that an increased risk in the induction of labor group would be found. Of course, this is nonsensical since it is actually a reversal of the causality relationship. However, if one examined this effect in either a prospective randomized trial or utilizing the comparison between women induced at one gestational age (not for preeclampsia) compared to those women managed expectantly beyond that particular gestational age, we would find that induction of labor prevents preeclampsia since one cannot develop preeclampsia next week if they are being induced today. Similarly, this protective effect exists for other complications such as intrauterine fetal demise and macrosomia. However, to date, there are no observational studies of these specific outcomes framed in such a fashion. Thus, we must rely exclusively on randomized trial evidence to evaluate most perinatal outcomes when comparing induction of labor to expectant management of pregnancy.
Given the rising incidence of elective induction of labor, the non-medical incentives driving its use, and the lack of consensus regarding its effect on key maternal and fetal outcomes, we sought to systematically evaluate the evidence regarding the use of elective induction of labor and explore gaps in the literature with simulation modeling. A better understanding of all aspects of elective induction of labor is important. Ideally, research on induction of labor should include insight into the incentives facing both the pregnant women and clinicians such as the outcomes and costs related to induction of labor and the sociocultural factors which may affect the associated outcomes, particularly mode of delivery.
27

Key Questions and Analytic Framework
Given this background and the methodological concerns, we sought to conduct an analysis of the existing literature in order to answer the following Key Questions on the effects of elective induction of labor:
Key Question 1: What evidence describes the maternal risks of elective induction
versus expectant management? Key Question 2: What evidence describes the fetal/neonatal risks of elective
induction versus expectant management? Key Question 3: What is the evidence that certain physical conditions/patient
characteristics (e.g., parity, cervical dilatation, previous pregnancy outcome) are predictive of a successful induction of labor?
Key Question 4: How is failed induction defined?
To address these Key Questions, we performed a systematic review of the literature. For Key Questions 1 and 2, we included studies that included women with both expectant management as well as spontaneous labor as the control group since the latter is the most common comparison group for elective induction of labor. For Key Questions 3 and 4, we expanded our inclusion to studies examining predictors of failure and the definition of failure in non-elective induction of labor. To address the gaps in the published literature, we conducted cost-effectiveness analyses to evaluate the effects of key predictors, such as mode of delivery, on overall outcomes and costs of elective induction of labor.
Organization of This Report
The remainder of this report is organized into the following sections: Chapter 2 – Systematic Review of Elective Induction of Labor describes the methods used to conduct the systematic review as well as the results for Key Questions 1 through 4. Chapter 3 – Decision Analytic Model describes the methods and results of the cost-effectiveness analysis. Chapter 4 – Discussion provides a commentary on the key findings from both the systematic review and the decision analysis, describes the limitations of these findings, and offers recommendations for future research on this topic.
28

Chapter 2. Systematic Review of Elective Induction of Labor
We conducted a systematic review of the published literature to evaluate maternal, fetal and neonatal risks of elective induction of labor compared with expectant management, and to evaluate the predictors of failed induction of labor. In this chapter, we present our methods for this review and the results.
Systematic Review Methods
Topic Development
The topic for this report was nominated by the American College of Obstetricians and Gynecologists (ACOG). The Key Questions were developed from an initial set of Key Questions provided by AHRQ with the input from ACOG, the Stanford-UCSF Evidence-Based Practice Center, and the Technical Expert Panel (TEP).
Search Strategy
We searched MEDLINE® using medical subject headings (MeSH) keywords to identify all published studies on elective induction of labor (indexed January 1, 1966 to May 21, 2007) in humans. We performed title searches to identify additional potentially relevant English-language articles (indexed through June 6, 2007). We also manually reviewed the reference lists of included articles and bibliographies of systematic reviews to identify additional relevant articles. Appendix A provides the details of our search strategy. Study Selection
To address Key Questions 1 and 2, an article had to compare outcomes in women who had
undergone induction of labor without a specific indication prior to 42 weeks gestational age with women who were either managed expectantly or had spontaneous labor.
We defined elective induction of labor as an induction of labor at or after 37 weeks and prior to 42 weeks of gestation without either a maternal or fetal indication for the induction. While it has become increasingly common to induce women at 41 0/7 weeks of gestation and to call this practice a “post-dates induction”, the most recent ACOG guideline defines postterm as 42 weeks of gestation and beyond.88 Studies in which we could determine that at least 20 percent of the women were at 42 weeks of gestation and beyond were considered to be postterm. Certain
Appendixes and evidence tables for this report are provided electronically at http://www.ahrq.gov/clinic/epcindes.htm.
29

preventive indications such as induction to prevent macrosomia, preeclampsia, or intrauterine growth restriction (IUGR) have not been recognized as medical indications of labor; therefore, studies where women were induced for the prevention of any of these conditions were considered elective.
We included studies on elective induction of labor only if the article reported mode of delivery (cesarean, spontaneous vaginal or operative vaginal deliveries), or maternal or neonatal outcomes. Studies were considered to have reported maternal infection if they reported chorioamnionitis, endomyometritis, post-partum fever, or “maternal infection” (without providing specific detail).
To address Key Question 3, we included all studies on induction of labor (irrespective of whether the induction was elective or indicated and whether there was a comparison group) if the article reported predictors of success or failure for induction. We sought to identify maternal characteristics that would predict higher rates of a successful labor induction. For this analysis, we evaluated predictors such as maternal age, parity, race/ethnicity, obesity, obstetric history, gestational age, and cervical status. We excluded articles that specifically studied different methods of induction (for example, articles that compared the use of prostaglandins, oxytocin, and mechanical dilation such as Foley bulb etc. as different methods for inducing labor). Study design. We included randomized controlled trials (RCT), cohort studies, and case-control studies. We excluded commentaries, case studies, letters, and reviews. Because most RCTs of elective induction compared elective induction of labor to expectant management and most of the observational studies compared elective induction of labor to spontaneous labor, we included both types of study designs but analyzed them separately. As noted in the introduction, because the comparison between elective induction of labor and spontaneous labor is fundamentally flawed, we present these findings primarily to demonstrate the current state of the existing literature as well as to explore the differential findings between the RCTs and the observational studies.
Patient population. We excluded articles addressing postterm pregnancy (greater than or equal to 42 weeks gestational age), prior cesarean deliveries, multiple gestations, medical or obstetrical complications of pregnancy such as preeclampsia, diabetes mellitus, isoimmunization, fetal anomalies or abnormal antepartum testing.
Other exclusion criteria. We included duplicate articles of the same study only once in our analyses. We excluded articles for which the data reported were not usable for our analyses (e.g., an article reporting only the odds ratio without providing the number of events and sample size for outcomes or predictors of interest would have been excluded). Data Extraction
Two authors independently reviewed the title and abstract of all studies retrieved from our search to assess whether the article met inclusion criteria. Conflicts regarding whether or not an article should undergo full text review were resolved by re-review and discussion. The full text of articles not previously excluded were reviewed independently by two authors. Each reviewer extracted the following information from each included study: Study period, location and setting of study, whether or not the induction was elective or indicated, method utilized to achieve labor induction, study design, definition of a successful induction, inclusion and exclusion criteria (for elective induction of labor studies), mode of delivery, maternal and neonatal outcomes for all
30

patients with stratification by parity (for studies on elective induction of labor), predictors of a successful or failed induction (for all induction of labor studies) and quality assessment variables. All articles were reviewed and data was entered into pre-tested forms (Appendix B). Quality Assessment and Applicability of Included Studies
We evaluated the extent to which the included studies were designed to address the Key Questions. Some studies of elective induction of labor have key methodologic flaws limiting the ability to adequately answer our Key Questions. Thus, our quality assessments were based primarily on the extent to which the included studies were designed prospectively, ensured that intervention and control patients were similar with respect to the key factors affecting cesarean delivery rates (e.g., maternal age, parity, body mass index, cervical stage, gestational age) and were adequately powered to evaluate relatively rare outcomes of interest for both mothers and neonates. The literature reports inconsistent findings on the association between induction of labor and cesarean delivery: RCTs have reported decreases or no differences in cesarean delivery among women who were induced, whereas older observational studies have reported increased rates of cesarean delivery among induced women.12, 22, 86 One explanation for this contradictory evidence is that most observational studies did not control for gestational age as a confounder in their analysis. Induction of labor is likely to occur more often with increasing gestational age, and increasing gestational age is itself a risk factor for cesarean delivery.98, 99 Another important consideration for study design is the protective effect that induction of labor confers on key outcomes of interest (e.g., cesarean delivery, preeclampsia). For example, the risk of preeclampsia increases as gestational age increases; if a woman undergoes induced labor at an earlier gestational age rather than waiting to go into spontaneous labor, any study that examines the effect of induced labor on preeclampsia will show reduced rates of preeclampsia in the induced group, since the risk for that group has now been eliminated.
As discussed in Chapter 1, since most RCTs compare induction of labor to expectant management, RCTs are the preferred study design for assessing the effects of induction of labor. Observational studies may not always control for gestational age in their analyses; and the clinical decision is whether to end the pregnancy now (at a particular gestational age) or wait until a later gestational age (i.e. expectant management) (Figure 1.1B). However, most observational studies compare induction of labor at a particular gestational age with spontaneous labor at the same gestational age (Figure 1.1A) which is not an appropriate comparison since this method does not address implications of the clinical decision being made. Since most RCTs compare induction of labor to expectant management, the effects of this clinical question are examined; alternatively, observational studies that compare induction of labor at a specific gestational age to spontaneous labor at a later gestational age also provide useful evidence.
We based our approach to evaluating the quality and applicability of the included articles on established AHRQ guidelines including the “Guide for Conducting Comparative Effectiveness Reviews”105 and “Systems to Rate the Strength of Scientific Evidence”106 and recent AHRQ reports including the review of elective cesarean by Viswanathan et al.107 Using these sources, we developed specific criteria for evaluating the quality of the individual included studies and rating their applicability to each of our Key Questions as good, fair, or poor. This rating system does not attempt to assess the comparative validity of studies across different design strata. For example, a “fair” RCT is not judged to have the same methodological quality as a “fair” observational study. Thus, both study design and quality grade should be considered when
31

interpreting the methodological quality of a study. Appendix B presents the quality assessment and applicability forms.
In the sections that follow on quality and applicability rating, we describe our iterative approach to rating each study—first, rating the quality of the individual study and then rating the applicability of each study to the Key Questions. Two abstractors independently rated each article on each of the categories as indicated on the quality and applicability assessment forms. We reconciled differences by consensus and assigned the overall scores as described below.
Specific aspects of quality rating – randomized controlled trials. Comparison group. One of the key design aspects of studies of elective induction of
labor is that they have the appropriate comparison group of expectant management. This group includes all women managed expectantly, both those who went into spontaneous labor as well as those who were induced for other reasons. As long as the study had the appropriate comparison group, it was assigned an initial quality rating of good. However, if it did not utilize this comparison group, but instead excluded women who were eventually induced, it received an overall poor quality rating despite other aspects of the quality assessment.
Randomization approach and implementation. Because parity is such a critical predictor of outcomes after induction of labor, we sought to evaluate the extent to which the included studies stratified randomization by parity. We also sought to identify whether the experimental and control groups appeared to be balanced in important, identifiable confounding factors, our assumption being that if such variables were similar, other, unidentifiable potential confounders would also likely be similar. If studies described the approach to randomization, there was no major flaw in randomization, randomization was stratified by parity or only included one parity group, and achieved a balance of select characteristics in the two groups, studies would maintain their good quality rating; if any of these items were not met, the quality rating of studies would be reduced by one level. If good balance in the populations was not achieved, but authors utilized multivariable analyses to control for potential confounding, the study maintained its quality rating. Measurement of outcomes: Masking and loss to follow-up. Because neither the women being electively induced nor the providers caring for them can be masked to this event, this item was relevant only to the assessment of the outcomes. Thus, we evaluated two components of outcome assessment: Masking of the assessors (e.g. data abstractors) and loss to follow-up. While we believe masking to the assessment of outcomes is important, we felt that in this setting it should not lead to a lower overall quality rating, thus we evaluated this aspect of the study design, but did not lower the quality rating as a result. Because of the immediate nature of many of the outcomes, we did not specifically reduce the quality rating if a study did not specifically report the loss to follow-up. However, as with masking, we evaluated the study as to its reporting of loss to follow-up. Further, even if it was not reported, we were able to assess the actual loss to follow-up by comparing the number of subjects recruited to those with results. We suspected that most of the follow-up would be short term with respect to both maternal and neonatal outcomes and that with short term follow-up greater than or equal to 90 percent, the study would maintain its quality rating. With less than 90 percent follow-up in the short term, either immediately postpartum or at the postpartum visit, the study quality level rating would be reduced one quality rating level from good to fair or fair to poor. If a study reported only outcomes that would occur in the immediate peripartum period, then the study was only evaluated for follow-up in that time period.
32

Sample size. This item was intended to identify whether the study population was large enough to have adequate power. We utilized both the actual sample size as well as whether any sample size calculations were performed and the study recruited the projected sample size to evaluate this component of quality. If a sample size calculation was performed a priori, then the study maintained its overall quality rating level. However, if no sample size calculation was conducted during the study design, we estimated that in order to identify a 50 percent difference in cesarean delivery from a baseline rate of 20 percent with a two-sided alpha of 0.05, that 400 subjects would be needed. Thus, studies with less than 400 subjects were downgraded one quality rating level, unless they actually found a statistically significant difference in their primary outcome or they conducted a sample size calculation post hoc that justified their actual sample size.
Statistical analysis. This item was intended to examine whether the investigators analyzed the data from their study appropriately and examined whether intention-to-treat analyses were conducted, if investigators controlled for confounding if necessary, and conducted stratified analyses by parity if necessary. While statistical analysis is important, we did not think that this topic should dominate all of the other quality criteria, so even if all of the responses to the statistical quality items were negative, this reduced the overall quality rating at most one level.
Specific aspects of quality rating – observational studies. Comparison group. Again, given the importance of the appropriate comparison group of
expectant management which includes all women managed expectantly, both those who went into spontaneous labor as well as those who were induced for other reasons, if a study had the appropriate comparison group, it would begin with a good quality rating (this was relevant only for Key Questions 1 and 2). However, if it did not utilize this comparison group, but instead excluded women who were eventually induced, it received a poor quality rating overall despite other aspects of the quality assessment. For observational studies that were utilized to examine Key Question 3 or Key Question 4, the response to this item had no effect on the quality related to the study’s ability to address those Key Questions.
Study design. Specifically, because the randomized trials were all prospective, and prospective identification of elective induction of labor is intrinsically going to be superior to retrospective identification of such patients we included this item. Further, to ensure that both identifiable and potentially unidentifiable characteristics and potential confounders were similar between the two groups, we examined this issue. Finally, because follow-up of study participants is important for the reduction of bias due to self-selection, this item was included for evaluation as well. If the study was prospective, had comparable study groups in terms of patient characteristics (or controlled for potential confounding), and maintained a follow-up rate of 90 percent or better, it maintained its quality rating. If the study was retrospective, its quality rating level was reduced from good to fair. If the study did not have comparable study groups or utilize multivariable analyses to control for confounding, its quality rating was reduced from good to fair or fair to poor. Regarding loss to follow-up, this was only evaluated in prospective studies. Because of the immediate nature of many of the outcomes, we did not specifically reduce the quality rating if a study did not specifically report the loss to follow-up, though we did evaluate this component as it should be included. Further, even if it was not reported, we were able to assess the actual loss to follow-up by comparing the number of subjects recruited to those with results. We suspected that most of the follow-up would be short term with respect to both maternal and neonatal outcomes and that with short term follow-up greater than or equal to 90 percent, the study would maintain its quality rating. With less than 90 percent follow-up in the short term, either
33

immediately postpartum or at the postpartum visit, the study quality level rating would be reduced one quality rating level from good to fair or fair to poor. If a study reported only outcomes that would occur in the immediate peripartum period, then the study was only evaluated for follow-up in that time period.
Sample size. We used this item to identify whether the study population was large enough to have adequate power. We utilized both the actual sample size as well as whether any sample size calculations were performed to evaluate this component of quality. If a sample size calculation was performed a priori, then the study maintained its overall quality rating level. However, if no sample size calculation was conducted during the study design, we estimated that in order to identify a 50 percent difference in cesarean delivery from a baseline rate of 20 percent with a two-sided alpha of 0.05, that 400 subjects would be needed. Thus, studies with less than 400 subjects were downgraded one quality rating level, unless they actually found a statistically significant difference in their primary outcome or they conducted a sample size calculation post hoc that justified their actual sample size.
Statistical analysis. We used this item to examine whether the investigators analyzed the data from their study appropriately and whether they controlled for confounding by utilizing multivariable analyses and performed stratified analyses by parity (if necessary). While statistical analysis is important, we did not think that this topic should dominate all of the other quality criteria, so even if all of the responses to the statistical quality metrics were negative, we reduced the overall quality rating at most one level.
Specific aspects of applicability ratings. In addition to evaluating the quality of each of the included studies, we evaluated the extent to which each included study was applicable to our Key Questions. While Key Questions 1 and 2 examined maternal and neonatal outcomes in the setting of elective induction of labor, Key Question 3 examined predictors of success and Key Question 4 examined how induction of labor success was defined. Thus, for key questions 1 and 2 it was important that the study be one of elective induction of labor and utilize the appropriate comparison group of expectant management. For key question 3, any study including women undergoing induction of labor could shed some light on the predictors of a successful induction of labor, though we thought the applicability would be stronger in studies on elective induction of labor. For key question 4, any study defining labor induction success seemed to be applicable to the question. The specific factors that we considered to evaluate applicability are noted below:
Topics covered. Many studies only provided data on a few of the outcomes of interest for any of the Key Questions. Thus, by definition, if the study did not examine an outcome, we did not consider it applicable to that outcome.
Comparison group. If the comparison group for studies examining components of either Key Question 1 or 2 was not expectant management, then the study was deemed to have poor applicability for these two Key Questions. Elective induction of labor. While studies needed to specifically address elective induction of labor by definition for Key Questions 1 or 2, there were also studies that examined induction of labor in women with indications for Key Question 3. If the study was not of women with an elective induction of labor, then the applicability was deemed fair for Key Question 3; however, if it was of elective induction of labor, then it was rated as having good applicability to Key Question 3.
Timing of study. Because clinical care changes over time and, in particular, the overall cesarean delivery rate has changed significantly from the 1970s and early 1980s to the current time, studies in which the clinical care was provided prior to 1985 were downgraded one step in
34

applicability if they also did not utilize more recent labor induction techniques mentioned below. Of note, while the cesarean delivery rate has continued to rise over the past 10 to 15 years, the rise has not been nearly as rapid as it was between 1970 and 1985, which was why that time period was chosen. For studies that did not report the specific time period in which the study was conducted, we assumed that studies published in 1990 and beyond met this criterion.
Location of study. Because the clinical environment and in particular, the medical malpractice environment is particularly unique within the U.S., any study not conducted in the U.S. was downgraded by one step in applicability.
Labor induction method. In particular, the use of prostaglandin agents and Foley catheter balloons for cervical ripening have led to improved success of induction of labor. Thus, we downgraded the applicability of any studies in which prostaglandins or other cervical ripening agents were not utilized in induction of labor regardless of when the study was conducted. For studies which did not specifically report methods of induction, we deferred to the timing of the study as these methods are more recent developments.
Less than 41 weeks gestational age. ACOG continues to define postterm pregnancy as 42 completed weeks of gestation and beyond; however, there is an increasing trend for the threshold of 41 0/7 weeks being more commonly accepted as a time for labor induction to be indicated. Thus, some clinicians and policymakers deem pregnancies less than 41 weeks as the group of interest for elective induction of labor. Thus, we considered the applicability of studies to this population. If a study was conducted on only women prior to 41 weeks gestation or included women prior to 41 weeks and conducted a stratified analysis, it was considered to have good applicability to this group of women. Thus, the overall applicability rating determined from the other items would be maintained to women less than 41 weeks of gestation. If it included women less than 41 weeks, but did not stratify, or if it did not include women less than 41 weeks of gestation, it was considered to have poor applicability to women less than 41 weeks of gestation.
Overall quality and applicability rating of the literature for the key questions. The overall grade for strength of evidence reflects a global assessment that takes the required domains of both quality and applicability of the individual studies directly into account. In addition, we considered the consistency of the results of the included studies and volume of the literature to rate the overall quality for each of the Key Questions. Consistent with the AHRQ guidelines in the “Guide for Conducting Comparative Effectiveness Reviews”, we assigned a grade of high, moderate, low, or insufficient to each of the outcomes. A grade other than insufficient implied that there was enough evidence available to estimate a point estimate of the effect of either elective induction of labor or a predictor on the success of induction of labor. However, in cases where there was either no evidence or the evidence was too inconsistent or underpowered to draw a conclusion, we assigned a grade of insufficient. For example, if there were two small randomized trials that examined the effect of induction of labor on a maternal outcome and both had an odds ratio point estimate that had clinical implications, but even when combined was still statistically insignificant, we considered this as insufficient evidence. Another example of insufficient evidence would be in the case of two studies where each found a statistically significant effect, but in the opposite direction. Data Synthesis
To evaluate the maternal and neonatal risks of elective induction versus expectant management (Key Questions 1 and 2), we computed two summary effect sizes for each outcome
35

of interest reported by more than four studies: A summary odds ratio and a summary risk difference. Both summary effect sizes were computed using random effects models. We present the summary odds ratio as the primary outcome metric in our figures and text, and we also provide the summary risk difference when applicable. We present the figures showing the summary risk difference in Appendix C.
We also conducted univariate analysis to evaluate the effect of the following variables on our outcomes of interest: Year (1990 and earlier versus after 1990), country (U.S. versus non-U.S.), and setting (academic, community hospital, both, or multi-center).
To evaluate the predictors of cesarean delivery (Key Question 3), we computed the summary odds ratio and risk difference for predictors that were reported in more than four studies. Predictors that were reported in fewer studies are presented in tabular format.
We assessed the statistical heterogeneity for all computed summary effects by calculating the Q statistic (designated Q statistics with p <0. 05 as heterogeneous) and I2 statistic (designated I2 statistics greater than 50 percent as heterogeneous).108, 109 The I2 statistic measures the extent of inconsistency among the studies’ results, which is interpreted as the approximate proportion of total variation in study estimates due to heterogeneity rather than sampling error.110
We performed sensitivity analyses to evaluate the robustness of our results. We removed each study individually to evaluate that study’s effect on the summary estimates. We conducted a cumulative analysis after ordering studies by year, to determine if there was a trend over time. We defined study year as the year in which the study was started; if this was not reported, then we used the publication year for the study year.
We assessed publication bias by visual inspection of funnel plots to evaluate the association between the sample size of a study and the likelihood of that study reporting a statistically significant outcome. We also calculated the fail safe N (the number of missing studies that would be required to change a significant summary effect to one that was not statistically significant).111 We performed analyses using Comprehensive Meta-Analysis v.2 software (Biostat, NJ, U.S.A.). Peer Review
A draft of this evidence report was reviewed by experts in obstetrics and gynecology, meta-analysis, and decision analysis, and by representatives of AHRQ (Appendix E). We provided a detailed response to each of their comments and incorporated changes into the final version of this Evidence Report. However, the findings and conclusions are those of the authors, who are responsible for the content of the report.
36

Systematic Review Results
Our search strategy yielded 3,722 published articles. After title and abstract review, 392 articles were retrieved for full text review. Of these, an additional 316 articles were excluded (Appendix D) leaving 76 unique studies (10 articles were duplicate reports); 34 articles compared elective induction of labor with a control group and 42 additional articles addressed any induction of labor reporting on predictors of failed induction (Figure 2.1). Figure 2.1. Literature search
MEDLINE Search
Potentially Relevant Articles N=3722
Articles Requiring Full Text Review N=392
3330 ExclusionsNot elective induction of labor; no predictors of cesarean delivery in non-electively inducted labor=155Ineligible study design=1157No eligible maternal or neonatal outcomes=8Study of method of induction=1056Post-term pregnancy=59Previous cesarean delivery=61Multiple gestations=25Medical or obstetric complications=235Fetal anomalies=31Article not written in English=2Other reason for exclusion=541
Stage 1: Review of title and abstract by two independent investigators
Unique articles meeting criteria for full abstraction
N=76
Stage 2: Full text review and abstraction by two independent investigators
316 ExclusionsNot elective induction of labor; no predictors of cesarean delivery in non-electively inducted labor=212Mode of delivery not examined or no eligible maternal or neonatal outcomes=8Ineligible study design=44Study of method of induction=6Post-term pregnancy=11Medical or obstetrical complications=2Duplicate article=10 Data provided not usable=19Other=4
Elective induction of labor N=34
Induction for any reason (only for KQ3 and KQ4)
N=42
37

38
The results are presented in three sections: 1) elective induction of labor studies; 2) predictors of cesarean delivery; and 3) definitions of failed induction. In the first section we present a general description of our included studies, quality assessment of studies, followed by our synthesis of maternal outcomes (Key Question 1) and neonatal outcomes (Key Question 2). In the second section we present a general description of our included studies, quality assessment, and predictors of cesarean delivery (Key Question 3), followed by the definition of successful or failed induction (Key Question 4) reported in our included studies. Elective Induction of Labor Studies
General description of included studies. We identified 34 studies comparing maternal or perinatal outcomes in women with elective induction of labor to either expectant management or spontaneous labor. Of these, 11 were randomized controlled trials (RCTs) (Table 2.1) and the remaining were observational studies (Table 2.2).
RCTs. In nine (82 percent) RCTs, women who were expectantly managed were designated as the control group, and in two RCTs the control group was women who had spontaneous labor (i.e., women in the control arm who were induced later were either excluded from the analysis or analyzed as the induction group). In one study, the patient population was restricted to only nulliparous women;63 for the remaining studies, inclusion was not restricted on the basis of parity. The oldest of these studies was conducted in 1975 and the most recent in 2005. Seventy-three percent of these studies were conducted outside the U.S. (Canada, Europe, Turkey, and Japan). About half the studies were conducted in an academic setting and about a third in either a community hospital or across multiple centers; two articles did not report the setting of the study. Most of the studies were small to medium-sized and only one study had a sample size of more than 1,000 patients27 (Table 2.1).
Observational studies. Elective induction of labor was assessed in 23 observational studies; only one cohort study compared elective induction of labor with expectant management31 while the remaining studies compared elective induction with spontaneous labor (Table 2.2). The oldest of these studies was conducted in 1962 and the most recent one in 2006. Four studies were conducted among only nulliparous women11, 17, 20, 60 and two among only multiparous women.15,
69 A little less than half of the studies were conducted outside the U.S. (Canada, Australia, India, Thailand, Belgium, Hungary and the Netherlands). Eight studies were conducted in an academic setting, three in a community hospital, and four in both types of centers; the remaining studies did not report study setting. Most studies were small to medium-sized; 10 studies had sample sizes of more than 1,000 women (Table 2.2).

Table 2.1. RCTs of elective induction of labor: Study information
Article
Year of
Publi-cation
Study Period Location Setting Control Group Sample Size Induction Method Study
Rating
Applic-ability
to KQ1
and/or KQ2
Applicability to KQ 1
and/or KQ2 for GA<41
weeks
Applic-ability
to KQ3
Control Group
Induced Labor
Amano et al.63± 1999 NS Japan Academic
Center SL 72 63 Oxytocin, AROM, PGE2 gel, some laminaria tents
Poor Poor Poor -
Cole et al.67 1975 NS Scotland Academic Center EM 117 111 Oxytocin, AROM Poor Poor Poor Poor
Dyson et al.74* 1987 1983-1985 United
States Community
Hospital EM 150 152 Oxytocin, AROM, PGE2 gel Fair Fair Poor Fair
Egarter et al.55*# 1989 NS Austria Academic
Center EM 165 180 PGE2 gel Poor Fair Poor Fair
Gelisen et al.8 2005 NS Turkey Academic
Center EM 300 300 Oxytocin, Misoprostol, Foley catheter Fair Fair Poor -
Hannah et al.27, 112 1992 Nov 1985-
Dec 1995 Canada Multi-Center EM 1706 1701 Oxytocin, AROM,
PGE2 gel Good Fair Poor -
Heimstad et al.59 2007 Sep 2002-
Jul 2004 Norway Academic Center EM 254 254 Oxytocin, AROM,
Misoprostol Fair Fair Poor -
Martin et al.66 1978 NS Ireland NS SL 92 92 Oxytocin, AROM Poor Poor Poor Poor
Nielsen et al.7* 2005 1999-2002 United
States Academic
Center EM 110 116 Oxytocin, AROM (either or both) Fair Fair Poor Fair
NICHHD24≠+1994 Dec 1987-
Jul 1989 United States
Multi-Center EM 174 264 Oxytocin, AROM,
PGE2 gel Good Good Poor Good
Tylleskar et al.65 and Leijon et al.113, 114±
1979 NS Sweden Multi-Center EM 41 43 Oxytocin, AROM Poor Poor Poor Poor
Note: KQ=Key Question; GA=gestational age; NS=NS; SL=spontaneous labor; AROM=artificial rupture of membranes; PGE2=prostaglandin; EM=expectant management ± Nulliparous women only; *Also reports predictors of Cesarean section in the setting of induction of labor; #Also reports predictors of vaginal delivery within 24 hours in the setting of induction of labor; ≠Also reports predictors of vaginal delivery within 12 hours in the setting of induction of labor + This RCT compared expectant management to two groups with different methods of induction; we combined the data from the two methods for our analysis since we were not comparing different methods of induction
39

Table 2.2. Observational studies of elective induction of labor: Study information
Article
Year of
Publi-cation
Study Period Location Setting Control
Group Sample Size Induction Method
Study Rating
Applic-ability to
KQ1 and/or KQ2
Applicability to KQ 1
and/or KQ2 for GA<41
weeks
Applic-ability
to KQ3
Control Group
Induced Labor
Belsky34
1982
Sep 1979-Oct
1980
United States
Community Hospital SL 918 35 Oxytocin Poor Poor Poor -
Booth and Kurdyak68 1970
Jan 1962-Sep 1967
Canada NS SL 213 213 Oxytocin, Spartocin,
AROM Poor Poor Poor Poor
Boulvain et al.48×
2001
Jan 1990-Dec 1995
Canada Academic Center SL 3353 531
Oxytocin, AROM PGE2
gel Poor Poor Poor -
2002 1996-1997 Belgium
Academic Center and Community
Hospital
SL 7683 7683 NS Poor Poor Poor -
Cammu et al.17±
Dublin et al.61 2000 1989-
1993 United States
Academic Center and Community
Hospital
SL 9648 2886 NS Poor Poor Poor Fair
Glantz9 2005 1998-1999
United States NS SL 10608 1241 Oxytocin,
PGE2 gel Poor Poor Poor -
2002 1994-2000
United States
Community Hospital SL 304 304 Oxytocin,
PGE2 gel Poor Poor Poor Good Heinberg et al.15††
2006
Jan 2002-Mar 2004
United States
Academic Center SL 1885 796
Oxytocin, AROM,
PGE2 gel, Foley
catheter
Poor Poor Poor Good
Hoffman et al.69††
Lampe31 and Lampe et al.115
1986 NS Hungary Academic Center SL 2750 2020 Oxytocin,
AROM Poor Poor Poor -
40

Table 2.2. Observational studies of elective induction of labor: Study information (continued)
Year of
Publi-cation
Study Period Location Setting Control
Group Sample Size Induction Method
Study Rating
Applic-ability
to KQ1
and/or KQ2
Applic-ability to
KQ 1 and/or
KQ2 for GA<41 weeks
Applic-ability
to KQ3
Article
Control Group
Induced Labor
2004 1999-2000
United States
Academic Center and Community
Hospital
SL 2673 542 NS Poor Poor Poor Fair
Luthy et al. 11*±
1992
Jan 1990-Dec 1990
United States
Community Hospital SL 253 253
Oxytocin, AROM PGE2
gel Poor Poor Poor Good
Macer et al.28*‡
Maslow and Sweeny62 2000 1997-
1998 United States NS SL 872 263 NS Poor Poor Poor Good
McBride et al.37 1977 1970-
1971 Australia NS SL 32 69 Oxytocin, AROM Poor Poor Poor -
Melton et al.64 1979
Jan 1976-Dec 1976
United States
Academic Center and Community
Hospital
SL 63 63 Oxytocin,
AROM, PGE2 gel
Poor Poor Poor -
Mukherjee and Sood76 1995 1992-
1993 India Academic Center SL 100 100 Oxytocin,
AROM Poor Poor Poor Poor
Prysak and Castronova21 1998 1995-
1996 United States NS SL 461 461 Oxytocin,
AROM Poor Poor Poor Good
Robson et al.22 1997
Jul 1994-Jun
1995
Australia Academic Center SL 1092 146
Oxytocin, AROM PGE2
gel Poor Poor Poor Fair
Seyb et al.20 ±
1999
Nov 1996-Jun
1997
United States
Academic Center SL 1124 143 Oxytocin Poor Poor Poor Good
41

42
Table 2.2. Observational studies of elective induction of labor: Study information (continued)
Article
Year of
Publi-cation
Study Period Location Setting Control
Group Sample Size Induction Method
Study Rating
Applic-ability
to KQ1
and/or KQ2
Applic-ability to
KQ 1 and/or
KQ2 for GA<41 weeks
Applic-ability
to KQ3
Control Group
Induced Labor
van Gemund et al.47 2003 1997-
1999 United States
Academic Center SL 122 122
Oxytocin, AROM PGE2
gel Poor Poor Poor Fair
Vierhout et al.75 and Out et al.116, 117 1985
May 1980 -Sep 1981
Nether-lands
Academic Center SL 156 184 Oxytocin,
AROM Poor Poor Poor -
2005 2000-2002
Nether-lands NS SL 765 189
Oxytocin, AROM, PGE2
gel Poor Poor Poor Fair
1993
Jan 1990-Jun
1990
Thailand NS SL 249 262 Oxytocin, AROM Poor Poor Poor Poor
Vrouen-raets et al.60*±
Wilailak et al.71*
1999 1990-1997
United States NS SL 4086 197 PGE2 gel Poor Poor Poor Good Yeast et al.50
KQ=Key Question; GA=gestational age; SL=spontaneous labor; NS=not specified; AROM=artificial rupture of membranes; PGE2=prostaglandin *Also reports predictors of Cesarean section in the setting of induction of labor ‡Also reports predictors of spontaneous vaginal delivery in the setting of induction of labor ×Also reports predictors of overall vaginal delivery in the setting of induction of labor ±Study conducted among nulliparous women only; ††Study conducted among multiparous women only

Overall Quality and Applicability of Included Studies
The overall quality of the studies included in this review was generally poor. However, there were some good and fair quality prospective RCTs addressing Key Questions 1 and 2 (Figure 2.2 and Table 2.1). As seen in Figure 2.2, most of the RCTs compared induction of labor with expectant management, though several actually excluded women who ended up being induced from the comparison group to reframe their study as comparing elective induction of labor to spontaneous labor. Most of the studies were small (less than 400 subjects) or medium (400 to 1000 subjects) in size and a minority of them had conducted sample size calculations to determine whether they had adequate power to address the primary question of the study. Figure 2.2. Quality assessment of RCTs of elective induction of labor
-100% -80% -60% -40% -20% 0% 20% 40% 60% 80% 100%
Analysis stratified by parity
Multivariable analysis to control for confounding
Intent to treat analysis
Statistical tests utilized
Sample size achieved
Sample size calculation done
Total subjects >1000
Total subjects 400-1000
Total subjects <400
Immediate follow-up > 95%
Loss to follow-up reported
Masking achieved
Masking attempted
Good balance between arms
Randomization stratified by parity
Randomization method described
Comparison group expectant management
Percent of Included RCTs
Yes No Not applicable or not reported The vast majority of the observational studies addressing Key Questions 1 and 2 utilized a
spontaneous labor group as a comparison group, so were rated as poor quality (Figure 2.3 and Table 2.2). As seen in Figure 2.3, most of the studies did not compare induction of labor with expectant management which resulted in their getting a poor quality rating. Similar to the RCTs, most of the studies were small (less than 400 subjects) or medium, (400 to 1000 subjects) in size and a minority of them had conducted sample size calculations to determine whether they had adequate power to address the primary question of the study.
43

Figure 2.3. Quality assessment of observational studies of elective induction of labor
-100% -80% -60% -40% -20% 0% 20% 40% 60% 80%
Analysis stratified by parity
Multivariable analysis to control for confounding
Statistical tests utilized
Sample size achieved
Sample size calculation done
Total subjects >1000
Total subjects 400-1000
Total subjects <400
Immediate follow-up > 95%
Loss to follow-up reported
Good balance between arms
Prospective study
Comparison group expectant management
Percent of Included Observational Studies
Yes No Not applicable or not reported For Key Question 3, no comparison group was needed, so there were more fair and good
quality studies (Tables 2.1 and 2.2 and Appendix C, Tables 1 and 2). However, the overall strength of evidence for most components of the Key Questions was low or insufficient because of the relatively small number of studies addressing the outcomes and the poor quality of the studies.
There was considerable heterogeneity among the studies on elective induction of labor which, similar to the quality rating, led to primarily poor applicability ratings as well. Again, to address Key Questions 1 and 2 it was important to have the appropriate comparison group of expectant management, so the vast majority of the observational studies had poor applicability to these questions (Table 2.2). The most likely source of heterogeneity was the time during which the studies were conducted. Obstetric management has changed significantly over the past 30 years as has the baseline cesarean delivery rate. Because several of the RCTs were older, their applicability was downgraded as well. Study country, type of hospital, variation in geographic practice patterns, variation among clinicians, gestational age of the women included, initial Bishop score (cervical assessment for induction favorability), parity, maternal age, and study design are additional possible sources of heterogeneity. However, because the data on these variables, except for study design, were not reported consistently, we could not explore these potential sources of heterogeneity in our analyses.
44

Key Question 1: What evidence describes the maternal risks of elective induction versus expectant management?
As noted in Figure 2.4, few studies reported mode of delivery and maternal outcomes of interest. Since cesarean, spontaneous, and operative vaginal deliveries are correlated, we present results for only cesarean and operative vaginal deliveries. In this section, we present the detailed results of our evidence synthesis first for the randomized, controlled trials, followed by the observational studies. At the end of this section, we summarize the evidence addressing Key Question 1.
Figure 2.4. Maternal outcomes reported
-100% -80% -60% -40% -20% 0% 20% 40% 60%
Maternal infection
Endoymometritis
Wound complications
Injury to organs - bowel/bladder
Hysterectory
Blood transfusion
Postpartum hemorrhage
3rd/4th degree perineal laceration
Mean estimated blood loss
Median 2nd stage of labor
Median 1st stage of labor
Median labor
Mean 2nd stage of labor
Mean 1st stage of labor
Mean labor
Prolonged 2nd stage of labor
Prolonged 1st stage of labor
Prolonged labor
Chorioamnionitis
Operative vaginal delivery
Spontaneous vaginal delivery
Cesarean delivery
Percent of Total Included Studies
Outcome Not Reported Outcome Reported
Randomized controlled trials of elective induction of labor
Mode of delivery: Cesarean delivery. Elective induction of labor versus expectant management. Nine RCTs compared elective
induction of labor to expectant management, with cesarean delivery as the primary outcome. The studies included a total of 6,138 women: 3,017 in the expectant management group and 3,121 in the elective induction of labor group. The overall cesarean delivery rate among the women who were induced and those who were expectantly managed was 11 percent and 14 percent, respectively. When compared to women who were expectantly managed, women who had elective induction of labor were at lower risk for cesarean delivery (Odds ratio (OR) 1.22; 95 percent CI 1.07-1.39, Figure 2.5 and risk difference 0.02 (95 percent CI: 0.002 to 0.04),
45

46
Appendix C Figure 1; one study65 could not be included in the calculation of the summary odds ratio because it reported zero cesarean deliveries for both groups). The test for heterogeneity revealed that these studies were relatively homogenous (Figure 2.5). There was some evidence of publication bias for this outcome: The fail-safe N required to reduce publication bias was seven studies. Considering the quality of the body of evidence and its applicability to care in the U.S. today, the evidence for elective induction of labor and cesarean delivery was rated as moderate because of the size and number of studies and consistency of the findings.
The majority of these prospective RCTs were in women at or beyond 41 0/7 weeks of gestation. In this subgroup, there was a statistically significant increase in cesarean delivery in the women managed expectantly (OR 1.21, 95 percent CI 1.01-1.46) and the evidence for this subgroup was also rated as moderate because of the size and number of studies and consistency of the findings. Only three trials55, 65, 67 were conducted among women with gestational age less than 41 weeks; no other trials reported results stratified by gestational age less than 41 weeks. All of these RCTs reported no statistically significant difference in risk of cesarean delivery between women undergoing elective induction of labor versus those who were expectantly managed (Figure 2.6 and Appendix C Figure 2). However all of these articles were rated as being of poor quality primarily due to their small sample size. Thus, the overall evidence for elective induction of labor prior to 41 weeks of gestation was rated as insufficient.
Two studies individually reported significant differences in cesarean delivery between the women who were electively induced and those who were managed expectantly. The study by Dyson et al.74 reported the highest odds of cesarean delivery among women who were expectantly managed. This was a medium sized study, rated fair quality, with 352 women randomized at 41 weeks of gestation to induction of labor (n=152) versus expectant management with antenatal fetal testing (n=150). The rates of cesarean delivery in the study were 14.5 percent in the induction group as compared to 27.3 percent in the expectant management group (P<0.01). The principle cause of this difference appeared to be cesarean delivery for fetal distress, which was 1.3 percent in the induced group and 14.0 percent in the expectant management group (P<0.01).
The study by Hannah et al.,27 conducted in Canada and published in 1992, was the largest randomized trial included in our analysis, and was rated as good quality. It included 1,701 women in the induction of labor group and 1,706 women in the expectant management group. This study reported a significantly higher risk of cesarean delivery among women who were managed expectantly than those who were induced (24.5 percent vs. 21.2 percent, P=0.03). When this study was removed during sensitivity analysis, the summary effect changed to no difference in the summary odds of cesarean delivery between induced labor and expectant management (OR 1.24; 95 percent CI: 0.99-1.55, P=0.061).
We were interested in the extent to which changes in practice over time affected the rates of cesarean delivery among women with expectant versus induced labor. When we stratified the studies to those conducted in or prior to 1990 and those conducted after 1990, there was no difference in the odds of cesarean delivery for either of the two groups (Figure 2.7 and Appendix C Figure 3).
We were also interested in the extent to which geographic variations in practice patterns may have affected the rates of cesarean delivery among women with expectant versus induced labor. Six RCTs, including 5,172 women, were conducted outside of the U.S. (in Austria, Norway, Sweden, Turkey, Canada, and the United Kingdom) and three RCTs, including 966 women, were

Figure 2.5. RCTs of elective induction of labor versus expectant management: Cesarean delivery
47
Heterogeneity statistics: Q-value 6.838, P-value 0.446, I-squared 0.00 CS: cesarean section; Mgt: management
Study Name Statistics for each study Event / Total Odds ratio and 95% CI
Odds Lower Upper Expectant Induced ratio limit limit p-Value Mgt CS CS
Cole 1.767 0.573 5.445 0.322 9 / 117 5 / 111Dyson 2.223 1.248 3.958 0.007 41 / 150 22 / 152Hannah 1.209 1.030 1.419 0.020 418 / 1706 360 / 1701NICHHD 0.856 0.527 1.391 0.531 32 / 174 55 / 264Egarter 1.648 0.272 9.989 0.587 3 / 165 2 / 180Nielsen 1.059 0.383 2.927 0.912 8 / 110 8 / 116Heimstad 1.205 0.705 2.061 0.495 33 / 254 28 / 254Gelisen 1.177 0.792 1.748 0.420 66 / 300 58 / 300
1.218 1.068 1.389 0.003 610 / 2976 538 / 3078
0.1 0.2 0.5 1 2 5 10
Higher for Induced Lower for Induced
Summary

Figure 2.6. RCTs of elective induction of labor versus expectant management: Cesarean delivery, stratified by gestational age
Heterogeneity statistics Q-value P-value I-squared >= 41 weeks 6.301 0.278 20.647 < 41 weeks 0.004 0.949 0.00
48
Study Name Statistics for each study Event / Total Odds ratio and 95% CI
Odds Lower Upper Controls Induced ratio limit limit p-Value CS CS
Dyson 2.223 1.248 3.958 0.007 41 / 150 22 / 152Hannah 1.209 1.030 1.419 0.020 418 / 1706 360 / 1701NICHHD 0.856 0.527 1.391 0.531 32 / 174 55 / 264Nielsen 1.059 0.383 2.927 0.912 8 / 110 8 / 116Heimstad 1.205 0.705 2.061 0.495 33 / 254 28 / 254Gelisen 1.177 0.792 1.748 0.420 66 / 300 58 / 300
1.214 1.009 1.460 0.040 598 / 2694 531 / 2787
Cole 1.767 0.573 5.445 0.322 9 / 117 5 / 111Egarter 1.648 0.272 9.989 0.587 3 / 165 2 / 180
1.733 0.667 4.501 0.259 12 / 282 7 / 291
0.1 0.2 0.5 1 2 5 10
Higher for Induced Lower for Induced
>= 41 weeks
< 41 weeks
Summary
Summary

Figure 2.7. RCTs of elective induction of labor versus expectant management: Cesarean delivery, stratified by study year
Heterogeneity statistics Q-value P-value I-squared 1990 or earlier 6.721 0.151 40.489 After 1990 0.049 0.976 0.00
Study Name Statistics for each study Event / Total Odds ratio and 95% CI
Odds Lower Upper Expectant Induced ratio limit limit p-Value Mgt CS CS
Cole 1.767 0.573 5.445 0.322 9 / 117 5 / 111Dyson 2.223 1.248 3.958 0.007 41 / 150 22 / 152Hannah 1.209 1.030 1.419 0.020 418 / 1706 360 / 1701NICHHD 0.856 0.527 1.391 0.531 32 / 174 55 / 264Egarter 1.648 0.272 9.989 0.587 3 / 165 2 / 180
1.297 0.946 1.780 0.107 503 / 2312 444 / 2408
Nielsen 1.059 0.383 2.927 0.912 8 / 110 8 / 116Heimstad 1.205 0.705 2.061 0.495 33 / 254 28 / 254Gelisen 1.177 0.792 1.748 0.420 66 / 300 58 / 300
1.175 0.867 1.592 0.299 107 / 664 94 / 670
0.1 0.2 0.5 1 2 5 10
Higher for Induced Lower for Induced
1990 or earlier
After 1990
Summary
Summary
49

Figure 2.8. RCTs of elective induction of labor versus expectant management: Cesarean delivery, stratified by study location
50
Heterogeneity statistics Q-value P-value I-squared Non-U.S. 0.564 0.967 0.00 U.S. 6.258 0.044 68.039
Study Name Statistics for each study Event / Total Odds ratio and 95% CI
Odds Lower Upper Expectant Induced ratio limit limit p-Value Mgt CS CS
Cole 1.767 0.573 5.445 0.322 9 / 117 5 / 111Hannah 1.209 1.030 1.419 0.020 418 / 1706 360 / 1701Egarter 1.648 0.272 9.989 0.587 3 / 165 2 / 180Heimstad 1.205 0.705 2.061 0.495 33 / 254 28 / 254Gelisen 1.177 0.792 1.748 0.420 66 / 300 58 / 300
1.214 1.054 1.399 0.007 529 / 2542 453 / 2546
Dyson 2.223 1.248 3.958 0.007 41 / 150 22 / 152NICHHD 0.856 0.527 1.391 0.531 32 / 174 55 / 264Nielsen 1.059 0.383 2.927 0.912 8 / 110 8 / 116
1.277 0.654 2.494 0.473 81 / 434 85 / 532
0.1 0.2 0.5 1 2 5 10
Higher for Induced Lower for Induced
Non-U.S.
U.S.
Summary
Summary

conducted in the U.S. (Figure 2.8 and Appendix C Figure 4). We found that the odds of cesarean delivery were higher in women who were expectantly managed compared to elective induction of labor in studies conducted outside the U.S. (OR 1.21; 95 percent CI 1.05-1.40) but were not different in studies conducted in the U.S. (OR 1.28; 95 percent CI 0.65-2.49, Figure 2.8 and Appendix C Figure 4). This is likely due to the effect of the Canadian study by Hannah et al. (cesarean delivery rate between the induced labor and expectant management groups was 21 percent versus 25 percent, respectively and OR 1.21; 95 percent CI 1.03-1.42, P=0.02).27
Relatively little RCT data addressed the question of whether parity affects the comparative cesarean delivery rate between expectant management and induced labor. Three RCTs7, 55, 74 reported cesarean delivery as an outcome specifically among nulliparous women. These studies included a total of 506 nulliparous women: 256 in the expectant management group and 250 in the elective induction of labor group. There was no statistically significant difference in the risk of cesarean delivery between the two groups (OR 1.67; 95 percent CI: 0.81-3.46, P=0.17). Thus, there was insufficient information to draw any conclusions about the effect of elective induction on nulliparous women specifically.
The same three RCTs7, 55, 74 also reported cesarean delivery among a total of 367 multiparous women. In all three studies, the rate of cesarean deliveries was low, with one study reporting no events among the women who were expectantly managed and only one among the women who underwent induced labor.55 In the other two studies, there were three and two cesarean deliveries, respectively, among the women who were electively managed and only one and two among those who were induced.7, 74 Thus, there was insufficient information to draw any conclusions about the effect of elective induction on multiparous women.
Elective induction of labor versus spontaneous labor. One RCT compared the cesarean delivery rate among women with elective induction of labor and those with spontaneous labor.66 This trial was conducted Ireland and published in 1978. They included 92 women in each arm and reported only one cesarean delivery in the spontaneous labor group and four in the elective induction of labor group. When we included this study in our synthesis of elective induction of labor versus expectant management, women with induced labor remained at lower risk for cesarean delivery (OR 1.21; 95 percent CI: 1.03-1.44, P=0.023 and risk difference 0.014; 95 percent CI: -0.005 to 0.033, P=0.16). The studies remained relatively homogeneous (heterogeneity statistics for summary odds ratio: Q-value 8.89, P-value 0.35, I-squared 9.97; heterogeneity statistics for summary risk difference: Q-value 14.02, p-value 0.12, I-squared statistics 35.79). One RCT compared the cesarean delivery rate among nulliparous women undergoing elective induction of labor to the rate in women who had spontaneous labor.63 This study, conducted in Japan in 1999, randomized 194 women to elective induction of labor at 39 weeks versus expectant management up to 42 weeks. Ninety-eight women were randomized to the induction of labor; however, 35 went into labor prior to 39 weeks and were excluded from the analysis. 96 women were randomized to the expectant management group and 10 were induced for obstetric reasons (postterm, nonreassuring antenatal testing). Additionally, 14 women delivered prior to 39 weeks and were excluded as well. This left 63 women who were electively induced compared to 72 women who went into spontaneous labor beyond 39 weeks of gestation. The rate of cesarean delivery was not different between the two groups, 6.4 percent in those induced and 5.6 percent in the spontaneous labor group. No RCTs compared elective induction of labor to spontaneous labor among multiparous women.
51

52
Mode of delivery: Operative vaginal delivery. Six RCTs7, 27, 55, 59, 65, 67 reported the rate of operative vaginal delivery (including both vacuum-assisted vaginal delivery and forceps delivery, Figure 2.9) in women who underwent elective induction of labor or expectant management. The overall rate of operative vaginal delivery was the similar in both groups (13 percent versus 12 percent, respectively). There was no difference in the risk of operative vaginal delivery between women who were expectantly managed and those who had elective induction of labor (OR 0.91; 95 percent CI 0.79-1.04, Figure 2.9; and risk difference -0.01 (-0.03 to +0.01), Appendix C Figure 5). Three RCTs reported the risk of operative vaginal delivery among women who were induced at less than 41 weeks gestational age and found no difference between women who were induced and women who were expectantly managed (OR 0.71, 95 percent CI: 0.41-1.21, P=0.21). Over time, there was an increased risk of operative vaginal delivery for the induced labor group when compared with the expectant management group; in the oldest study conducted in 1975, 67 the odds ratio was 0.65 (95 percent CI: 0.36-1.17) and in the latest study conducted in 2005,59 the odds ratio was 0.83 (95 percent CI: 0.48-1.42), which was not statistically significant (Figure 2.10). There was no change in the overall effect sizes in sensitivity analysis and there was no evidence of publication bias for this outcome. Because of the consistency, quality, and number of individual studies, the overall evidence for this outcome was determined to be moderate. With respect to the stratified analyses at 41 0/7 weeks of gestation, the overall evidence was rated as low. The evidence examining the effect on operative vaginal delivery before 41 0/7 weeks was considered insufficient.
Egarter et al.55 reported operative vaginal delivery rates among nulliparous and multiparous women. Among the nulliparous women, 3 of 88 (3.4 percent) women in the expectant labor group and 3 of 99 (3.0 percent) women in the elective induction of labor group had operative vaginal deliveries. Among the multiparous women, none of the 77 women in the expectant management group and only 1 of 81 women in the elective induction of labor group had operative vaginal deliveries.
No RCTs reported operative vaginal delivery when comparing elective induction of labor to spontaneous labor.
Maternal outcomes: Postpartum hemorrhage. Only one RCT, including 254 women in each arm of the study, examined the risk of postpartum hemorrhage associated with elective induction of labor when compared with expectant management.46 The rate of postpartum hemorrhage was the similar in both groups (12 percent versus 13 percent, respectively). Postpartum hemorrhage was not reported separately by parity.
No RCTs reported postpartum hemorrhage rates comparing elective induction of labor with spontaneous labor.
Maternal outcomes: Maternal infection. Three RCTs reported the risk of maternal infection associated with elective induction of labor when compared with expectant management.7, 24, 27 The studies included a total of 4,073 women: 1,991 in the expectant management arm and 2,082 in the elective induction of labor arm. There was no difference in the risk of maternal infection between the two groups (OR 1.06; 95 percent

Figure 2.9. RCTs of elective induction of labor versus expectant management: Operative vaginal delivery
Heterogeneity statistics; Q-value 2.254, P-value 0.813, I-squared 0.00 OVD: operative vaginal delivery; Mgt: management
Study Name Statistics for each study Event / Total Odds ratio and 95% CI
Odds Lower Upper Expectant Induced ratio limit limit p-Value Mgt OVD OVD
Cole 0.647 0.357 1.172 0.151 26 / 117 34 / 111Tylleskar 2.154 0.188 24.704 0.538 2 / 41 1 / 43Hannah 0.927 0.797 1.079 0.328 449 / 1706 473 / 1701Egarter 0.815 0.180 3.696 0.791 3 / 165 4 / 180Nielsen 1.203 0.447 3.238 0.715 9 / 110 8 / 116Heimstad 0.825 0.479 1.422 0.489 27 / 254 32 / 254
0.908 0.790 1.044 0.176 516 / 2393 552 / 2405
0.1 0.2 0.5 1 2 5 10
Higher for Induced Lower for Induced
Summary
53

54
Figure 2.10. RCTs of elective induction of labor versus expectant management: Operative vaginal delivery, stratified by study year
Heterogeneity statistics Q-value P-value I-squared 1990 or earlier 1.825 0.609 0.00 After 1990 0.427 0.12 0.00
Study Name Statistics for each study Event / Total Odds ratio and 95% CI
Odds Lower Upper Expectant Induced ratio limit limit p-Value Mgt OVD OVD
Cole 0.647 0.357 1.172 0.151 26 / 117 34 / 111Tylleskar 2.154 0.188 24.704 0.538 2 / 41 1 / 43Hannah 0.927 0.797 1.079 0.328 449 / 1706 473 / 1701Egar r 0.815 0.180 3.696 0.791 3 / 165 4 / 180
0.909 0.786 1.052 0.200 480 / 2029 512 / 2035te
10
Higher for Induced Lower for Induced
5
Nielsen 1.203 0.447 3.238 0.715 9 / 110 8 / 116Heimstad 0.825 0.479 1.422 0.489 27 / 254 32 / 254
0.901 0.559 1.451 0.667 36 / 364 40 / 370
0.1 0.2 0.5 1 2
1990 or earlier
After 1990
Summary
Summary

CI: 0.78-1.43 and risk difference 0.005 (-0.006 to +0.02)). Maternal infection rates were not reported separately by parity.
Other maternal outcomes. Seven RCTs reported other maternal outcomes including length of labor, perineal lacerations, and blood transfusion (Tables 2.3 and 2.4). There were no notable differences in these outcomes, though these findings were from small studies. Specifics regarding these outcomes are noted in the summary section at the end of the section on Key Question 1. Table 2.3. RCTs of elective induction of labor studies: Other maternal outcomes†
3rd/4th degree perineal
laceration %
Blood Transfusion
%
Prolonged 1st Stage Labor %
Prolonged 2nd Stage Labor %
Study Sample size Labor
mean hours (SD)
CG EIOL Elective induction of labor versus expectant management Cole et al.67 117 111 EM=7.0 (3.4)
EIOL=6.4 (3.1) NR NR NR NR
Dyson et al.74 150 152
EM=12.5 (5.9) EIOL=10.5 (5.2)
(p <0.01) NR NR NR NR
Egarter et al.55 165 180 EM=8.48 EIOL=6.18 NR NR NR NR
Heimstad et al.59 254 254 NR
EM=5.9 EIOL=7.1 (P=0.6)
NR EM=4.3
EIOL=2.4 (P=0.23)
EM=9.4 EIOL=6.3 (P=0.19)
NICHHD24 174 264 NR NR EM=1.7 EIOL=0.75 NR NR
Tylleskar et al.65 and Leijon et al.113, 114
41 43 SL=6.49 EIOL=4.89 NR NR NR NR
Elective induction of labor versus spontaneous labor Martin et al.66
92 92 SL=6.9 (0.4)
EIOL=8.3 (0.52) (P<0.05)
NR NR NR NR
CG=control group; EIOL=elective induction of labor group; EM=expectant management; SL=spontaneous labor; NR=not reported; if an individual article reported P-values for a specific outcome, those P-values have been shown in the table. † Oligohydramnios, active second stage of labor less than 15 minutes, active second stage of labor more than 60 minutes, labor less than 3 hours, emergency abdominal delivery for worrying fetal heart rate, shoulder dystocia, rupture of membranes over 24 hours before delivery, abruptio placentae, and mean blood loss after vaginal delivery were each reported by one study. Mean maternal hospital stay (days), uterine hypertonus or hyperactivity, and placental retention were each reported by two studies. Table 2.4. RCTs of elective induction of labor studies: Other maternal outcomes among multiparous women†
Study Sample Size Labor mean hours (SD)
SL EIOL Group Group
Dyson et al.74 150 152 EM=8.0 (3.7); EIOL=6.5 (3.1), P<0.05 Egarter et al.55 165 180 EM=6.2 (3.8); EIOL=5.3 (3.3) Tylleskar et al.65 and Leijon et al.113, 114 41 43 SL=5.3 (2.5); EIOL=4.0 (1.8) SL=spontaneous labor; EIOL=elective induction of labor group; EM=expectant management; if an individual article reported P-values for a specific outcome, those P-values have been shown in the table. † mean uterine activity at 6 cm (Montevideo units) and bleeding during third stage of labor (ml) were each reported by one study.
55

Observational Studies of Elective Induction of Labor Unlike RCTs which usually designated expectant management as the control group, most observational studies chose women who presented with spontaneous labor as the control group. While there was only one cohort study which compared elective induction of labor to expectant management, there were 21 observational studies which assessed the risk of elective induction of labor compared with spontaneous labor. Because this comparison did not specifically answer Key Questions 1 and 2 which were to address elective induction of labor versus expectant management, studies of this type were considered to provide additional relevant evidence, but were considered separately. We report our synthesis of these studies below, first for mode of delivery and then by maternal outcomes.
Mode of delivery: Cesarean delivery. Elective induction of labor versus expectant management. We found only one retrospective cohort study, published in 1986, comparing elective induction of labor with expectant management that reported cesarean delivery as an outcome.31 Women who were electively induced were compared to those who had not been electively induced who either went into spontaneous labor or were induced postterm at 42 weeks of gestation. The rate of cesarean delivery was 1.0 percent in the women who were electively induced and 6.7 percent in those expectantly managed. Additionally, the authors found better neonatal outcomes in the induced group as well a lower rate of 5-minute Apgar scores 7 or less (3.7 percent versus 17.6 percent), lower overall neonatal morbidity (3.4 percent versus 7.0 percent), and neonatal mortality (0.5 percent versus 1.7 percent).
Elective induction of labor versus spontaneous labor. Twelve observational studies reported cesarean delivery rates comparing women with elective induction of labor with spontaneous labor.21, 22, 28, 34, 47, 48, 50, 61, 62, 68, 71, 75 The rate of cesarean delivery was six (standard error 0.6) percent among the spontaneous labor group and eight (standard error 1.3) percent in the elective induction group. All, except two,34, 68 of the studies reported a consistently lower risk of cesarean delivery among women who underwent spontaneous labor compared with women who had an elective induction of labor (Figure 2.11 and Appendix C Figure 6). When we combined these studies, women who underwent spontaneous labor were less likely to have a cesarean delivery when compared with women who were electively induced (OR 0.63; 95 percent CI: 0.49-0.79, Figure 2.11; and risk difference -0.03 (-0.04 to -0.01), Appendix C Figure 6). These studies were highly heterogeneous (Figure 2.11 and Appendix C Figure 6). Seven of the studies reported individual effect sizes that were not statistically significant for the risk of cesarean delivery between the two groups. When each of these studies was removed sequentially in sensitivity analysis, the summary effect size became statistically significant with a decreased risk of cesarean delivery for women who underwent spontaneous labor compared with elective induction of labor. There was no indication of significant publication bias. Ten retrospective studies11, 17, 21, 28, 47, 48, 50, 60-62 and one prospective cohort study20 reported the risk of cesarean delivery among nulliparous women comparing those who had elective induction of labor to women in spontaneous labor. The twelve studies included a total of 33,168 women: 22,317 who had spontaneous labor and 10,851 who had elective induction of labor (Figure 2.12). The risk of cesarean delivery was consistently and significantly lower in the spontaneous labor group compared with the elective induction of labor group in all but two of the studies28 21 (Figure 2.12 and Appendix C Figure 7). The overall rate of cesarean delivery in the spontaneous group was nine (s.e.1.0) percent compared with 19 (s.e. 2.4) percent in the group electively induced. When we combined these studies, women who had spontaneous labor had an almost 50
56

57
percent reduction in the odds of cesarean delivery compared to women who were electively induced (OR 0.48; 95 percent CI 0.41-0.56, Figure 2.12; and risk difference -0.09 (-0.12 to -0.67), Appendix C Figure 7). These results remained the same when studies were stratified by location: There was a lower risk of cesarean delivery among women who had spontaneous labor compared with those who were electively induced for studies conducted within the U.S. and those conducted outside the U.S. (Appendix C Figures 8 and 9). There was considerable heterogeneity among the studies. These results remained significant during sensitivity analysis and there was no significant indication of publication bias. Nine observational studies reported cesarean delivery among multiparous women comparing spontaneous labor with elective induction of labor. The studies included a total of 20,617 women: 16,081 who underwent spontaneous labor and 4,536 who had elective induction of labor (Figure 2.13). For these multiparous women, there was a lower risk of cesarean delivery among women who had spontaneous labor compared with women who were electively induced (OR 0.78; 95 percent CI 0.63-0.65, Figure 2.13; and risk difference -0.005 (-0.01 to 0.0, Appendix C Figure 10). In sensitivity analysis, when we removed one study at a time, when the study by Hoffman et al.69 was excluded, there was no longer a statistically significant difference in risk of cesarean delivery between the two groups (OR 0.83; 95 percent CI: 0.66-1.05, P=0.12) as this study was large and had one of the largest clinical effect sizes. This outcome showed some evidence of publication bias (fail-safe N was eight studies).
Thus, overall, these observational studies found that induction of labor was associated with a higher rate of cesarean delivery. This difference persisted among both nulliparous and multiparous women.

Figure 2.11. Observational studies of elective induction of labor versus spontaneous labor: Cesarean delivery
58
Study Name Statistics for each study Event / Total Odds ratio and 95% CI
Odds Lower Upper Controls Induced ratio limit limit p-Value CS CS
Booth 2.379 0.607 9.324 0.214 7 / 213 3 / 213Belsky 4.203 0.569 31.036 0.159 101 / 918 1 / 35Vierhout 0.389 0.040 3.780 0.416 1 / 156 3 / 184Dublin 0.568 0.482 0.669 0.000 464 / 9066 233 / 2687Boulvain 0.451 0.313 0.651 0.000 122 / 3353 41 / 531Yeast 0.797 0.599 1.060 0.119 509 / 9723 56 / 864Macer 0.726 0.430 1.228 0.233 28 / 253 37 / 253Wilailak 0.832 0.526 1.317 0.432 40 / 249 49 / 262Robson 0.819 0.469 1.432 0.484 100 / 1092 16 / 146Prysak 0.553 0.325 0.939 0.028 23 / 461 40 / 461van Gemund 0.048 0.006 0.364 0.003 1 / 122 18 / 122Maslow 0.358 0.215 0.594 0.000 37 / 872 29 / 263
0.626 0.494 0.794 0.000 1433 / 26478 526 / 6021
0.1 0.2 0.5 1 2 5 10
Higher for Induced Lower for Induced
Heterogeneity statistics: Q-value 27.925, P-value 0.003, I-squared: 60.608 CS: cesarean section
Summary

Figure 2.12. Observational studies of elective induction of labor versus spontaneous labor: Cesarean delivery among nulliparous women
59
Heterogeneity statistics: Q-value 23.92, P-value 0.004, I-squared: 62.375 CS: cesarean section
Study Name Statistics for each study Event / Total Odds ratio and 95% CI
Odds Lower Upper Controls Induced ratio limit limit p-Value CS CS
Dublin 0.455 0.376 0.550 0.000 355 / 3603 197 / 1017Boulvain 0.358 0.241 0.532 0.000 113 / 1724 38 / 232Yeast 0.441 0.297 0.655 0.000 322 / 4086 32 / 197Macer 0.556 0.272 1.138 0.108 17 / 77 26 / 77Prysak 0.565 0.312 1.021 0.058 20 / 210 33 / 210Cammu 0.632 0.562 0.711 0.000 500 / 7683 762 / 7683Seyb 0.401 0.247 0.650 0.000 88 / 1124 25 / 143van Gemund 0.085 0.010 0.754 0.027 1 / 23 8 / 23Maslow 0.302 0.154 0.593 0.000 21 / 349 18 / 103Luthy 0.545 0.437 0.680 0.000 409 / 2673 135 / 542Vrouenraets 0.444 0.333 0.590 0.000 92 / 765 147 / 624
0.475 0.406 0.557 0.000 1938 / 22317 1421 / 10851
0.1 0.2 0.5 1 2 5 10
Higher for Induced Lower for Induced
Summary

Figure 2.13. Observational studies of elective induction of labor versus spontaneous labor: Cesarean delivery among multiparous women
60
Study Name Statistics for each study Event / Total Odds ratio and 95% CI
Odds Lower Upper Control Induced ratio limit limit p-Value Group CS Labor CS
Booth 0.420 0.107 1.648 0.214 3 / 213 7 / 213Dublin 0.924 0.631 1.352 0.684 109 / 5463 36 / 1670Boulvain 0.548 0.148 2.037 0.369 9 / 1629 3 / 299Yeast 0.919 0.596 1.417 0.703 187 / 5637 24 / 667Macer 1.000 0.422 2.371 1.000 11 / 176 11 / 176Heinberg 1.190 0.525 2.700 0.677 13 / 304 11 / 304Prysak 0.422 0.108 1.649 0.215 3 / 251 7 / 251Maslow 0.427 0.194 0.941 0.035 16 / 523 11 / 160Hoffman 0.596 0.371 0.957 0.032 43 / 1885 30 / 796
0.779 0.632 0.961 0.020 394 / 16081 140 / 4536
0.1 0.2 0.5 1 2 5 10
Higher for Induced Lower for Induced
Heterogeneity statistics: Q-value 7.968, P-value 0.437, I-squared: 0.00 CS: cesarean section
Summary

61
Mode of delivery: Operative vaginal delivery. Elective induction of labor versus expectant management. The only observational study comparing elective induction of labor with expectant management that reported operative vaginal delivery (forceps- or vacuum-assisted vaginal delivery) as an outcome measure was by Lampe out of Hungary in 1986.31 There was no significant difference in the rate of operative vaginal delivery between the women who were electively induced and those who were expectantly managed [0.74 percent (15 / 2020) and 0.94 percent (26 / 2750), respectively].
Elective induction of labor versus spontaneous labor. Seven observational studies reported operative vaginal delivery as an outcome comparing spontaneous labor with electively induced labor. The seven retrospective studies were conducted between 1970 and 1999. They included a total of 22,670 women: 19,684 in the spontaneous labor group and 4,607 electively induced (Figure 2.14). The overall rate of operative vaginal delivery in the two groups was similar: 15 (s.e. 3.0) percent in the spontaneous labor group and 17 (s.e. 2.3) percent in the elective induction of labor group. When these studies were combined, there was no difference in the risk of operative vaginal delivery between women in the spontaneous labor group and women who had an elective induction of labor (OR 0.91; 95 percent CI: 0.78-1.05, Figure 2.14; and risk difference -0.01 (-0.03 to 0.004, Appendix C Figure 11). These studies were moderately homogenous (Figure 2.14) and indicated the existence of publication bias (fail-safe N was 1).
Four observational studies reported operative vaginal deliveries comparing spontaneous labor with electively induced labor in nulliparous women (Figure 2.15). The studies included a total of 16,520 nulliparous women: 8,548 women in the spontaneous labor group and 7,972 women who had elective induction of labor (Figure 2.15). When we combined these studies, women in the spontaneous labor group were less likely to have operative vaginal delivery than women who were electively induced (OR0.89; 95 percent CI 0.83-0.95, P<0.01, Figure 2.16; and risk difference -0.02 (-0.04 to -0.01, P=0.001), Appendix C Figure 12). These studies were fairly homogeneous (Figure 2.15 and Appendix C Figure 12). In sensitivity analysis, removing the study by Cammu et al.17 resulted in there being no difference in operative vaginal delivery between the two groups (OR 0.98; 95 percent CI: 0.70-1.37, P=0.895).
Three observational studies reported operative vaginal delivery as an outcome of interest when comparing elective induction of labor with spontaneous labor for multiparous women.15, 28,
69 When we combined these studies, there was no difference in the risk of operative vaginal delivery between the two groups of women (OR 0.96; 95 percent CI: 0.62-1.49, P=0.86; and risk difference -0.003 (-0.047 to 0.041, P=0.90). These studies were highly heterogeneous (Q-value 5.275, P-value 0.07, I-squared 62.085).

Figure 2.14. Observational studies of elective induction of labor versus spontaneous labor: Operative vaginal delivery
62
Heterogeneity statistics: Q-value 8.656, P-value 0.194, I-squared 30.685 OVD: operative vaginal delivery
Study Name Statistics for each study Event / Total Odds ratio and 95% CI
Odds Lower Upper Controls Induced ratio limit limit p-Value OVD OVD
Booth 0.828 0.454 1.513 0.540 22 / 213 26 / 213Dublin 0.840 0.750 0.940 0.002 1398 / 9583 487 / 2881Boulvain 1.105 0.902 1.354 0.335 1010 / 3353 149 / 531Macer 0.693 0.460 1.043 0.079 53 / 253 70 / 253Robson 0.802 0.477 1.348 0.405 117 / 1092 19 / 146Prysak 1.130 0.761 1.678 0.545 59 / 461 53 / 461van Gemund 0.708 0.275 1.826 0.475 8 / 122 11 / 122
0.905 0.784 1.045 0.175 2667 / 15077 815 / 4607
0.1 0.2 0.5 1 2 5 10
Higher for Induced Lower for Induced
Summary

Figure 2.15. Observational studies of elective induction of labor versus spontaneous labor: Operative vaginal delivery among nulliparous women
63
Heterogeneity statistics: Q-value 1.545, P-value 0.672, I-squared 0.00 OVD: operative vaginal delivery
Study Name Statistics for each study Event / Total Odds ratio and 95% CI
Odds Lower Upper Control Induced ratio limit limit p-Value Group OVD Labor OVD
Vrouenraets 1.095 0.735 1.632 0.656 161 / 765 37 / 189van Gemund 0.540 0.113 2.587 0.441 3 / 23 5 / 23Cammu 0.888 0.829 0.951 0.001 2236 / 7683 2429 / 7683Macer 0.792 0.406 1.548 0.496 24 / 77 28 / 77
0.891 0.833 0.954 0.001 2424 / 8548 2499 / 7972
0.1 0.2 0.5 1 2 5 10
Higher for Induced Lower for Induced
Summary

Maternal outcomes: Postpartum hemorrhage. Three observational studies reported postpartum hemorrhage in women who had elective induction of labor and those who underwent spontaneous labor.28, 68, 76 The studies included 566 women in each group. There was no difference in the risk of postpartum hemorrhage between the two groups for either the case-control or cohort studies (OR 0.68; 95 percent CI 0.25-1.87, P=0.45).
No studies reported postpartum hemorrhage among nulliparous women and only one study reported it among multiparous women.68 Booth et al. reported a postpartum hemorrhage rate of two percent among women who underwent spontaneous labor and 4 percent for those women who had elective induction of labor. Other maternal outcomes. Several other outcomes were reported by our included studies; most of these were reported by one or two of the studies and are shown in Tables 2.5 to 2.7.
Table 2.5. Observational studies of elective induction of labor: Other maternal outcomes†
2nd Stage Labor mean
minutes (SD)
3rd/4th degree perineal
laceration %
Study Sample Size 1st Stage
Labor mean hours (SD)
Endomy-ometritis
%
Chorio-amnionitis
%
Urinary infection %
Control EIOL Lampe31 and Lampe et al.115
2750 2020 EIOL=4.58 EIOL=26 NR NR NR NR
Booth and Kurdyak68 213 213 NR NR NR SL=0.46
EIOL=0.46 NR SL=3.3 EIOL=2.8
Macer et al.28 253 253
SL=7.2 (5.2) EIOL=6.0
(3.1) (P=0.008)
SL=39 (44)
EIOL=44 (61)
SL=7.5 EIOL=7.5
SL=2.77 EIOL=2.37
SL=2.4 EIOL=1.6 NR
McBride et al.37 32 38
SL=5.8 (2.4) EIOL=3.6
(2.5)
SL=30.1 (25.4)
EIOL=26 (24)
NR NR NR NR
Mukherjee et al.76 100 100 NR NR NR NR SL=5
EIOL=0 NR
Vierhout et al.75 and Out et al.116,
117
156 184 SL=6.28 EIOL=4.90
SL=18.7 EIOL=22.1 NR NR NR NR
EIOL=elective induction of labor group; SL=spontaneous labor; NR=not reported; if an individual article reported P-values for a specific outcome, those P-values have been shown in the table. † Antepartum hemorrhage, median hospital stay, bilirubin levels of 15 mg/dL or more during hospital stay, mild superficial phlebitis, cervical lacerations, 3rd stage hemorrhage, dystocia, shoulder dystocia, any birth injury, scalp injury, postpartum neurological complications, “medication for pain relief (not strictly epidural)”, rupture of membranes >24 hours, mean duration of ruptured membranes, and women's psychological outcomes were each reported by one study. Receiving epidural was reported by two studies.
64

Table 2.6. Observational studies of elective induction of labor in nulliparous women: Other maternal outcomes†
2nd stage of labor mean hours (SD)
Time of ruptured
membranes
1st stage of labor
Mean hospital
stay Study Sample Size Chorio-
amnionitis % mean
hours (SD) mean hours (SD) days (SD)
Epidural use %
SL EIOL
Cammu et al.17 7683 7683 NR NR NR NR NR
SL=57.6 EIOL=79
.8
Luthy et al.11 2673 542
SL=2.4 EIOL=2
(P=0.608) NR NR NR NR NR
Macer et al.28 77 77 NR
SL=9.9 (5.1)
EIOL=7.2 (3.2)
SL=1.5 (0.88)
EIOL=1.53 (0.85)
NR SL=7.6 (5.5)
EIOL=7.7 (5.3)
NR
Maslow et al.62 349 103 NR NR NR NR NR
SL=50 EIOL=64 P<0.05
Seyb et al.20 1124 143 SL=6.3
EIOL=7 NR NR SL=1.8 EIOL=2.0 NR SL=79
EIOL=93 Vierhout et al.75 and Out et al.116,
117
156 184 NR
SL=8.0 (3.4)
EIOL=5.8 (2.3)
SL=0.63 (0.37)
EIOL=0.62 (0.3)
NR NR NR
Vrouenraets et al.60 765 189 NR NR
SL=0.67 (0.44)
EIOL=0.61 (0.42)
SL=2.7 (2.0)
EIOL=3.5 (2.1)
SL=13.9 (16.7)
EIOL=9.9 (10.5)
SL=3 EIOL=11
SL=spontaneous labor group; EIOL=elective induction of labor group; NR=not reported; if an individual article reported P-values for a specific outcome, those P-values have been shown in the table. †Abnormal position, mean labor, mean labor for term births only, vaginal delivery within 8 hours, intrapartum fever, intrapartum abruption, mean uterine activity at 6 cm (Motevideo units), and bleeding during third stage of labor were each reported by one study.
65

Table 2.7. Observational studies of elective induction of labor in multiparous women: Other maternal outcomes†
Study Sample Size 1st stage of labor mean hours (SD)
Mean length of hospital
stay (days)
Mean time of ruptured
membranes 2nd stage of labor mean
minutes (SD)
Endomyo-metritis % Mean hours
(SD) SL EIOL
Booth & Kurdyak68 213 213 NR NR NR SL=0.47
EIOL=0.47 NR
Heinberg et al.15 304 304 NR NR NR NR
SL=1.6 EIOL=1.7
6 P=0.0118
Macer et al.28 253 253 SL=6.4 (5.0)
EIOL=5.7 (3.0) SL=26 (30)
EIOL=31 (56) SL=3.9 (4.9)
EIOL=4.6 (2.9) NR NR
Vierhout et al.75 and Out et al.110, 111
156 184 SL=5.7 (2.8) EIOL=4.5 (2.0)
SL=12 (8) EIOL=15 (11) NR NR NR
SL=spontaneous labor; EIOL=elective induction of labor group; NR=not reported; if an individual article reported P-values for a specific outcome, those P-values have been shown in the table. †Vaginal delivery within 8 hours, epidural use, and reported labor/delivery/postpartum complications were each reported by one study.
Summary of evidence addressing Key Question 1: What evidence describes the maternal risks of elective induction versus expectant management?
Cesarean delivery. Of the nine RCTs that compared cesarean delivery among women who had elective induction of labor with those with expectant management, the combined summary odds ratio favored elective induction of labor. Expectant management of pregnancy was associated with a 22 percent increase in cesarean delivery (OR=1.22; 95 percent CI 1.07-1.39, P=0.003) and an absolute risk difference of nearly two percent (95 percent CI: 0.2 percent to 4 percent, P=0.033). Three trials reported no difference in risk of cesarean delivery among women who were induced at less than 41 weeks gestational age (OR 1.73, 95 percent CI: 0.67-4.5, P=0.026) but all of these trials were of poor quality. Only three studies addressed whether parity affected the risk of cesarean delivery between expectant management and electively induced labor; these studies reported no difference in risk for nulliparas and there was insufficient information to draw any conclusions on the risk for multiparas. When we stratified the studies to those conducted in or prior to 1990 and those conducted after 1990, there was no statistically significant difference in the odds of cesarean delivery for either of the two groups. When we stratified the analysis by country, we found that the odds of cesarean delivery were higher in women who were expectantly managed compared to elective induction of labor in studies conducted outside the U.S. (OR 1.21; 95 percent CI 1.05-1.40) but were not different in studies conducted in the U.S. (OR 1.28; 95 percent CI 0.65-2.49). The strength of evidence was weaker in observational studies, which showed women with elective induction of labor had a higher odds of cesarean delivery compared to women in spontaneous labor. The principal reason for this difference in findings between the two types of studies is likely the different control groups used by the included studies. Since the clinical scenario faced by practitioners is induction of labor
66

now versus expectant management with either induction or spontaneous labor at a later date, gestational age is an important confounding factor which may bias the estimate of effect on induction when induction is compared to spontaneous labor. Considering the quality of the body of evidence and its applicability to care in the U.S. today, the evidence for elective induction of labor and cesarean delivery was rated as moderate. However, with respect to elective induction of labor prior to 41 weeks of gestation, the overall evidence was considered insufficient.
Operative vaginal delivery. Most of the six RCTs that examined the effect of elective induction of labor on operative vaginal delivery were small to medium-sized studies (only one study had 1700 women in each arm). The summary odds of operative vaginal delivery were not statistically significantly different between women who were electively induced or expectantly managed (OR=0.91; 95 percent CI 0.79-1.04, P=0.18). Three RCTs reported no risk in operative vaginal delivery among women who were induced at less than 41 weeks gestational age (OR 0.71, 95 percent CI: 0.41-1.21, P=0.21), but all of these trials were of poor quality. For the seven observational studies, there was no significant difference in the risk of operative vaginal delivery between women in spontaneous labor compared to elective labor induction (OR=0.91; 95 percent CI 0.78-1.05, P=0.18). Although the observational studies involved more women, the strength of evidence for this outcome was considered relatively weak secondary to a high degree of heterogeneity among these studies. However, given the consistency of the findings in the studies for a lack of difference in the risk of operative vaginal delivery, the overall evidence regarding the relationship between elective induction of labor and operative vaginal delivery at 41 weeks of gestation was rated as moderate. The evidence examining the effect on operative vaginal delivery before 41 weeks was considered insufficient.
Length of labor. None of the included studies evaluated “prolonged labor” as a primary outcome. One RCT from Norway of 508 women evaluated “prolonged first and second stages of labor” and they found no statistically significant difference between women who were electively induced or expectantly managed. Four observational studies examined “mean duration of first and second stages of labor.” Only one of these studies28 that included 253 women in each group found a significant difference in mean first stage of labor in women who had elective induction of labor compared to spontaneous labor (6.0 versus 7.2 hours, respectively; P=0.008); the others reported no difference in length of labor. Given the limited evidence further information is needed to evaluate the effect of elective labor induction on the duration of labor. No studies reported or compared the median duration of labor. Thus, the overall strength of evidence addressing length of labor and elective induction of labor was considered insufficient.
Maternal infections. Six studies (three RCTs and three observational) reported presence or absence of maternal infection; however, none provided detailed quantitative data such as risk ratios or risk differences. Four studies (two RCTs, two observational) provided some evidence that elective induction is not associated with increased risk of chorioamnionitis and two observational studies provided some evidence that elective induction is not associated with increased risk of endomyometritis. Thus, given the consistency in these findings, but the modest amount of available data, the overall strength of evidence regarding maternal infections was rated as low. Maternal blood loss and hemorrhage. Four studies (one RCT and three observational) evaluated the association between postpartum hemorrhage and elective induction and found no association. However, these studies likely lacked adequate statistical power to detect a difference. One RCT examined rates of blood transfusion between elective induction (2/265 [0.75 percent]) versus expectant management (3/175 [1.7 percent]) and found no statistically
67

significant difference. No studies reported mean estimated blood loss as an outcome of interest. Thus, given the minimal amount of data and the lack of statistical power to examine this question, the overall evidence regarding maternal blood loss was rated as insufficient.
Other outcomes. Two studies (one RCT and one observational) reported on serious perineal lacerations and did not observe an association between elective induction and third or fourth degree perineal lacerations. No studies addressed the risk of hysterectomy, evidence of injury to internal organs, or wound complications after elective induction of labor. Given the lack of available data to address any of these other outcomes, the evidence regarding other maternal outcomes was all rated as insufficient.
68

Key Question 2: What evidence describes the fetal/neonatal risks of elective induction versus expectant management?
The included studies reported on only a few of the neonatal outcomes that we had hoped to evaluate (Figure 2.16). However, the majority of these results were reported by less than five of the included studies. In this section, we present the detailed results of our evidence synthesis for those outcomes reported by more than four studies. We first present the evidence from the RCTs, then the observational studies. At the end of this section, we summarize the evidence addressing Key Question 2. Figure 2.16. Neonatal outcomes reported
-100% -80% -60% -40% -20% 0% 20% 40%
BreastfeedingNeonatal polycythemia
Neonatal jaundiceHypoglycemia
Neonatal seizuresBirthweight < 2500 gmsBirthweight > 4500 gmsBirthweight > 4000 gms
Large for gestational ageHypoxic-ischemic encephalopathy
Culture-proven sepsisSuspected sepsis
Transient tachypnea of the newbornRespiratory distress syndrome
Fetal distressMeconium aspiration syndrome
MeconiumMean base excess
Mean UApHUA base excess < -12
UApH < 7.1UApH < 7.0
Apgar score < 7 at 5 minutes
Percent of Total Included Studies
Outcome Not Reported Outcome Reported
Randomized Controlled Trials of Elective Induction of Labor
Neonatal outcomes: 5-minute Apgar score less than 7. Four RCTs reported the rate of neonatal Apgar score at 5-minutes less than 7 in studies comparing expectant management with elective induction of labor. The total number of women included in these studies was 4,434, with 2,212 in the expectant management group and 2,222 in the elective induction of labor group. The study by Nielsen et al.7 reported that no neonates had a 5-minute Apgar score of less than 7 and so was not included in the calculation of summary odds ratio. There was no difference in the risk
69

between women in the expectant management group and those in the elective induction of labor group of having neonates born with 5-minute Apgar score less than 7 (OR 1.18; 95 percent CI: 0.67-2.06, Figure 2.17; and risk difference 1.18 (0.67-2.06), Appendix Figure 13). None of the RCTs reported this outcome among women who were induced at less than 41 weeks gestation.
Neonatal outcomes: Meconium-stained amniotic fluid. Six RCTs reported data on the presence of meconium-stained amniotic fluid as an outcome, comparing elective induction of labor with expectant management. The studies included a total of 5,478 women, with 2,698 women in the expectant management group and 2,780 women in the elective induction of labor group (Figure 2.18). The overall rate of meconium-stained amniotic fluid in the expectant management group was 29 percent (S.E. 0.04) compared with 17 percent (S.E. 0.06) in the elective induction of labor group. When combined, these studies showed that the presence of meconium-stained amniotic fluid was more likely to occur in the expectant management group compared with the elective induction of labor group (OR 2.04; 95 percent CI: 1.34-3.09, P=0.001, Figure 2.18; and risk difference 0.11 (0.06-0.17, P<0.01), Appendix C Figure 14). There was a consistently significant effect for all of the individual studies.
The study by Cole et al. was the smallest study with 228 women and reported the largest effect size with women in the expectant management group being nearly 14 times more likely to have presence of meconium-stained amniotic fluid.67 It was also the only trial to report the presence of meconium among women who were induced at less than 41 weeks gestational age. The overall summary effects were fairly robust: They remained significant during sensitivity analysis. The results did not suggest the presence of significant publication bias (fail-safe N was 82). One RCT reported the presence of meconium-stained amniotic fluid when comparing elective induction of labor with spontaneous labor.66 Martin et al. included a total of 184 women in their trial (92 in each arm); they reported a significantly increased risk of meconium-stained amniotic fluid among women who had spontaneous labor compared with women who underwent elective induction of labor (OR 4.89; 95 percent CI: 1.34-17.76).
One RCT of nulliparous women reported the presence of meconium-stained amniotic fluid.61 In the electively induced women the rate was 3.2 percent versus 19.4 percent in the women with spontaneous labor (P=0.004). We did not find any RCTs of multiparous women that reported this outcome.
Neonatal outcomes: Meconium aspiration syndrome. Five RCTs reported data on meconium aspiration syndrome.8, 24, 27, 59, 74 These studies included a total of 5,248 women, with 2,577 women in the expectant management group and 2,671 women in the elective induction of labor group. Overall, there was no difference in the risk of meconium aspiration syndrome to neonates between the two groups of women (OR 1.39; 95 percent CI 0.71-2.72, P=0.34, Figure 2.19; and risk difference 0.009 (-0.005 to +0.024), P=0.21, Appendix C Figure 15). Notably, the odds ratio reported by the 1983 study by Dyson et al.74 was 13.72 and that of the 2005 study by Gelisen et al. was 1.369—suggesting the possibility of a trend toward decreasing risk of meconium aspiration over time. However, when we grouped the studies by year (1990 or earlier versus after 1990), there was no difference in the combined summary odds ratio (OR 1.5; 95 percent CI: 0.49-4.54, P=0.48 and OR 1.5; 95 percent CI: 0.35-6.27, P=0.59, respectively).
Neonatal intensive care unit (NICU) admissions. Three RCTs reported data on NICU admissions.7, 8, 59 Heimstad et al.59 reported 18 NICU admissions among the expectant management group of 254 women (7 percent) and 14 among the elective induction of labor group of 254 women (5.5 percent). Gelisen et al.8 reported 15 NICU admissions among the
70

71
expectant management group of 300 women (5 percent) and 13 among the elective induction of labor group of 300 women (4.3 percent). When the two studies were combined, there was no difference in the odds of NICU admissions between the two groups (OR 1.24; 95 percent CI: 0.73-2.09, P=0.43). Nielsen et al.7 reported no admissions to the NICU for either group of women.
One RCT63 reported data on NICU admissions in nulliparous women. The study was inadequately powered to examine this association with 0 percent of neonates in the elective induction arm being admitted to the NICU versus 2 percent of the spontaneous labor neonates.
Neonatal deaths. Six RCTs reported data on neonatal deaths.24, 27, 55, 59, 67, 74 Neonatal deaths were a rare occurrence overall with only four neonatal deaths among women in the expectant management group and none in the elective induction of labor group.
Other neonatal outcomes. The other neonatal outcomes that were reported in fewer studies are shown in Table 2.8.

Figure 2.17. RCTs of elective induction of labor versus expectant management: 5-minute Apgar score less than 7
Study Name Statistics for each study Event / Total Odds ratio and 95% CI
Odds Lower Upper Expectant Induced ratio limit limit p-Value Mgt Apgar Apgar
Heimstad 1.339 0.297 6.043 0.704 4 / 254 3 / 254Hannah 1.114 0.587 2.113 0.742 20 / 1698 18 / 1700Dyson 1.531 0.252 9.293 0.644 3 / 150 2 / 152
1.178 0.673 2.063 0.567 27 / 2102 23 / 2106
0.1 0.2 0.5 1 2 5 10
Higher for Induced Lower for Induced
Summary
Heterogeneity statistics: Q-value 0.138, P-value 0.933, I-squared 0.00 Apgar: 5-minute Apgar score less than 7
72

Figure 2.18. RCTs of elective induction of labor versus expectant management: Meconium-stained amniotic fluid
Heterogeneity statistics: Q-value 29.485, P-value 0.000, I-squared 83.042
Study Name Statistics for each study Event / Total Odds ratio and 95% CI
Odds Lower Upper Expectant Induced Labor ratio limit limit p-Value Mgt Meconium Meconium
Cole 13.750 1.767 106.973 0.012 13 / 117 1 / 111Dyson 3.711 2.215 6.219 0.000 70 / 150 29 / 152Hannah 1.206 1.036 1.404 0.016 490 / 1706 426 / 1701NICHHD 1.915 1.253 2.928 0.003 62 / 171 60 / 262Heimstad 1.397 0.956 2.040 0.084 87 / 254 69 / 254Gelisen 2.479 1.534 4.007 0.000 61 / 300 28 / 300
2.038 1.344 3.090 0.001 783 / 2698 613 / 2780
0.1 0.2 0.5 1 2 5 10
Higher for Induced Lower for Induced
Summary
73

Figure 2.19. RCTs of elective induction of labor versus expectant management: Meconium aspiration syndrome
Heterogeneity statistics: Q-value 7.173, P-value 0.127, I-squared 44.233
Study name Statistics for each study Events / Total Odds ratio and 95% CI
Odds Lower Upper Expectant Mgt Induced ratio limit limit p-Value Mecon aspir Mecon aspir
Dyson 13.720 0.766 245.737 0.075 6 / 150 0 / 152Hannah 0.990 0.739 1.326 0.947 95 / 1698 96 / 1700NICHHD 1.520 0.212 10.894 0.677 2 / 175 2 / 265Heimstad 0.709 0.222 2.263 0.561 5 / 254 7 / 254Gelisen 3.083 0.983 9.671 0.054 12 / 300 4 / 300
1.385 0.705 2.722 0.345 120 / 2577 109 / 2671
0.1 0.2 0.5 1 2 5 10
Higher for Induced Lower for Induced
Summary
74

75
Table 2.8. RCTs of elective induction of labor versus expectant management: Other neonatal outcomes†
Study Sample Size Birthweight
>4500 grams %
LGA % Meanbirth-
weight grams (SD)
UAph < 7.0 %
UAph < 7.1 %
Fetal Distress %
Transient tachypnea
of the newborn
%
UA base excess < -
12 %
Neonatal Jaundice
%
EM EIOL Cole et al.67 117 111 NR NR NR NR NR NR EM=1.7
EIOL=1.8 NR EM=5.1 EIOL=10.9
Dyson et al.74 150 152 NR EM=28.2
EIOL=19.1 NR NR NR NR NR NR NR
Hannah et al.27, 112 1706 1701 EM=5.5
EIOL=4.6 NR NR NR EM=1.7 EIOL=1.4
EM=12.8 EIOL=10.3
EM=4.5 EIOL=5.6 NR NR
Heimstad et al.59 254 254
EM=16.9 EIOL=11.0
P=0.06 NR NR
EM=3.80 EIOL=6.33
P=0.22
EM=0.84 EIOL=1.27 P=0.69
NR EM=14.6
EIOL=16.9 P=0.47
EM=1.69 EIOL=2.53
P=0.55 NR
Nielsen et al.7 110 116 NR NR
EM=3504 (438)
EIOL=3459 (347)
P=0.006
NR NR NR NR NR NR
NICHHD24 174 264 EM=3.4 EIOL=1.5 NR NR NR NR NR NR NR NR
Table 2.81. RCTs of elective induction of labor versus expectant management: Other neonatal outcomes (continued)†
Study Sample Size Resuscitation %
Photo-therapy %
Neonatal polycythemia %
Neonatal Seizures %
Suspected Sepsis %
Proven Sepsis %
Hypoglycemia %
EM EIOL Hannah et al. 27, 112 1706 1701 NR NR EM=1.0
EIOL=0.8 EM=0.3
EIOL=0.2 EM=7.1
EIOL=6.9 EM=0.2
EIOL=0.5 EM=2.7
EIOL=3.0 Heimstad et al. 59 254 254
EM=3.1 EIOL=4.7 P=0.50
EM=3.9 EIOL=3.1 P=0.64
EM=0.39 EIOL=0.39 NR EM=2.76
EIOL=3.54 EM=2.36
EIOL=0.39
EM=3.94 EIOL=3.15
P=0.64
NICHHD24 174 264 NR NR NR EM=0.57 EIOL=0.75 NR NR NR
EM=expectant management; EIOL=elective induction of labor group; NR=not reported; if an individual article reported P-values for a specific outcome, those P-values have been shown in the table. † Birthweight less than 2500 grams, fetal anomaly, and cord prolapse were each reported by one study.

76
Observational studies of elective induction of labor
Neonatal Outcomes: 5-minute Apgar Score less than 7. Nine observational studies compared elective induction of labor to spontaneous labor and reported 5-minute Apgar score less than 722, 28, 47, 48, 50, 61 21, 34, 68 This outcome was a rare event in both groups. Overall, the rate of 5-minute Apgar score less than 7 was 0.5 percent in both groups (P=0.723). The studies included a total of 31,275 women with 25,768 in the spontaneous labor group and 5,507 women in the elective induction of labor group. All except one of the studies50 reported a higher, though not statistically significant, risk of 5-minute Apgar score less than 7 among women who had spontaneous labor. When these studies were combined, there was no difference in the risk of 5-minute Apgar score less than 7 between groups. Removing the study by Yeast et al.50 in sensitivity analysis did not change the results. These studies appeared relatively homogeneous (Figure 2.20 and Appendix C Figure 16) and did not indicate the presence of significant publication bias (fail-safe N was zero).
Neonatal outcomes: Meconium-stained amniotic fluid. Four observational studies comparing women who had elective induction of labor to women who were in spontaneous labor reported data on the presence of meconium-stained amniotic fluid. These studies included a total of 13,624 women: 10,179 in the spontaneous labor group and 3,445 in the elective induction of labor group. When these studies were combined, the risk of meconium-stained amniotic fluid was higher in women who underwent spontaneous labor than those who were electively induced (OR 2.16; 95 percent CI 1.24-3.75, Figure 2.21; and risk difference 0.06 (0.01-0.12), Appendix C Figure 17). These studies showed a high degree of heterogeneity.
Two observational studies11, 60 also reported this outcome among nulliparous women when comparing elective induction of labor with spontaneous labor. In the prospective study by Vrouenraets et al.,60 the presence of meconium-stained amniotic fluid was almost the same in both groups (19 percent versus 17 percent, respectively). In the retrospective study by Luthy et al.,11 the presence of meconium-stained amniotic fluid was higher in the elective induction of labor group compared with the spontaneous labor group (16 percent versus 23 percent). We did not find any studies in multiparous women that reported this outcome.

Figure 2.20. Observational studies of elective induction of labor versus spontaneous labor: 5-minute Apgar score less than 7
77
Study Name Statistics for each study Event / Total Odds ratio and 95% CI
Odds Lower Upper Controls Induced ratio limit limit p-Value Apgar Apgar
van Gemund 0.744 0.163 3.395 0.702 3 / 122 4 / 122Boulvain 0.950 0.114 7.907 0.962 6 / 3353 1 / 531Dublin 0.911 0.561 1.476 0.704 67 / 9633 22 / 2882Yeast 3.215 0.788 13.127 0.104 72 / 9723 2 / 864Prysak 0.499 0.045 5.521 0.571 1 / 461 2 / 461Robson 0.672 0.032 14.060 0.798 2 / 1092 0 / 146Macer 0.498 0.045 5.527 0.570 1 / 253 2 / 253Belsky 0.835 0.109 6.376 0.862 22 / 918 1 / 35Booth 0.198 0.009 4.151 0.297 0 / 213 2 / 213
0.930 0.623 1.388 0.722 174 / 25768 36 / 5507
0.1 0.2 0.5 1 2 5 10
Higher for Induced Lower for Induced
Summary
Heterogeneity statistics: Q-value 4.642, P-value 0.795, I-squared 0.00

78
Figure 2.21. Observational studies of elective induction of labor versus spontaneous labor: Meconium-stained amniotic fluid
Heterogeneity statistics: Q-value 7.65, P-value 0.022, I-squared 73.857 Meconium: meconium-stained amniotic fluid
Study Name Statistics for each study Event / Total Odds ratio and 95% CI
Odds Lower Upper Controls Induced Labor ratio limit limit p-Value Meconium Meconium
Vierhout 3.255 1.134 9.343 0.028 13 / 156 5 / 184Dublin 1.293 1.061 1.574 0.011 546 / 9648 128 / 2886Macer 2.685 1.481 4.868 0.001 41 / 253 17 / 253van Gemund 2.887 1.320 6.310 0.008 25 / 122 10 / 122
2.159 1.242 3.754 0.006 625 / 10179 160 / 3445
0.1 0.2 0.5 1 2 5 10
Higher for Induced Lower for Induced
Summary

79
NICU admissions. Six observational studies reported data on NICU admissions comparing elective induction of labor with spontaneous labor (Figure 2.22). The studies included a total of 17,381 women: 15,004 in the spontaneous labor group and 2,377 in the elective induction of labor group. Overall there was no significant difference in the risk of NICU admissions between the two groups (OR 0.97; 95 percent CI 0.61-1.55, Figure 2.22; and risk difference 0.001 (-0.02 to +0.02), Appendix C Figure 18).
Three observational studies among nulliparous women reported NICU admissions.17, 50, 60 Vrouenraets et al.60 reported a higher rate of NICU admissions among women with spontaneous labor (14.8 percent) versus women with elective induction (25.9 percent). In a large cohort of more than 4,000 women, though only 197 women had elective induction of labor, Yeast et al.50 reported a small difference in NICU admissions with 6.3 percent of the neonates born as a result of spontaneous labor and 5.1 percent of the neonates born as a result of an elective induction of labor admitted to the NICU. In contrast, an even larger cohort from France of more than 15,000 women found that 10.7 percent of the neonates were admitted to the NICU in the setting of induced labor as compared to 9.4 percent of the neonates in the setting of spontaneous labor (P=0.009).17
One retrospective cohort studies among multiparous women reported NICU admissions.50 The study by Yeast et al., found a slight reduction in NICU admissions from 3.8 percent of neonates born in the setting of spontaneous labor down to 1.9 percent of neonates born in the setting of elective induction of labor (P<0.005).50
Neonatal deaths. Four observational studies reported neonatal deaths.21, 31, 34, 76 All but one of the studies reported higher numbers of neonatal deaths in the spontaneous group compared with the elective induction of labor group. Mukherjee et al.76 reported six (6 percent) neonatal deaths in the spontaneous labor group and one (1 percent) in the elective induction group. Lampe et al.31 also reported 6 (0.22 percent) neonatal deaths in the spontaneous labor group compared with one (0.05 percent) in the elective induction group and Belsky et al.34 reported two (0.2 percent) stillbirths in the spontaneous labor group and none in the elective induction group. Prysak et al.21 reported no neonatal deaths in either group.
One study among nulliparous women reported six neonatal deaths within the first week in each of the groups.17
Other neonatal outcomes. Several other neonatal outcomes were reported by fewer studies (Tables 2.9 to 2.11).

Figure 2.22. Observational studies of elective induction of labor versus spontaneous labor: NICU admissions
80
Heterogeneity statistics: Q-value 16.305, P-value 0.006, I-squared 69.334 NICU: neonatal intensive care unit
Study name Statistics for each study Events / Total Odds ratio and 95% CI
Odds Lower Upper Controls NICU Induced NICU ratio limit limit p-Value admission admission
Boulvain 0.660 0.411 1.060 0.086 93 / 3353 22 / 531Yeast 1.857 1.215 2.839 0.004 470 / 9723 23 / 864Macer 3.049 0.609 15.250 0.175 6 / 253 2 / 253Robson 0.944 0.558 1.599 0.831 128 / 1092 18 / 146Prysak 0.851 0.447 1.620 0.624 18 / 461 21 / 461van Gemund 0.484 0.215 1.089 0.080 10 / 122 19 / 122
0.973 0.613 1.545 0.908 725 / 15004 105 / 2377
0.1 0.2 0.5 1 2 5 10
Higher for Induced Lower for Induced
Summary

81
Table 2.9. Observational studies of elective induction of labor versus spontaneous labor: Other neonatal outcomes†
Study Sample Size Fetal
Distress %
Birthweight <2500
grams % LGA % Resuscit-
ation % UAph
< 7.15 % Proven
Sepsis %
Hyperbili-rubinemia
%
Photo-therapy %
Breast-feeding %
SL EIOL Booth and Kurdyak68 213 213 NR SL=0.93
EIOL=0.47 NR NR NR SL=0.47 EIOL=0.0
SL=3.3 EIOL=5.5 NR NR
Macer et al.28 253 253 SL=1.2
EIOL=3.2 NR NR NR NR NR NR NR NR
Prysak and Castronova21
461 461 NR NR SL=19.8 EIOL=24.3 NR NR NR NR NR NR
Wilailak et al.71 249 262 NR SL=2.4
EIOL=6.5 NR NR NR NR NR NR NR
Belsky34 918 35 NR SL=3.8 EIOL=2.9 NR EIOL=0 NR NR NR NR NR
Boulvain et al.48 3353 531 NR NR NR SL=13.7
EIOL=16.2 NR NR NR SL=11.9 EIOL=14.3 NR
Mukherjee and Sood76 100 100 SL=11
EIOL=15 NR NR SL=5 EIOL=1 NR NR SL=0
EIOL=2 NR NR
Dublin et al.61 9648 2886 NR SL=0.6
EIOL=0.7 NR NR NR NR NR NR NR
Van Gemund47 122 122 NR NR NR NR SL=12
EIOL=18 NR NR NR NR
Vierhout et al.75 and Out et al.116, 117
156 184 NR NR NR NR SL=4.52 EIOL=7.18 NR SL=6.4
EIOL=9.8 SL=2.6
EIOL=4.9 SL=88.6
EIOL=72.4
LGA=large for gestational age; UAph=Umbilical Arterial pH; SL=spontaneous labor; EIOL=elective induction of labor group; NR=not reported; if an individual article reported P-values for a specific outcome, those P-values have been shown in the table. † “trauma”, mean and median birthweight, brachial plexus injury, intracranial hemorrhage, Apgar score less than 4 at five minutes, mechanical ventilation, verbal and non-verbal scores, cord prolapse, and neonatal jaundice were each reported by one study. Birthweight greater than 4000 grams and NICU length of stay were reported by two studies.

Table 2.10. Cohort studies of elective induction of labor versus spontaneous labor in nulliparous women: Other neonatal outcomes
Study Sample Size Birthweight
>4000 grams
Apgar score <7
at 5 minutes
Median birthweight in grams (range)
Birthweight UAph<7.15 >4500
grams
SL Group
Elective Induction
Group
2673 542 SL=8.3%
EIOL=23.8% (P<0.001)
NR NR NR Luthy et al.11 NR
Vierhout et al.75 and Out et al.116,
117
156 184 NR NR NR SL=12.5% EIOL=17.2%
SL=3375 (2573-4379) EIOL= 3400
(2260-4410)
Vrouenraets et al.60 765 189 SL=9%
EIOL=15.3%SL=0.9%
EIOL=0.5% NR NR NR
Yeast et al.50 4086 197
SL=6.6% EIOL=8.6%
(P<0.01) NR
SL=0.8% EIOL=2% (P<0.01)
NR NR
Umbilical Arterial pH; SL=spontaneous labor; EIOL=elective induction of labor group; NR=not reported; if an individual article reported P-values for a specific outcome, those P-values have been shown in the table. Table 2.11. Cohort studies of elective induction of labor versus spontaneous labor in multiparous women: Other neonatal outcomes
Study Sample Size
Birth-weight >4000
grams %
Birth-weight <2500
grams %
Median birthweight in grams (range)
Apgar score <7 at 5 minutes
%
UAph<7.1 %
SL Group
EIOL Group
156 184 NR NR
SL= 3486 (2710-4540) EIOL= 3468 (2530-4410)
SL=1.74 EIOL=2.44
Vierhout et al.75 and Out et al.116,
117
SL=4.35 EIOL=4.88
Yeast et al.50 4086 197
SL=11.1 EIOL=7.8 (P<0.05)
SL=1.4 EIOL=0.6 (P<0.05)
NR SL=0.7
EIOL=0.0 (P<0.05)
NR
SL=spontaneous labor; EIOL=elective induction of labor group; NR=not reported; if an individual article reported P-values for a specific outcome, those P-values have been shown in the table.
82

Summary of evidence addressing Key Question 2: What evidence describes the fetal/neonatal risks of elective induction versus expectant management?
Meconium stained amniotic fluid. There were six randomized controlled studies with a total of 5,478 women that examined whether the presence of meconium-stained amniotic fluid is associated with elective induction of labor. Women who were expectantly managed were more likely to have meconium stained amniotic fluid than those electively induced (OR 2.04; 95 percent CI 1.34-3.09). However, a high degree of heterogeneity exists among these studies. Only one randomized controlled trial evaluated this outcome among women who were induced at less than 41 weeks gestation and found a lower risk for the presence of meconium among women who were electively induced. Given the consistency of the findings and the quality of the individual studies, the overall evidence regarding the presence of meconium was rated as moderate.
Meconium aspiration syndrome. Five randomized controlled trials which ranged in size from 300 to 3000 participants and were of poor to good quality, provided somewhat conflicting results regarding the effect of elective induction on meconium aspiration syndrome. While two of the studies found higher rates of meconium aspiration in the setting of expectant management, these differences were not quite statistically significant and the other three studies found no difference. Overall, there was no difference in the risk of meconium aspiration syndrome to neonates between the two groups of women (OR 1.39; 95 percent CI 0.71-2.72). Thus, more data are needed to further evaluate the presence and strength of this association and the overall evidence regarding meconium aspiration was considered low.
Apgar score less than 7 at 5 minutes. Thirteen studies (four RCTs and nine observational) provided relatively good strength of evidence that the rate of 5-minute Apgar score less than 7 was no different between women with elective induction of labor compared to expectant management/spontaneous labor. The summary odds ratio from the RCTs was 1.18 (95 percent CI: 0.67-2.06). None of the RCTs reported this outcome among women who were induced at less than 41 weeks gestation. Given the relatively wide confidence interval, the fact that this outcome is relatively uncommon and maybe lacking adequate power, and the individual quality ratings of the studies, the overall evidence regarding this outcome was rated as low.
Umbilical arterial pH and umbilical arterial base excess. One good and one fair RCT provided evidence that elective induction of labor was not associated with higher rates of neonatal acidemia as measured by umbilical cord gases indicated by umbilical arterial pH (<7.0 or <7.1) and umbilical arterial base excess (<-12). However, with such little evidence on a relatively uncommon outcome, the overall evidence was rated as insufficient.
Fetal distress. While two poor quality smaller observational studies reported no difference in rates of fetal distress, one large, good quality, RCT reported lower rates of fetal distress favoring elective induction of labor. We rated the overall strength of evidence as insufficient because of the disagreement between the study findings and that only one study was an RCT of good quality.
Respiratory distress syndrome. One poor quality large cohort study involving 4,472 women did not observe any cases of respiratory distress syndrome in either group. The
83

evidence addressing this outcome was rated as insufficient because of the lack of any good quality, RCT evidence.
Transient tachypnea of the newborn. Three fair to good quality RCTs provided evidence that the risk of transient tachypnea of the newborn was not different in women who had elective induction as compared to expectant management. Because of the consistency of the evidence and the individual quality ratings, the overall strength of evidence was rated as low.
Neonatal sepsis. Two good quality, large RCTs examined both the risk of suspected neonatal sepsis and culture-proven sepsis. These two studies did not find that the rates of suspected neonatal sepsis were different in women with elective induction versus expectant management. Given the consistency of these two RCTs, the evidence was rated as low.
Hypoxic-ischemic encephalopathy. No studies designated hypoxic-ischemic encephalopathy as an outcome of interest and the evidence was rated as insufficient.
Birthweight. One RCT involving 302 women reported that the rate of large-for-gestational-age (LGA) neonates was lower in women who were electively induced compared to expectant management. However, three poor quality observational studies provided conflicting results regarding the effect of elective induction of labor on rates of birthweight greater than 4,000 grams.
Three fair to good quality RCTs provided evidence that elective induction of labor reduces the rate of macrosomia (birthweight greater than 4,500 grams). Four observational studies provided conflicting data regarding the effect of elective induction of incidence of birthweight less than 2,500 grams. The overall evidence that elective induction of labor reduces LGA and macrosomia was rated as low because of the small number of studies for each outcome.
Neonatal seizures. Two RCTs (one large and good quality and one medium sized and fair quality) reported no difference in the risk of neonatal seizure between women who were electively induced or expectantly managed. The evidence was rated as low because of the small number of studies.
Hypoglycemia. Two RCTs (one large and good quality and one medium sized and fair quality) provided evidence that hypoglycemia was not associated with elective induction of labor and the evidence was rated as low because of the small number of studies.
Neonatal jaundice. Three poor to fair quality studies (two small RCTs and one larger observational case-control) provided evidence that the risk of neonatal jaundice was not higher in women undergoing elective induction of labor; the overall evidence was rated as low because of the small number of studies.
Neonatal polycythemia. Two relatively large RCTs provided evidence that the risk of neonatal polycythemia was not different between comparison groups (elective labor induction versus expectant management) and the evidence was rated as low because of the small number of studies.
Breastfeeding. One relatively small, poor quality, cohort study from the Netherlands provided evidence of higher rates of breastfeeding in women who had spontaneous labor than those who had induction of labor. The overall evidence was rated as insufficient.
84

Key Question 3: What is the evidence that certain physical conditions/patient characteristics (e.g., parity, cervical dilatation, previous pregnancy outcome) are predictive of a successful induction of labor?
Because patient characteristics such as parity, cervical dilatation, and maternal age are correlated, the best way to evaluate the extent to which these characteristics predict successful induction of labor would be to perform a meta-regression.108 Specifically, to answer Key Question 3, we planned a regression analysis with successful induction of labor as the dependent variable and a list of well-established key maternal and obstetric factors (e.g., maternal age, parity, gestational age at delivery, Bishop score)42, 118-122 as the independent variables. We were unable to perform such an analysis because the included studies typically did not report data in a suitable format and because the definition of successful induction of labor was so varied that we were unable to abstract data for a consistent outcome (see Table 2.15). Instead, since studies more typically reported the predictors of cesarean delivery (i.e. failed induction), we synthesized those data (i.e., predictors of cesarean delivery, given that women had induced labor).
Predictors of cesarean delivery. Forty-one studies reported data on predictors of cesarean delivery (Figure 2.23).2, 4-7, 10-12, 14, 16, 18, 19, 23, 25, 26, 28-30, 32, 33, 35, 39, 40, 43-46, 49, 51-56,
60, 70-74, 123 One reported data on emergency cesarean delivery and so was not included in our synthesis.36 Seventeen of these 41 studies also reported predictors of successful induction (either overall vaginal delivery (including both spontaneous and operative), spontaneous vaginal delivery, or vaginal delivery in 24 hours);5, 23, 25, 28, 29, 43-46, 49, 51, 54-56,
72, 124 additionally, five studies reported only predictors of successful induction;1, 24, 38, 48,
57 one reported predictors of both failed induction and successful induction58 and one study reported data on failed induction.41 We present the general description of all these studies (Appendix Tables 1 and 2) as well as other predictors of cesarean delivery not reported below (Appendix Tables 3 to 5) and predictors of induction success and failure (other than cesarean delivery) (Appendix Tables 6 to 9) in Appendix C.
85

Figure 2.23. Cesarean delivery predictors reported
-100% -80% -60% -40% -20% 0% 20% 40% 60% 80%
Maternal age
Race
Parity
Insurance
Height
Maternal weight
Weight gain
Bishop score
Cervical length
Gestational age
Preeclampsia
Gestational diabetes
Amniotic fluid index
Percent of Included Studies
Outcome Reported Outcome Not Reported
Parity. Three RCTs and 20 cohort studies reported both nulliparity and multiparity as a predictor of cesarean delivery among women who underwent induction of labor. In general, most studies reported lower cesarean delivery rates among multiparous than nulliparous women. In the RCTs, the rate of cesarean deliveries among nulliparous women was 11 percent compared with two percent in multiparous women. When we combined the data from the RCTs, there was a decreased risk of cesarean delivery among the multiparous women when compared with the nulliparous women (OR 0.21; 95 percent CI: 0.06-0.72, P=0.01). Of note, when we looked at the absolute difference in risk there was a lower rate among multiparous women, though this absolute difference in risk was not statistically significant (-0.09 (-0.21 to +0.04), P=0.16).
Among the cohort studies, the rate of cesarean delivery was 28 percent among the nulliparous women compared with 10 percent among the multiparous women. When we combined the cohort studies, there was a decreased risk of cesarean delivery among the multiparous women when compared to the nulliparous women (OR 0.27; 95 percent CI: 0.16-0.45, Figure 2.24 risk difference -0.19 (-0.27 to -0.12), Appendix C Figure 19). The studies were highly heterogeneous. Five of the studies reported individual effect sizes that were not significantly different for risk of cesarean delivery between the two groups of women. In sensitivity analysis, when we removed each of these studies, the risk of cesarean delivery became significantly lower in multiparous women.
86

Figure 2.24. Cesarean deliveries (following induction) by parity: Cohort studies
We further assessed parity as a predictor of cesarean delivery rates in the RCTs that compared elective induction of labor with expectant management. We analyzed nulliparity as a predictor of cesarean delivery between induced labor and expectant management in two ways: first we examined the effect of nulliparity among the expectant management group and induction of labor group separately (Figure 2.25); then we calculated a weighted mean nulliparity rate for the studies and assessed its relationship to the risk of cesarean delivery (Figure 2.26). The mean nulliparity rate among the expectant management group was 51 percent compared with 53 percent in the elective induction of labor group. The overall weighted mean nulliparity rate for the studies was 51 percent. We did not find a significant relationship between nulliparity and the odds of cesarean delivery between the two groups in our included RCTs.
Heterogeneity statistics: Q-value 436.191, P-value 0.00, I-squared 95.644
Study Name Statistics for each study Event / Total Odds ratio and 95% CI
Odds Lower Upper Multiparous Nulliparous ratio limit limit p-Value CD CD
Tan 0.208 0.091 0.475 0.000 10 / 87 25 / 65Dodd 0.283 0.183 0.436 0.000 31 / 255 120 / 365Peregrine 0.108 0.051 0.229 0.000 9 / 110 71 / 157Nuthalapaty 0.022 0.012 0.039 0.000 19 / 149 313 / 360Chan 0.162 0.097 0.270 0.000 19 / 306 116 / 400Heffner 0.143 0.113 0.181 0.000 86 / 1920 550 / 2227Ware 0.086 0.027 0.275 0.000 5 / 45 19 / 32Buist 0.465 0.288 0.748 0.002 32 / 212 62 / 224Xenakis 0.546 0.365 0.817 0.003 55 / 345 65 / 252Alberico 0.134 0.030 0.598 0.008 2 / 43 24 / 90Abou el-Leil 0.548 0.208 1.441 0.223 11 / 139 8 / 59Macer 0.131 0.060 0.283 0.000 11 / 176 26 / 77Boyd 0.967 0.861 1.086 0.569 689 / 3354 766 / 3631Dhall 1.005 0.470 2.148 0.991 12 / 63 26 / 137Arulkumaran 0.267 0.182 0.390 0.000 39 / 498 135 / 559Orhue 0.533 0.336 0.846 0.008 57 / 705 32 / 226Anderson 1.218 0.290 5.116 0.788 3 / 42 6 / 101Ekman 1.000 0.130 7.666 1.000 2 / 27 2 / 27Nooh 0.187 0.058 0.597 0.005 5 / 61 11 / 34Onifade 0.324 0.129 0.815 0.017 11 / 113 11 / 44
0.270 0.163 0.448 0.000 1108 / 8650 2388 / 90670.1 0.2 0.5 1 2 5 10
Lower in Multiparous Higher in Multiparous
Summary
87

Figure 2.25. Nulliparity in expectant management and elective induction of labor groups and cesarean delivery odds ratio between the two groups
y = 2.3208x + 0.1908R2 = 0.354 (EM)
y = 1.9234x + 0.3689R2 = 0.1802 (EIOL)
0
0.5
1
1.5
2
2.5
0 0.1 0.2 0.3 0.4 0.5 0.6 0.7 0.8
Nulliparity rate
Ces
area
n de
liver
y O
R
Nulliparity rate (EM) Nulliparity rate (IOL) Linear (Nulliparity rate (EM)) Linear (Nulliparity rate (IOL)) Figure 2.26. Mean nulliparity rate and cesarean delivery odds ratio between the two groups
y = 2.6296x + 0.0521R2 = 0.3366
0
0.5
1
1.5
2
2.5
0 0.1 0.2 0.3 0.4 0.5 0.6 0.7 0.8
Mean nulliparity rate
Ces
area
n de
liver
y O
R
Nulliparity Linear (Nulliparity)
88

Cervical status: Bishop score. Twelve cohort studies examined the cervical status using the Bishop score at the time of labor induction and the association with cesarean delivery. Most of these studies dichotomized the Bishop scores using three, four, or five as thresholds (Table 2.12). One study,7 included only women with a Bishop score of greater than four and performed a stratified analysis of subjects with Bishop scores between four and eight versus greater than eight. While these studies may differ by study design or patient population, all reported that the frequency of cesarean delivery is inversely related to Bishop scores such that a higher rate of cesarean delivery was observed in women with a lower Bishop score compared to women with more favorable cervix as represented by higher Bishop scores.
Table 2.12. Cesarean deliveries (following induction of labor) by Bishop score Bishop score Article n/N (%)
<5 >=5 <=5 >5 <4 >=4 <=3 > 3 >=4 and <8
>=8
Alberico S23 21/100 (21.0)
5/33 (15.2)
NR NR NR NR NR NR NR NR
Orhue AAE33
46/271 (16.9)
41/660 (6.2)
NR NR NR NR NR NR NR NR
Tan PC2 17/50 (34.0)
18/102 (17.6)
NR NR NR NR NR NR NR NR
Arulkumaran S32
NR NR NR NR 41/85 (48.2)
132/972 (13.6)
NR NR NR NR
Dhall K56 NR NR NR NR 16/47 (34.0)
22/153 (14.4)
NR NR NR NR
Dodd JM53 NR NR NR NR NR 46/240 (19.2)
105/380 (27.6)
NR NR NR
Xenakis EMJ44
NR NR NR NR NR NR 59/202 (29.2)
59/395 (14.9)
NR NR
Gabriel R16 NR NR 43/133 (32.3)
10/46 (21.7)
NR NR NR NR NR NR
Macer JA28 NR NR 14/61 (22.9)
23/192 (11.9)
NR NR NR NR NR NR
Schreyer P29 NR NR 3/34 (8.8)
1/27 (3.7)
NR NR NR NR NR NR
Nielsen PE7 NR NR NR NR NR NR NR NR 6/65 (9.2)
2/51 (3.9)
NR: not reported; Ware et al.19 reported a cesarean delivery rate of 50 percent among women with Bishop scores <=4 and 15 percent among women with Bishop scores >4.
Maternal age. Two observational studies examined the association between maternal age and cesarean delivery among women undergoing induction of labor. A prospective cohort study by Tan and colleagues2 was conducted in Malaysia between January 2003 and August 2004. This study included 152 women who had an induction of labor. In this cohort, there was no significant difference in cesarean delivery rates between women who were less than 35 years (24.0 percent) compared with women who were greater than or equal to 35 years (19 percent) of age. In another prospective study conducted between 1974 and 1981, Orhue and colleagues33 examined 1,775 women who had induction of
89

labor in Nigeria and found that maternal age greater than 35 years was not associated with increased cesarean delivery; 71 of 844 (8.4 percent) women with age less than or equal to 35 years had cesarean delivery compared to 89 of 931 (9.6 percent) women with age greater than 35 years.
Seven RCTs comparing elective induction of labor with expectant management reported mean age of the women included in their trials. Mean age of the women did not appear to predict the odds ratio of cesarean delivery between induced labor versus expectant management in these studies (Figure 2.27). Figure 2.27. Mean maternal age in RCTs as a predictor of the odds of cesarean delivery between induced labor and expectant management
y = -0.0665x + 3.0968R2 = 0.0805
0
0.5
1
1.5
2
2.5
20 22 24 26 28 30 32
Mean Age
Ces
area
n de
liver
y O
R
Maternal body-mass index. One prospective cohort study conducted in England between 2001 and 2003 examined maternal body-mass index as a predictor of cesarean delivery in the setting of IOL. The authors reported that women with a BMI greater than 29 kg/m2 had a higher frequency of cesarean delivery (15/32, 47 percent) compared to women with a BMI less than 30kg/m2 (65/235, 28 percent).5
Gestational age at delivery. Four cohort studies examined gestational age at delivery as a predictor of cesarean delivery in women who underwent induction of labor compared to spontaneous labor. Overall, there was a trend of increasing frequency of cesarean delivery with increasing gestational age (Table 2.13). One large retrospective cohort study of 6,985 women, conducted in Canada, observed that cesarean frequency increased from 18.5 percent when delivery occurred between 39 and 40 weeks gestation to 23.9 percent at 41 weeks gestation, and was as high as 44.6 percent when delivery occurred during 42 weeks and beyond.30 Similarly, another cohort study reported women who
90

delivered at 40 weeks or less also had a cesarean frequency (18.9 percent) lower than that of women who delivered at greater than 40 weeks (27.4 percent).2 Table 2.13. Cesarean deliveries (following induction of labor) by gestational age
Gestational age (weeks ) Article n/N (%)
41 Greater than or equal to 42
Less than or equal to 40
Greater than 40
Boyd ME30 328/1367 (23.9) 150/336 (44.6) 977/5282 (18.5) Not reported Caughey A3 147/821 (18) Not reported 281/1633 (17.2) Not reported Heimstad R46 69/349 (19.8) 129/599 (21.6) 207/1552 (13) Not reported Tan PC2 Not reported Not reported 15/79 (18.9) 20/73 (27.4)
Amniotic fluid index. The amniotic fluid index (AFI) is the sum of the deepest
vertical measurement of the amniotic fluid in the four quadrants of the uterus with a normal range of five to 20. Three cohort studies evaluated the association between AFI and cesarean delivery among women undergoing induction of labor. They reported conflicting results: While one study from England 6 reported that women with an amniotic fluid index (AFI) less than or equal to five had a higher frequency of cesarean delivery (39.4 percent) compared to women with an AFI greater than 5 (14 percent), two other cohort studies report otherwise (Table 2.14). These two smaller studies 2, 49 reported that women with a low AFI had lower cesarean delivery (5.0 percent, 9.5 percent, respectively for the two studies) compared to women with a normal AFI greater than 5 or 6 (9.5 percent, 26.7 percent, respectively for the two studies). Table 2.14. Cesarean deliveries (following induction of labor) by amniotic fluid index (AFI)
Article Amniotic fluid index n/N (%)
<=5 >5 <=6 >6 Alchalabi HA 6 26/66 (39.4) 16/114 (14.0) Not reported Not reported Tan PC 2 1/17 (5.9) 34/135 (25.2) Not reported Not reported Rizzo N 49 Not reported Not reported 2/21 (9.5) 16/60 (26.7) Summary of evidence assessing Key Question 3: What is the evidence that certain physical conditions/patient characteristics (e.g., parity, cervical dilatation, previous pregnancy outcome) are predictive of a successful induction of labor?
Parity. Twenty-three studies examined parity as a predictor of cesarean delivery in women undergoing induction of labor. In three RCTs, there was a decreased risk of cesarean delivery among the multiparous women when compared with the nulliparous women (OR 0.21; 95 percent CI: 0.06-0.72). Among the 20 cohort studies, the rate of cesarean delivery was 28 percent among the nulliparous women compared with 10 percent among the multiparous women. When we combined the cohort studies, there was a decreased risk of cesarean delivery among the multiparous women when compared to
91

the nulliparous women (OR 0.27; 95 percent CI 0.16-0.45). The overall evidence regarding this predictor was rated as high.
Cervical status. Twelve studies measured Bishop scores to evaluate cervical status as a predictor of cesarean delivery in women undergoing induction of labor. These studies differed by study design and patient population; however, all reported that the frequency of cesarean delivery was inversely related to Bishop scores such that a higher rate of cesarean delivery was observed in women with a lower Bishop score compared to women with more favorable cervix as represented by higher Bishop scores. The overall evidence evaluating this predictor was rated as moderate.
Maternal age. Two observational studies presented conflicting data to support maternal age as a predictor of cesarean delivery. Thus, the direction of effect could not be adequately determined based on the current literature reviewed and the evidence was rated as insufficient.
Maternal body-mass index. We identified one small prospective cohort study that examined maternal body-mass index as a predictor of cesarean delivery in the setting of induction of labor. The authors found that women with a BMI greater than or equal to 30kg/m2 had a higher frequency of cesarean delivery. We rated the strength of evidence as insufficient given the small-sized, single study of the topic.
Gestational age. Four cohort studies had consistent evidence to support that increasing gestational age was associated with increased rates of cesarean delivery in the setting of induction of labor and the strength of evidence was rated as moderate.
Amniotic fluid index. Three studies presented conflicting results regarding the level of amniotic fluid index at time of induction and its effect on mode of delivery. The evidence was insufficient to support any conclusions regarding the direction of effect. Key Question 4: Definition of Successful Labor Induction
We evaluated the definition of successful labor induction from each of the 76 included studies. 59 (78 percent) studies specified how a successful labor induction was defined (Table 2.15).
There are two principal means of defining successful induction of labor: Based on mode of delivery or having achieved the active phase of labor. We argue that the latter is more appropriate. The fundamental reason why induction of labor may lead to a cesarean delivery is through failure to achieve the active phase of labor, whereas a cesarean delivery during labor is common for two biologic reasons: Fetal intolerance of labor or cephalo-pelvic disproportion. Since the fetus continues to grow and the utero-placental unit only becomes more senescent with increasing gestational age, an elective induction of labor should only reduce the potential impact of both of these issues. Thus, if a cesarean delivery occurs in the setting of induction of labor, the most appropriate causal pathway is via the failure to achieve active phase of labor. Of the 76 included studies, only one utilized this definition to define success.44
Forty-four (58 percent) of the included studies defined success as achieving a vaginal delivery anytime after the onset of the induction of labor. (This was often inverted in that an induction was considered a failure when it lead to a cesarean delivery.) Other definitions of success included a spontaneous vaginal delivery or achieving a vaginal delivery in a specific amount of time, most commonly 24 hours, but also 6, 12, or 18
92

hours. One study defined induction of labor success as the onset of labor within 12 hours.24 Only one study defined induction of labor success as achieving active labor.44 Table 2.15. Definition of Induction of Labor Success
Definition n/N (%) 44/76 (57.9%)1-44 Vaginal delivery 16/76 (21.1%)11, 15, 22, 25, 27, 28, 31, 43, 45-52 Spontaneous vaginal delivery 9/76 (11.8%)1, 5, 13, 53-58 Vaginal delivery within 24 hours 17/76 (22.4%)59-75 Not Specified
Miscellaneous Definitions Used: 1/76 (1.3 %) 76 Vaginal delivery within 6 hours
Vaginal delivery within 12 hours 1/76 (1.3 %) 24 Vaginal delivery within 18 hours Labor within 12 hours Active Labor Achieved Delivery within 48 hours of scheduled induction
1/76 (1.3 %) 13 1/76 (1.3 %) 41 1/76 (1.3 %) 44 1/76 (1.3 %) 25
Note: Fourteen studies report more than one measure of induction of labor success. 1, 5, 11, 13, 15, 22, 24, 25, 27, 28, 31, 41, 43, 44
93

94

Chapter 3. Decision Analytic Model of Elective Induction of Labor
Given gaps in the available literature on elective induction of labor, we utilized decision and cost-effectiveness analyses to further address Key Questions 1 and 2, which compared elective induction of labor to expectant management of pregnancy. The advantage of utilizing decision analysis is that it allows us to explore some of the possible clinical implications of the information described in the meta-analysis as well as the implicit uncertainty in these data. For example, in decision analytic modeling, one of the first sensitivity analyses performed is the univariate analysis. This technique varies each point estimate in turn to determine what effect this factor has on the overall outcomes. In this setting, if varying the point estimates has little effect on the overall outcomes, one can be reassured that the results produced by the model are robust to uncertainty in these assumptions. Similarly, if a univariate sensitivity analysis produces change in the results, this guides investigators towards the need for greater certainty in the result from clinical studies. Based on these advantages, we utilized decision analysis as a complementary technique to the systematic review and present our methods and results in this chapter.
Decision Analytic Model Methods
We utilized decision analysis to characterize the expected outcomes in a population of pregnant women undergoing either induction of labor or expectant management of the pregnancy at or beyond a particular gestational age. The optimal timing of induction of labor depends on comorbidities of the pregnant patient, overall status of the developing fetus, and the potential complications associated with pursuing an induction of labor. While the clinical constraints of the obstetric population limit the number of management options that can be investigated in a prospective fashion, decision and cost-effectiveness analysis can be used to model the impact of induction strategies on clinical outcomes or cost in certain populations.125, 126 Similar to the way that clinicians integrate the prior probability of clinical outcomes of interest when making a management decision, decision-analytic models consider a hypothetical cohort of patients in a defined clinical scenario who experience the consequences of each management strategy based on their prior probability of each outcome being propagated through the decision tree structure. Correspondingly, the tree structure allows the assessment of multiple clinical outcomes as well as costs and cost-effectiveness.
To address the question of the consequences of induction of labor, we constructed decision trees to simulate clinical scenarios in which elective induction of labor might be considered as an alternative to expectant management of the pregnancy. Three separate models considering the question of elective induction of labor at 41, 40, and 39 weeks of gestation were created. Since expectant management beyond 40 weeks of gestation is usually accompanied by antenatal testing
1
Appendixes and evidence tables for this report are provided electronically at http://www.ahrq.gov/clinic/epcindex.htm.
95

with a combination of a nonstress test (NST) and amniotic fluid index (AFI), we included these interventions in the expectant management arms of the models for the 40 and 41 weeks models, but not between 39 and 40 weeks gestation in the 39 week model. Since the medical comorbidities of pregnant women may lead to an indicated induction of labor at any gestational age, the hypothetical cohort entering the decision tree consisted of women with low risk, singleton, cephalic gestations. In addition, since nulliparous women tend to incur increased costs during labor92 and have a higher likelihood of cesarean delivery in comparison to multiparous patients, we considered all patients to be nulliparous with the attendant increased risks in order to provide the most conservative estimate of the consequences of induction of labor. Decision-analytic models were developed with TreeAgePro 2007 software (TreeAge Software, Inc, Williamstown, MA).
Induction of labor for postterm pregnancy is currently recommended by the American College of Obstetricians and Gynecologists at 42 weeks gestation, so the first strategy assessed was induction of labor at 41 weeks versus expectant management of the pregnancy until 42 weeks (Figure 3.1). The literature shows an increase in intrauterine fetal demise127 and an increase in hypertensive complications of pregnancy with advancing gestational age.99 Thus, women undergoing expectant management could go into spontaneous labor (52 percent of ongoing pregnancies between 41 and 42 weeks), develop preeclampsia requiring induction of labor (1.2 percent), or have an intrauterine fetal demise (0.12 percent). As one of the primary clinical concerns with continuing pregnancy beyond term is the development of placental insufficiency leading to neonatal compromise or death, women undergoing expectant management in the model were subjected to antenatal testing consisting of a nonstress test and measurement of amniotic fluid volume in order to assess fetal well being and placental function. Women undergoing antenatal testing could therefore develop an indication for induction based on antenatal testing (14 percent of ongoing pregnancies 41-42 weeks). Women undergoing spontaneous or induced labor could experience downstream events including: 1) development of fetal macrosomia; 2) epidural placement; 3) mode of delivery, including spontaneous vaginal delivery, operative vaginal delivery, or cesarean delivery with potential for maternal mortality as a consequence (Figure 3.2); 4) severe perineal laceration, defined as a perineal laceration injuring the rectal sphincter; 5) shoulder dystocia with the possibility of brachial plexus injury or neonatal demise; and 6) meconium stained amniotic fluid with the possibility of meconium aspiration syndrome, potentially leading to neonatal demise (Figure 3.3). All women who reached a gestational age of 42 weeks with ongoing pregnancies underwent induction of labor at that time.
96

Figure 3.1. Schematic of Decision Tree for 41 week model
97

98
Figure 3.2. Mode of delivery for 39, 40, and 41 week models

99
Figure 3.3. Maternal and Neonatal outcomes for 39, 40, and 41 week models


The second strategy assessed was induction of labor at 40 weeks versus expectant management of the pregnancy (Figure 3.4). Similar to the 41 week model, women undergoing expectant management incurred a risk of preeclampsia (1.2 percent) and intrauterine fetal demise (0.09 percent), as well as the possibility of spontaneous labor (39 percent). While fewer data exist evaluating or supporting antenatal testing starting at 40 week and given that placental insufficiency with a resultant increase in intrauterine fetal demise remains a clinical concern, women undergoing expectant management at 40 weeks also underwent antenatal testing consisting of a nonstress test and measurement of amniotic fluid volume, and could thereby develop indications for induction based on antenatal testing (5 percent). Women undergoing spontaneous or induced labor experienced the same downstream events as detailed for the 41 week model (Figure 3.2 and Figure 3.3). All women who reached a gestational age of 41 weeks with ongoing pregnancies underwent induction of labor at that time.
Figure 3.4. Schematic of Decision Tree for 40 week model
The third strategy assessed was induction of labor at 39 weeks (Figure 3.5). Given that it is not routine to perform antenatal testing in women with uncomplicated pregnancies at this gestational age, women undergoing expectant management continued pregnancy with the chance to develop spontaneous labor (24 percent), preeclampsia (0.9 percent), or intrauterine fetal demise (0.05 percent), but did not undergo antenatal testing. Induction of labor at 39 weeks was compared both to ongoing pregnancy until 40 weeks with induction of labor at that time, and to ongoing pregnancy until 40 weeks followed by initiation of antenatal testing at 40 weeks with induction of labor at 41 weeks. All women underwent induction at 41 weeks. Women undergoing spontaneous or induced labor experienced the same downstream events detailed for the models above. Since 39 weeks is the gestational age beyond which ACOG allows elective induction of labor or cesarean delivery without assessment of fetal lung maturity, this is the earliest gestational age that was assessed for entry into the model.
In sum, three different management strategies were investigated: 1) Induction of labor at 41 weeks versus expectant management with antenatal testing until 42 weeks; 2) Induction of labor at 40 weeks versus expectant management with antenatal testing until 41 weeks; 3) Induction of labor at 39 weeks versus expectant management until induction of labor at 40 weeks or antenatal testing at 40 weeks followed by induction of labor at 41 weeks.
101
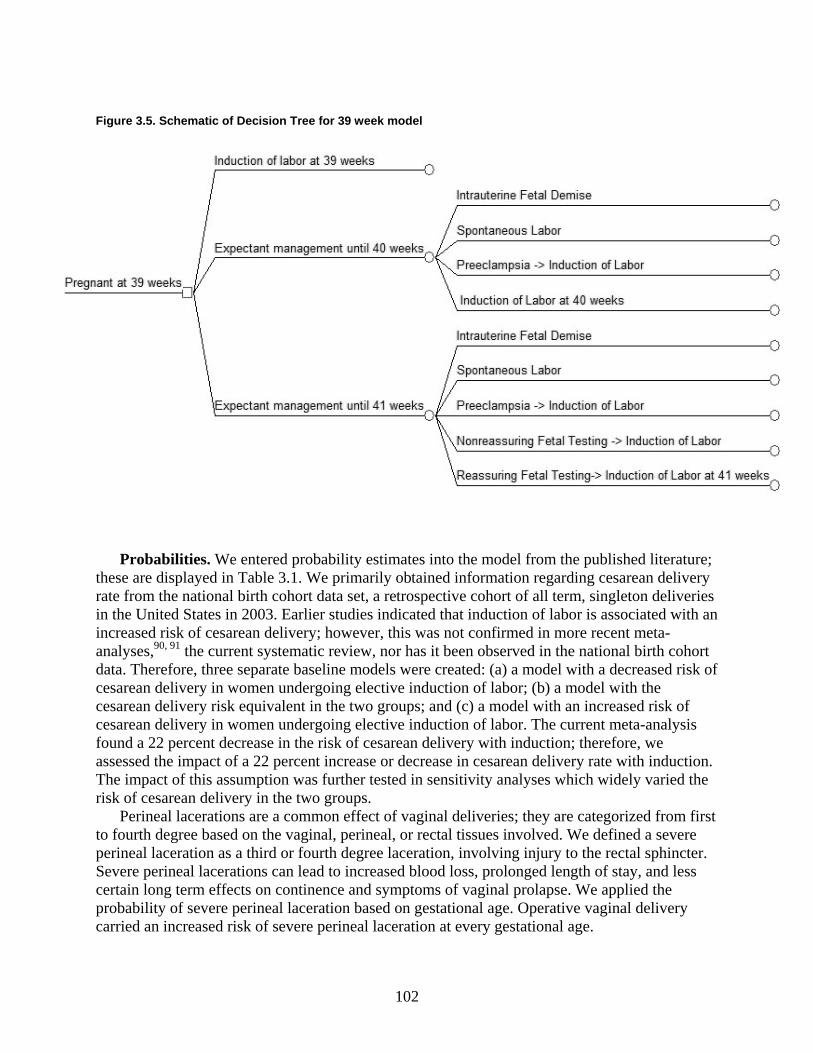
Figure 3.5. Schematic of Decision Tree for 39 week model
Probabilities. We entered probability estimates into the model from the published literature; these are displayed in Table 3.1. We primarily obtained information regarding cesarean delivery rate from the national birth cohort data set, a retrospective cohort of all term, singleton deliveries in the United States in 2003. Earlier studies indicated that induction of labor is associated with an increased risk of cesarean delivery; however, this was not confirmed in more recent meta-analyses,90, 91 the current systematic review, nor has it been observed in the national birth cohort data. Therefore, three separate baseline models were created: (a) a model with a decreased risk of cesarean delivery in women undergoing elective induction of labor; (b) a model with the cesarean delivery risk equivalent in the two groups; and (c) a model with an increased risk of cesarean delivery in women undergoing elective induction of labor. The current meta-analysis found a 22 percent decrease in the risk of cesarean delivery with induction; therefore, we assessed the impact of a 22 percent increase or decrease in cesarean delivery rate with induction. The impact of this assumption was further tested in sensitivity analyses which widely varied the risk of cesarean delivery in the two groups.
Perineal lacerations are a common effect of vaginal deliveries; they are categorized from first to fourth degree based on the vaginal, perineal, or rectal tissues involved. We defined a severe perineal laceration as a third or fourth degree laceration, involving injury to the rectal sphincter. Severe perineal lacerations can lead to increased blood loss, prolonged length of stay, and less certain long term effects on continence and symptoms of vaginal prolapse. We applied the probability of severe perineal laceration based on gestational age. Operative vaginal delivery carried an increased risk of severe perineal laceration at every gestational age.
102

Macrosomia, a neonatal complication defined as birthweight greater than 4000 grams, carries with it increased risk of operative vaginal delivery, cesarean delivery, and shoulder dystocia.128 As the fetus continues to grow throughout gestation, the likelihood of macrosomia increases with ongoing pregnancy, and therefore we applied gestational age specific estimates. A risk ratio of 1.52 for cesarean section was applied in the case of macrosomia.129 Shoulder dystocia is a clinical diagnosis, made during vaginal delivery when the extraction of the fetal shoulders is difficult. The long term clinical sequelae of shoulder dystocia may include permanent neonatal brachial plexus injury or neonatal demise. The risk of shoulder dystocia increases with increasing birthweight, and is higher in the case of operative vaginal delivery as compared to spontaneous vaginal delivery. We applied baseline estimates of shoulder dystocia based on the likelihood of macrosomia, and we applied a risk ratio of 1.74 for shoulder dystocia in the setting of operative vaginal delivery.129
Meconium is the greenish substance present in the intestinal tract of the developing fetus, comprised primarily of sloughed skin and GI tract cells and breakdown products of hemoglobin. Meconium is usually passed by the fetus at or near the time of delivery. The likelihood of passage of meconium in utero increases with fetal stress such as hypoxia as well as increasing gestational age. As such, the finding of meconium stained fluid increases the clinician’s index of suspicion that a fetus may be at risk of neonatal compromise. For the purposes of this model, we report meconium stained fluid as a clinical outcome of interest; the effects of the presence of meconium on the decision making of practitioners cannot be quantified as the effect may be subtle and vary considerably. A small proportion of infants born through meconium stained amniotic fluid will develop meconium aspiration syndrome, which occurs when the fetus breathes in amniotic fluid containing meconium; the meconium results in blockage and irritation of the airways, resulting in respiratory distress, which may resolve or lead to neonatal demise.
Preeclampsia is defined as elevated blood pressures and proteinuria associated with pregnancy, and is cured by delivery. Complications of preeclampsia include abruption, seizure, stroke, and maternal renal compromise. In pregnancies greater than 37 weeks, the rate of preeclampsia increases with increasing gestational age.99 Once a woman reaches a gestational age greater than 37 weeks, induction of labor is indicated when preeclampsia is diagnosed in order to decrease the likelihood of maternal or neonatal compromise. Table 3.1. Probability estimates
Baseline Low High Reference Probability of Cesarean with Expectant Management 41 weeks 0.293 0.147 0.44 Sanchez-Ramos90, U.S.
Birth Cohort 2003 40 weeks 0.251 0.126 0.377 U.S. Birth Cohort 2003 39 weeks 0.236 0.118 0.354 U.S. Birth Cohort 2003 RR cesarean delivery for expectant management vs. IOL at 41 weeks 1.0 0.7 1.5
Gulmezoglu 200691
RR cesarean delivery for expectant management vs. IOL at 40 weeks 1.0 0.7 1.5
U.S. Birth Cohort 2003
RR cesarean delivery for expectant management vs .IOL at 39 weeks 1.0 0.7 1.5
U.S. Birth Cohort 2003
Probability of Cesarean with Induction 41 weeks 0.27 0.135 0.405 U.S. Birth Cohort 2003
103

Table 3.1. Probability estimates (continued) Baseline Low High Reference 40 weeks 0.242 0.121 0.363 U.S. Birth Cohort 2003 39 weeks 0.223 0.1115 0.3345 U.S. Birth Cohort 2003 Probability of Cesarean Delivery with Spontaneous labor
0.217 0.108 0.325 U.S. Birth Cohort 2003
Probability of Operative Vaginal Delivery 42 weeks 0.174 0.087 0.261 Caughey 2007130 41 weeks 0.133 0.0665 0.1995 Caughey 2007130 40 weeks 0.109 0.0545 0.1635 Caughey 2007130 39 weeks 0.094 0.047 0.141 Caughey 2007130 Probability of Epidural with Induction 0.8143 0.7198 1 UCSF Probability of Epidural with Spontaneous Labor
0.7198 0.6 1 UCSF
Probability of IUFD 41 weeks 0.0012 0.0006 0.0018 Smith 2001127 40 weeks 0.0009 0.00045 0.00135 Smith 2001127 39 weeks 0.0005 0.00025 0.00075 Smith 2001127 Probability of Spontaneous Labor 41 weeks 0.52 0.26 0.78 Alexander 2001131 40 weeks 0.39 0.195 0.585 UCSF 39 weeks 0.24 0.12 0.36 UCSF Probability of Macrosomia 42 week 0.15 0.075 0.225 Alexander 2000132 41 weeks 0.12 0.06 0.18 Alexander 2000132 40 weeks 0.08 0.04 0.12 Alexander 2000132 39 weeks 0.05 0.025 0.075 Alexander 2000,132
Caughey 200498 Relative Risk for Cesarean Delivery with Macrosomia
1.52 0.81 2.43 Boulet 2003,133 Sanchez-Ramos 200390
Probability of Meconium Stained Fluid 42 weeks 0.277 0.1385 0.4155 Sanchez-Ramos 200390 41 weeks 0.224 0.112 0.336 Sanchez-Ramos 200390 40 weeks 0.17 0.085 0.255 Dargaville 2006,134
Sanchez-Ramos 200390 39 weeks 0.105 0.0525 0.1575 Dargaville 2006,134
Sanchez-Ramos 200390 Probability of Meconium Aspiration Syndrome 42 weeks 0.032 0.016 0.048 Gulmezoglu 200691 41 weeks 0.008 0.004 0.012 Gulmezoglu 200691 40 weeks 0.0045 0.00225 0.00675 Dargaville 2006,134
Gulmezoglu 200691 39 weeks 0.0025 0.00125 0.00375 Dargaville 2006,134
Gulmezoglu 200691 Probability of Neonatal Demise if Meconium Aspiration Syndrome
0.00025 0.000125 0.000375 Dargaville 2006134
Probability of Shoulder Dystocia without Macrosomia
0.0065 0.00325 0.00975 Nesbitt 1998,129 Rouse 1996135
Probability of Shoulder Dystocia with Macrosomia
0.1 0.05 0.15 Nesbitt 1998129
104

Table 3.1. Probability estimates (continued) Baseline Low High Reference Relative Risk for Shoulder Dystocia with Operative Vaginal Delivery
1.74 0.95 2.85 Nesbitt 1998129
Probability of Permanent Injury from Shoulder Dystocia
0.0067 0.00335 0.01005 Rouse 1996135
Probability of Neonatal Demise from Shoulder Dystocia
0.001 0.0005 0.0015 Nesbitt 1998129
Probability of Positive NST 41 weeks 0.14 0.07 0.21 Bochner 1988136 40 weeks 0.05 0.025 0.075 Probability of Severe Perineal Laceration 39 weeks, Vaginal Delivery 0.019 0.0095 0.0285 Caughey 2007130 39 weeks, Operative Vaginal Delivery 0.244 0.122 0.366 Caughey 2007130 40 weeks, Vaginal Delivery 0.022 0.011 0.033 Caughey 2007130 40 weeks, Operative Vaginal Delivery 0.26 0.13 0.39 estimated from Caughey
2007130 41 weeks, Vaginal Delivery 0.036 0.018 0.054 Caughey 2007130 41 weeks, Operative Vaginal Delivery 0.26 0.13 0.39 Caughey 2007130 42 weeks, Vaginal Delivery 0.051 0.0255 0.0765 Caughey 2007130 42 Weeks, Operative Vaginal Delivery 0.282 0.141 0.423 Caughey 2007130 Probability of Preeclampsia 42 weeks 0.012 0.006 0.018 Caughey 200399 41 weeks 0.012 0.006 0.018 Caughey 200399 40 weeks 0.012 0.006 0.018 Caughey 200399 39 weeks 0.009 0.005 0.015 Caughey 200399 Probability of Maternal Mortality with Cesarean Delivery
0.00035 0.000175 0.000525 Harper 2003137
Probability of Maternal Mortality with Vaginal Delivery
0.000092 0.000046 0.000138 Harper 2003137
RR=relative risk
Utilities. Outcomes from medical decisions can affect both the quality and quantity of life expected. The quality adjusted life year (QALY) is a measure that has been created in order to combine both of these effects. Essentially, it is the product of life expectancy multiplied by the quality of life of the health states that a person experiences. Utilities are a measure of quality of life, usually expressed on a 0 to 1 scale, which assesses how a patient values a health state. Methods for eliciting the value of particular outcomes are usually based on the idea of trade-offs of either risk or time, with participants being asked what risk of a worse outcome they would take to avoid a particular outcome138 or how many years of health in a certain state they would be willing to give up in order to be in perfect health for a shorter time.139
QALYs were based on maternal life expectancy estimates from the national birth/death statistics, assuming a discount rate of 0.03 (Table 3.2). Women experienced a slight decrement in utility in the case of a cesarean delivery, which was applied over their reproductive life, assuming an average age at menopause of 50. In the case of a neonatal demise or IUFD, maternal utility was decreased to 0.92, an estimate for women who experience a miscarriage.140 As we felt that this was likely an underestimate of the decrement in utility that would be experienced after an intrauterine fetal demise at term, this was applied for the remainder of the woman’s life. Due to a paucity of data, the utility of induction of labor, perineal laceration, and neonatal complications not resulting in neonatal demise could not be assessed. Similarly, a decrease in
105

neonatal QALYs based on meconium aspiration and shoulder dystocia could not be assessed. As the neonatal outcomes were all improved in the induction of labor arm, this only made the model more conservative with respect to intervention. Table 3.2. Utility estimates Baseline Low High Reference Utility of Cesarean Delivery 0.99 0.9 1 Caughey 2003141 Utility of IUFD 0.92 0.6 1 Kuppermann 2000140 Utility of Vaginal Delivery 1 Assumed Discount Rate 0.03 0 .06 Assumed Maternal Life Expectancy 56 28 84 U.S. Mortality Data 2003 Neonatal Life Expectancy 77 30 100 U.S. Mortality Data 2003
Costs. We included direct costs of hospitalization such as equipment, medication, supplies, and nursing and physician staffing costs, as well as indirect costs for hospital overhead and administration. All costs were obtained from the literature and projected to 2007 dollars by inflation with the medical component of the consumer price index (Table 3.3). Costs were applied for maternal interventions only. The estimated costs were: Vaginal delivery $7213, cesarean delivery $11092, additional cost of induction of labor $1237, and epidural $788. The cost of antenatal testing of $210 was calculated for twice weekly nonstress tests and assessment of amniotic fluid volume. Table 3.3. Cost estimates Baseline ($) Low High Reference Cost of Antenatal Testing 210 105 840 Goeree 1995142 Cost of Cesarean Delivery 11092 5546 44368 Bost 200392 Cost of Epidural 788 394 3152 Bost 200392 Additional cost of Induction of labor 1237 618.5 4948 Bost 200392 Cost of Vaginal Delivery 7213 3606.5 28852 Bost 200392
Analytic approach. We conducted analyses from a societal perspective. Baseline analyses
consisted first of generating costs and QALYs for each strategy to determine the strategy that minimized costs, the strategy that maximized utility, and cost effectiveness, the incremental cost required for increased QALYs.143
We evaluated a variety of clinical outcomes including: Cesarean delivery, macrosomia, shoulder dystocia, permanent injury from shoulder dystocia, intrauterine fetal demise, meconium stained fluid, meconium aspiration syndrome, and severe perineal laceration. We calculated each of these outcomes in the setting of either elective induction of labor or expectant management of pregnancy for a theoretical cohort of 10,000 women.
Sensitivity analysis is a technique to investigate how projected outcomes are affected when key assumptions are varied. We performed univariate sensitivity analysis for every input probability and cost; probabilities were varied from 50 to 150 percent of their baseline, and costs were varied from 50 to 400 percent of their baseline. In each case, we evaluated the effect on the model outcomes of varying the input around the original point estimate. Given that one of the potentially contentious assumptions of the model is that induction of labor results in a decrease in cesarean delivery rate, we examined the effect of varying the cesarean delivery rate on cost, utility, cost effectiveness, and clinical outcomes.
106

After examining the impact of varying one probability across its feasible range while holding other probabilities at their baseline, we examined the impact of simultaneously varying two estimates using two way sensitivity analysis. We identified candidate variables for two-way sensitivity analysis based on theoretical impact and results of one-way sensitivity analysis.
We also tested the impact of simultaneous changes in multiple inputs through Monte Carlo simulation. In this technique, each input probability, utility, and cost is defined by a distribution of possible values, rather than point estimates. We performed 1,000 Monte Carlo trials. In each trial, a different input probability, cost and utility is chosen from the underlying distribution. Analyzing the outcome of these 1,000 trials thus provides an estimate of the stability of our conclusions despite the simultaneous uncertainty in input assumptions.
We used beta distributions for probability and utility input variables. Beta distributions are the multivariate equivalent of binomial distributions, in that they are bounded between zero and one. We used gamma distributions for the costs. Gamma distributions are like normal distributions, except they are right-skewed. Thus, they are an accurate representation of medical cost distributions as some individuals will have costs that far exceed the mean.
Both beta and gamma distributions are defined by their mean and spread. We used the baseline model estimates as the distribution means. To estimate standard deviations, we utilized reasonable assumptions, which in general, allowed for very large spreads. For probabilities, we used +/- 0.05 to +/- 0.2 depending on the size of the baseline probability. Similarly, we allowed for +/- $200 to $1000 for costs depending on the size of the baseline cost.
Decision Analytic Model Results Induction of labor at 41 weeks versus expectant management from 41-42 weeks
Decision analytic results. Induction of labor at 41 weeks was superior to expectant management with an average of 56.910 total QALYs with an induction of labor at 41 weeks versus an average of 56.876 total QALYS with expectant management: An incremental gain of 0.033 QALYs. Table 3.4 shows the maternal, neonatal, and total QALYs for each strategy. Table 3.4. Decision analytic results for induction of labor at 41 weeks versus expectant management
Induction of Labor at 41 weeks
Expectant Management at 41 weeks
Incremental QALY gain for induction
of labor at 41 weeks
Maternal QALYs 26.910 26.908 0.002 Neonatal QALYs 30.000 29.969 0.031 Total QALYs 56.910 56.876 0.033 QALY=quality adjusted life year
Clinical outcomes. In terms of clinical outcomes, induction of labor at 41 weeks as opposed to expectant management results in lower rates of neonatal demise, pre-eclampsia, macrosomia, shoulder dystocia, meconium-stained amniotic fluid, meconium aspiration syndrome, severe perineal laceration and operative vaginal delivery. Table 3.5 demonstrates the clinical outcomes associated with each strategy for a cohort of 10,000 women.
107

Table 3.5. Clinical outcomes per 10,000 women for induction of labor at 41 weeks versus expectant management
Induction of labor at 41 weeks Expectant management at 41 weeks
Cesarean delivery 2700 2700 Perinatal demise <1 11 Macrosomia 1200 1405 Shoulder dystocia 131 323 Meconium-Stained Fluid 2240 2436 Meconium-Aspiration Syndrome
80 170
Severe perineal lacerations 561 644 Operative vaginal deliveries 1330 1482 Pre-eclampsia 0 120
Cost and cost-effectiveness results. Induction of labor at 41 weeks is more expensive as compared to expectant management. The average cost per woman of an induction at 41 weeks is $10,139 as compared to $9770 for expectant management for an average incremental cost of $368 per induction. In terms of cost-effectiveness, we find that it would cost an additional $10,789 per additional QALY. Typically, interventions are considered cost-effective if they are less than $50,000 to $100,000 per QALY. Thus, induction of labor at 41 weeks is a cost-effective intervention by conventional thresholds for cost effectiveness.
Impact of the cesarean delivery rate on outcomes. One of the key and potentially controversial assumptions in the model is that induction of labor leads to a lower cesarean delivery rate as compared to expectant management. To fully appreciate the impact of this assumption on model outcomes, we ran the model under three separate assumptions: (1) cesarean delivery rates are equal in the induction as compared to expectant management group [our baseline assumption] (2) cesarean delivery rates are 22 percent less in the induction as compared to the expectant management group [Chapter 2] (3) cesarean delivery rates are 22 percent more in the induction as compared to the expectant management group.
In terms of decision analytic results, the cesarean delivery rate has only a marginal impact (Table 3.6). In our baseline model, induction of labor leads to an incremental QALY gain of 0.033 QALYs. Based on the meta-analysis presented in Chapter 2, it appears that induction of labor is associated with a 22 percent decrease in cesarean delivery rate; this would lead to an increase in the incremental QALYs gained to 0.046. Conversely, assuming that induction of labor was associated with a 22 percent increase in the cesarean delivery rate led to a decrease in the incremental QALYs gained to 0.023 QALYs.
108

Table 3.6. Decision analytic results with varying assumptions in cesarean delivery rates Induction of labor Expectant Management
Total QALYs
Maternal QALYS
Neonatal QALYS
Total QALYs
Maternal QALYs
Neonatal QALYS
Incremental gain in total
QALYs C/S rate equal
56.910 26.910 30.000 56.876 26.908 29.968 0.033
C/S rate 22% lower IOL
56.922 26.922 30.000 56.876 26.908 29.968 0.046
C/S rate 22% higher IOL
56.899 26.899 30.000 56.876 26.908 29.968 0.023
QALY=quality-adjusted life year; C/S=cesarean delivery Similarly, we tested the impact of cesarean delivery rates on clinical outcomes. Table 3.7
shows the clinical outcomes per 10,000 women for induction versus expectant management at 41 weeks under the same variations in cesarean delivery rate. As shown, the cesarean delivery rate had no effect on most outcomes, and only a very modest impact on shoulder dystocia and perineal laceration. Because the incidence of these complications increases with gestational age, induction of labor is always beneficial in terms of shoulder dystocia and perineal lacerations; interestingly, since varying the relative risk of cesarean delivery affects the number of women at risk for these complications, the relative benefit increases as the likelihood of cesarean delivery with induction increases. Table 3.7. Clinical outcomes with various assumptions in the cesarean delivery rate
Cesarean delivery rate equal
Cesarean delivery rate 22% lower with an induction
Cesarean delivery rate 22% higher with an induction
Induction Expt Mgt Induction Expt Mgt Induction Expt Mgt Cesarean delivery 2700 2700 2106 2700 3294 2700 Neonatal demise <1 11 <1 11 <1 11 Macrosomia 1200 1405 1200 1405 1200 1405 Shoulder dystocia 131 323 144 323 117 323 Meconium-Stained Fluid
2240 2436 2240 2436 2240 2436
Meconium-Aspiration Syndrome
80 170 80 170 80 170
Severe perineal lacerations
561 644 582 644 539 644
Operative vaginal deliveries
1330 1482 1330 1482 1330 1482
Pre-eclampsia 0 120 0 120 0 120 Expt Mgt=expectant management
Finally, we tested the impact of cesarean delivery rates on the cost and cost-effectiveness calculations. Under all three assumptions, induction of labor at 41 weeks as compared to expectant management was a cost-effective strategy. Using our baseline assumption that the cesarean delivery rate is equal in either scenario, the incremental cost per QALY is $10,789. Based on the review of the literature performed in this report, the cesarean delivery rate is 22 percent lower with an induction; under that assumption, the incremental cost per QALY is $3023. Next, we assumed that the cesarean delivery rate is 22 percent higher with an induction,
109

and the incremental cost per QALY increased to $26,450. Table 3.8 shows the cost and cost-effectiveness outcomes under the various cesarean delivery rate assumptions. Table 3.8. Cost-effectiveness of an induction versus expectant management at 41 weeks under various cesarean delivery rate assumptions
Cesarean delivery rate equal
Cesarean delivery rate 22% lower with an
induction
Cesarean delivery rate 22% higher with an induction
Induction Expt Mgt Induction Expt
Mgt Induction Expt Mgt
Cost ($) $10,139 $9770 $9908 $9770 $10,369 $9770 Effectiveness (Total QALYs)
56.910 56.876
56.922 56.876 56.899 56.876
Incremental cost per additional QALY
$10,789 - $3023 - $26,450 -
Effectiveness (Maternal QALYs only)
26.910 26.908 26.922 26.908 26.899 26.908
Incremental cost per additional maternal QALY
$164,321 - $10,010 - Dominated -
QALY=quality-adjusted life year; Expt Mgt=expectant management Univariate sensitivity analysis. Univariate sensitivity analysis was performed on each input variable in the model. We varied all probabilities from 50 percent to 150 percent of baseline. We varied costs from 50 percent to 400 percent of baseline. Below are highlighted some of the important findings. Figure 3.6. Sensitivity analysis varying relative risk of cesarean delivery with induction
Vertical line shows base case assumption, cesarean delivery rates equal
110

Probabilities. As described above, the relative cesarean delivery rate for expectant management versus induction is both important and uncertain. Figure 3.6 demonstrates the impact of varying the relative rate over a wide range. Induction is cost-effective up to 148 percent of baseline cesarean risk with induction of labor at a willingness to pay threshold of $100,000.
Figure 3.7 shows the impact of the spontaneous labor rate. If the rate of spontaneous labor between 41 and 42 weeks is 25 percent or less, induction of labor at 41 weeks is the dominant option. It remains cost-effective for the entire range; at 150 percent of baseline (78 percent) it costs $24,710 per additional QALY. Figure 3.7. Sensitivity analysis varying probability of spontaneous labor before 42 weeks
Vertical line indicates spontaneous labor rate of 52 percent, base case assumption.
Costs. The model was slightly more sensitive to changes in cost inputs. However, as stated above, induction of labor was always the cost-effective strategy.
Induction of labor is cost-effective at an antenatal testing cost of $105 (50 percent of baseline) at $13,839 per QALY. At an antenatal testing cost of $600 (300 percent of baseline), induction of labor becomes the dominant option. As the cost of labor induction increases, the cost-effectiveness of labor induction decreases to $59,316 per QALY at 400 percent of baseline estimates (an additional $5000 per IOL).
Two-way sensitivity analysis. Two-way sensitivity analysis was also performed to examine the effect of simultaneously varying two inputs. First, we investigated the impact of varying the probability of spontaneous labor within the next week along with the relative risk of cesarean delivery with induction of labor. Clinically, the determinants of successful induction may be similar to the predictors of spontaneous labor in the following week. However, sensitivity analysis shows that even when the likelihood of spontaneous labor is high, as long as the cesarean delivery rate is at least equal in the expectant management and induction arms, induction remains a cost effective intervention. Next, we explored the effect of varying the relative risk of cesarean delivery and the additional cost of labor induction. In women with the
111

lowest likelihood of successful induction, additional costs may be incurred as the induction process may be prolonged. Induction remained cost effective across all cost estimates. Examining this from a different perspective, the additional cost of labor induction may be varied with the likelihood of spontaneous labor in the next week. Given that the baseline estimate of spontaneous labor is 52 percent, induction of labor remains cost effective even if the additional cost is increased to 400 percent of the baseline, with the likelihood of spontaneous labor increasing to 150 percent of the baseline. Monte Carlo simulation.
Multivariate sensitivity analysis, or Monte Carlo simulation, is performed to test the robustness to simultaneous changes in multiple input variables. We found that in 24 percent of the trials induction of labor at 41 weeks was the dominant strategy (i.e., less expensive and more effective). In all remaining trials it was more effective, but also more expensive. Figure 3.8 illustrates the distribution of incremental costs and effectiveness for induction of labor compared to expectant management at 41 weeks. Each trial is represented by a different dot. The 95 percent confidence interval is shown by the elliptical borders (i.e., 95 percent of all trials fall within this boundary).
Figure 3.8. Incremental cost effectiveness for induction of labor compared with expectant management at 41 weeks
Figure 3.9. Acceptability curve Figure 3.9 shows the acceptability curve which illustrates the proportion of all trials in which each strategy is cost-effective at various wto-pay thresholds. Using a willingness-to-pay threshold$100,000, induction of labor at 41 weeks is cost-effective in 98.5 percent of the trials. At a willinto pay of $50,000, it is cost-effectivin 95.1 percent of trials. In otherwords, we can be 95 percent confident that if women are willing to pay at least $50,000 for one additional QALY, then induclabor at 41 weeks would be a coeffective intervention.
0
0.2
0.4
0.6
0.8
1
1.2
0 10 20 30 40 50 60 70 80 90 100 110Thousands
Willingness to Pay
Prop
ortio
n C
ost-
Effe
ctiv
e
IOL - 41 wksExpt Mgmtillingness-
of
gness e
tion of st-
112
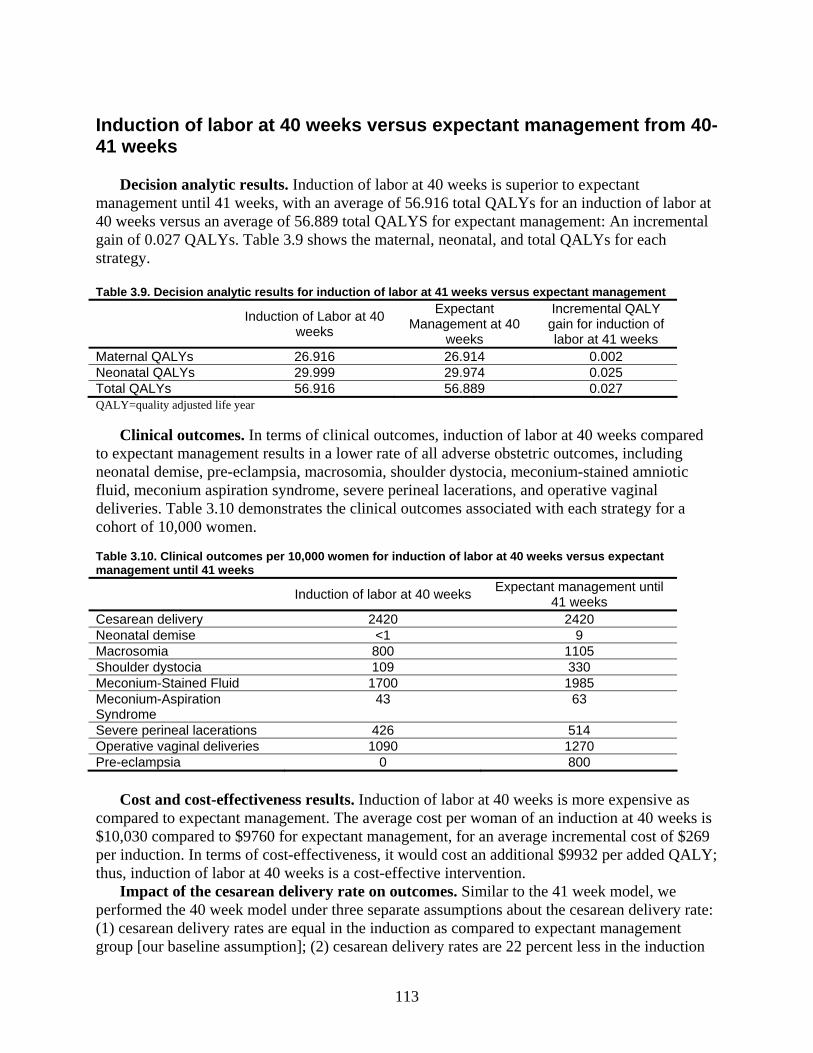
Induction of labor at 40 weeks versus expectant management from 40-41 weeks
Decision analytic results. Induction of labor at 40 weeks is superior to expectant management until 41 weeks, with an average of 56.916 total QALYs for an induction of labor at 40 weeks versus an average of 56.889 total QALYS for expectant management: An incremental gain of 0.027 QALYs. Table 3.9 shows the maternal, neonatal, and total QALYs for each strategy. Table 3.9. Decision analytic results for induction of labor at 41 weeks versus expectant management
Induction of Labor at 40 weeks
Expectant Management at 40
weeks
Incremental QALY gain for induction of labor at 41 weeks
Maternal QALYs 26.916 26.914 0.002 Neonatal QALYs 29.999 29.974 0.025 Total QALYs 56.916 56.889 0.027 QALY=quality adjusted life year
Clinical outcomes. In terms of clinical outcomes, induction of labor at 40 weeks compared to expectant management results in a lower rate of all adverse obstetric outcomes, including neonatal demise, pre-eclampsia, macrosomia, shoulder dystocia, meconium-stained amniotic fluid, meconium aspiration syndrome, severe perineal lacerations, and operative vaginal deliveries. Table 3.10 demonstrates the clinical outcomes associated with each strategy for a cohort of 10,000 women. Table 3.10. Clinical outcomes per 10,000 women for induction of labor at 40 weeks versus expectant management until 41 weeks
Induction of labor at 40 weeks Expectant management until 41 weeks
Cesarean delivery 2420 2420 Neonatal demise <1 9 Macrosomia 800 1105 Shoulder dystocia 109 330 Meconium-Stained Fluid 1700 1985 Meconium-Aspiration Syndrome
43 63
Severe perineal lacerations 426 514 Operative vaginal deliveries 1090 1270 Pre-eclampsia 0 800
Cost and cost-effectiveness results. Induction of labor at 40 weeks is more expensive as compared to expectant management. The average cost per woman of an induction at 40 weeks is $10,030 compared to $9760 for expectant management, for an average incremental cost of $269 per induction. In terms of cost-effectiveness, it would cost an additional $9932 per added QALY; thus, induction of labor at 40 weeks is a cost-effective intervention.
Impact of the cesarean delivery rate on outcomes. Similar to the 41 week model, we performed the 40 week model under three separate assumptions about the cesarean delivery rate: (1) cesarean delivery rates are equal in the induction as compared to expectant management group [our baseline assumption]; (2) cesarean delivery rates are 22 percent less in the induction
113

as compared to the expectant management group, as would be expected based on the meta-analysis presented in Chapter 2; and (3) cesarean delivery rates are 22 percent higher in the induction as compared to the expectant management group.
As with the 41 week model, the cesarean delivery rate had only a marginal impact (Table 3.11). In our baseline model, induction of labor leads to an incremental QALY gain of 0.027 total QALYs. Assuming a 22 percent decrease in the cesarean delivery rate with induction of labor, the incremental QALY gain increases to 0.037. Assuming that induction of labor was associated with a 22 percent increase in the cesarean delivery rate, the incremental QALY gain decreases to 0.016 QALYs.
Table 3.11. Decision analytic results with varying assumptions in cesarean delivery rates
Induction of labor Expectant Management Total
QALYs Maternal QALYs
Neonatal QALYs
Total QALYs
Maternal QALYs
Neonatal QALYs
Incremental gain in total QALYs
C/S rate equal 56.916 26.916 29.999 56.889 26.914 29.974 0.027 C/S rate 22% lower IOL
56.926 26.926 29.999 56.889 26.914 29.974 0.037
C/S rate 22% higher IOL
56.905 26.905 29.999 56.889 26.914 29.974 0.016
C/S=cesarean delivery; QALY=quality-adjusted life year
Table 3.12 shows the clinical outcomes per 10,000 women for induction versus expectant management at 40 weeks under the same variations in cesarean delivery rate assumptions. The categories with any change in the cesarean delivery rate are displayed in bold text.
Table 3.12. Clinical outcomes with various assumptions in the cesarean delivery rate
Cesarean delivery rate equal
Cesarean delivery rate 22% lower with an
induction
Cesarean delivery rate 22% higher with an
induction
Induction Expt Mgt Induction Expt Mgt Induction Expt Mgt Cesarean delivery 2420 2420 1888 2420 2952 2420 Neonatal demise <1 9 <1 9 <1 9 Macrosomia 800 1105 800 1105 800 1105 Shoulder dystocia 109 330 118 330 100 330 Meconium-Stained Fluid
1700 1985 1700 1985 1700 1985
Meconium-Aspiration Syndrome
43 63 43 63 43 63
Severe perineal lacerations
426 514 438 514 414 514
Operative vaginal deliveries
1090 1270 1090 1270 1090 1270
Pre-eclampsia 0 120 0 120 0 120 Expt Mgt=expectant management
The impact of cesarean delivery rates on the cost and cost-effectiveness calculations are
shown below. Under all three assumptions, induction of labor at 40 weeks is a cost-effective strategy as compared to expectant management. Using the baseline assumption that the cesarean delivery rate is equal, the incremental cost is $9932 per QALY. If the cesarean delivery rate is 22 percent lower for induction of labor at 40 weeks, the incremental cost is $1692 per QALY. Table 3.13 shows the cost and cost-effectiveness outcomes under the various cesarean delivery rate assumptions.
114

Table 3.13. Cost and Cost-Effectiveness for induction versus expectant management under various cesarean delivery rate assumptions
Cesarean delivery rate equal
Cesarean delivery rate 22% lower with
an induction
Cesarean delivery rate 22% higher with an
induction
Induction Expt Mgt Induction Expt Mgt Induction Expt Mgt Cost ($) $10,030 $9760 $9823 $9760 $10,237 $9760 Effectiveness (Total QALYs)
56.916 56.889 56.926 56.889
56.905 56.889
Incremental cost per additional QALY
$9932 - $1692 - $28,267 -
Effectiveness (Maternal QALYs only)
26.916 26.914 26.926 26.914 26.905 26.914
Incremental cost per additional maternal QALY
$135,000 - $5250 - Dominated -
QALY=quality-adjusted life year; Expt Mgt=expectant management Univariate sensitivity. Univariate sensitivity analysis was performed on each input variable in the 40 week model. Again, all probabilities were varied from 50 percent to 150 percent of baseline. We varied costs from 50 percent to 400 percent of baseline.
Probabilities. Figure 3.10 demonstrates the impact of varying the relative rate of cesarean delivery for an induction compared to expectant management over a wide range. As shown, induction of labor is the dominant strategy if the relative risk of cesarean delivery in the induction group is less than 76 percent of the rate of cesarean delivery in the expectant management group. Induction is cost-effective up to 144 percent of the baseline. Figure 3.10. Sensitivity analysis varying relative risk of cesarean delivery with induction
115

Figure 3.11 illustrates the impact of the spontaneous labor rate. If the rate of spontaneous
labor between 40 and 41 weeks is 20 percent or less, induction of labor at 40 weeks is the dominant option. It remains cost-effective all the up to 200 percent of baseline (78 percent) at $31,368 per QALY. Figure 3.11. Sensitivity analysis varying probability of spontaneous labor
Costs. The model was more sensitive to changes in cost inputs. However, induction of labor
was always the cost-effective strategy. Induction of labor is cost-effective at $12,635 per QALY to an antenatal testing cost of $105 (50 percent of baseline). At an antenatal testing cost of $450 (200 percent of baseline estimates) induction of labor becomes the dominant option. As the cost of labor induction increases, the cost-effectiveness of labor induction decreases to $56,218 per QALY at the 400 percent of baseline estimates (an additional $5000 per induction).
Two-way sensitivity analysis. Similar to the results in the 41 week model, even if the likelihood of spontaneous labor is higher than expected, and the cesarean delivery rate is at least equal in the expectant management and induction arms, induction remains a cost effective intervention. In women with the lowest likelihood of successful induction, additional costs may be incurred as the induction process may be prolonged. If induction continues to confer either an equal or a decreased risk of cesarean delivery in comparison to expectant management, even if the additional cost of induction of labor increases to twice the baseline estimate, induction of labor remains cost effective.
Monte Carlo simulation. We performed multivariate sensitivity analysis, or Monte Carlo simulation, to test the robustness to simultaneous changes in multiple input variables. Figure 3.12 demonstrates the distribution of incremental costs and effectiveness for induction of labor as compared to expectant management at 40 weeks. Each trial is represented by a different dot. The 95 percent confidence interval is shown by the elliptical line (i.e. 95 percent of all trials fall within this boundary). In this multivariate sensitivity analysis, elective induction of labor is only cost-effective in approximately 55 percent of trials (Figure 3.13) as compared to well over 95
116

percent of the trials in the 41 week model and is even dominated by expectant management in a proportion of cases. Figure 3.12. Monte Carlo simulation of induction of labor versus expectant management at 40 weeks of gestation Figure 3.13. Acceptability curve
0
0.1
0.2
0.3
0.4
0.5
0.6
0.7
0 20,000 40,000 60,000 80,000 100,000 120,000
Willingness to Pay
Prop
ortio
n C
ost-E
ffect
ive
IOL - 40 wksExpt Mgmt
Figure 3.13 is the acceptability curve which demonstrates the proportion of all trials in which each strategy is cost-effective at various willingness-to-pay thresholds. Using a willingness-to-pay threshold of $100,000, induction of labor at 40 weeks is cost-effective in 55 percent of the trials.
117

Induction of labor at 39 weeks versus expectant management from 39-40 weeks and expectant management from 39-41 weeks
Decision analytic results. Induction of labor at 39 weeks is superior to expectant management until 40 or 41 weeks, with an average of 56.920 total QALYs for induction at 39 weeks versus an average of 56.903 total QALYS for expectant management until 40 weeks and 56.877 for expectant management until 41 weeks. This represents an incremental gain of 0.017 QALYs for induction at 39 weeks compared to expectant management until 40 weeks and an incremental gain of 0.033 QALYs for an induction as compared to expectant management until 41 weeks. Table 3.14 shows the maternal, neonatal, and total QALYs for each strategy; Table 3.14. Decision analytic results for induction of labor at 39 weeks versus expectant management Induction of Labor at 39
wks Expectant Management
until 40 wks Expectant Management
until 41 wks Maternal QALYs 26.920 26.919 26.915 Neonatal QALYs 30.000 29.984 29.962 Total QALYs 56.920 56.903 56.877
Clinical outcomes. In terms of clinical outcomes, induction of labor at 39 weeks compared to expectant management until either 40 or 41 weeks leads to a lower rate of all adverse obstetric outcomes, including neonatal demise, pre-eclampsia, macrosomia, shoulder dystocia, meconium-stained amniotic fluid, meconium aspiration syndrome, severe perineal lacerations, and operative vaginal deliveries. Table 3.15 shows the clinical outcomes associated with each strategy for a cohort of 10,000 women. Table 3.15. Clinical outcomes per 10,000 women for induction of labor at 39 weeks versus expectant management until 40 or 41 weeks Induction of labor at 39
weeks Expectant management
until 40 weeks
Expectant management until
41 weeks Cesarean delivery 2230 2227 2349 Perinatal demise <1 5 12 Macrosomia 500 763 997 Shoulder dystocia 87 107 346 Meconium-Stained Fluid 1098 1699 1921 Meconium-Aspiration Syndrome
27
45
59
Severe perineal lacerations
380
430
506
Operative vaginal deliveries
966
1089
1270
Pre-eclampsia 0 91 175
Cost and cost-effectiveness results. Induction of labor at 39 weeks is more expensive compared to expectant management until either 40 or 41 weeks. The average cost per woman of an induction at 39 weeks is $9,568 versus $9253 for expectant management until 40 weeks and $8915 for expectant management until 41 weeks. Thus, the incremental cost per woman induced is $316 compared to expectant management to 40 weeks and $338 per woman expectantly managed to 40 weeks compared to expectant management until 41 weeks. In terms of cost-effectiveness, it costs an additional $20,222 per additional QALY compared to expectant
118

management until 40 weeks and an additional $13,900 per additional QALY as compared to expectant management until 41 weeks. Thus, induction of labor at 39 weeks is the most cost-effective strategy at any reasonable willingness-to-pay threshold.
Considering maternal QALYs alone, however, induction of labor at 39 weeks is not cost effective, as induction costs an additional $269,151 per QALY compared to induction at 40 weeks, and is more expensive and only equally effective compared to induction at 40 weeks (see table 3.18 below).
Impact of the cesarean delivery rate on outcomes. As with the previous models, we examined the 39 week model under three separate assumptions about the cesarean delivery rate: (1) cesarean delivery rates are equal in the induction and expectant management groups [our baseline assumption]; (2) cesarean delivery rates are 22 percent less in the induction compared to the expectant management group; and (3) cesarean delivery rates are 22 percent more in the induction as compared to the expectant management groups.
In our baseline model, induction of labor leads to an incremental QALY gain of 0.017 QALYs for an induction compared to expectant management until 40 weeks and an incremental gain of 0.033 QALYs for an induction as compared to expectant management until 41 weeks. Assuming that induction of labor led to a 22 percent decrease in cesarean delivery rate, the incremental QALY gain increases to 0.027 and 0.043, respectively. If induction of labor is associated with a 22 percent increase in the cesarean delivery rate the incremental QALY gain decreases to 0.007 and 0.023 QALYs, respectively (Table 3.16).
Table 3.16. Decision analytic results with varying assumptions in cesarean delivery rates
Induction of labor Expectant Management until 40 weeks
Expectant Management until 41 weeks
Total QALYs
Maternal QALYs
Neonatal QALYs
Total QALYs
Maternal QALYs
Neonatal QALYs
Total QALYs
Maternal QALYs
Neonatal QALYS
C/S rate equal
56.920 26.920 29.999 56.904 26.919 29.985 56.877 26.915 29.962
C/S rate 22% lower IOL
56.930 26.930 29.999 56.904 26.919 29.985
56.877 26.915 29.962
C/S rate 22% higher IOL
56.910 26.910 29.999 56.904 26.919 29.985 56.877 26.915 29.962
C/S: Cesarean delivery; QALY: Quality-adjusted life year
Similarly, we tested the impact of cesarean delivery rates on clinical outcomes. Table 3.17 displays the clinical outcomes per 10,000 women for induction versus expectant management until 40 and 41 weeks under the same variations in cesarean delivery rate.
119

Table 3.17. Clinical outcomes with various assumptions in the cesarean delivery rate Cesarean delivery rate at
baseline Cesarean delivery rate 22%
lower with an induction Cesarean delivery rate 22%
higher with an induction
Induction
Expt Mgt until
40 wks
Expt Mgt until 41
wks
Induction
Expt Mgt until
40 wks
Expt mgt until 41
wks
Induction
Expt Mgt until 40
wks
Expt mgt until 41
wks Cesarean delivery
2230 2230 2349 1739 2230 2349 2721 2230 2349
Neonatal demise
<1 5 12 <1 5 12 <1 5 12
Macrosomia 500 763 997 500 763 997 500 763 997 Shoulder dystocia
87 107 346 93 107 346 80 107 346
Meconium-Stained Fluid
1098 1699
1921
1098 1699
1921
1098 1699
1921
Meconium-Aspiration Syndrome
27
45
59
27
45
59
27
45
59
Severe perineal lacerations
380
430
506
389
430 506 371
430 506
Operative vaginal deliveries
966
1089
1270
966
1089
1270
966
1089
1270
Pre-eclampsia
0 667 1088 0 667 1088 0 667 1088
Expt: Expectant management
The impact of cesarean delivery rates on the cost and cost-effectiveness calculations are shown in Table 3.18. Unlike the previous models, the cesarean delivery rate assumptions impact the cost-effectiveness conclusions for this model. While induction of labor is cost-effective as compared to expectant management, the cost per QALY has increased. Additionally, when examining maternal QALYs, with an increased in the cesarean delivery rate of 22 percent per induction, induction of labor is both more expensive and less effective (hence dominated) as compared to expectant management until 40 weeks.
120

Table 3.18. Cost and cost-effectiveness for induction versus expectant management under various cesarean delivery rate assumptions
Cesarean delivery rate equal (baseline)
Cesarean delivery rate 22% lower with an induction at 39
weeks
Cesarean delivery rate 22% higher with an induction at 39 weeks
Induction Expt Mgt until 40
wks
Expt Mgt until 41
wks Induction
Expt Mgt
until 40 wks
Expt Mgt
until 41 wks
Induction Expt Mgt until 40
wks
Expt Mgt until 41
wks
Cost ($) $9568 $9253 $8915 $9367 $9253 $8915 $9770 $9253 $8915 Effectiveness (Total QALYs)
56.920 56.903 56.877 56.930 56.903 56.877 56.910 56.903 56.877
Incremental cost per additional QALY (IOL as compared to expt mgt strategy)
- $18,914 $15,385 - $4350 $8693 - $71,945 $25,931
Effectiveness (Maternal QALYs only)
26.920 26.919 26.915 26.930 26.919 26.915 26.910 26.919 26.915
Incremental cost per additional maternal QALY (IOL as compared to expt mgt strategy)
- $299,058 $130,866 - $10,776 $31,139 - Dominated Dominated
Expt Mgt: Expectant management; QALY: Quality-adjusted life year
Univariate sensitivity. Univariate sensitivity analysis was performed on each input variable in the 39 week model. Again, all probabilities were varied from 50 percent to 150 percent of baseline. Similarly, costs were varied from 50 percent to 400 percent of baseline. Given the findings of the previous models showing cost-effectiveness of induction of labor at 40 weeks, induction of labor at 39 weeks was compared to expectant management until 40 weeks. Unlike the previous models, however, this model was not uniformly robust. Highlighted below are the key findings.
Probabilities. Figure 3.14 demonstrates the impact of varying the relative rate of cesarean delivery for an induction at 39 weeks compared to expectant management until 40 weeks over a wide range. As shown, the model is quite sensitive to the risk of cesarean delivery with induction compared to expectant management until 40 weeks. Induction of labor is the dominant strategy if the rate of cesarean delivery is less than 75 percent of the cesarean rate with expectant management. Induction is cost-effective at $50,000 until the risk of cesarean delivery is 14 percent higher with an induction. Induction is cost-effective at $100,000 until the risk of cesarean delivery is 22 percent higher with induction, and at an increased risk of 35 percent or higher, induction of labor is dominated (more expensive and less effective) as compared to expectant management until 40 wks.
121

FiFigure 3.14. Sensitivity analysis on relative rate of cesarean delivery with IOL at 39 weeks
0
20,000
40,000
60,000
80,000
100,000
120,000
140,000
160,000
0 0.25 0.5 0.75 1 1.25 1.5
RR CD IOL
Incr
emen
tal C
ost/E
ff
180,000Induction of labor at39 weeks
05,000
10,00015,00020,00025,00030,00035,00040,00045,00050,00055,00060,000
0 0.1 0.2 0.3 0.4 0.5 0.6 0.7 0.8
Probability of Spontaneous Labor
Incr
emen
tal C
ost/E
ff
Induction of labor at39 weeks
Figure 3.15 shows the impact of the spontaneous labor rate. Induction of labor is cost-effective compared to expectant management until 40 weeks over the entire range. If the rate of spontaneous labor is half of the baseline rate (12 percent) then induction of labor at 39 weeks costs $9337 per addition QALY. If the rate of spontaneous labor is 2 times baseline (48 percent) then induction of labor costs $39,013 per QALY.
Figure 3.15. Sensitivity analysis on probability of Spontaneous Labor 39-40 weeks
Costs. Induction of labor is the cost effective option down to 50 percent of the baseline cesarean delivery costs. As the cost of labor induction increases, the cost-effectiveness of labor induction decreases. Induction of labor is cost-effective at a willingness-to-pay threshold of $100,000 over the entire range. At a threshold of $50,000 per QALY, it is cost-effective to $4123 (330 percent of baseline).
122

Two-way sensitivity analysis. Figure 3.16 illustrates the impact of varying the probability of spontaneous labor within the next week along with the relative risk of cesarean delivery with induction of labor. Of note, all two-way sensitivity analyses for this model use a willingness to pay threshold of $50,000. Unlike the previous models, this model was not as robust. Figure 3.20 illustrates that when the likelihood of spontaneous labor is higher than expected, induction of labor remains cost-effective only if the probability of cesarean delivery with an induction is the same as the likelihood of cesarean delivery with expectant management (relative risk of cesarean delivery with induction of 1
).
Figure 3.16. Net monetary benefit (willingness to pay=50000) sensitivity
igure 3.17 illustrates the effect of varying the relative risk of cesarean delivery and the add on,
l
is
Figure 3.17. New monetary benefit (willingness to pay=50000) sensitivity
analysis on relative risk of cesarean delivery IOL at 39 weeks and probability of spontaneous labor at 39 weeks
Fitional cost of labor induction. In women with the lowest likelihood of successful inducti
additional costs may be incurred as the induction process may be prolonged. As demonstrated, ifan induction of labor costs an additiona$2000, theninduction of labor is cost-effective only if therelative riskof cesarean delivery with an inductionless than one.
analysis on relative risk of cesarean delivery IOL and additional cost of labor induction
123

Examining this from a different perspective, the additional cost of induction of labor may be varied with the likelihood of spontaneous labor in the next week, as seen in Figure 3.18. If the probability of spontaneous labor in the next week is low, then an induction of labor is cost-effective even at a higher additional cost.
Figure 3.18. Net monetary benefit (willingness to pay = 50000) sensitivity analysis on probability of spontaneous labor and additional cost of labor induction
Monte Carlo simulation. Multivariate sensitivity analysis, or Monte Carlo simulation, was performed to test the robustness to simultaneous changes in multiple input variables. In 29.5 percent of the trials, induction of labor at 39 weeks was the dominant strategy (less expensive and more effective). In 25.7 percent of trials it was more effective but more costly, and in 44.8 percent of the trials it was dominated (less effective and more costly). Figure 3.19 shows the distribution of incremental costs and effectiveness for induction of labor as compared to expectant management at 39 weeks. Each trial is represented by a different dot. The 95 percent confidence interval is shown by the elliptical line (i.e. 95 percent of all trials fall within this boundary).
Figure 3.19. Cost-effectiveness induction of labor at 39 weeks versus expectant management until 40 weeks
124

Figure 3.20 is the acceptability curve, which demonstrates the proportion of all trials in
which each strategy is cost-effective at various willingness-to-pay thresholds. Using a willingness-to-pay threshold of $100,000, induction of labor at 39 weeks is cost-effective in 52.5 percent of the trials. At a willingness to pay of $50,000, it is cost-effective in 49.5 percent of trials. As induction of labor is dominated by expectant management in 44.8 percent of trials, we can never be greater than 55.2 percent confident that induction of labor is cost-effective at any willingness to pay threshold.
Figure 3.20. Acceptability curve
In summary, our cost-effectiveness analysis suggests that elective induction of labor at 41 weeks improves maternal and fetal outcomes and is cost effective. Our analyses also suggest that elective induction of labor prior to 41 weeks may improve outcomes and could reach conventional thresholds for cost effectiveness. However, there is additional uncertainty about outcomes prior for elective induction prior to 41 weeks because less evidence is available. All of our model-based analyses should be considered exploratory and hypothesis generating, rather than definitive, because the strength of evidence for model inputs is generally low.
125

126

Chapter 4. Discussion
Overall, we found consistent evidence from the randomized controlled trials included in our analysis that elective induction of labor led to either no difference or a slightly decreased rate of cesarean delivery at 41 weeks of gestation; there was minimal evidence to suggest that elective induction of labor at this gestational age would lead to an increase in the rate of cesarean delivery. Further, the studies did not generally find an increase in either maternal or neonatal complications in the setting of elective induction of labor at 41 weeks of gestation and potentially a decrease in the presence of meconium. Unfortunately, there was insufficient evidence to examine outcomes prior to 41 weeks of gestation. In our decision and cost-effectiveness analyses, elective induction of labor was associated with improved maternal and neonatal outcomes and to be a cost-effective alternative to expectant management of pregnancy.
The quantity of evidence from RCTs for Key Questions 1 and 2 was somewhat limited. However, there was an overall slight increase in the odds of cesarean delivery with expectant management (OR 1.22; 95 percent CI 1.07–1.39) compared to elective induction of labor. Interestingly, in a stratified analysis of U.S. and non-U.S. studies, there was little difference between elective induction of labor and expectant management of pregnancy in studies conducted in the U.S.; however, there was a consistent increase in cesarean delivery with expectant management of pregnancy in the studies conducted outside of the U.S. (Figure 2.8). The majority of prospective studies examined women at 41 weeks of gestation. When we stratified to studies that examined women prior to 41 weeks of gestation, we did not find a statistically significant difference in the effect on cesarean delivery. The quality of the evidence examining the Key Questions ranged from insufficient to moderate, with much more of the former than the latter. Further, the applicability to Key Questions 1 and 2, in particular, was poor to fair for many of them except for the more recently conducted randomized trials from the U.S.
These findings are generally consistent with existing meta-analyses which include studies of induction of labor as compared to expectant management of pregnancy.90, 91 In the study by Sanchez-Ramos et al., a meta-analysis of postterm pregnancy that included women at 41 and 42 weeks gestation, there was a reduction in the rate of cesarean delivery in women who were induced (OR 0.88; 95 percent CI 0.78 – 0.99) as compared to those women who underwent expectant management.90 In a recent Cochrane review which stratified groups by gestational age, there was a non-significant decrease in the rate of cesarean delivery in women who underwent induction of labor (OR 0.92; 95 percent CI 0.76 – 1.12).91 Interestingly, in the group of studies of women less than 41 weeks gestation, there was a reduction in the rate of cesarean delivery in the elective induction group (OR 0.58; 95 percent CI 0.34-0.99). This statistically significant finding was, in large part, due to a study reported in French (which the current report excluded due to the inclusion criteria of only studies published in English language) of over 700 women published in 1982. Using a 2:1 randomization scheme in favor of elective induction of labor, this study randomized women at 37-39 weeks of gestation. In women who were induced, 19/481 (4 percent) women were delivered via cesarean versus 16/235 (7 percent) of the women with expectant management. While the reduction in cesarean delivery is promising, it is difficult to
127

1
generalize these study findings to current obstetric practice since this was a study conducted more than 25 years ago in a different clinical setting as compared to the current practice environment in the United States; particularly, it was during a time period when the cesarean delivery rate during labor was 3 to 5 times lower than it is today.
The evidence from cohort and case-control studies is mixed, though generally, these observational studies either support that elective induction of labor is associated with an increase in cesarean delivery or show no difference in risk. Because of the heterogeneity in these studies, we were unable to perform a formal synthesis of the data. However, the majority of these studies utilized a control group consisting of women in spontaneous labor as opposed to expectant management of pregnancy. In the single observational study which utilizes an expectantly managed group of women as the control group,31 the authors reported an increase in cesarean delivery in those managed expectantly. The conflicts in study results between these studies as well as the differences in study design (observational studies and RCTs) will be discussed in detail below.
Importance of Methodologic Differences Between Interventional and Observational Studies
The effect of the study design differences on the reported cesarean delivery rate as
well as other perinatal outcomes observed between RCTs versus cohort and case-control studies must be addressed. A similar effect was observed in a meta-analysis of induction of labor in the setting of presumed macrosomia by Sanchez-Ramos in 2002 that reported a larger increase in the effect of induction of labor on cesarean delivery seen in the observational studies.144 As previously discussed, this difference may be due to both measurable and residual confounding bias, even after attempts are made to control for confounding using multivariable regression techniques. However, it is likely that the study designs of traditional cohort and case-control studies which compare women undergoing induction of labor to those with spontaneous labor simply do not provide useful information on either mode of delivery or perinatal outcomes. Unfortunately, this flawed information may be used to facilitate informed clinical decision making or establish practice guidelines and policies. Such a comparison of induction versus spontaneous labor is impossible for clinicians and their patients to make in the clinical setting as they are faced with the decision of either employing induction of labor or continuing expectant management of the pregnancy, not spontaneous labor. Again, expectant management leads to either spontaneous labor or induction of labor at a later gestational age.
This is not to suggest that the results from randomized trials are infallible. Interestingly, three of the reports we excluded from our meta-analysis of induction of
Appendixes and evidence tables for this report are provided electronically at http://www.ahrq.gov/clinic/epcindes.htm.
128

labor versus expectant management of the pregnancy were RCTs. These studies randomized women to induction of labor versus expectant management of pregnancy.63,
66, 145 However, in the analysis of the data, the authors either excluded those patients who ended up needing to be induced from the expectant management arm63, 66 or incorrectly allocated those women with inductions into the induction arm.145 It is particularly problematic to combine women who were induced for either abnormal antenatal testing or postterm pregnancy with those undergoing elective labor induction as each of the above factors are known to be associated with increased risk of cesarean delivery. Analyzing the data in this fashion would distort the appropriate study design since one goal of elective induction of labor is to avoid an indicated induction of labor.
As an example, we present the specifics from one of these studies.66 At the 38th week, all patients were admitted into the trial and examined. After exclusions, there were 230 women with a normal obstetrical history enrolled - 106 in the planned induction (treatment) group and 124 in the expectant management (control) group. The authors excluded 32 women from the control group secondary to either an obstetric complication necessitating induction or failure to begin spontaneous labor prior to 42 weeks gestation such that a postterm induction of labor was required, leaving 92 women who entered labor spontaneously. Thus, of 124 women randomized to the control group, 32 (26 percent) ultimately required induction of labor for either the development of an obstetric abnormality (e.g. preeclampsia, oligohydramnios, abnormal antenatal testing) or postterm pregnancy.
While RCTs are the best way to address the study questions, observational studies can be utilized to examine these question as well. If women who are induced at one gestational age are compared to all women who progress beyond that specific gestational age who then experience either spontaneous labor or induced labor, then this design scheme creates similar comparison groups as those seen in a well designed RCT. Among the observational studies we identified, one study attempted to utilize this designation of comparison groups.31; this was a retrospective cohort study conducted in Hungary based on the care of a single group of obstetricians was published in 1986. The authors compared women who were electively induced to those who had not been electively induced and either went into spontaneous labor or were induced postterm at 42 weeks of gestation. They reported a cesarean delivery rate of 1 percent in the women who were electively induced, as oppose to a 6.7 percent risk of cesarean in those who were expectantly managed. Additionally, they reported better neonatal outcomes in the induction group, with lower rates of Apgar score of 7 or less (3.7 percent versus 17.6 percent), neonatal morbidity (3.4 percent versus 7.0 percent), and neonatal mortality (0.5 percent versus 1.7 percent). However, while this study is supportive of elective induction of labor, it is likely profoundly confounded by both cervical status (women were only induced if they had a favorable cervix) and parity.
Recently, an observational study utilizing a study design which compared induction of labor to expectant management of pregnancy demonstrated how such design issues affect the findings by gestational age.3 In this study, when the authors used the traditional comparison between induction of labor and spontaneous labor, induction of labor was associated with an increased risk of cesarean delivery. However, when they compared women who were induced at a specific gestational age to those undergoing expectant management of pregnancy (i.e., women who either went into spontaneous labor or were
129

induced beyond that particular gestational age), the authors reported a decreased risk of cesarean delivery in the women who were induced. Preventive Induction of Labor
Another series of studies that have utilized the retrospective cohort or case-control study designs which have captured the essence of comparing elective induction of labor versus expectant management are the studies by Nicholson et al.146, 147 These studies examine the use of preventive induction of labor known as active management of risk in pregnancy at term (AMOR-IPAT). This clinical management strategy is designed to identify women who are at an increased risk for a cesarean delivery during labor from either fetal intolerance of labor due to placental insufficiency or failure to progress in labor from cephalo-pelvic disproportion.146 The authors have identified a series of risk factors for each of the indications for cesarean delivery (Table 4.1) and assigned these risks a number of days which are used to determine the upper limit of the optimal time of delivery (UL-OTD).148 The associated days from these risk factors are summed and the total number is subtracted from 41 weeks of gestation. The patient is then induced at the resultant gestational age, but never prior to 38 weeks of gestation.
There are two studies assessing the effects of this strategy in two different populations using a retrospective, observational study design. In the first study, a retrospective case-control study of AMOR-IPAT, 100 women who were exposed to this preventive induction strategy had labor induction 63 percent of the time and a 4 percent cesarean delivery rate as compared to 300 women receiving standard care which led to a lower rate of labor induction (26 percent) but a 17 percent cesarean delivery rate (P=0.01).146 In the second study, a retrospective cohort study, the 794 women who were exposed to AMOR-IPAT, had a higher induction rate (31 percent versus 20 percent respectively, P<0.001) and lower cesarean delivery rate (5 percent versus 12 percent respectively, P<0.001) as compared to the 1,075 women in the standard care group.147 Further, each of these studies demonstrated an improvement in a number of perinatal outcomes in the preventive induction of labor groups. These included thick meconium, NICU admissions, macrosomia, postpartum hemorrhage, and third- or fourth-degree perineal lacerations, without an increase in other maternal or neonatal complications.
Table 4.1. Upper Limit of Optimal Time of Delivery Calculation Table146 Odds ratio Time units Utero-placental factors History of chronic hypertension Gestational diabetes Diabetes mellitus Sickle cell trait Elevated MSAFP Cigarette use Size < dates (<3 cm) Maternal age > 35 Anemia (Hgb < 10)
1.8 2.0 2.4 1.5 1.4 1.3 1.6 1.8 1.6
6 days 7 days
10 days 3 days 3 days 2 days 4 days 6 days 4 days
Cephalopelvic factors Elevated BMI (>30) Short stature (<62 inches)
1.3 1.8
2 days 6 days
130

Excess weight gain (>30 pounds) Size > dates (>3 cm) Gestational diabetes Diabetes mellitus History vacuum/forceps Prior birthweight >4,000 gms
1.8 1.7 1.8 2.4 2.2 2.0
6 days 4 days 6 days
10 days 9 days 7 days
Note: Hgb=hemoglobin; BMI=body mass index; MSAFP=maternal serum alpha fetoprotein There are obvious limitations to each of these studies. It is difficult to study process
of care in a retrospective study. There are numerous potential confounding factors that may not be recognized or measured, thus resulting in residual confounding even after many of these differences between the populations have been accounted for by statistical techniques. For example, providers caring for the women using the preventive strategy may have been more motivated to achieve vaginal birth, leading to a higher level of patience in managing their patients’ respective labor and delivery. Some of the potential confounding factors may be addressed by utilizing a prospective randomized controlled study design. In a pilot study which randomized women to AMOR-IPAT and standard care, the cesarean delivery rate was 10 percent in women managed with the AMOR-IPAT and 15 percent in women managed with standard care.149 While this difference was not statistically different, it does represent a 33 percent reduction in cesarean delivery in a modern obstetric setting.
Predictors of Mode of Delivery in the Setting of Induction
Our initial goal was to examine a variety of predictors of cesarean delivery in the
setting of elective induction of labor. However, given the limitations of the included studies we were unable to perform the planned analysis. Thus we expanded our inclusion criteria to studies of women with any induction of labor as secondary levels of evidence, though we strictly excluded studies in which women were all postterm. Despite expanding our search beyond elective induction of labor, we still had difficulty in identifying a wide body of literature on this topic. As noted in Figure 2.23, the majority of items we identified as potential predictors were not examined in most of the studies we included in this review.
Of the factors characterized as predictors of success in the setting of induction of labor, two were clearly supported by evidence. Multiparity was associated with a lower cesarean delivery rate after induction of labor, thus a higher success rate using the measure of any vaginal delivery. Similarly, a “favorable” cervix examination, as measured by Bishop score or cervical length and dilation, was also associated with a lower rate of cesarean delivery. These findings are not surprising. Certainly, multiparity and cervical status are commonly cited throughout obstetrical textbooks and review papers as important factors in predicting success in the setting of a trial of labor.150 However, it is important to consider how these two factors are regarded in the setting of determining who may benefit from induction of labor. Since a cesarean delivery resulting from an induction of labor is considered a failure and is also associated with many of the maternal complications of labor and delivery, one may minimize this risk by electively inducing only multiparous women or those who have a favorable cervical status.
131

However, the anticipated risk reduction may not be realized for the reasons we discuss below.
The Bishop score was initially used to predict who would go into labor within the following week and only later modified to predict labor induction success.151 Given that one of the benefits from elective induction of labor is to deliver the baby before any complications develop, women with a favorable Bishop score would then be the least likely to benefit from such an intervention. One may consider the question of induction of labor in terms of number needed to treat (NNT) and number needed to harm (NNH), stratified by Bishop score. When considering the number needed to harm, if we acknowledge the prevailing view that induction of labor increases the risk of cesarean delivery, then it follows that the number needed to harm is higher for women with a favorable Bishop score. Thus, inducing these women seems more reasonable. However, given that the findings from this review as well as the recent Cochrane review91 actually demonstrate a decrease in cesarean delivery in women who are electively induced, the opposite effect holds. The number needed to treat to achieve a benefit of lower cesarean delivery or lower neonatal complications would actually be lower in women who have an unfavorable cervix. This reduction stems from the lower baseline cesarean delivery rate in women with a favorable cervix, and also because the principle mechanism through which an elective induction of labor offers benefit is prevention of subsequent complications. Women with a favorable Bishop score are those destined for spontaneous labor shortly, and they have less preventive benefit potential than those with an unfavorable cervix.
Similarly for multiparous women, conventional wisdom in obstetrics has held that these women are less likely to be harmed from an elective induction. However, since the benefit of elective induction of labor is to those women who will not go into labor in the near future, these women are actually less likely to benefit from an elective induction. Interestingly, in a recent retrospective cohort study which used a study design to capture the control group of expectant management, a stratified analysis by parity was conducted.3 In nulliparous women, a decrease in cesarean delivery associated with induction of labor was illustrated. However, in multiparous women, there was either no difference or an increase in rate of cesarean delivery in women induced at 40 weeks of gestation as compared to those undergoing expectant management. Thus, the existing evidence would not support the conventional wisdom that multiparous women benefit most from elective induction of labor. We make recommendations on how studies might address the issues of parity and cervical status in the following section on future research.
Other predictors of a successful induction of labor were reported by few studies that were heterogeneous, and therefore no synthesis was performed. Several potential predictors are notable, including gestational age at delivery, maternal age at delivery, obesity, and amniotic fluid index, and are discussed below. Gestational Age at Delivery
In the four cohort studies that examined gestational age at delivery, a greater gestational age at delivery was associated with a higher failure rate. Biologic plausibility exists for this observation. Once labor is achieved, there are fundamentally two reasons for a cesarean delivery: Fetal intolerance of labor and cephalo-pelvic disproportion. Since the placental function in term pregnancies appears to undergo functional decline with increasing gestation,
132

fetal intolerance of labor would then likely increase with gestational age. Similarly, the fetus continues to grow as gestation progresses, subsequently increasing the probability of cephalo-pelvic disproportion with gestational age. These findings have been demonstrated in term pregnancies in a cohort of laboring women.130 Maternal Age
We found two retrospective cohort studies of maternal age and success of labor induction in our search of the published literature. The authors of the larger study reported an increase in cesarean delivery in women over the age of 35 as compared to women younger than 35. This finding mirrors the prevailing tenet in the overall literature regarding maternal age and the risk of cesarean delivery. This may reflect true biological differences seen between younger and older women. For instance, older women are more likely to experience complications of pregnancy such as preeclampsia and gestational diabetes. In addition, it appears that they also have longer labors. In a recent study in which maternal age was characterized by five-year subgroups, increasing maternal age was associated with longer length of labor.120 Perhaps, older women have a dysfunctional myometrium leading to higher likelihood of failure in labor. Alternatively, it may be that older women are being held to labor standards based on younger women and thus prematurely diagnosed with active phase arrest. Obesity
There are several studies which have examined the association of body-mass index (BMI) and cesarean delivery in the setting of induction of labor. When maternal BMI was dichotomized at 30kg/m2, the authors found that those women with a higher BMI had higher rates of cesarean delivery in the setting of induction of labor. Again, this finding is consistent with the overall literature examining BMI and mode of delivery. The presumed biologic plausibility behind such an association includes higher rates of pregnancy-related complications such as preeclampsia, gestational diabetes mellitus, and increased birthweight. These factors are associated with maternal obesity leading to higher rates of cephalo-pelvic disproportion and cesarean deliveries.12, 118, 152
Diagnostic Bias with Identifying Predictors of a Successful Induction of Labor
One challenge not previously discussed when assessing predictors of a successful
induction of labor is diagnostic bias. Clinicians are not blinded to their patient’s clinical history and physical characteristics. Based on their clinical intuition, they may believe that an individual patient is more or less likely to achieve vaginal delivery. A multipara with a favorable cervical status is likely to be perceived as having low-risk of cesarean delivery. Increasing maternal age and gestational age may both be perceived as increasing the chance of fetal intolerance of labor and fetal size, and thus increasing the risk of cesarean delivery. Obesity is typically perceived as being associated with increased fetal size, and decreased amniotic fluid with higher rates of fetal intolerance of labor and subsequent cesarean delivery.
Most clinicians utilize these perceptions to adjust the a priori risk of cesarean delivery. Unfortunately, most individuals are exceptionally poor at such adjustments.153
133

Such modifications to a priori risk are known as Bayesian updating, in which one considers the joint probability of two events, in this case, induction of labor and cesarean delivery, occurring together. Some adjustment on the relationship is then performed to provide an updated, posterior estimate of a prior probability. Further, even if adjusted accurately, the overall sense of a patient with an increased risk of a failed induction leads to increased pessimism regarding her chances. Since clinicians make the diagnosis of an indication for the cesarean (e.g., fetal intolerance of labor, active phase arrest, cephalo-pelvic disproportion), clinicians may be more likely to make these diagnoses in women whom they believe are more likely to fail during their induction of labor. This introduces diagnostic bias that tends to bias results away from the null. Thus, if these factors are associated with increases in cesarean delivery, such diagnostic bias would only amplify these findings, making the difference in risk appear larger than the truth. Such findings, in turn, may become accepted into the understanding and practice of obstetrics, further biasing clinicians in a cyclic fashion.
How Successful Induction of Labor was Defined
Since the purpose of induction of labor is to cause a non-laboring woman to go into labor, a reasonable working definition is achieving active labor as a measure of success. However, of the 80 studies included, only one of the studies utilized this definition. The most commonly utilized method of defining successful induction in our included studies was achieving any vaginal delivery [46/80 (58.5 percent) of studies]. Considering the effects of elective induction of labor, this metric is a reasonable way to examine the effect of induction of labor. If induction of labor leads to achieving active phase of labor in all attempts, yet eventually leads to a higher rate of cesarean delivery, the downstream effects of induction need to be considered. However, one problem with utilizing cesarean delivery as a metric is the wide variation in physician practice and the potential bias introduced by a physician’s beliefs about the effect of induction of labor on cesarean delivery and other perinatal outcomes. One way to minimize such bias is by examining the indication for cesarean delivery, which was done in the largest study we reviewed.27 However, even the indication for cesarean delivery is subject to physician influence, as some clinicians may define indications for cesarean delivery, such as active phase arrest, cephalo-pelvic disproportion, and fetal intolerance of labor, differently based on whether the patient was being induced or in spontaneous labor.
Several studies used a variety of time-based definitions of a successful induction: Vaginal delivery within 6, 12, 18, or 24 hours or active labor within 12 hours. These definitions are particularly applicable when considering the cost-effectiveness of elective labor induction. Labor and delivery units are nearly as costly to function as intensive care units. A considerable portion of the high cost is attributed to the high ratio of nurses to patients as well as to the use of costly supplies. When considering a policy of offering or recommending elective induction of labor from a societal standpoint, consideration must be given to the amount of additional time such women will be required to spend on the labor and delivery unit compared to those who undergo spontaneous labor. If this amount of time equals 12-24 additional hours and 25 percent of women are induced, the societal cost may be in the billions of dollars annually.
134

Another important aspect of the time-based definition of induction of labor is how it influences the culture of both providers and patients when considering what is defined as a “successful” induction of labor. For instance, if achieving active labor within 12 hours is the threshold for a successful induction, and those who do not achieve this are considered failures, might these perceived failures be more likely to proceed with a cesarean delivery? In a small study of the predictive value of the amount of time spent in the latent phase subsequent to cesarean delivery, Simon and Grobman demonstrated that women who progressed into active labor within 12 hours had a 67 percent to 86 percent chance of achieving vaginal birth, whereas women who reached active labor after 18 hours proceeded to a vaginal birth only 31 percent to 33 percent of the time.10 However, this brings two considerations to light. First, women who reached the active phase of labor later may have been perceived as failures, and thus their clinicians may have been more likely to proceed to a cesarean delivery. Second, if a third of the women whose latent phase of labor extended beyond 24 hours were still able to achieve vaginal delivery, is there harm in continuing the labor in this setting? These investigators examined some of the associated outcomes with prolonged latent phase of labor, but were underpowered to make consistent conclusions regarding the potential risks.
In summary, it appears that each of these measures, achieving active labor, mode of delivery, and length of time to achieve each of these outcomes, have validity as metrics. Thus, future studies should attempt to capture all of them.
Decision Analytic Outcomes
In our exploratory models among theoretical cohorts of nulliparous women at 39, 40 or 41 weeks gestation, induction of labor was cost effective and led to improved maternal and neonatal outcomes compared to expectant management of pregnancy. These findings were extremely robust at 41 weeks of gestation. However, at 40 and 39 weeks of gestation, while the baseline model was cost-effective, but the findings did not stand up to multivariate sensitivity analyses. The improvement in neonatal outcomes is expected, as the outcomes examined (intrauterine fetal demise, macrosomia, shoulder dystocia, meconium stained amniotic fluid, meconium aspiration syndrome) are all known to increase with gestational age.87, 98 In our models, we found that 96 percent of the benefit in the cost-effectiveness analysis was from reduced IUFD. Since induction of labor at term will always lead to a lower gestational age at delivery, this option will necessarily lead to reductions in these outcomes. Furthermore, when considering maternal outcomes, if a woman undergoes induction of labor, she is no longer at risk for the pregnancy complications associated with continuing gestation, such as preeclampsia. Therefore, these complications will also be reduced. In addition, those maternal outcomes that are dependent on changes in fetal status, such as the increased risk of severe perineal laceration associated with delivery at a later gestation, will also necessarily decrease with a policy of induction of labor. These changes in outcomes are both intuitive and clinically relevant to comparing induction of labor to expectant management of pregnancy.
Acknowledging that these clinical outcomes are virtually all improved with a policy of induction of labor, the most easily calculable potential disadvantage of induction (and the theoretical concern that is most often stated by opponents of labor induction) is an
135

increased risk of cesarean delivery, and an increase in costs associated with induction of labor. Review of the literature for this project and other existing meta-analyses90, 91 indicate that induction of labor may be associated with a decreased risk of cesarean delivery. Depending on the reduction of risk associated with induction, the cost effectiveness of this intervention increases. Importantly, though, even if this assumption is reversed, and induction of labor is assumed to lead to a 22 percent increase in risk of cesarean delivery, induction remains a cost-effective intervention at $27,021 per QALY when examining the 41 week cohort, $27,397 per QALY when examining the 40 week cohort, and $71,945 when examining the 39 week cohort. Of note, induction of labor is not cost-effective when it leads to more than a 50 percent increase in cesarean delivery at 41 weeks, more than a 40 percent increase in cesarean delivery at 40 weeks, and more than a 25 percent increase in cesarean delivery at 39 weeks of gestation. Biologically, we do not believe that induction of labor should lead to such increases in cesarean delivery based on the current review; however, it is difficult to determine from this review how induction of labor will truly affect cesarean delivery rates in actuality given the other pressures on clinicians to perform a cesarean delivery such as scheduling of outpatient clinical time and medical-legal considerations related to labor and delivery management. Further, we did not consider downstream effects on future pregnancies. If induction of labor leads to higher rates of cesarean, future pregnancy outcomes would be worsened as well.
Univariate sensitivity analysis revealed that both the 40 and 41 week models were robust, remaining cost-effective over a wide variation in individual inputs, while the 39 week model was more sensitive, particularly to the risk of cesarean delivery, as discussed above. However, as noted above, the 40 week model was less robust when multivariate sensitivity analysis was conducted, underscoring the importance of conducting such analyses. Most interesting were the situations in which induction became the dominant strategy; this occurred only in the 40 and 41 week models. In the 41 week model, this occurred when the rate of cesarean delivery in the induction group was less than 70 percent of the rate in the expectant management group or when the likelihood of spontaneous labor at 41 weeks dropped below 25 percent. In the 40 week model, this occurred when the rate of cesarean delivery in the induction group was less than 82 percent of the rate in the expectant management group or when the likelihood of spontaneous labor dropped below 20 percent. These characteristics help define two different populations that may benefit from induction of labor. The first is those women who are “easy” to induce, incur very little risk of cesarean delivery with induction, and gain the benefits of delivery at an earlier gestational age. The second is a group with the least likelihood of spontaneous labor in the following week benefiting the most from induction of labor, as without induction, they are highly likely to remain pregnant and thus potentially incur the negative outcomes associated with advancing gestational age.
Theoretically, those with the lowest likelihood of spontaneous labor might have an increased risk of failed induction of labor or require additional resources for induction of labor, as characteristics such as multiparity and a favorable Bishop’s score have been associated with successful induction as well as spontaneous labor. This relationship was further explored in bivariate sensitivity analysis first examining the effect of varying the relative risk of cesarean delivery with induction and the probability of spontaneous labor, and then the cost of induction of labor and the likelihood of spontaneous labor. For both
136

the 40 and 41 week cohorts, induction was still cost-effective for the population of women with the higher than average likelihood of spontaneous labor as long as the relative risk of cesarean delivery remained close to 1, but the absolute likelihood of spontaneous labor at an earlier gestational age had to be lower in order to maintain the same threshold of cost effectiveness.
Conceptually, the issue of women who have the lowest chance of going into labor in the following week potentially reaping the greatest benefits of induction of labor has not been particularly well explored in the literature. Generally, cohort studies of elective induction of labor have been of women who have favorable cervices31 because it is presumed that the increase in cesarean delivery will be the least in these women. Further, randomized trials of elective induction of labor at 41 weeks and earlier often include only women who have an unfavorable cervix because of the assumption that elective induction of labor is reasonable in those with a favorable cervix.27, 74 However, because ongoing risk leads to higher rates of complications in the expectant management group, those women at the lowest risk of going into spontaneous labor in the following week are those who theoretically may benefit the most from induction of labor; women with unfavorable cervices or those who are at increased risk of progressing to a postterm pregnancy, such as nulliparas or obese women.154
Extending these concepts to the 39 week cohort is dependent on the comparison strategy chosen. While induction remains a cost effective strategy in many scenarios, if the alternative strategy is induction of labor at 40 weeks, then variation in the cesarean delivery rate, cost of induction, and probability of spontaneous labor all impact cost-effectiveness. The complications of term and post-term pregnancy are increasing at this point, but the slope is not as steep as it is from 40 weeks and beyond; thus, induction at 40 weeks becomes the more cost-effective option in some scenarios. Again, this highlights the idea that the women who are at greatest risk of postterm pregnancy are the ones that will benefit most from induction; the challenge is how to identify this cohort at 39 weeks.
One methodologic issue of decision and cost-effectiveness analysis that we explored deserves mention. It is unclear in models of pregnant women whether and how to include the utilities related to the neonate.155 In general, decision-analytic models have not utilized preferences of family members (e.g., partners, parents, siblings, or children), though the utilities of these individuals would certainly be affected by changes in the health status to the individual being studied. Thus, one way to design these models would be to simply consider the utilities of the pregnant woman herself. However, because the decisions being made directly affect the neonatal outcomes as well, we believe that preferences related to the neonate should be directly included in the decision and cost-effectiveness models in such cases.156 In our baseline analysis, we incorporated both maternal and neonatal QALYs. However, to investigate the effect of such inclusion, we also conducted analyses excluding the neonatal valuations. In the 39, 40 and 41 week models, the inclusion of neonatal QALYs is necessary to make the model cost effective as compared to expectant management. In fact, with the utility estimates that we were able to incorporate, avoidance of intrauterine fetal demise by delivery at an earlier gestational age drives the results of the model. Future decision analytic and cost-effectiveness analyses should consider the effects of both maternal and neonatal QALYs as well as how the model is affected by excluding neonatal QALYs. To be clear, the
137

largest driver of QALYs in our model were the loss of both maternal and neonatal utilities from IUFD.
Costs were another area of exploration in our sensitivity analysis to which the cost-effectiveness of the model had some variation. Examining the impact of cost, at 41 weeks, if the likelihood of spontaneous labor is low, even if the additional cost of induction of labor increased to 400 percent of baseline, induction remained a cost-effective intervention. The 40 week model was more sensitive to the cost of induction of labor, although still cost effective up to 200 percent of the baseline cost estimate for those with the lowest likelihood of spontaneous labor. This trend continued in the 39 week model, taking into account a lower baseline spontaneous labor rate. At all gestational ages, this defines the population of people with the lowest likelihood of spontaneous labor as the ones most likely to benefit from induction of labor, even if additional cost is incurred during induction.
We believe that the utilization of decision analysis to characterize the expected outcomes in a population of pregnant women who would undergo either induction of labor or expectant management of the pregnancy at or beyond a particular gestational age enhances this literature review of elective induction of labor. Acknowledging that no model is able to fully capture the complexity of a clinical situation, or include all of the factors that a clinician integrates, decision analysis provides another perspective on the limited information currently available regarding elective induction of labor.
Elective Induction of Labor—From Evidence to Actual Practice
While elective induction of labor seems like a promising intervention to
simultaneously reduce the cesarean delivery rate as well as prevent a variety of term complications of pregnancy, there are a number of practical considerations which must be addressed. First, generalization from the existing evidence to clinical practice today is problematic. While the cesarean delivery rates in many investigations summarized in this review range from 10 to 20 percent, the rate of cesarean delivery in the setting of induction of labor in the U.S. in 2003 at 41 weeks of gestation was 27 percent. In fact, the overall cesarean delivery rate in the U.S. has risen from 5.5 percent in 1970 to reach its highest level yet in 2006 of 31.1 percent,82, 157, 158 despite a goal for the primary cesarean delivery rate from Healthy People 2010 of 15 percent.159 Why is the cesarean rate increasing? One possible reason for the rise in the cesarean delivery rate is that there may be a rise in the need for cesarean. Two possible mechanisms that may contribute to the increasing need for indicated cesarean are increasing birthweight160 and increasing maternal obesity and weight gain.118, 152, 161 Another possible reason may be a rise in elective cesarean delivery by maternal request (CDMR).162 The topic of CDMR is currently of heightened interest leading to a recent NIH State-of-the-Science conference in March, 2006. The statement from this meeting concluded that future research was necessary to examine both the “current extent of CDMR and attitudes about it.”163 Another potential mechanism contributing to an increasing rate of cesarean delivery are the incentives that providers face. As noted in the introduction, these incentives are not simply reimbursement. Specifically, the time costs that providers in private practice face when deciding to proceed with expectant management of a labor in progress versus
138

proceeding with a cesarean delivery are high; it takes less time to perform a cesarean delivery now as compared to expectantly managing a dysfunctional labor. This is likely to vary based on practice setting. For example, in a practice setting which incorporates the use of laborists, practitioners dedicated to care in the labor and delivery unit (similar to hospitalists in internal medicine), being patient during an induction of labor has far less economic or time pressure on the practitioner. Alternatively, for clinicians who are charged with both in house obstetric care and simultaneously are providing care in the outpatient setting, there are both economic and time pressures to minimize the length of labor whether through augmentation or, in some cases, cesarean delivery. Further, there are additional medical-legal pressures, particularly in states without “pain and suffering” caps where recent settlements of greater than $20 million have been awarded. A clinician deciding to proceed with a labor that has veered ever so slightly from what is perceived as normal may believe he or she is at risk for liability.164
These incentives may lead to decreased patience on the part of providers. Such patience is essential if a goal of reducing the cesarean delivery rate is considered important. For example, a common indication for cesarean delivery is active phase arrest, which is frequently defined as absence of cervical change for two hours in the active phase of labor in the presence of adequate uterine contraction. Rouse et al. reported a prospective cohort study in which clinicians waited for an additional two hours after the diagnosis of active phase arrest, and 60 percent of these women initially diagnosed with active phase arrest went on to achieve vaginal delivery.165, 166 Myers et al validated these findings, but found a reduced success in the setting of induction of labor.167 As reported above by Simon and Grobman, if clinicians extended the definition of prolonged latent phase in the setting of induction of labor to 18 hours, one would achieve vaginal delivery in over 60 percent of women being induced; and if such a threshold was extended beyond 24 hours, another third of these women would deliver vaginally. Given that such patience may lead to lower cesarean delivery rates, changing the financial incentives to clinicians to reimburse at a higher rate for vaginal delivery is one possible solution to encourage a lower rate of cesarean deliveries.
Thus, the question of whether elective induction of labor is supported as a reasonable intervention is implicitly tied to how it will actually affect both rates of cesarean delivery and perinatal outcomes. Since many of the maternal outcomes are tied to the risk of cesarean delivery, there might be an increase in a number of patient complications if the cesarean risk actually rises. Although, in our decision-analytic model where we utilized an increase in cesarean delivery of 22 percent from induction of labor, we found that on balance, short-term maternal outcomes were similar and neonatal outcomes were better. Despite this, the long-term impact of a rising cesarean delivery rate may be revealed in subsequent pregnancies which we did not include in this model.
It is essential to determine not only how elective induction of labor will affect outcomes in the research setting, but particularly in private practice and community hospitals where the majority of women receive their care. In most of these settings, we do not currently have adequate data structures to examine the effect even in observational studies. Thus, concomitant with a large prospective RCT to examine elective induction of labor, it is important to collect specific data on elective induction of labor and the wide variety of potential confounders and perinatal outcomes at a population level. Further, the importance of exercising patience when managing labor and delivery should be
139

emphasized in the teaching of current obstetrician-gynecologists-in-training to provide a long-lasting impact on the cesarean delivery rate in the future.
Limitations of This Report
When conducting a systematic review, there are limitations based on particular MeSH terms utilized, inherent shortcomings in the existing literature, and the heterogeneity of the existing data. Cost-effectiveness analyses suffer similar data limitations and are further limited by potential design flaws. We discuss below the limitations of our systematic review and cost-effectiveness analysis. Limitations of the Review
When examining the limitations of a systematic review, consideration of the limitations of the search strategy utilized, limitations of the databases searched, and technique of data abstraction is necessary. Regarding the search strategy employed, we believe we captured a great majority of the literature on elective induction of labor. However, in recognizing the potential for missing studies, we chose ten known studies of elective induction of labor and made sure our search strategy captured all of them. Further, once the initial review was completed, we searched bibliographies of included studies for additional studies on elective induction of labor. We only searched the MEDLINE database, but with reviewing the bibliographies, we believe that we captured nearly all of the elective induction of labor literature.
One aspect of the search strategy that limited 100 percent identification of the literature of interest was exclusion of non-English language studies. As noted earlier in this report, one of the largest RCTs on induction was published in French.168 However, given time and budgetary limitations, it was not feasible to translate non-English studies. Having reviewed other related meta-analyses, we believe this is the only pertinent non-English study we did not identify in our search.
Our review and abstraction was also challenging. While we utilized dual review and resolution of disagreements, much of the older literature was difficult to interpret with respect to study design and control groups. Limitations of the Existing Evidence
The body of evidence is limited by the relative paucity of studies, the small number of well-designed studies, the number of adequately powered studies, the breadth of reported outcomes in these studies, and the analytic design. Examination of heterogeneity often revealed that the studies collected were dissimilar, thus, we could not synthesize the data into a single summary statistic. Additionally, several of the outcomes and predictors may have been subject to publication bias which is concerning for overstating our findings.
The literature identified and included in this review was distributed broadly across countries and spanning a wide time period. Cesarean delivery, as a principal outcome of interest, was a concern as cesarean delivery rates are sensitive to the cultural context and have demonstrated dramatic change over time, particularly during the last three decades. Thus, a study conducted in one decade may not necessarily inform practice in another
140

decade with respect to cesarean delivery. Further, because most of the studies did not stratify analyses or examine for interaction or effect modification, it is uncertain whether the overall effects observed apply to all subgroups of the population.
Inadequate quantity of evidence. The overall quantity of studies was somewhat limited. For the vast majority of outcomes, fewer than five studies reported data. Synthesis of the literature with few studies becomes challenging as a single study may significantly affect the overall outcomes and introduce heterogeneity. This limited the ability to perform stratified analyses or use multivariate techniques such as metaregression. In addition to the small number of studies, many of the available studies were small to medium in size, thus further limiting the overall power of the review. Finally, the breadth of reported variables of interest was quite limited. The majority of studies only report a handful of outcomes. This reduced the availability of data that was affected by the limited number of studies, further limiting the power.
Inadequate study design. As mentioned in the discussion, there were challenging issues regarding study design. While the majority of the RCTs were properly designed to compare elective induction of labor to expectant management of pregnancy, three identified studies used an incorrect analytic design: Excluding women who were induced while allocated to the expectant management arm. With the exception of one study,31 all of the cohort and case-control studies utilized an inappropriate control group, comparing elective induction of labor to spontaneous labor, rather than expectant management. However, even in this study, there was considerable risk for potential confounding, as the women who were electively induced all had favorable cervices. Other concerns with study design included a lack of careful consideration of gestational age. While the studies examining induction of labor at 41 weeks of gestation as compared to expectant management were generally specific with respect to gestational age, the studies before 41 weeks of gestation did not have specific randomization arms at 39 and 40 weeks of gestation. Thus, generalizing the information from the synthesized summary statistic to gestational ages prior to 41 weeks is not reasonable with the available data.
Inadequate adjustment for confounding. For most of the cohort and case-control studies there was inadequate adjustment for potential confounding. The majority of studies did not utilize either multivariable techniques or stratified analyses to begin to adjust for potential confounders. Unfortunately, even, in recent studies which attempted to control for bias, many studies were too small or contained too little information on particularly important known confounders to make appropriate adjustments. Finally, since several of the most important confounders, such as local practice styles, local cesarean rates, and provider characteristics were not measured in any of the studies, adjustments could not be achieved, leading to potential confounding and the diagnostic bias discussed above. Limitations of Decision Analysis
We used models to represent clinical scenarios, which can be limited in scope and miss a number of intangible factors that can be realized in a clinical study. The size of a model and incorporated outcomes depends on clinical expertise and the balance of too great a burden of detail and too little can be a challenge. While a more complex model may better approximate the true clinical picture, its complexity may obfuscate the
141

identification of what the key inputs and outcomes are in a more simplistic model. Thus, we did not include every possible maternal and neonatal outcome; rather, we incorporated a number of the more severe outcomes, specifically those that may be impacted by elective induction of labor, advancing gestational age, and mode of delivery.
Once a decision-analytic model is created, point estimates of probabilities must be identified in the existing literature in order to populate the model and allow for prediction of outcomes. We incorporated probabilities from a variety of sources for the current model, some of which may lack sufficient power to support the accuracy of the generated point estimate. However, in settings such as this, the strength of decision analysis is to consider a wide confidence interval around unsure estimates. We created univariate sensitivity analyses around every point estimate in the model and generally found our results to be robust. Further, we conducted a Monte Carlo simulation which allows for a large number of trials to be performed, each of which samples the probabilities at each probability node and then predicts which path will be taken. Such a simulation models the path of a clinical trial and provides results in a similar fashion. Such sensitivity analyses allow for extremely uncertain data to be included in the model and to allow for close and accurate examination of how poor data would impact the study conclusions.
More than just probability estimates, the utility estimates used in this model were abstracted from studies which did not directly address what these preferences represent and how they are utilized in the current model. For example, maternal preferences towards neonatal outcomes such as neonatal death, intrauterine fetal demise, and cerebral palsy, were estimated from studies by Kuppermann et al.,140 which examine outcomes such as pregnancy loss and Down syndrome. Generalization of these data is questionable and may provide bias with respect to the decision analytic and cost-effectiveness results. However, our results were robust to sensitivity analyses, and without generalization of these data, only perinatal mortality could have been addressed. It is not feasible to compare the multitude of perinatal outcomes or to characterize the quality of life issues related to these outcomes.
Finally, there are limitations in the existing cost data utilized for the cost-effectiveness analyses. Much of the data utilized is more than 10 years old. This is a concern in health economics studies since health care costs are rapidly increasing. While the medical component of the consumer price index can be used to project the older costs forward, this is a measure of overall medical cost increases rather than the how specific costs are increasing and being measured. Further, a number of the costs utilized were estimated from the existing literature and generalized for use in this study. These costs may not have been estimated based on the specific clinical situations being described in the current study. While we conducted sensitivity analyses over wide ranges of these cost inputs, better cost data in this area would certainly facilitate more accurate estimates of the cost-effectiveness of elective induction of labor.
Future Research Considerations
We order this section by Key Questions, similar to other sections in this report. Key Questions 1 and 2 are part of the same research agenda, comparing elective induction of labor to expectant management, thus the first section will discuss these two mutually.
142

Elective Induction of Labor Versus Expectant Management of Pregnancy
When addressing issues involving elective induction of labor, one must consider the intended goal. Similar to the commentary in the AHRQ report on cesarean delivery by maternal request, (CDMR) which noted that since women may go into labor and deliver via one of three modes of delivery (a spontaneous vaginal delivery, operative vaginal delivery, or cesarean delivery), one must consider planned or intended modes of delivery.107 In the setting of elective induction of labor, the comparison group, which consisted of women whose pregnancy were expectantly managed, can experience either spontaneous labor, or subsequent development of complications of pregnancy that requires induction of labor. Further, these potential outcomes (i.e., spontaneous labor, complications of pregnancy, or induction of labor) can occur at any point in the future at a wide variety of gestational ages. It was surprising that even when prospective RCTs were appropriately designed, several authors analyzed the data by comparing induction of labor to spontaneous labor rather than induction of labor to expectant management as intention to treat. In both RCTs and observational studies, strict use of the appropriate control group, women being managed expectantly, is important.
Outcomes measured. In studies of elective induction of labor compared to expectant management, the focus should be on consistently reporting a wide variety of perinatal outcomes. While we anticipated examining a wide range of outcomes, in reality we obtained information only on a few and were able to synthesize information only on a handful. With respect to mode of delivery, the outcomes, cesarean and operative vaginal delivery, were usually recorded. However, to further determine the effect of labor induction on specific modes of delivery, it would be beneficial to report the indications for both cesarean delivery and operative vaginal delivery. In particular, if a “failed induction” is the indication for cesarean delivery, it would be helpful to report the number of hours involved in the attempted labor induction, and the methods (e.g. prostaglandins, Foley bulb, oxytocin, AROM) utilized, as well as the timing of these methods relative to different phases/stages of labor. Further, since there is some evidence regarding induction and augmentation of labor and fetal position,79, 80 which, in turn, is associated with mode of delivery, fetal position should be recorded as an outcome.
Other maternal outcomes which should be routinely reported in studies of elective induction of labor include the following: Estimated blood loss, incidences of postpartum hemorrhage, blood transfusion, chorioamnionitis, endomyometritis, perineal lacerations, epidural use, length of hospital stay, as well as uncommon but severe morbidities such as pulmonary embolus, amniotic fluid embolus, hysterectomy, and mortality. Since these outcomes are both more severe and less frequent, it is difficult to garner sufficient power to evaluate in a single prospective RCT; thus larger health system or birth certificate data could include elective induction of labor, and large cohort studies could potentially accurately quantify these complications. Long term outcomes such as subsequent fertility, subsequent placentation, subsequent mode of delivery, and pelvic floor injury as represented by urinary incontinence, fecal incontinence, and pelvic organ prolapse should also be examined.
Neonatal outcomes that should be reported routinely in studies intending to examine the effects of labor induction include the following: Umbilical artery blood gases, 5-
143

minute Apgar score, particularly 5-minute Apgar less than 4, respiratory distress syndrome, transient tachypnea of the newborn, presence of meconium-stained fluid, meconium aspiration syndrome, neonatal sepsis, admission to intensive care nursery (ICN), shoulder dystocia, birth trauma including brachial plexus injury, facial nerve palsy, skull fracture, other fractures, cephalohematoma, subgaleal hemorrhage, intracranial hemorrhage, hyperbilirubinemia, birthweight, IUGR, macrosomia, hypoglycemia, polycythemia, length of stay, breastfeeding, and mortality (antepartum, intrapartum, and neonatal). Long-term outcomes such as infant and childhood outcomes of behavior and intelligence should also be assessed. Similar to maternal outcomes, due to the low incidence rate of these outcomes, even large prospective trials are not adequately powered to assess these outcomes. If properly designed and well executed, large cohort studies may potentially overcome limited power and some of the inherent flaws of observational studies, potentially offering vital information to elucidate the rate of these outcomes in association with induction of labor.
In addition to the more traditional clinical outcomes, economic and quality-of-life measures such as patient preferences or utilities should also be considered in future studies of elective induction of labor. Qualitative studies of how women perceived their birth experience in the setting of elective and indicated induction of labor, how they felt their preferences were incorporated into the decision-making process, whether they felt pressured by providers to choose one clinical path or another, how they were counseled and consented, and how their birth experience affected their perceptions of quality of life in future pregnancies all need to be conducted. Specific quantitative measures of patient quality of life would also contribute to the discussion. Both measures of pain and utility on labor and delivery as well as quality of life measures throughout the short- and long-term postpartum periods would inform the understanding of how individuals perceive this intervention. Interestingly, while elective induction of labor allows for some control as to when labor will begin, it also may take the management of early labor out of the parturient’s control. How women perceive this intervention will greatly inform the discussion regarding whether it should be routinely offered, and how it might be best conducted to optimize perinatal outcomes and maintain patient satisfaction. Specific economic measures such that micro-costing all of the labor, supplies, time costs, and overhead costs of the induction of labor experience should be examined. When determining how to use societal dollars to facilitate better health outcomes, allocation of these scarce resources cannot occur without reproducible estimates of these costs. In addition, these economic and quality of life issues should be estimated in subsequent pregnancies as these are affected by prior experiences and outcomes on labor and delivery.
The outcomes mentioned above can happen to either group of patients, but the expectant management group is at risk of developing other complications of pregnancy that occurs only in the setting of prolonging gestation. Such pregnancy complications that will arise in the expectant management group should also be recorded including: Preeclampsia, cholestasis of pregnancy, abnormal antenatal fetal testing, placenta abruption, oligohydramnios, intrauterine fetal growth restriction (IUGR), induction of labor, and intrauterine fetal death (IUFD). Knowing these specific risks of complications will further assist in the ongoing evaluation of the risks and benefits of elective induction of labor versus expectant management.
144

Studies examining this litany of outcomes would need to be adequately powered. For example, for a relatively common outcome such as cesarean delivery, if we assume a baseline rate of 20 percent, a study would need 400 women in order to have 80 percent power to identify a 50 percent difference with a two-sided alpha of 0.05 and 532 women for 90 percent power (Table 4.2). However, when examining less common outcomes, such as a rare neonatal morbidity at a prevalence of 1 percent, a study would need 9,346 women to have 80 percent power and 12,506 women to have 90 percent power.
Table 4.2. Sample size estimates for prospective trial of elective induction of labor as compared to expectant management of pregnancy
Outcome Studied (baseline risk) Total Sample Size for 80% Power
Total Sample Size for 90% Power
Cesarean Delivery, Nulliparas (20%) 400 532 Cesarean Delivery, Nulliparas (15%) 556 742 Meconium (10%) 870 1,162 Chorioamnionitis Or Cesarean Delivery, Multiparas (5%)
1,812 2,422
Neonatal Acidemia (1%) 9,346 12,506
Thus, to accomplish a well-designed, prospective RCT would likely require a multi-center approach, for example the Maternal-Fetal Medicine Units (MFMU) network, to accomplish such a large study. While one may appropriately address some of these issues using large observational data, prospective studies will need to be conducted to truly answer the causal effect of these questions. Study Design
The majority of RCTs examining induction of labor versus expectant management of pregnancy have been conducted in women who are considered postterm or at least prolonged (greater than 41 weeks of gestation).90 In our review, there were only five RCTs that compared induction of labor to expectant management at the design phase and only three that did so in the analytic phase. One of these studies168 was excluded from our analysis because the primary language of the paper was not English. However, even with its inclusion, these studies are heterogeneous with respect to study design, analytic choices, outcomes reported, and gestational age at randomization of the patients. This last issue is of paramount importance in any future study is conducted. There are two choices for the sequence of studies to be conducted. The first approach would be to conduct the studies incrementally. In this scenario, the study would preferably be an RCT of induction of labor at 40 weeks gestation as compared to expectant management, followed by an RCT at 39 weeks gestation with similar comparison groups. Alternatively, a three-armed study would be an RCT at 39 weeks gestation versus expectant management and
145

within the expectant management arm, those who achieve 40 weeks of gestation would then be subsequently randomized to induction of labor at 40 weeks of gestation versus induction at 41 weeks gestation. While the latter study is larger and more expensive than each of the single studies, it is likely less expensive overall and addresses induction at 39 versus 40 weeks as well as 40 versus 41 weeks. A subsequent study of induction of labor at 38 weeks of gestation versus expectant management would not meet standard of care issues set forth by the ACOG88 because of concerns regarding neonatal outcomes in elective inductions prior to 39 weeks. However, as more data on neonatal outcomes at 38 versus. 39 weeks of gestation are published, such a distinction may evolve. Stratified Randomization
Since nulliparous and multiparous women carry such different risks of cesarean delivery, they need to be randomized independently. In all practicality, two separate studies would be carried out. A similar concern applies to the cervical status. Because of the current dogma regarding elective induction as appropriate in women with a favorable cervix and more problematic in those with an unfavorable Bishop score, it would likely be best to randomize these women separately as well. Doing so, of course, will significantly increase the overall sample size if the analytic plan is to examine these subgroups independently. Further stratification would likely prove too onerous to accomplish. But as we begin to understand more about risk factors, such as obesity,154 for prolonged, and postterm pregnancy, these factors certainly should be considered and examined closely as potential confounders. Data Analysis
For the prospective RCTs, traditional data analysis seems adequate. Surveillance of important confounders as mentioned above, including parity, cervical status, BMI and obesity, race/ethnicity, co-morbid medical conditions and complications, is important and controlling for potential confounders with multivariable logistic regression models should be utilized. Further, stratified analyses, particular by parity and cervical status, but also by other potential confounders will aid in characterizing the effects regardless of these confounders. Also, examination for interaction and effect modification will help to determine whether there are particular subgroups that may benefit more or less from elective induction of labor.
For observational studies, these same issues regarding confounding bias and how to address such methodologic challenges using statistical techniques are even more important. More so, constructing appropriate control groups to simulate clinical scenarios such that elective induction of labor is compared to expectant management is tantamount. Utilizing the appropriate study design and data analysis will be a step towards characterizing the potential benefits or harms of elective induction of labor. Predictors of a Successful Induction of Labor
146

It is not surprising that multiparity and a favorable cervix have been examined frequently in the literature and are found to be associated with greater success in the setting of labor induction. However, there are many other factors that may be associated with a successful induction which have not been properly examined. Such factors include: Maternal demographics such age, weight, height, BMI, race/ethnicity, socioeconomic status as well as obstetric and medical history such as spontaneous or therapeutic abortion, uterine fibroids, chronic hypertension, diabetes, and preeclampsia. Further, systems and care issues such as provider characteristics, day of the week, time of day, volume of the obstetric unit, and overall cesarean delivery rate on the obstetric unit should also be examined as potentially important predictors of induction of labor success. Definitions of a Successful Induction of Labor
The definition of a successful induction of labor can alter the perception of elective induction of labor. If defined in terms of cesarean delivery, an elegant comparison of success to that of expectant management is achieved. If defined with respect to time interval required to achieve active labor, while this is a useful measure when approximating the economic impact, it certainly is unreasonable when comparing elective labor induction to expectant management since more of the women expectantly managed will experience spontaneous labor. Furthermore, the sociocultural effects of defining the success of an induction of labor by the amount of time it takes to achieve active labor or vaginal delivery should be examined as well. In settings where such time thresholds are utilized, does this lead to an increase in unnecessary cesarean deliveries simply because of a lack of patience by both the providers and patients? Comparative work examining these effects between providers and obstetric units is certainly important when attempting to create guidelines that might inform the practice of obstetrics as a whole.
Conclusions
In this systematic review and decision analysis of elective induction of labor, we found that overall elective induction of labor as compared to expectant management of the pregnancy was associated with an approximately 20 percent reduction in the rate of cesarean delivery and a 50 percent reduction in the presence of meconium in the amniotic fluid. However, the majority of these studies were just in women at or beyond 41 0/7 weeks of gestation; prior to 41 weeks of gestation, there was insufficient evidence from the review to address these outcomes. These findings are consistent with other meta-analyses of induction of labor in postterm and term pregnancies, but are contrary to many observational studies. The existing literature is not powered to examine many of the other complications of pregnancy; however it is assumed that a number of complications must be reduced by elective induction of labor, simply because pregnancy complications such as preeclampsia or IUFD can no longer occur if the pregnancy is ended by induction of labor. These findings were reflected in the results of our decision-analytic models. Further, when we incorporated costs into the models, it appears that elective induction of labor is a cost-effective intervention at 41 weeks of gestation and may potentially be so at earlier gestations. These results prior to 41 weeks of gestation require further examination in a large, prospective randomized trial before routine adoption into clinical practice.
147

Further, because of the heterogeneity in the management of labor induction, which varies widely between providers and institutions, careful examination of the impact of such policies in a wide variety of settings should be explored before elective induction of labor is routinely adopted as a potential policy to prevent complications of term pregnancies.
148

References and Included Studies 1. Bueno B, San-Frutos L, Perez-Medina T,
Barbancho C, Troyano J, Bajo J. The labor induction: integrated clinical and sonographic variables that predict the outcome. J Perinatol. Jan 2007;27(1):4-8.
2. Tan PC, Suguna S, Vallikkannu N, Hassan J.
Ultrasound and clinical predictors for Caesarean delivery after labour induction at term. Aust N Z J Obstet Gynaecol. Dec 2006;46(6):505-509.
3. Caughey AB, Nicholson JM, Cheng YW, Lyell DJ, Washington AE. Induction of labor and cesarean delivery by gestational age. Am J Obstet Gynecol. Sep 2006;195(3):700-705.
4. Edris FE, von Dadelszen P, Ainsworth LM,
Liston RM. Predictors of cesarean section following elective post-dates induction of labor in nullipara with uncomplicated singleton vertex pregnancies. Saudi Med J. Aug 2006;27(8):1167-1172.
5. Peregrine E, O'Brien P, Omar R, Jauniaux E.
Clinical and ultrasound parameters to predict the risk of cesarean delivery after induction of labor. Obstet Gynecol. Feb 2006;107(2 Pt 1):227-233.
6. Alchalabi HA, Obeidat BR, Jallad MF, Khader
YS. Induction of labor and perinatal outcome: the impact of the amniotic fluid index. Eur J Obstet Gynecol Reprod Biol. Dec 2006;129(2):124-127.
7. Nielsen PE, Howard BC, Hill CC, Larson PL,
Holland RH, Smith PN. Comparison of elective induction of labor with favorable Bishop scores versus expectant management: a randomized clinical trial. J Matern Fetal Neonatal Med. Jul 2005;18(1):59-64.
8. Gelisen O, Caliskan E, Dilbaz S, et al. Induction
of labor with three different techniques at 41 weeks of gestation or spontaneous follow-up until 42 weeks in women with definitely unfavorable cervical scores. Eur J Obstet Gynecol Reprod Biol. Jun 1 2005;120(2):164-169.
9. Glantz JC. Elective induction vs. spontaneous
labor associations and outcomes. J Reprod Med. Apr 2005;50(4):235-240.
10. Simon CE, Grobman WA. When has an
induction failed? Obstet Gynecol. Apr 2005;105(4):705-709.
11. Luthy DA, Malmgren JA, Zingheim RW.
Cesarean delivery after elective induction in nulliparous women: the physician effect. Am J Obstet Gynecol. Nov 2004;191(5):1511-1515.
12. Nuthalapaty FS, Rouse DJ, Owen J. The association of maternal weight with cesarean risk, labor duration, and cervical dilation rate during labor induction. Obstet Gynecol. Mar 2004;103(3):452-456.
13. Garite TJ, Casal D, Garcia-Alonso A, et al. Fetal
fibronectin: a new tool for the prediction of successful induction of labor. Am J Obstet Gynecol. Dec 1996;175(6):1516-1521.
14. Johnson DP, Davis NR, Brown AJ. Risk of cesarean delivery after induction at term in nulliparous women with an unfavorable cervix. Am J Obstet Gynecol. Jun 2003;188(6):1565-1569; discussion 1569-1572.
15. Heinberg EM, Wood RA, Chambers RB. Elective
induction of labor in multiparous women. Does it increase the risk of cesarean section? J Reprod Med. May 2002;47(5):399-403.
16. Gabriel R, Darnaud T, Chalot F, Gonzalez N,
Leymarie F, Quereux C. Transvaginal sonography of the uterine cervix prior to labor induction. Ultrasound Obstet Gynecol. Mar 2002;19(3):254-257.
17. Cammu H, Martens G, Ruyssinck G, Amy JJ.
Outcome after elective labor induction in nulliparous women: a matched cohort study. Am J Obstet Gynecol. Feb 2002;186(2):240-244.
18. Ecker JL, Chen KT, Cohen AP, Riley LE,
Lieberman ES. Increased risk of cesarean delivery with advancing maternal age: indications and associated factors in nulliparous women. Am J Obstet Gynecol. Oct 2001;185(4):883-887.
19. Ware V, Raynor BD. Transvaginal
ultrasonographic cervical measurement as a predictor of successful labor induction. Am J Obstet Gynecol. May 2000;182(5):1030-1032.
20. Seyb ST, Berka RJ, Socol ML, Dooley SL. Risk
of cesarean delivery with elective induction of labor at term in nulliparous women. Obstet Gynecol. Oct 1999;94(4):600-607.
21. Prysak M, Castronova FC. Elective induction
versus spontaneous labor: a case-control analysis of safety and efficacy. Obstet Gynecol. Jul 1998;92(1):47-52.
22. Robson S, Pridmore B, Dodd J. Outcomes of
induced labour. Aust N Z J Obstet Gynaecol. Feb 1997;37(1):16-19.
149

150
23. Alberico S, Fadalti M, Grimaldi E, De Seta F, Mazza S, Guaschino S. Eligibility criteria for labor induction with prostaglandins. Clin Exp Obstet Gynecol. 1997;24(2):61-66.
24. A clinical trial of induction of labor versus
expectant management in postterm pregnancy. The National Institute of Child Health and Human Development Network of Maternal-Fetal Medicine Units. Am J Obstet Gynecol. Mar 1994;170(3):716-723.
25. Wigton TR, Wolk BM. Elective and routine
induction of labor. A retrospective analysis of 274 cases. J Reprod Med. Jan 1994;39(1):21-26.
26. Abou el-Leil LA, Nasrat AA, Fayed HM.
Prostaglandin E2 vaginal pessaries in the grandmultipara with an unripe cervix, a comparison of different parity groups. Int J Gynaecol Obstet. Feb 1993;40(2):119-122.
27. Hannah ME, Hannah WJ, Hellmann J, Hewson S,
Milner R, Willan A. Induction of labor as compared with serial antenatal monitoring in post-term pregnancy. A randomized controlled trial. The Canadian Multicenter Post-term Pregnancy Trial Group. N Engl J Med. Jun 11 1992;326(24):1587-1592.
28. Macer JA, Macer CL, Chan LS. Elective
induction versus spontaneous labor: a retrospective study of complications and outcome. Am J Obstet Gynecol. Jun 1992;166(6 Pt 1):1690-1696; discussion 1696-1697.
29. Schreyer P, Bar-Natan N, Sherman DJ, Arieli S,
Caspi E. Fetal breathing movements before oxytocin induction in prolonged pregnancies. Am J Obstet Gynecol. Sep 1991;165(3):577-581.
30. Boyd ME, Usher RH, McLean FH, Kramer MS.
Obstetric consequences of postmaturity. Am J Obstet Gynecol. Feb 1988;158(2):334-338.
31. Lampe LG. Elective induction of labour in the obstetrical practice. Acta Chir Hung. 1986;27(3):143-149.
32. Arulkumaran S, Gibb DM, TambyRaja RL, Heng
SH, Ratnam SS. Failed induction of labour. Aust N Z J Obstet Gynaecol. Aug 1985;25(3):190-193.
33. Orhue AA, Unuigbe JA, Ezimokhai M, Ojo VA.
Outcome of induced labor in 931 term pregnancies. Obstet Gynecol. Jul 1984;64(1):108-114.
34. Belsky DH. Statistical observations on the
elective induction of labor with oxytocin. J Am Osteopath Assoc. Apr 1982;81(8):524-530.
35. Goeschen K, Pakzad S. Risks occurring in birth
induction without considering cervix maturity. J Perinat Med. 1980;8(1):27-37.
36. Williams RM, Craft I. Caesarean section following modern induction of labour. Br J Clin Pract. Mar 1979;33(3):80-81, 84.
37. McBride WG, Lyle JG, Black B, Brown C,
Thomas DB. A study of five year old children born after elective induction of labour. Med J Aust. Oct 1 1977;2(14):456-459.
38. Wilson PD, Philpott RH. Induction of labour in
Black patients. S Afr Med J. Mar 24 1976;50(13):498-502.
39. Ben-Haroush A, Glickman H, Yogev Y, Kaplan
B, Feldberg D, Hod M. Induction of labor in pregnancies with suspected large-for-gestational-age fetuses and unfavorable cervix. Eur J Obstet Gynecol Reprod Biol. Oct 15 2004;116(2):182-185.
40. Onifade A. Induction of labour. West Afr Med J.
Jun 1970;19(3):105-108. 41. Williams MC, Krammer J, O'Brien WF. The
value of the cervical score in predicting successful outcome of labor induction. Obstet Gynecol. Nov 1997;90(5):784-789.
42. Heffner LJ, Elkin E, Fretts RC. Impact of labor
induction, gestational age, and maternal age on cesarean delivery rates. Obstet Gynecol. Aug 2003;102(2):287-293.
43. Buist R. Induction of labour: indications and
obstetric outcomes in a tertiary referral hospital. N Z Med J. Jul 9 1999;112(1091):251-253.
44. Xenakis EM, Piper JM, Conway DL, Langer O.
Induction of labor in the nineties: conquering the unfavorable cervix. Obstet Gynecol. Aug 1997;90(2):235-239.
45. Chan LY, Fu L, Leung TN, Wong SF, Lau TK.
Obstetric outcomes after cervical ripening by multiple doses of vaginal prostaglandin E2. Acta Obstet Gynecol Scand. Jan 2004;83(1):70-74.
46. Heimstad R, Romundstad PR, Eik-Nes SH, Salvesen KA. Outcomes of pregnancy beyond 37 weeks of gestation. Obstet Gynecol. Sep 2006;108(3 Pt 1):500-508.
47. van Gemund N, Hardeman A, Scherjon SA,
Kanhai HH. Intervention rates after elective induction of labor compared to labor with a spontaneous onset. A matched cohort study. Gynecol Obstet Invest. 2003;56(3):133-138.
48. Boulvain M, Marcoux S, Bureau M, Fortier M, Fraser W. Risks of induction of labour in uncomplicated term pregnancies. Paediatr Perinat Epidemiol. Apr 2001;15(2):131-138.

151
49. Rizzo N, Farina A, Santarsiero G, et al. Correlation among amniotic fluid index (AFI), cesarean section rate, and labor length in inducted pregnancies beyond 41 weeks' gestation with unfavorable cervix. Am J Perinatol. 2000;17(6):319-324.
50. Yeast JD, Jones A, Poskin M. Induction of labor
and the relationship to cesarean delivery: A review of 7001 consecutive inductions. Am J Obstet Gynecol. Mar 1999;180(3 Pt 1):628-633.
51. Saunders N, Amis S, Marsh M. The prognostic
value of fetal ultrasonography before induction of labour. Br J Obstet Gynaecol. Nov 1992;99(11):903-906.
52. Morgan MA, Thurnau GR. Efficacy of the fetal-
pelvic index in patients requiring labor induction. Am J Obstet Gynecol. Sep 1988;159(3):621-625.
53. Dodd JM, Crowther CA, Robinson JS. Morning
compared with evening induction of labor: a nested randomized controlled trial. A nested randomized controlled trial. Obstet Gynecol. Aug 2006;108(2):350-360.
54. Ahner R, Egarter C, Kiss H, et al. Fetal
fibronectin as a selection criterion for induction of term labor. Am J Obstet Gynecol. Nov 1995;173(5):1513-1517.
55. Egarter C, Kofler E, Fitz R, Husslein P. Is
induction of labor indicated in prolonged pregnancy? Results of a prospective randomised trial. Gynecol Obstet Invest. 1989;27(1):6-9.
56. Dhall K, Mittal SC, Kumar A. Evaluation of
preinduction scoring systems. Aust N Z J Obstet Gynaecol. Nov 1987;27(4):309-311.
57. Wing DA, Tran S, Paul RH. Factors affecting the likelihood of successful induction after intravaginal misoprostol application for cervical ripening and labor induction. Am J Obstet Gynecol. Jun 2002;186(6):1237-1240; discussion 1240-1233.
58. Pandis GK, Papageorghiou AT, Ramanathan VG,
Thompson MO, Nicolaides KH. Preinduction sonographic measurement of cervical length in the prediction of successful induction of labor. Ultrasound Obstet Gynecol. Dec 2001;18(6):623-628.
59. Heimstad R, Skogvoll E, Mattsson LA, Johansen
OJ, Eik-Nes SH, Salvesen KA. Induction of labor or serial antenatal fetal monitoring in postterm pregnancy: a randomized controlled trial. Obstet Gynecol. Mar 2007;109(3):609-617.
60. Vrouenraets FP, Roumen FJ, Dehing CJ, van den Akker ES, Aarts MJ, Scheve EJ. Bishop score and risk of cesarean delivery after induction of labor in nulliparous women. Obstet Gynecol. Apr 2005;105(4):690-697.
61. Dublin S, Lydon-Rochelle M, Kaplan RC, Watts
DH, Critchlow CW. Maternal and neonatal outcomes after induction of labor without an identified indication. Am J Obstet Gynecol. Oct 2000;183(4):986-994.
62. Maslow AS, Sweeny AL. Elective induction of
labor as a risk factor for cesarean delivery among low-risk women at term. Obstet Gynecol. Jun 2000;95(6 Pt 1):917-922.
63. Amano K, Saito K, Shoda T, Tani A, Yoshihara
H, Nishijima M. Elective induction of labor at 39 weeks of gestation: a prospective randomized trial. J Obstet Gynaecol Res. Feb 1999;25(1):33-37.
64. Melton LJ, 3rd, Gallenberg MM, Noller KL.
Effect of elective induction on birth weight. Mayo Clin Proc. Oct 1979;54(10):646-650.
65. Tylleskar J, Finnstrom O, Leijon I, Hedenskog S,
Ryden G. Spontaneous labor and elective induction--a prospective randomized study. I. Effects on mother and fetus. Acta Obstet Gynecol Scand. 1979;58(6):513-518.
66. Martin DH, Thompson W, Pinkerton JH, Watson
JD. A randomized controlled trial of selective planned delivery. Br J Obstet Gynaecol. Feb 1978;85(2):109-113.
67. Cole RA, Howie PW, Macnaughton MC.
Elective induction of labour. A randomised prospective trial. Lancet. Apr 5 1975;1(7910):767-770.
68. Booth JH, Kurdyak VB. Elective induction of
labour: a controlled study. Can Med Assoc J. Aug 1 1970;103(3):245-248.
69. Hoffman MK, Vahratian A, Sciscione AC,
Troendle JF, Zhang J. Comparison of labor progression between induced and noninduced multiparous women. Obstet Gynecol. May 2006;107(5):1029-1034.
70. Nooh A, Baghdadi S, Raouf S. Induction of
labour: how close to the evidence-based guidelines are we? J Obstet Gynaecol. Jul 2005;25(5):451-454.
71. Wilailak S, Saropala N, Chaturachinda K.
Elective induction of labor: Ramathibodi Hospital (Jan-Jun, 1990). J Med Assoc Thai. Jan 1993;76 Suppl 1:44-47.

152
72. Ekman G, Perssen PH, Ulmsten U, Wingerup L. The impact on labor induction of intracervically applied PGE2-gel, related to gestational age in patients with an unripe cervix. Acta Obstet Gynecol Scand Suppl. 1983;113:173-175.
73. Anderson MM. The state of the cervix, and
surgical induction of labour. J Obstet Gynaecol Br Commonw. Oct 1965;72(5):711-716.
74. Dyson DC, Miller PD, Armstrong MA.
Management of prolonged pregnancy: induction of labor versus antepartum fetal testing. Am J Obstet Gynecol. Apr 1987;156(4):928-934.
75. Vierhout ME, Out JJ, Wallenburg HC. Elective
induction of labor: a prospective clinical study, I: Obstetric and neonatal effects. J Perinat Med. 1985;13(4):155-162.
76. Mukherjee S, Sood M. Towards a safer
motherhood. J Indian Med Assoc. Mar 1995;93(3):98-100, 189.
77. Kaufman KE, Bailit JL, Grobman W. Elective
induction: an analysis of economic and health consequences. Am J Obstet Gynecol. Oct 2002;187(4):858-863.
78. Herbst MA. Treatment of suspected fetal
macrosomia: a cost-effectiveness analysis. Am J Obstet Gynecol. Sep 2005;193(3 Pt 2):1035-1039.
79. Senecal J, Xiong X, Fraser WD. Effect of fetal
position on second-stage duration and labor outcome. Obstet Gynecol. Apr 2005;105(4):763-772.
80. Cheng YW, Shaffer BL, Caughey AB.
Associated factors and outcomes of persistent occiput posterior position: A retrospective cohort study from 1976 to 2001. J Matern Fetal Neonatal Med. Sep 2006;19(9):563-568.
81. Rayburn WF, Zhang J. Rising rates of labor
induction: present concerns and future strategies. Obstet Gynecol. Jul 2002;100(1):164-167.
82. Martin JA, Hamilton BE, Sutton PD, Ventura SJ,
Menacker F, Kirmeyer S. Births: final data for 2004. Natl Vital Stat Rep. Sep 29 2006;55(1):1-101.
83. Grobman WA. Elective induction: When? Ever?
Clin Obstet Gynecol. Jun 2007;50(2):537-546. 84. Zhang J, Yancey MK, Henderson CE. U.S.
national trends in labor induction, 1989-1998. J Reprod Med. Feb 2002;47(2):120-124.
85. Lydon-Rochelle MT, Cardenas V, Nelson JC, Holt VL, Gardella C, Easterling TR. Induction of Labor in the Absence of Standard Medical Indications: Incidence and Correlates. Med Care. Jun 2007;45(6):505-512.
86. Hilder L, Costeloe K, Thilaganathan B.
Prolonged pregnancy: evaluating gestation-specific risks of fetal and infant mortality. Br J Obstet Gynaecol. Feb 1998;105(2):169-173.
87. Caughey AB, Washington AE, Laros RK, Jr.
Neonatal complications of term pregnancy: rates by gestational age increase in a continuous, not threshold, fashion. Am J Obstet Gynecol. Jan 2005;192(1):185-190.
88. American College of Obstetricians and
Gynecologists (ACOG). Induction of labor. Washington, DC: American College of Obstetricians and Gynecologists (ACOG); 1999 Nov. 10 p. ACOG practice bulletin; no. 10.
89. Vahratian A, Zhang J, Troendle JF, Sciscione
AC, Hoffman MK. Labor progression and risk of cesarean delivery in electively induced nulliparas. Obstet Gynecol. Apr 2005;105(4):698-704.
90. Sanchez-Ramos L, Olivier F, Delke I, Kaunitz
AM. Labor induction versus expectant management for postterm pregnancies: a systematic review with meta-analysis. Obstet Gynecol. Jun 2003;101(6):1312-1318.
91. Gulmezoglu AM, Crowther CA, Middleton P.
Induction of labour for improving birth outcomes for women at or beyond term. Cochrane Database Syst Rev. 2006(4):CD004945.
92. Bost BW. Cesarean delivery on demand: what
will it cost? Am J Obstet Gynecol. Jun 2003;188(6):1418-1421; discussion 1421-1413.
93. Silver RM, Landon MB, Rouse DJ, et al.
Maternal morbidity associated with multiple repeat cesarean deliveries. Obstet Gynecol. Jun 2006;107(6):1226-1232.
94. Grobman WA, Gersnoviez R, Landon MB, et al.
Pregnancy outcomes for women with placenta previa in relation to the number of prior cesarean deliveries. Obstet Gynecol. Dec 2007;110(6):1249-1255.
95. Kohli P, Zlatnik M, Little S, Caughey A.
Bleeding Previa: What Are The Risks? Am J Obstet Gynecol. 2006;195:S113.
96. Smith GC, Pell JP, Dobbie R. Caesarean section
and risk of unexplained stillbirth in subsequent pregnancy. Lancet. Nov 29 2003;362(9398):1779-1784.

153
97. Smith LP, Nagourney BA, McLean FH, Usher RH. Hazards and benefits of elective induction of labor. Am J Obstet Gynecol. Mar 1 1984;148(5):579-585.
98. Caughey AB, Musci TJ. Complications of term
pregnancies beyond 37 weeks of gestation. Obstet Gynecol. Jan 2004;103(1):57-62.
99. Caughey AB, Stotland NE, Escobar GJ. What is
the best measure of maternal complications of term pregnancy: ongoing pregnancies or pregnancies delivered? Am J Obstet Gynecol. Oct 2003;189(4):1047-1052.
100. Kjos SL, Henry OA, Montoro M, Buchanan TA,
Mestman JH. Insulin-requiring diabetes in pregnancy: a randomized trial of active induction of labor and expectant management. Am J Obstet Gynecol. Sep 1993;169(3):611-615.
101. Gonen O, Rosen DJ, Dolfin Z, Tepper R, Markov
S, Fejgin MD. Induction of labor versus expectant management in macrosomia: a randomized study. Obstet Gynecol. Jun 1997;89(6):913-917.
102. Villar J, Carroli G, Zavaleta N, et al. Maternal
and neonatal individual risks and benefits associated with caesarean delivery: multicentre prospective study. BMJ. Nov 17 2007;335(7628):1025.
103. Norwitz ER, Snegovskikh VV, Caughey AB.
Prolonged pregnancy: when should we intervene? Clin Obstet Gynecol. Jun 2007;50(2):547-557.
104. Kim L, Kaimal A, Cheng Y, Delaney S, Child A,
Caughey A. Preeclampsia is a risk factor for cesarean delivery in the setting of induction of labor. Am J Obstet Gynecol. 2007;197:S105.
105. Assessing the Quality and Applicability of
Included Studies in Agency for Healthcare Research and Quality. Methods Reference Guide for Comparative Effectiveness Reviews, [Draft posted Nov. 2007]. Rockville, MD. Available at: http://www.ahrq.gov/fund/contarchive/rfp0910001.htm
106. West SL, King V, Carey TS, et al. Systems to
Rate the Strength of Scientific Evidence. Evidence Report, Technology Assessment No. 47. (Prepared by the Research Triangle Institute-University of North Carolina Evidence-based Practice Center under Contract No. 290-97-0011). AHRQ Publication No. 02-E016. Rockville, MD: Agency for Healthcare Research and Quality. April 2002.
107. Viswanathan M, Visco A, Hartmann K, et al. Cesarean Delivery on Maternal Request. Evidence Report/Technology Assessment No. 133. (Prepared by the RTI International-University of North Carolina Evidence-Based Practice Center under Contract No. 290-02-0016.) AHRQ Publication No. 06-E009. Rockville, MD: Agency for Healthcare Research and Quality March 2006.
108. Hedges L, Olkin I. Statistical Methods for Meta-
Analysis. First ed. San Diego: Academic Press; 1985.
109. Higgins J, Thompson S. Quantifying
heterogeneity in a meta-analysis. Stat Med. Jun 15 2002;21(11):1539-1558.
110. Review Manager (RevMan). Version 4.2 for
Windows ed. Copenhagen: The Nordic Cochrane Center, The Cochrane Collaboration; 2003.
111. Cooper H, Hedges L. The Handbook of Research
Synthesis. New York: Russell Sage Foundation; 1994.
112. Hannah ME, Huh C, Hewson SA, Hannah WJ.
Postterm pregnancy: putting the merits of a policy of induction of labor into perspective. Birth. Mar 1996;23(1):13-19.
113. Leijon I, Finnstrom O, Hedenskog S, Ryden G,
Tylleskar J. Spontaneous labor and elective induction--a prospective randomized study. II. Bilirubin levels in the neonatal period. Acta Obstet Gynecol Scand. 1980;59(2):103-106.
114. Leijon I, Finnstrom O, Hedenskog S, Ryden G,
Tylleskar J. Spontaneous labour and elective induction--a prospective randomized study. Behavioural assessment and neurological examination in the newborn period. Acta Paediatr Scand. Jul 1979;68(4):553-560.
115. Lampe LG, Komaromy B, Gaal J. Selective
planned induction of labor. Acta Chir Acad Sci Hung. 1980;21(1):43-53.
116. Out JJ, Vierhout ME, Verhage F, Duivenvoorden
HJ, Wallenburg HC. Elective induction of labor: a prospective clinical study, II: Psychological effects. J Perinat Med. 1985;13(4):163-170.
117. Out JJ, Vierhout ME, Wallenburg HC. Breast-
feeding following spontaneous and induced labour. Eur J Obstet Gynecol Reprod Biol. Dec 1988;29(4):275-279.
118. Stotland NE, Hopkins LM, Caughey AB.
Gestational weight gain, macrosomia, and risk of cesarean birth in nondiabetic nulliparas. Obstet Gynecol. Oct 2004;104(4):671-677.

154
119. Greenberg MB, Cheng YW, Hopkins LM, Stotland NE, Bryant AS, Caughey AB. Are there ethnic differences in the length of labor? Am J Obstet Gynecol. Sep 2006;195(3):743-748.
120. Greenberg MB, Cheng YW, Sullivan M, Norton
ME, Hopkins LM, Caughey AB. Does length of labor vary by maternal age? Am J Obstet Gynecol. Oct 2007;197(4):428 e421-427.
121. Hopkins LM, Caughey AB, Glidden DV, Laros
RK, Jr. Racial/ethnic differences in perineal, vaginal and cervical lacerations. Am J Obstet Gynecol. Aug 2005;193(2):455-459.
122. Crane JM. Does the length of labor vary by
maternal age? Am J Obstet Gynecol. 2007;197(428):e1-7.
123. Gopalani S, Bennett K, Critchlow C. Factors
predictive of failed operative vaginal delivery. Am J Obstet Gynecol. Sep 2004;191(3):896-902.
124. Bianco A, Stone J, Lynch L, Lapinski R,
Berkowitz G, Berkowitz RL. Pregnancy outcome at age 40 and older. Obstet Gynecol. Jun 1996;87(6):917-922.
125. Weinstein MC, Stason WB. Foundations of cost-
effectiveness analysis for health and medical practices. N Engl J Med. Mar 31 1977;296(13):716-721.
126. Siegel JE, Weinstein MC, Russell LB, Gold MR.
Recommendations for reporting cost-effectiveness analyses. Panel on Cost-Effectiveness in Health and Medicine. Jama. Oct 23-30 1996;276(16):1339-1341.
127. Smith GC. Life-table analysis of the risk of
perinatal death at term and post term in singleton pregnancies. Am J Obstet Gynecol. Feb 2001;184(3):489-496.
128. Gilbert WM, Nesbitt TS, Danielsen B.
Associated factors in 1611 cases of brachial plexus injury. Obstet Gynecol. Apr 1999;93(4):536-540.
129. Nesbitt TS, Gilbert WM, Herrchen B. Shoulder
dystocia and associated risk factors with macrosomic infants born in California. Am J Obstet Gynecol. Aug 1998;179(2):476-480.
130. Caughey AB, Stotland NE, Washington AE,
Escobar GJ. Maternal and obstetric complications of pregnancy are associated with increasing gestational age at term. Am J Obstet Gynecol. Feb 2007;196(2):155 e151-156.
131. Alexander JM, DD MC, Leveno KJ. Prolonged
pregnancy: induction of labor and cesarean births. Obstet Gynecol. Jun 2001;97(6):911-915.
132. Alexander JM, McIntire DD, Leveno KJ. Forty weeks and beyond: pregnancy outcomes by week of gestation. Obstet Gynecol. Aug 2000;96(2):291-294.
133. Boulet SL, Alexander GR, Salihu HM, Pass M.
Macrosomic births in the united states: determinants, outcomes, and proposed grades of risk. Am J Obstet Gynecol. May 2003;188(5):1372-1378.
134. Dargaville PA, Copnell B. The epidemiology of
meconium aspiration syndrome: incidence, risk factors, therapies, and outcome. Pediatrics. May 2006;117(5):1712-1721.
135. Rouse DJ, Owen J, Goldenberg RL, Cliver SP.
The effectiveness and costs of elective cesarean delivery for fetal macrosomia diagnosed by ultrasound. Jama. Nov 13 1996;276(18):1480-1486.
136. Bochner CJ, Williams J, 3rd, Castro L, Medearis
A, Hobel CJ, Wade M. The efficacy of starting postterm antenatal testing at 41 weeks as compared with 42 weeks of gestational age. Am J Obstet Gynecol. Sep 1988;159(3):550-554.
137. Harper MA, Byington RP, Espeland MA,
Naughton M, Meyer R, Lane K. Pregnancy-related death and health care services. Obstet Gynecol. Aug 2003;102(2):273-278.
138. Farquhar PH. Utility assessment methods. Mgmt
Sci. 1984;30:1283-1300. 139. Torrance GW. Measurement of health state
utilities for economic appraisal. J Health Econ. Mar 1986;5(1):1-30.
140. Kuppermann M, Nease RF, Learman LA, Gates
E, Blumberg B, Washington AE. Procedure-related miscarriages and Down syndrome-affected births: implications for prenatal testing based on women's preferences. Obstet Gynecol. Oct 2000;96(4):511-516.
141. Caughey AB, Angeja A, Vargas J, Gomez R,
Washington AE. Quantitative Evaluation of Preference for Mode of Delivery in Pregnant Chilean Women. Med Decis Making. 2003;23:634.
142. Goeree R, Hannah M, Hewson S. Cost-
effectiveness of induction of labour versus serial antenatal monitoring in the Canadian Multicentre Postterm Pregnancy Trial. CMAJ. May 1 1995;152(9):1445-1450.
143. Gold MR, Siegel JE, Russell LB, Weinstein MC.
Cost-Effectiveness in Health and Medicine. New York, NY: Oxford University Press; 1996.

155
144. Sanchez-Ramos L, Bernstein S, Kaunitz AM. Expectant management versus labor induction for suspected fetal macrosomia: a systematic review. Obstet Gynecol. Nov 2002;100(5 Pt 1):997-1002.
145. Sande HA, Tuveng J, Fonstelien T. A prospective
randomized study of induction of labor. Int J Gynaecol Obstet. Aug 1983;21(4):333-336.
146. Nicholson JM, Kellar LC, Cronholm PF,
Macones GA. Active management of risk in pregnancy at term in an urban population: an association between a higher induction of labor rate and a lower cesarean delivery rate. Am J Obstet Gynecol. Nov 2004;191(5):1516-1528.
147. Nicholson JM, Yeager DL, Macones G. A
preventive approach to obstetric care in a rural hospital: association between higher rates of preventive labor induction and lower rates of cesarean delivery. Ann Fam Med. Jul-Aug 2007;5(4):310-319.
148. Nicholson JM, Kellar LC, Kellar GM. The
impact of the interaction between increasing gestational age and obstetrical risk on birth outcomes: evidence of a varying optimal time of delivery. J Perinatol. Jul 2006;26(7):392-402.
149. Nicholson J, Caughey A, Parry S, Macones G.
Prospective Randomized Trial of the Active Management of Risk in Pregnancy at Term: improved birth outcomes from prostaglandin-assisted preventive labor induction. Am J Obstet Gynecol. 2007;197:S37.
150. Hatfield AS, Sanchez-Ramos L, Kaunitz AM.
Sonographic cervical assessment to predict the success of labor induction: a systematic review with metaanalysis. Am J Obstet Gynecol. Aug 2007;197(2):186-192.
151. Bishop EH. Pelvic Scoring for Elective
Induction. Obstet Gynecol. Aug 1964;24:266-268.
152. Weiss JL, Malone FD, Emig D, et al. Obesity,
obstetric complications and cesarean delivery rate--a population-based screening study. Am J Obstet Gynecol. Apr 2004;190(4):1091-1097.
153. Wolf FM, Gruppen LD, Billi JE. Differential
diagnosis and the competing-hypotheses heuristic. A practical approach to judgment under uncertainty and Bayesian probability. Jama. May 17 1985;253(19):2858-2862.
154. Stotland NE, Washington AE, Caughey AB.
Prepregnancy body mass index and the length of gestation at term. Am J Obstet Gynecol. Oct 2007;197(4):378 e371-375.
155. Caughey AB. Cost-effectiveness analysis of prenatal diagnosis: methodological issues and concerns. Gynecol Obstet Invest. 2005;60(1):11-18.
156. Little SE, Caughey AB. Acyclovir prophylaxis
for pregnant women with a known history of herpes simplex virus: a cost-effectiveness analysis. Am J Obstet Gynecol. Sep 2005;193(3 Pt 2):1274-1279.
157. Menacker F, Curtin SC. Trends in cesarean birth
and vaginal birth after previous cesarean, 1991-99. Natl Vital Stat Rep. Dec 27 2001;49(13):1-16.
158. Hamilton B, Martin J, Ventura S. Births:
preliminary data for 2006. Natl Vital Stat Rep. 2007;56:1-18.
159. U.S. Department of Health and Human Services:
Office of Disease Prevention and Health Promotion. Healthy People 2010. Nasnewsletter. 2000;15:3.
160. Stotland NE, Caughey AB, Breed E, Escobar GJ.
Macrosomia in a large managed care cohort: maternal risk factors and complications. International Journal of Gynecology and Obstetrics. 2004;87(3):220-226.
161. Ogden CL, Carroll MD, Curtin LR, McDowell
MA, Tabak CJ, Flegal KM. Prevalence of overweight and obesity in the United States, 1999-2004. Jama. Apr 5 2006;295(13):1549-1555.
162. Meikle SF, Steiner CA, Zhang J, Lawrence WL.
A national estimate of the elective primary cesarean delivery rate. Obstet Gynecol. Apr 2005;105(4):751-756.
163. NIH State-of-the-Science Conference Statement
on Cesarean Delivery on Maternal Request. NIH Consens Sci Statements. March 27-29 2006;23:1-29.
164. Murthy K, Grobman WA, Lee TA, Holl JL.
Association between rising professional liability insurance premiums and primary cesarean delivery rates. Obstet Gynecol. Dec 2007;110(6):1264-1269.
165. Rouse DJ, Owen J, Hauth JC. Active-phase labor
arrest: oxytocin augmentation for at least 4 hours. Obstet Gynecol. Mar 1999;93(3):323-328.
166. Rouse DJ, Owen J, Savage KG, Hauth JC. Active
phase labor arrest: revisiting the 2-hour minimum. Obstet Gynecol. Oct 2001;98(4):550-554.

156
167. Myers D, Cheng Y, Shaffer B, Kaimal A, Bianco K, Caughey A. Active Phase Arrest: Who Will Deliver Vaginally? . Am J Obstet Gynecol. 2006;195:S91.
168. Breart G, Goujard J, Maillard F, Chavigny C,
Rumeau-Rouquette C, Sureau C. [Comparison of 2 obstetrical attitudes vis-a-vis inducing labor at term. Randomized study]. J Gynecol Obstet Biol Reprod (Paris). 1982;11(1):107-112.

List of Acronyms and Abbreviations
Acronym or Abbreviation Definition
ACOG American College of Obstetricians and Gynecologists
AFI Amniotic Fluid Index
AHRQ Agency for Healthcare Research and Quality
AMOR-IPAT Active management of risk in pregnancy at term
BMI Body Mass Index
CDC Centers for Disease Control
CDMR Cesarean section on maternal request
CPI Consumer Price Index
EPC Evidence-based Practice Center
ICN Intensive care nursery
IUFD In utero fetal demise
IUGR Intra-uterine growth restriction
MeSH Medical Subject Headings
MFMU Maternal-Fetal Medicine Units
NICU Neonatal intensive care unit
NNH Number needed to harm
NNT Number needed to treat
NST Nonstress Test
OVD Operative vaginal delivery
PROM Premature rupture of membranes
RCT Randomized controlled trial
SVD Spontaneous vaginal delivery
TEP Technical Expert Panel
UCSF University of California, San Francisco
UK United Kingdom
UL-OTD Upper limit of optimal delivery time
US United States
157

Appendixes

Appendix A: Search Strategy MEDLINE Search I "Puerperal Disorders"[MeSH] OR "Pregnancy, Prolonged"[MeSH] OR "Pregnancy Complications"[MeSH] OR "Morbidity"[MeSH] OR "Infant, Newborn"[MeSH] OR "Fetal Diseases"[MeSH] OR "Puerperal Infection"[MeSH] OR "Pregnancy Outcome"[MeSH] OR "Cesarean Section"[MeSH] OR "Obstetric Labor Complications"[MeSH] AND "Labor, Induced"[MeSH] Limits: English, Humans # of citations as of 5/21/2007: 2597 MEDLINE Search II #1 "Labor, Induced"[mesh] OR "induction of labor" OR "labor induction" OR
(labor[ti] OR labour[ti] AND induc*[ti]) #2 trial OR study OR studies OR follow* OR "long term" OR outcome* OR risk OR
mortality OR fatal* OR disabilit* OR ("Treatment Outcome"[MeSH] OR "Pregnancy Outcome"[MeSH] OR "Controlled Clinical Trials"[MeSH] OR "Epidemiologic Factors"[MeSH] OR "Cohort Studies"[MeSH] OR "Risk"[MeSH] OR "Retrospective Studies"[MeSH] OR "Prognosis"[MeSH] OR "Mortality"[MeSH] OR "Follow-Up Studies"[MeSH] OR "mortality"[Subheading] OR "Controlled Clinical Trial"[Publication Type])
#3 #1 and #2, limits: English, Humans # of citations as of June 6, 2007 (total): 3207 # of citations as of June 6, 2007 (unique): 1110 MEDLINE Search III #1 "Labor, Induced"[mesh] OR "induction of labor" OR "labor induction" OR
(labor[ti] OR labour[ti] AND induc*[ti]) AND elective # of citations as of June 6, 2007 (total): 272 # of citations as of June 6, 2007 (unique): 15 Total number of unique citations from MEDLINE search: 3722
A-1

B-1
Appendix B: Data Abstraction Forms Level 1. Title and abstract review form Fundamentally, there are two types of articles we are looking for to address our Key Questions: 1. Elective IOL studies with outcomes on mothers and babies 2. Studies that examine predictors of IOL success. Both types of studies, but particularly the latter, can be used to examine definitions of success. 1. What type of article is this?
a. Prospective RCT b. Cohort/Case-control study c. Review d. Meta-analysis e. Editorial f. Letter g. Case study h. Clinical guideline i. Can't tell
2. Is this a study of method induction (e.g. prostaglandins [misoprostol, cervidil, prepidil, PGE2, PGE1M], oxytocin, Foley bulb, laminaria, amniotomy, artificial rupture of membranes [AROM])?
a. Yes b. No c. Can't tell
3. Are there any other reasons that this article should be excluded?
a. No b. Can't tell c. Article primarily addresses postterm (>42 weeks gestational age) pregnancy d. Article primarily addresses women with prior cesareans e. Article primarily addresses multiple gestations f. Article primarily addresses medical or obstetrical complications of pregnancy such as
preeclampsia, diabetes mellitus and isoimmunization g. Article primarily addresses fetal anomalies h. Foreign language i. Other (specify): ___________________________
4. Is the article about elective induction of labor? (Where elective induction of labor is defined as induction of labor without a medical indication prior to 42 weeks of gestation. A medical induction of induction of labor includes preeclampsia, diabetes mellitus, neonatal indications

B-2
such as intrauterine growth restriction, oligohydramnios, nonreassuring fetal heart rate, fetal anomalies)
a. Yes - ANSWER QUESTION 5 ONLY b. No - ANSWER QUESTION 6 ONLY c. Can't tell - ANSWER QUESTION 5 ONLY
ANSWER ONLY QUESTION 5 IF THE ANSWER TO QUESTION 4 IS "YES" OR "CAN'T TELL". DO NOT ANSWER QUESTION 6. 5. Which of the following outcomes do the results include?
a. Maternal outcomes (including cesarean delivery) b. Neonatal outcomes c. Neither (explain) d. Can’t tell
ANSWER ONLY QUESTION 6 IF THE ANSWER TO QUESTION 4 IS "NO". 6. Do the results examine predictors of cesarean delivery? (Where such predictors might include maternal age, race/ethnicity, obesity/weight, parity, birthweight, gestational age, etc.)
a. Yes b. No c. Can't tell

B-3
Level 2. Full text data abstraction form 1. Should this article be abstracted? Article #_____________________
a. Yes b. No
2. Why should this article be excluded from full text abstraction (check all that apply)? (Please skip the
rest of the form if the article is to be excluded) a. Article is not about elective induction of labor nor predictors of success in the setting of
induction of labor b. While article is about elective induction of labor, does not examine mode of delivery or maternal
or neonatal outcomes c. Not a research study including cohort, case-control or RCT d. Article primarily about method of induction e. Article primarily addresses postterm (>42 weeks gestational age) pregnancy f. Article primarily addresses multiple gestations g. Article primarily addresses medical or obstetrical complications of pregnancy such as
preeclampsia, diabetes mellitus and isoimmunization h. Article primarily addresses fetal anomalies i. Article primarily addresses women with prior cesareans j. Foreign language article k. Duplicate publication or linked to another publication (specify) _____ l. Data provided not usable (specify) _____________ m. Other reason (specify)
3. Does this article present data that overlaps with another article/publication?
a. Yes – please specify other article(s). ____________ b. No
4. What was the study design of the article?
a. Randomized, controlled trial b. Prospective cohort study c. Retrospective cohort study d. Case-control study
5. What year was the article published? ________________
6. Over what years was the study conducted?
a. Began in:___________ Ended in:____________
7. What country was the study conducted in? a. U.S. b. Canada c. Other (Specify): _______________________________
8. What was the primary location of the study?
a. Academic Center b. Community Hospital c. Both Academic and Community Hospital d. Multi-center study e. Not stated
9. Was this a study of elective induction of labor? (Where elective induction of labor is defined as
induction of labor without a medical indication prior to 42 weeks of gestation. A medical induction of

B-4
induction of labor includes preeclampsia, diabetes mellitus, neonatal indications such as intrauterine growth restriction, oligohydramnios, nonreassuring fetal heart rate, fetal anomalies)
a. Yes b. No
10. What was the primary measure of success for induction of labor? a. Not mentioned b. Vaginal delivery c. Spontaneous vaginal delivery (neither forceps nor vacuum) d. Vaginal delivery within 24 hours e. Vaginal delivery within 18 hours f. Active labor within 24 hours g. Active labor within 18 hours h. Active labor within 12 hours i. Other (Specify): ____________________________
11. What was the primary comparison group to IOL?
a. Expectant management b. Spontaneous labor c. No comparison group
12. What induction method was used?
a. Oxytocin b. AROM (artificial rupture of membrane) c. Misoprostil d. PGE2 gel (prepidil) e. Cervidil f. Other method (specify)
13. Please report any additional information on the induction method that may be relevant in the text box
below.
14. Which of the following exclusion criteria were used when selecting the population for the study? (Note: this applies only to the elective induction of labor studies)
a. Multiple gestation b. Prior CS c. Breech d. > 42 weeks GA e. < 37 weeks GA f. Other (specify)
15. Which of the following inclusion criteria were used when selecting the population for the study?
(Note: this applies to elective IOL studies only) a. Multiparas b. Nulliparas c. Other (specify)
16. Please describe any other issues with respect to the population studied in the text box below.

B-5
If this is a study of ELECTIVE IOL, then answer the outcomes questions; if this study only looked at predictors of success, then skip the outcomes questions and only report data for the table on predictors of CS. What were the Maternal/Obstetric outcomes reported? Maternal/Obstetric Outcomes for ALL patients (not stratified by parity) Spont
Labor n Spont Labor %
Spont Labor N
IOL n
IOL %
IOL N P-value
RR OR 95% CI lower
95% CI upper
aOR 95% CI lower
95% CI upper
Cesarean Spontaneous Vaginal Del
Operative vaginal delivery
Chorio Prolonged Labor
Prolonged 1st stage of labor
Prolonged 2nd stage of labor
Mean labor Mean 1st stage Mean 2nd stage Median labor Median 1st stage
Median 2nd stage
Mean EBL 3rd/4th degree perineal laceration
Postpartum hemorrhage
Blood transfusion
Hysterectomy Injury to

B-6
organs – bowel/bladder Wound complications
Endomyometritis
Outcome Spont
Labor n Spont Labor %
Spont Labor N
IOL n
IOL %
IOL N
P-value
RR OR 95% CI lower
95% CI upper
aOR 95% CI lower
95% CI upper
Other maternal/obste outcome
Other Other Other Other Maternal/Obstetric Outcomes for NULLIPAROUS patients ONLY Spont
Labor n Spont Labor %
Spont Labor N
IOL n
IOL %
IOL N
P-value
RR OR 95% CI lower
95% CI upper
aOR 95% CI lower
95% CI upper
Cesarean Spontaneous Vaginal Del
Operative vaginal delivery
Chorio Prolonged Labor Prolonged 1st stage of labor
Prolonged 2nd stage of labor
Mean labor Mean 1st stage Mean 2nd stage Median labor Median 1st stage Median 2nd stage Mean EBL

B-7
3rd/4th degree perineal laceration
Postpartum hemorrhage
Blood transfusion Hysterectomy Injury to organs – bowel/bladder
Wound complications
Endomyometritis Outcome Spont
Labor n Spont Labor %
Spont Labor N
IOL n
IOL %
IOL N
P-value
RR OR 95% CI lower
95% CI upper
aOR 95% CI lower
95% CI upper
Other maternal/obste outcome
Other Other Other Other Maternal/Obstetric Outcomes for MULTIPAROUS patients ONLY Spont
Labor n Spont Labor %
Spont Labor N
IOL n
IOL %
IOL N
P-value
RR OR 95% CI lower
95% CI upper
aOR 95% CI lower
95% CI upper
Cesarean Spontaneous Vaginal Del
Operative vaginal delivery
Chorio Prolonged Labor Prolonged 1st stage of labor
Prolonged 2nd stage of labor
Mean labor

B-8
Mean 1st stage Mean 2nd stage Median labor Median 1st stage Median 2nd stage Mean EBL 3rd/4th degree perineal laceration
Postpartum hemorrhage
Blood transfusion Hysterectomy Injury to organs – bowel/bladder
Wound complications
Endomyometritis Outcome Spont
Labor n Spont Labor %
Spont Labor N
IOL n
IOL %
IOL N
P-value
RR OR 95% CI lower
95% CI upper
aOR 95% CI lower
95% CI upper
Other maternal/obste outcome
Other Other Other Other What were the neonatal outcomes reported? Neonatal outcomes for ALL patients (not stratified by parity) Spont
Labor n Spont Labor %
Spont Labor N
IOL n
IOL %
IOL N
P-value
RR OR 95% CI lower
95% CI upper
aOR 95% CI lower
95% CI upper
Apgar score <7 at 5 minutes
UAph<7.0 UAph<7.1

B-9
UA base excess < -12 UA base excess < -11 Mean UApH Mean base excess Meconium Meconium aspiration syndrome
“fetal distress” or fetal intolerance of labor
Respiratory distress syndrome
Transient tachypnea of the newborn
Suspected sepsis Culture proven sepsis Hypoxic-ischemic encephalopathy
LGA – large for gestational age
Birthweight > 4000 gms
Birthweight >4500 gms Birthweight < 2500 gms
Neonatal seizures Hypoglycemia Neonatal jaundice Neonatal polycythemia Breastfeeding Outcome Spont
Labor n Spont Labor %
Spont Labor N
IOL n
IOL %
IOL N
P-value
RR OR 95% CI lower
95% CI upper
aOR 95% CI lower
95% CI upper
Other neonatal outcome
Other Other Other Other

B-10
Neonatal outcomes for NULLIPAROUS patients only Spont
Labor n Spont Labor %
Spont Labor N
IOL n
IOL %
IOL N
P-value
RR OR 95% CI lower
95% CI upper
aOR 95% CI lower
95% CI upper
Apgar score <7 at 5 minutes
UAph<7.0 UAph<7.1 UA base excess < -12 UA base excess < -11 Mean UApH Mean base excess Meconium Meconium aspiration syndrome
“fetal distress” or fetal intolerance of labor
Respiratory distress syndrome
Transient tachypnea of the newborn
Suspected sepsis Culture proven sepsis Hypoxic-ischemic encephalopathy
LGA – large for gestational age
Birthweight > 4000 gms
Birthweight >4500 gms Birthweight < 2500 gms
Neonatal seizures Hypoglycemia Neonatal jaundice Neonatal polycythemia Breastfeeding

B-11
Outcome Spont
Labor n Spont Labor %
Spont Labor N
IOL n
IOL %
IOL N
P-value
RR OR 95% CI lower
95% CI upper
aOR 95% CI lower
95% CI upper
Other neonatal outcome
Other Other Other Other Neonatal outcomes for MULTIPAROUS patients only Spont
Labor n Spont Labor %
Spont Labor N
IOL n
IOL %
IOL N
P-value
RR OR 95% CI lower
95% CI upper
aOR 95% CI lower
95% CI upper
Apgar score <7 at 5 minutes
UAph<7.0 UAph<7.1 UA base excess < -12 UA base excess < -11 Mean UApH Mean base excess Meconium Meconium aspiration syndrome
“fetal distress” or fetal intolerance of labor
Respiratory distress syndrome
Transient tachypnea of the newborn
Suspected sepsis Culture proven sepsis Hypoxic-ischemic encephalopathy
LGA – large for gestational age

B-12
Birthweight > 4000 gms
Birthweight >4500 gms Birthweight < 2500 gms
Neonatal seizures Hypoglycemia Neonatal jaundice Neonatal polycythemia Breastfeeding Outcome Spont
Labor n Spont Labor %
Spont Labor N
IOL n
IOL %
IOL N
P-value
RR OR 95% CI lower
95% CI upper
aOR 95% CI lower
95% CI upper
Other neonatal outcome
Other Other Other Other What were the predictors of cesarean delivery reported? 17. For which of the following outcomes were the predictors of delivery reported?
a. Overall vaginal delivery b. Vaginal delivery within 24 hours c. Other (specify)
Predictors of cesarean delivery in setting of IOL (ALL PATIENTS - NOT STRATIFIED BY PARITY) IOL
n IOL %
IOL N
P-value
RR OR 95% CI lower
95% CI upper
aOR 95% CI lower
95% CI upper
Maternal age < 35 Maternal age ≥ 35 Maternal age < 20 Age 20-24 Age 25-29 Age 30-34 Age 35-39 Age ≥40

B-13
Asian Black White Hispanic/Latina Native American Other (specify)_____________
Nulliparous Multiparous Medical Insurance Private Insurance Height < 5’0” Height ≥ 5’0” Underweight <BMI of 19 Normal weight BMI 20-24
Overweight BMI 25-29 Obese BMI >= 30 Bishop score <5 Bishop score >= 5 Cervical length < 2 cm Cervical length >= 2 cm Cervical length < 1.5 cm Cervical length >= 1.5 cm
Cervical length < 1.0 cm Cervical length >= 1.0 cm
Gestational age <41 weeks GA
≥ 41 weeks GA <42 weeks GA ≥ 42 weeks GA 37 weeks GA 38 weeks GA 39 weeks GA 40 weeks GA 41 weeks GA 42 weeks GA

B-14
Preeclampsia No preeclampsia GDM/DM NO GDM/DM AFI <= 5 AFI >5 to <20 AFI >= 20 Other Other Other Other Other Other Other Other Other Other Predictors of cesarean delivery in setting of IOL (NULLIPAROUS PATIENTS ONLY) IOL
n IOL %
IOL N
P-value
RR OR 95% CI lower
95% CI upper
aOR 95% CI lower
95% CI upper
Maternal age < 35 Maternal age ≥ 35 Maternal age < 20 Age 20-24 Age 25-29 Age 30-34 Age 35-39 Age ≥40 Asian Black White Hispanic/Latina Native American Other (specify)_____________
Nulliparous Multiparous Medical Insurance

B-15
Private Insurance Height < 5’0” Height ≥ 5’0” Underweight <BMI of 19 Normal weight BMI 20-24
Overweight BMI 25-29 Obese BMI >= 30 Bishop score <5 Bishop score >= 5 Cervical length < 2 cm Cervical length >= 2 cm Cervical length < 1.5 cm Cervical length >= 1.5 cm
Cervical length < 1.0 cm Cervical length >= 1.0 cm
Gestational age <41 weeks GA
≥ 41 weeks GA <42 weeks GA ≥ 42 weeks GA 37 weeks GA 38 weeks GA 39 weeks GA 40 weeks GA 41 weeks GA 42 weeks GA Preeclampsia No preeclampsia GDM/DM NO GDM/DM AFI <= 5 AFI >5 to <20 AFI >= 20 Other Other Other

B-16
Other Other Other Other Other Other Other Predictors of cesarean delivery in setting of IOL (MULTIPAROUS PATIENTS ONLY) IOL
n IOL %
IOL N
P-value
RR OR 95% CI lower
95% CI upper
aOR 95% CI lower
95% CI upper
Maternal age < 35 Maternal age ≥ 35 Maternal age < 20 Age 20-24 Age 25-29 Age 30-34 Age 35-39 Age ≥40 Asian Black White Hispanic/Latina Native American Other (specify)_____________
Nulliparous Multiparous Medical Insurance Private Insurance Height < 5’0” Height ≥ 5’0” Underweight <BMI of 19 Normal weight BMI 20-24
Overweight BMI 25-29 Obese BMI >= 30 Bishop score <5 Bishop score >= 5

B-17
Cervical length < 2 cm Cervical length >= 2 cm Cervical length < 1.5 cm Cervical length >= 1.5 cm
Cervical length < 1.0 cm Cervical length >= 1.0 cm
Gestational age <41 weeks GA
≥ 41 weeks GA <42 weeks GA ≥ 42 weeks GA 37 weeks GA 38 weeks GA 39 weeks GA 40 weeks GA 41 weeks GA 42 weeks GA Preeclampsia No preeclampsia GDM/DM NO GDM/DM AFI <= 5 AFI >5 to <20 AFI >= 20 Other Other Other Other Other Other Other Other Other Other

B-18
For which of the following outcomes were the predictors of delivery reported? a. Overall vaginal delivery b. Vaginal delivery within 24 hours c. Other (specify)
Predictors of cesarean delivery in setting of IOL (ALL PATIENTS - NOT STRATIFIED BY PARITY) IOL
n IOL %
IOL N
P-value
RR OR 95% CI lower
95% CI upper
aOR 95% CI lower
95% CI upper
Maternal age < 35 Maternal age ≥ 35 Maternal age < 20 Age 20-24 Age 25-29 Age 30-34 Age 35-39 Age ≥40 Asian Black White Hispanic/Latina Native American Other (specify)_____________
Nulliparous Multiparous Medical Insurance Private Insurance Height < 5’0” Height ≥ 5’0” Underweight <BMI of 19 Normal weight BMI 20-24
Overweight BMI 25-29 Obese BMI >= 30 Bishop score <5 Bishop score >= 5 Cervical length < 2 cm Cervical length >= 2 cm Cervical length < 1.5 cm

B-19
Cervical length >= 1.5 cm
Cervical length < 1.0 cm Cervical length >= 1.0 cm
Gestational age <41 weeks GA
≥ 41 weeks GA <42 weeks GA ≥ 42 weeks GA 37 weeks GA 38 weeks GA 39 weeks GA 40 weeks GA 41 weeks GA 42 weeks GA Preeclampsia No preeclampsia GDM/DM NO GDM/DM AFI <= 5 AFI >5 to <20 AFI >= 20 Other Other Other Other Other Other Other Other Other Other Predictors of cesarean delivery in setting of IOL (NULLIPAROUS PATIENTS ONLY) IOL
n IOL %
IOL N
P-value
RR OR 95% CI lower
95% CI upper
aOR 95% CI lower
95% CI upper
Maternal age < 35 Maternal age ≥ 35

B-20
Maternal age < 20 Age 20-24 Age 25-29 Age 30-34 Age 35-39 Age ≥40 Asian Black White Hispanic/Latina Native American Other (specify)_____________
Nulliparous Multiparous Medical Insurance Private Insurance Height < 5’0” Height ≥ 5’0” Underweight <BMI of 19 Normal weight BMI 20-24
Overweight BMI 25-29 Obese BMI >= 30 Bishop score <5 Bishop score >= 5 Cervical length < 2 cm Cervical length >= 2 cm Cervical length < 1.5 cm Cervical length >= 1.5 cm
Cervical length < 1.0 cm Cervical length >= 1.0 cm
Gestational age <41 weeks GA
≥ 41 weeks GA <42 weeks GA ≥ 42 weeks GA

B-21
37 weeks GA 38 weeks GA 39 weeks GA 40 weeks GA 41 weeks GA 42 weeks GA Preeclampsia No preeclampsia GDM/DM NO GDM/DM AFI <= 5 AFI >5 to <20 AFI >= 20 Other Other Other Other Other Other Other Other Other Other Predictors of cesarean delivery in setting of IOL (MULTIPAROUS PATIENTS ONLY) IOL
n IOL %
IOL N
P-value
RR OR 95% CI lower
95% CI upper
aOR 95% CI lower
95% CI upper
Maternal age < 35 Maternal age ≥ 35 Maternal age < 20 Age 20-24 Age 25-29 Age 30-34 Age 35-39 Age ≥40 Asian Black White Hispanic/Latina

B-22
Native American Other (specify)_____________
Nulliparous Multiparous Medical Insurance Private Insurance Height < 5’0” Height ≥ 5’0” Underweight <BMI of 19 Normal weight BMI 20-24
Overweight BMI 25-29 Obese BMI >= 30 Bishop score <5 Bishop score >= 5 Cervical length < 2 cm Cervical length >= 2 cm Cervical length < 1.5 cm Cervical length >= 1.5 cm
Cervical length < 1.0 cm Cervical length >= 1.0 cm
Gestational age <41 weeks GA
≥ 41 weeks GA <42 weeks GA ≥ 42 weeks GA 37 weeks GA 38 weeks GA 39 weeks GA 40 weeks GA 41 weeks GA 42 weeks GA Preeclampsia No preeclampsia GDM/DM NO GDM/DM

B-23
AFI <= 5 AFI >5 to <20 AFI >= 20 Other Other Other Other Other Other Other Other Other Other Any other comments?

B-24
Quality assessment and applicability forms I. Assessment of Quality of Individual Randomized Controlled Trials of Elective Induction of Labor 1) Was the comparison group expectant management? Yes No 2) Is there description of the method of randomization? Yes No 2a) If yes, Is there a fatal flaw in the approach (such as lottery cards)? Yes No 2b) Was randomization stratified by parity (or study includes only one parity group)? Yes No 3) Was there good balance achieved in parity, gestational age at randomization, maternal age, race/ethnicity, and insurance status/education, or less than a 20 percent difference between each arm?
Yes (all) No (for any) Not reported 4) Was masking of outcome assessors attempted? Yes No Not reported 4a) Was masking of outcome assessors accomplished? Yes No Not reported 5) Was loss to follow-up reported? Yes No 5a) If yes, what was follow-up at different time periods? Immediate Postpartum <80% 80-90% 90-95% >95% 4-8 wks Postpartum <80% 80-90% 90-95% >95% N/A 6) How many total subjects in the study? <400 400-1000 >1000 6a) Was a sample size calculation performed a priori? Yes No 6b) If yes, was sample size achieved? Yes No N/A 7) Were statistical tests utilized? Yes No 7a) Was the analysis conducted as intention-to-treat? Yes No
7b) If there was any lack of balance in randomization, were multivariable analyses utilized to control for confounding variables? Yes No N/A 7c) Were analyses stratified by parity (or study includes only one parity group)?
Yes No Overall Quality Good Fair Poor

B-25
II. Assessment of Quality of Observational studies of Elective Induction of Labor 1) Was the comparison group expectant management? Yes No N/A 2) Was the study prospective? Yes No 3) Were the study groups comparable at baseline in terms of parity, maternal age, race/ethnicity, and insurance status/education as described/shown in a table?
Yes (all) No (for any) Not reported N/A 4) Was loss to follow-up reported? Yes No N/A (retrospective study) 4a) If yes, what was follow-up at different time periods? Immediate Postpartum <80% 80-90% 90-95% >95% 4-8 wks Postpartum <80% 80-90% 90-95% >95% N/A 5) How many total subjects in the study? <400 400-1000 >1000 5a) Was a sample size calculation performed a priori? Yes No 5b) If yes, was sample size achieved? Yes No N/A 6) Were statistical tests utilized? Yes No 6a) Were multivariable analyses utilized to control for confounding variables?
Yes No 6b) Were analyses stratified by parity (or study includes only one parity group)?
Yes No Overall Quality Good Fair Poor

B-26
III. Assessment of Applicability of Individual Studies of Induction of Labor 1) This study examined the following:
a. Mode of delivery/maternal outcomes (KQ1)
b. Neonatal outcomes (KQ2)
c. Factors associated with mode of delivery (KQ3) Key Questions 1 and 2 2) Was the comparison group expectant management? Yes No N/A (If No, then poor applicability for KQs 1 and 2, if yes then good) Key Question 3 3) Was this a study of elective induction of labor? Yes No (If No, not used for KQs 1 and 2 and baseline fair applicability for KQ 3 and if yes, then good applicability for KQ3) For All Key Questions 4) Was any of the clinical care in the study provided before 1985? Yes No (If the answer to #4 is yes, then applicability downgraded one step good to fair or fair to poor) 5) Was the clinical care provided in the U.S. ? Yes No (If the answer to #5 is no, then applicability downgraded one step good to fair or fair to poor) 6) Were prostaglandins or other cervical ripening utilized in induction of labor? Yes No (If the answer to #6 is no, then applicability downgraded one step good to fair or fair to poor) Applicability KQ1 and 2 Good Fair Poor Applicability KQ3 Good Fair Poor 7) Was there a stratified analysis of women delivered prior to 41 weeks of gestation or was the population all prior to 41 weeks of gestation in the induction group? Yes No (If yes, then maintain applicability for KQ1 and 2, If no, then poor applicability to < 41 weeks) Applicability to pregnancies prior to 41 weeks of gestation Good Fair Poor (for KQ1 and 2)

B-27

Appendix C. Additional Analyses for Systematic Review Appendix Figure 1. Randomized controlled trials of elective induction of labor versus expectant management: cesarean delivery (risk difference)
C-1
Heterogeneity statistics: Q-value 9.818, P-value 0.278, I-squared 18.520 CS: Cesarean section; Mgt: Management
Study Name Statistics for each study Event / Total Risk difference and 95% CI
Risk Lower Upper Expectant Induced difference limit limit p-Value Mgt CS CS
Cole 0.032 -0.030 0.094 0.312 9 / 117 5 / 111Tylleskar 0.000 -0.045 0.045 1.000 0 / 41 0 / 43Dyson 0.129 0.038 0.219 0.005 41 / 150 22 / 152Hannah 0.033 0.005 0.062 0.020 418 / 1706 360 / 1701NICHHD -0.024 -0.100 0.051 0.527 32 / 174 55 / 264Egarter 0.007 -0.018 0.033 0.587 3 / 165 2 / 180Nielsen 0.004 -0.063 0.071 0.912 8 / 110 8 / 116Heimstad 0.020 -0.037 0.076 0.495 33 / 254 28 / 254Gelisen 0.027 -0.038 0.091 0.420 66 / 300 58 / 300
0.019 0.002 0.037 0.033 610 / 3017 538 / 3121
-0.25 -0.13 0.00 0.13 0.25
Higher for Induced Lower for Induced
Summary

Appendix Figure 2. Randomized controlled trials of elective induction of labor versus expectant management: cesarean delivery, stratified by gestational age (risk difference)
Heterogeneity statistics Q value P-value I-squared >= 41 weeks 7.305 0.199 31.550 < 41 weeks 0.697 0.706 0.00
C-2
Study Name Statistics for each study Event / Total Risk difference and 95% CI
Risk Lower Upper Controls Induced difference limit limit p-Value CS CS
Dyson 0.129 0.038 0.219 0.005 41 / 150 22 / 152Hannah 0.033 0.005 0.062 0.020 418 / 1706 360 / 1701NICHHD -0.024 -0.100 0.051 0.527 32 / 174 55 / 264Nielsen 0.004 -0.063 0.071 0.912 8 / 110 8 / 116Heimstad 0.020 -0.037 0.076 0.495 33 / 254 28 / 254Gelisen 0.027 -0.038 0.091 0.420 66 / 300 58 / 300
0.027 -0.001 0.056 0.058 598 / 2694 531 / 2787C l 0 032 0 030 0 094 0 312 9 / 117 5 / 111
Cole 0.032 -0.030 0.094 0.312 9 / 117 5 / 111Tylleskar 0.000 -0.045 0.045 1.000 0 / 41 0 / 43Egarter 0.007 -0.018 0.033 0.587 3 / 165 2 / 180
0.008 -0.013 0.029 0.431 12 / 323 7 / 334
-0.50 -0.25 0.00 0.25 0.50
Higher for Induced Lower for Induced
>= 41 weeks
< 41 weeks
Summary
Summary

Appendix Figure 3. Randomized controlled trials of elective induction of labor versus expectant management: cesarean delivery, stratified by study year (risk difference)
Heterogeneity statistics Q value P-value I-squared 1990 or earlier 9.567 0.088 47.738 After 1990 0.244 0.885 0.00
Study Name Statistics for each study Event / Total Risk difference and 95% CI
Risk Lower Upper Expectant Induced difference limit limit p-Value Mgt CS CS
Cole 0.032 -0.030 0.094 0.312 9 / 117 5 / 111Tylleskar 0.000 -0.045 0.045 1.000 0 / 41 0 / 43Dyson 0.129 0.038 0.219 0.005 41 / 150 22 / 152Hannah 0.033 0.005 0.062 0.020 418 / 1706 360 / 1701NICHHD -0.024 -0.100 0.051 0.527 32 / 174 55 / 264Egarter 0.007 -0.018 0.033 0.587 3 / 165 2 / 180
0.021 -0.005 0.047 0.107 503 / 2353 444 / 2451
199
Nielsen 0.004 -0.063 0.071 0.912 8 / 110 8 / 116Heimstad 0.020 -0.037 0.076 0.495 33 / 254 28 / 254Gelisen 0.027 -0.038 0.091 0.420 66 / 300 58 / 300
0.017 -0.019 0.053 0.347 107 / 664 94 / 670
0 or earlier
After 1990
Summary
Summary
-0.25 -0.13 0.00 0.13 0.25
Higher for Induced Lower for Induced
C-3

Appendix Figure 4. Randomized controlled trials of elective induction of labor versus expectant management: cesarean delivery, stratified by study location (risk difference)
Heterogeneity statistics Q value P-value I-squared Non-U.S. 2.722 0.743 0.00 U.S. 7.043 0.03 71.603
C-4
Study Name Statistics for each study Event / Total Risk difference and 95% CI
Risk Lower Upper Expectant Induced difference limit limit p-Value Mgt CS CS
Cole 0.032 -0.030 0.094 0.312 9 / 117 5 / 111Tylleskar 0.000 -0.045 0.045 1.000 0 / 41 0 / 43Hannah 0.033 0.005 0.062 0.020 418 / 1706 360 / 1701Egarter 0.007 -0.018 0.033 0.587 3 / 165 2 / 180Heimstad 0.020 -0.037 0.076 0.495 33 / 254 28 / 254Gelisen 0.027 -0.038 0.091 0.420 66 / 300 58 / 300
0.018 0.002 0.034 0.024 529 / 2583 453 / 2589
Dyson 0.129 0.038 0.219 0.005 41 / 150 22 / 152NICHHD -0.024 -0.100 0.051 0.527 32 / 174 55 / 264Nielsen 0.004 -0.063 0.071 0.912 8 / 110 8 / 116
0.032 -0.052 0.116 0.455 81 / 434 85 / 532
-0.25 -0.13 0.00 0.13 0.25
Higher for Induced Lower for Induced
Non-U.S.
U.S.
Summary
Summary

Appendix Figure 5. Randomized controlled trials of elective induction of labor versus expectant management: operative vaginal delivery (risk difference) Appendix Figure 5. Observational studies of elective induction of labor versus spontaneous labor: cesarean delivery (risk difference)
Heterogeneity statistics: Q-value 3.165, P-value 0.675, I-squared 0.00 OVD: Operative vaginal delivery; Mgt: Management
Study Name Statistics for each study Event / Total Risk difference and 95% CI
Risk Lower Upper Expectant Induced difference limit limit p-Value Mgt OVD OVD
ole -0.084 -0.198 0.030 0.149 26 / 117 34 / 111Tylleskar 0.026 -0.054 0.105 0.531 2 / 41 1 / 43Hannah -0.015 -0.045 0.015 0.328 449 / 1706 473 / 1701Egarter -0.004 -0.034 0.026 0.789 3 / 165 4 / 180Nielsen 0.013 -0.056 0.082 0.715 9 / 110 8 / 116Heimstad -0.020 -0.075 0.036 0.488 27 / 254 32 / 254
-0.009 -0.027 0.009 0.329 516 / 2393 552 / 2405
C
-0.25 -0.13 0.00 0.13 0.25
Higher for Induced Lower for Induced
Summary
C-5

Appendix Figure 6. Observational studies of elective induction of labor versus expectant management: cesarean delivery (risk difference)
C-6
Study Name Statistics for each study Event / Total Risk difference and 95% CI
Risk Lower Upper Controls Induced difference limit limit p-Value CS CS
Booth 0.019 -0.010 0.047 0.200 7 / 213 3 / 213Belsky 0.081 0.023 0.140 0.007 101 / 918 1 / 35Vierhout -0.010 -0.032 0.012 0.382 1 / 156 3 / 184Dublin -0.036 -0.047 -0.024 0.000 464 / 9066 233 / 2687Boulvain -0.041 -0.064 -0.017 0.001 122 / 3353 41 / 531Yeast -0.012 -0.029 0.005 0.151 509 / 9723 56 / 864Macer -0.036 -0.094 0.023 0.231 28 / 253 37 / 253Wilailak -0.026 -0.092 0.039 0.431 40 / 249 49 / 262Robson -0.018 -0.071 0.035 0.509 100 / 1092 16 / 146Prysak -0.037 -0.069 -0.004 0.026 23 / 461 40 / 461van Gemund -0.139 -0.204 -0.074 0.000 1 / 122 18 / 122Maslow -0.068 -0.108 -0.028 0.001 37 / 872 29 / 263
-0.025 -0.043 -0.007 0.006 1433 / 26478 526 / 6021
-0.25 -0.13 0.00 0.13 0.25
Higher for Induced Lower for Induced
Heterogeneity statistics: Q-value 47.269, P-value 0.00, I-squared 76.729 CS: Cesarean section
Summary

Appendix Figure 7. Observational studies of elective induction of labor versus spontaneous labor: cesarean delivery among nulliparous women (risk difference)
C-7
Heterogeneity statistics: Q-value 56.304, P-value 0.00, I-squared 82.239 CS: Cesarean section
Study Name Statistics for each study Event / Total Risk difference and 95% CI
Risk Lower Upper Controls Induced difference limit limit p-Value CS CS
Dublin -0.095 -0.121 -0.069 0.000 355 / 3603 197 / 1017Boulvain -0.098 -0.147 -0.049 0.000 113 / 1724 38 / 232Yeast -0.084 -0.136 -0.031 0.002 322 / 4086 32 / 197Macer -0.117 -0.257 0.024 0.103 17 / 77 26 / 77Prysak -0.062 -0.125 0.001 0.055 20 / 210 33 / 210Cammu -0.034 -0.043 -0.025 0.000 500 / 7683 762 / 7683Seyb -0.097 -0.161 -0.032 0.003 88 / 1124 25 / 143van Gemund -0.304 -0.516 -0.093 0.005 1 / 23 8 / 23Maslow -0.115 -0.192 -0.037 0.004 21 / 349 18 / 103Luthy -0.096 -0.135 -0.057 0.000 409 / 2673 135 / 542Vrouenraets -0.115 -0.156 -0.075 0.000 92 / 765 147 / 624
-0.091 -0.121 -0.061 0.000 1938 / 22317 1421 / 10851
-0.25 -0.13 0.00 0.13 0.25
Higher for Induced Lower for Induced
Summary

Appendix Figure 8. Observational studies of elective induction of labor versus spontaneous labor: cesarean delivery among nulliparous women stratified by study location (odds ratio)
Heterogeneity statistics Q-value P-value I-squared Non-U.S. 11.130 0.004 82.031 U.S. 6.899 0.439 0.00 CS: Cesarean section; U.S.: United States
C-8
Study Name Statistics for each study Event / Total Odds ratio and 95% CI
Odds Lower Upper Controls Induced ratio limit limit p-Value CS CS
Boulvain 0.358 0.241 0.532 0.000 113 / 1724 38 / 232Cammu 0.632 0.562 0.711 0.000 500 / 7683 762 / 7683Vrouenraets 0.444 0.333 0.590 0.000 92 / 765 147 / 624
0.482 0.340 0.684 0.000 705 / 10172 947 / 8539
Dublin 0.455 0.376 0.550 0.000 355 / 3603 197 / 1017Yeast 0.441 0.297 0.655 0.000 322 / 4086 32 / 197Macer 0.556 0.272 1.138 0.108 17 / 77 26 / 77Prysak 0.565 0.312 1.021 0.058 20 / 210 33 / 210Seyb 0.401 0.247 0.650 0.000 88 / 1124 25 / 143van Gemund 0.085 0.010 0.754 0.027 1 / 23 8 / 23Maslow 0.302 0.154 0.593 0.000 21 / 349 18 / 103Luthy 0.545 0.437 0.680 0.000 409 / 2673 135 / 542
0.474 0.419 0.536 0.000 1233 / 12145 474 / 2312
0.1 0.2 0.5 1 2 5 10
Higher for Induced Lower for Induced
Non-U.S.
U.S.
Summary
Summary

Appendix Figure 9. Observational studies of elective induction of labor versus spontaneous labor: cesarean delivery among nulliparous women stratified by study location (risk difference)
Heterogeneity statistics Q-value P-value I-squared Non-U.S. 20.470 0.00 90.229 U.S. 5.239 0.62 0.00 CS: Cesarean section; U.S.: United States
C-9
Study Name Statistics for each study Event / Total Risk difference and 95% CI
Risk Lower Upper Controls Induced difference limit limit p-Value CS CS
Boulvain -0.098 -0.147 -0.049 0.000 113 / 1724 38 / 232Cammu -0.034 -0.043 -0.025 0.000 500 / 7683 762 / 7683Vrouenraets -0.115 -0.156 -0.075 0.000 92 / 765 147 / 624
-0.080 -0.140 -0.020 0.009 705 / 10172 947 / 8539
Dublin -0.095 -0.121 -0.069 0.000 355 / 3603 197 / 1017Yeast -0.084 -0.136 -0.031 0.002 322 / 4086 32 / 197Macer -0.117 -0.257 0.024 0.103 17 / 77 26 / 77Prysak -0.062 -0.125 0.001 0.055 20 / 210 33 / 210Seyb -0.097 -0.161 -0.032 0.003 88 / 1124 25 / 143van Gemund -0.304 -0.516 -0.093 0.005 1 / 23 8 / 23Maslow -0.115 -0.192 -0.037 0.004 21 / 349 18 / 103Luthy -0.096 -0.135 -0.057 0.000 409 / 2673 135 / 542
-0.094 -0.112 -0.077 0.000 1233 / 12145 474 / 2312
-0.25 -0.13 0.00 0.13 0.25
Higher for Induced Lower for Induced
Non-U.S.
U.S.
Summary
Summary
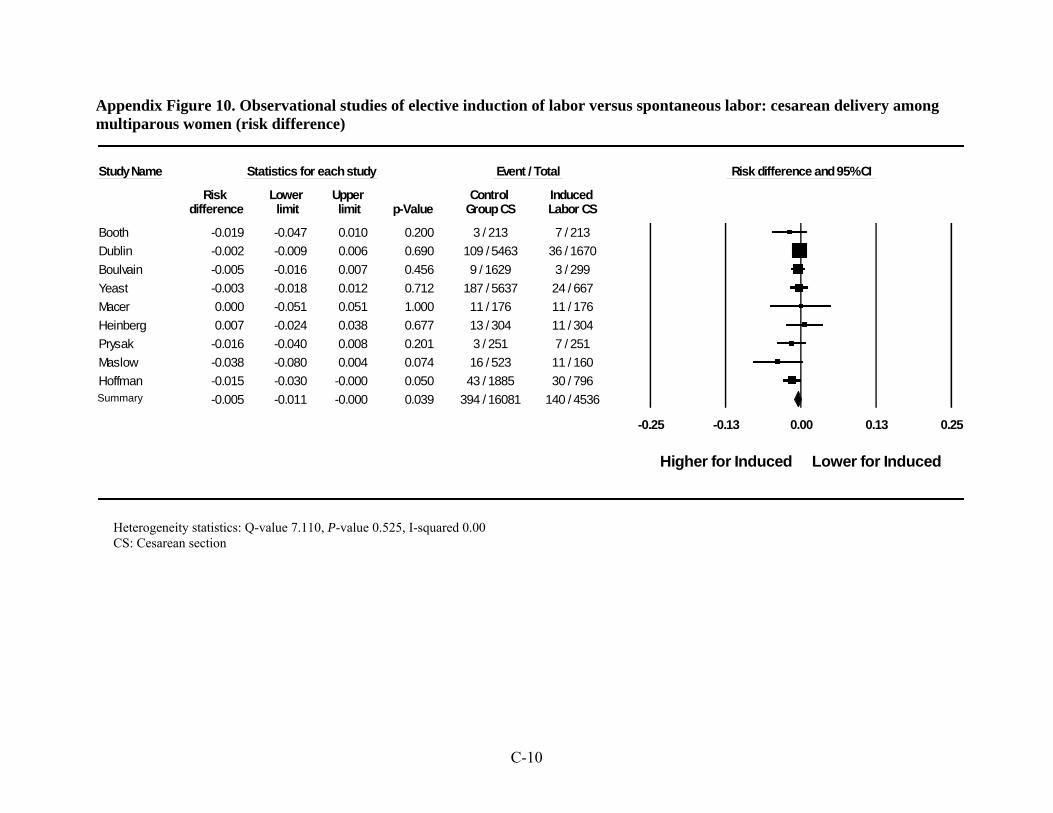
Appendix Figure 10. Observational studies of elective induction of labor versus spontaneous labor: cesarean delivery among multiparous women (risk difference)
C-10
Study Name Statistics for each study Event / Total Risk difference and 95% CI
Risk Lower Upper Control Induced difference limit limit p-Value Group CS Labor CS
Booth -0.019 -0.047 0.010 0.200 3 / 213 7 / 213Dublin -0.002 -0.009 0.006 0.690 109 / 5463 36 / 1670Boulvain -0.005 -0.016 0.007 0.456 9 / 1629 3 / 299Yeast -0.003 -0.018 0.012 0.712 187 / 5637 24 / 667Macer 0.000 -0.051 0.051 1.000 11 / 176 11 / 176Heinberg 0.007 -0.024 0.038 0.677 13 / 304 11 / 304Prysak -0.016 -0.040 0.008 0.201 3 / 251 7 / 251Maslow -0.038 -0.080 0.004 0.074 16 / 523 11 / 160Hoffman -0.015 -0.030 -0.000 0.050 43 / 1885 30 / 796
-0.005 -0.011 -0.000 0.039 394 / 16081 140 / 4536
-0.25 -0.13 0.00 0.13 0.25
Higher for Induced Lower for Induced
Heterogeneity statistics: Q-value 7.110, P-value 0.525, I-squared 0.00 CS: Cesarean section
Summary

Appendix Figure 11. Observational studies of elective induction of labor versus spontaneous labor: operative vaginal delivery (risk difference)
C-11
Heterogeneity statistics: Q-value 7.592, P-value 0.27, I-squared 20.972 OVD: Operative vaginal delivery
Study Name Statistics for each study Event / Total Risk difference and 95% CI
Risk Lower Upper Controls Induced difference limit limit p-Value OVD OVD
Booth -0.019 -0.079 0.041 0.540 22 / 213 26 / 213Dublin -0.023 -0.039 -0.008 0.003 1398 / 9583 487 / 2881Boulvain 0.021 -0.021 0.062 0.327 1010 / 3353 149 / 531Macer -0.067 -0.142 0.007 0.077 53 / 253 70 / 253Robson -0.023 -0.081 0.035 0.434 117 / 1092 19 / 146Prysak 0.013 -0.029 0.055 0.545 59 / 461 53 / 461van Gemund -0.025 -0.092 0.043 0.473 8 / 122 11 / 122
-0.014 -0.032 0.004 0.125 2667 / 15077 815 / 4607
-0.25 -0.13 0.00 0.13 0.25
Higher for Induced Lower for Induced
Summary

Appendix Figure 12. Observational studies of elective induction of labor versus spontaneous labor: operative vaginal delivery among nulliparous women (risk difference)
C-12
Heterogeneity statistics: Q-value 1.902, P-value 0.93, I-squared 0.00 OVD: Operative vaginal delivery
Study Name Statistics for each study Event / Total Risk difference and 95% CI
Risk Lower Upper Control Induced difference limit limit p-Value Group OVD Labor OVD
Vrouenraets 0.015 -0.049 0.078 0.650 161 / 765 37 / 189van Gemund -0.087 -0.305 0.131 0.434 3 / 23 5 / 23Cammu -0.025 -0.040 -0.011 0.001 2236 / 7683 2429 / 7683Macer -0.052 -0.201 0.097 0.495 24 / 77 28 / 77
-0.024 -0.038 -0.010 0.001 2424 / 8548 2499 / 7972
-0.25 -0.13 0.00 0.13 0.25
Higher for Induced Lower for Induced
Summary

Appendix Figure 13. Randomized controlled trials of elective induction of labor versus expectant management: 5-minute Apgar score less than 7 (risk difference)
C-13
Study Name Statistics for each study Event / Total Odds ratio and 95% CI
Odds Lower Upper Controls Induced ratio limit limit p-Value Apgar Apgar
Heimstad 1.339 0.297 6.043 0.704 4 / 254 3 / 254Hannah 1.114 0.587 2.113 0.742 20 / 1698 18 / 1700Dyson 1.531 0.252 9.293 0.644 3 / 150 2 / 152
1.178 0.673 2.063 0.567 27 / 2102 23 / 2106
0.01 0.1 1 10 100
Higher for Induced Lower for Induced
Heterogeneity statistics: Q-value 0.138, P-value 0.933, I-squared 0.00
Summary

Appendix Figure 14. Randomized controlled trials of elective induction of labor versus expectant management: meconium-stained amniotic fluid (risk difference)
C-14
Study Name Statistics for each study Event / Total Risk difference and 95% CI
Risk Lower Upper Expectant Induced Labor difference limit limit p-Value Mgt Meconium Meconium
Cole 0.102 0.043 0.162 0.001 13 / 117 1 / 111Dyson 0.276 0.175 0.377 0.000 70 / 150 29 / 152Hannah 0.037 0.007 0.067 0.015 490 / 1706 426 / 1701NICHHD 0.134 0.045 0.222 0.003 62 / 171 60 / 262Heimstad 0.071 -0.009 0.151 0.082 87 / 254 69 / 254Gelisen 0.110 0.054 0.166 0.000 61 / 300 28 / 300
0.112 0.055 0.169 0.000 783 / 2698 613 / 2780
-0.50 -0.25 0.00 0.25 0.50
Higher for Induced Lower for Induced
Heterogeneity statistics: Q-value 25.407, P-value 0.00, I-squared 80.321 Meconium: Meconium-stained amniotic fluid
Summary

Appendix Figure 15. Randomized controlled trials of elective induction of labor versus expectant management: meconium aspiration syndrome (risk difference)
C-15
Study name Statistics for each study Events / Total Risk difference and 95% CI
Risk Lower Upper Expectant Mgt Induced Meconium difference limit limit p-Value Meconium aspiration aspiration
Dyson 0.040 0.006 0.074 0.020 6 / 150 0 / 152Hannah -0.001 -0.016 0.015 0.947 95 / 1698 96 / 1700NICHHD 0.004 -0.015 0.023 0.687 2 / 175 2 / 265Heimstad -0.008 -0.034 0.019 0.559 5 / 254 7 / 254Gelisen 0.027 0.001 0.052 0.042 12 / 300 4 / 300
0.009 -0.005 0.024 0.209 120 / 2577 109 / 2671
-0.50 -0.25 0.00 0.25 0.50
Higher for Induced Lower for Induced
Heterogeneity statistics: Q-value 8.181, P-value 0.085, I-squared 51.109 Meconium aspiration: Meconium aspiration syndrome
Summary
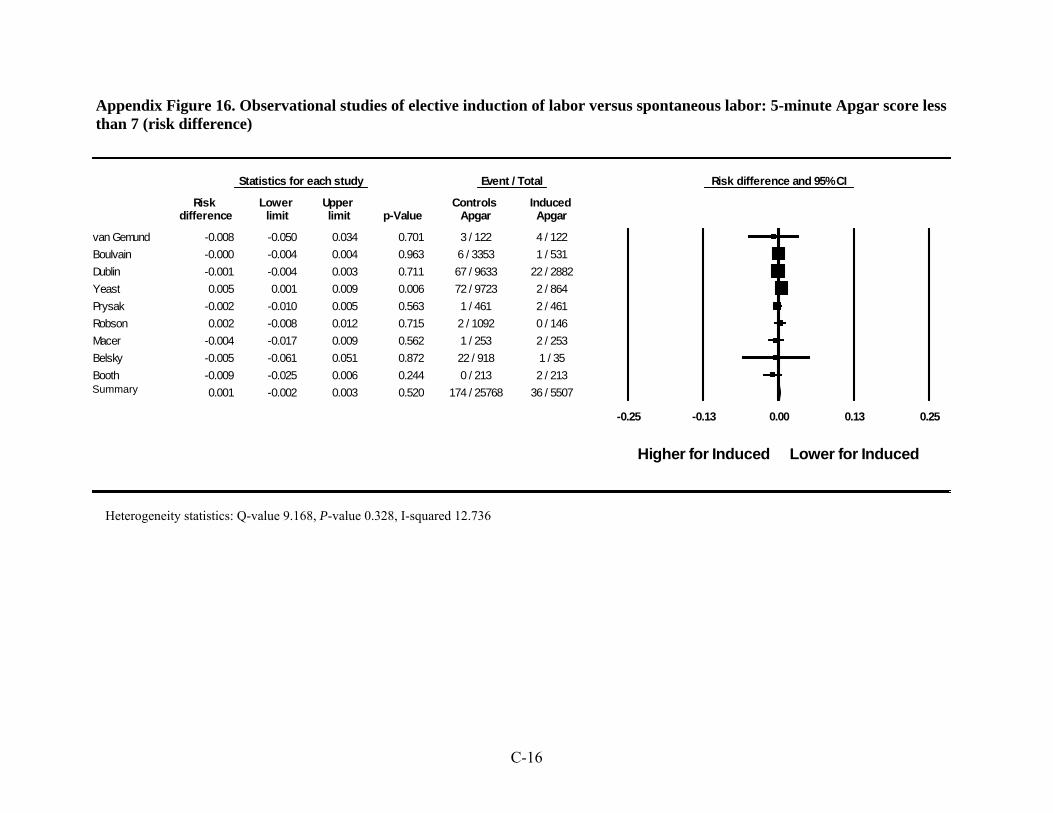
Appendix Figure 16. Observational studies of elective induction of labor versus spontaneous labor: 5-minute Apgar score less than 7 (risk difference)
C-16
Statistics for each study Event / Total Risk difference and 95% CI
Risk Lower Upper Controls Induced difference limit limit p-Value Apgar Apgar
van Gemund -0.008 -0.050 0.034 0.701 3 / 122 4 / 122Boulvain -0.000 -0.004 0.004 0.963 6 / 3353 1 / 531Dublin -0.001 -0.004 0.003 0.711 67 / 9633 22 / 2882Yeast 0.005 0.001 0.009 0.006 72 / 9723 2 / 864Prysak -0.002 -0.010 0.005 0.563 1 / 461 2 / 461Robson 0.002 -0.008 0.012 0.715 2 / 1092 0 / 146Macer -0.004 -0.017 0.009 0.562 1 / 253 2 / 253Belsky -0.005 -0.061 0.051 0.872 22 / 918 1 / 35Booth -0.009 -0.025 0.006 0.244 0 / 213 2 / 213
0.001 -0.002 0.003 0.520 174 / 25768 36 / 5507
-0.25 -0.13 0.00 0.13 0.25
Higher for Induced Lower for Induced
Summary
Heterogeneity statistics: Q-value 9.168, P-value 0.328, I-squared 12.736

Appendix Figure 17. Observational studies of elective induction of labor versus spontaneous labor: meconium-stained amniotic fluid (risk difference)
Heterogeneity statistics: Q-value 17.012, P-value 0.001, I-squared 82.366 Meconium: meconium-stained amniotic fluid
Study Name Statistics for each study Event / Total Risk difference and 95% CI
Risk Lower Upper Controls Induced Labor difference limit limit p-Value Meconium Meconium
Vierhout 0.056 0.007 0.105 0.026 13 / 156 5 / 184Dublin 0.012 0.003 0.021 0.006 546 / 9648 128 / 2886Macer 0.095 0.040 0.150 0.001 41 / 253 17 / 253van Gemund 0.123 0.036 0.210 0.005 25 / 122 10 / 122
0.063 0.010 0.115 0.019 625 / 10179 160 / 3445
-0.25 -0.13 0.00 0.13 0.25
Higher for Induced Lower for Induced
Summary
C-17

Appendix Figure 18. Observational studies of elective induction of labor versus spontaneous labor: NICU admissions (risk difference)
C-18
Heterogeneity statistics: Q-value 16.938, P-value 0.005, I-squared 70.481 NICU: Neonatal intensive care unit
Study name Statistics for each study Events / Total Risk difference and 95% CI
Risk Lower Upper Controls NICU Induced NICU difference limit limit p-Value admission admission
Boulvain -0.014 -0.032 0.004 0.132 93 / 3353 22 / 531Yeast 0.022 0.010 0.033 0.000 470 / 9723 23 / 864Macer 0.016 -0.006 0.038 0.153 6 / 253 2 / 253Robson -0.006 -0.063 0.051 0.834 128 / 1092 18 / 146Prysak -0.007 -0.032 0.019 0.623 18 / 461 21 / 461van Gemund -0.074 -0.154 0.007 0.073 10 / 122 19 / 122
0.001 -0.018 0.019 0.938 725 / 15004 105 / 2377
-0.25 -0.13 0.00 0.13 0.25
Higher for Induced Lower for Induced
Summary

Appendix Figure 19. Cesarean deliveries (following induction) by parity: observational studies (risk difference)
C-19
Heterogeneity statistics: Q-value 667.544, P-value 0.00, I-squared 97.154 CD: Cesarean delivery
Study Name Statistics for each study Event / Total Risk difference and 95% CI
Risk Lower Upper Multiparous Nulliparous difference limit limit p-Value CD CD
Tan -0.270 -0.406 -0.134 0.000 10 / 87 25 / 65Dodd -0.207 -0.270 -0.144 0.000 31 / 255 120 / 365Peregrine -0.370 -0.464 -0.277 0.000 9 / 110 71 / 157Nuthalapaty -0.742 -0.806 -0.678 0.000 19 / 149 313 / 360Chan -0.228 -0.280 -0.176 0.000 19 / 306 116 / 400Heffner -0.202 -0.222 -0.182 0.000 86 / 1920 550 / 2227Ware -0.483 -0.676 -0.289 0.000 5 / 45 19 / 32Buist -0.126 -0.202 -0.050 0.001 32 / 212 62 / 224Xenakis -0.099 -0.165 -0.032 0.004 55 / 345 65 / 252Alberico -0.220 -0.331 -0.109 0.000 2 / 43 24 / 90Abou el-Leil -0.056 -0.155 0.042 0.260 11 / 139 8 / 59Macer -0.275 -0.387 -0.164 0.000 11 / 176 26 / 77Boyd -0.006 -0.025 0.014 0.569 689 / 3354 766 / 3631Dhall 0.001 -0.116 0.118 0.991 12 / 63 26 / 137Arulkumaran -0.163 -0.206 -0.121 0.000 39 / 498 135 / 559Orhue -0.061 -0.110 -0.011 0.017 57 / 705 32 / 226Anderson 0.012 -0.078 0.103 0.795 3 / 42 6 / 101Ekman 0.000 -0.140 0.140 1.000 2 / 27 2 / 27Nooh -0.242 -0.413 -0.070 0.006 5 / 61 11 / 34Onifade -0.153 -0.292 -0.014 0.032 11 / 113 11 / 44
-0.192 -0.266 -0.118 0.000 1108 / 8650 2388 / 9067-0.50 -0.25 0.00 0.25 0.50
Lower in Multiparous Higher in Multiparous
Summary

Appendix Table 1. Studies of induction of labor reporting predictors of cesarean delivery: Study information
Article Year of Public-
tion
Study Period Location Setting Control
Group Sample size Induction Method
Study Quality
Applic-
ability to
KQ3 Control
Group Induced Labor
Abou el-Leil et al.1 1993 1988-1999 Kuwait NS - - 198
Oxytocin, AROM, PGE2 gel
Poor Poor
Ahner et al.2# 1995 NS Austria Academic Center - - 64 PGE2 gel Poor Poor Alberico et al.3* 1997 1992-1996 Italy Academic Center - - 133 PGE2 gel Poor Poor Alchalabi et al.4 2006 NS Jordan Academic Center - - 180 PGE2 gel Fair Poor Anderson5
1965 NS United Kingdom NS - - 143 Oxytocin,
AROM Fair Poor
Arulkumaran et al.6 and Gibb et al.7
1985 Jan 1982-Mar 1983 Singapore Academic Center - - 1057 Oxytocin,
AROM Fair Poor
Ben-Haroush et al.8* 2004 Jan 1998-
Dec 2000 Israel NS SL 574 135 Oxytocin, PGE2 gel Fair Poor
Boyd et al.9 1988 1978-1985 Canada Academic Center SL 5368 1455 NS Fair Poor Buist10* 1999 Mar 1997-
Jun 1997 New Zealand NS SL 1375 438 NS Fair Poor
Caughey et al.11 2006 1986-2001 United States Academic Center EM 16,445 2932 NS Fair Fair Chan et al.12‡
2004 1998-2000 Hong Kong Community Hospital SL 7920 706
Oxytocin, AROM, PGE2 gel
Fair Poor
Dhall et al.13* 1987 NS India Academic Center - - 200 Oxytocin, AROM Poor Poor
Dodd et al.142006 2001-2004 Australia Academic Center - - 620 Misoprostol,
PGE2 gel Good Poor
Ecker et al.15± 2001 1998-1998 United States Academic Center SL 2222 1206 NS Poor Poor
Edris et al.16± 2006 Apr 1998-Mar 2000 Canada Academic Center - - 339 Oxytocin,
PGE2 gel Poor Fair
C-20

Appendix Table 1. Studies of induction of labor reporting predictors of cesarean delivery: Study information (continued)
Article Year of Public-ation
Study Period Location Setting Control
Group Sample size Induction Method
Study Quality
Applic-
ability to
KQ3 Control
Group Induced Labor
Ekman et al.17 1983 Feb 1980-
Feb 1981
Sweden or Denmark (Unclear)
NS - - 54 Oxytocin, PGE2 gel Poor Poor
Gabriel et al.18 2003 1999-2001 France Academic Center - - 179
Oxytocin, Misoprostol,
PGE2 gel Poor Poor
Garite et al.19
1996 Jul 1994-Jun 1995 Mexico Community
Hospital - - 160 Oxtyocin, AROM, PGE2 gel
Poor Poor
Goeschen and Pakzad20 1980 1976-1978 Germany Academic Center - - 453 NS Fair Poor
Heffner et al.21 2003 1998-1999 United States Academic Center - - 4147 NS Fair Fair
Heimstad et al.22‡ 2006 1990-2001 Norway Academic Center - - 2500
Oxytocin, AROM, PGE2 gel
Fair Poor
Johnson et al.23 2003 1997-1999 United States Community
Hospital SL 4635 2647 Oxytocin,
Misoprostol, PGE2 gel
Fair Fair
Morgan and Thurnau24 1988 1986-1987 United States Academic Center - - 49 Oxytocin,
AROM Poor Poor
Nooh et al.252005 May 2003-
Jun 2003 United
Kingdom Community
Hospital - - 95 Oxytocin, PGE2 gel Poor Poor
C-21

Appendix Table 1. Studies of induction of labor reporting predictors of cesarean delivery: Study information (continued)
Article Year of Public-ation
Study Period Location Setting Control
Group Sample size Induction Method
Study Quality
Applic-
ability to
KQ3 Control
Group Induced Labor
Nuthalapaty et al.26
2004 1997-1999 United States Academic Center - - 509
Oxytocin, AROM, extra-
amniotic saline
infusion
Fair Fair
Ofinade271970 Jan 1967-
Dec 1968 Nigeria Academic Center - - 159 Oxytocin, AROM Poor Poor
Orhue et al.28
1984 1974-1981 Nigeria Academic Center - - 931 Oxytocin, AROM,
ergonovine Fair Poor
Peregrine et al.29, 30* 2006 Jun 2001-
Nov 2003 United
Kingdom Academic Center - - 267 Oxytocin, AROM, PGE2 gel
Good Poor
Rizzo et al.31,
32× 2000 NS Italy NS - - 81 PGE2 gel Poor Fair
1992 NS United Kingdom Academic Center - - 100
Oxytocin, AROM, PGE2 gel
Poor Poor Saunders et al.33
Schreyer et al.34* 1991 1988-1989 Israel Academic Center - - 65 Oxytocin Poor Poor
Simon and Grobman35
2005 2002-2003 United States Academic Center - - 397
Oxytocin, AROM, extra-
amniotic saline
infusion
Poor Fair
C-22

Appendix Table 1. Studies of induction of labor reporting predictors of cesarean delivery: Study information (continued)
Article Year of Public-ation
Study Period Location Setting Control
Group Sample size Induction Method
Study Quality
Applic-
ability to
KQ3 Control
Group Induced Labor
Tan et al.36 2006 Jan 2003-
Aug 2004 Malaysia Academic Center - - 152 Oxytocin, AROM, PGE2 gel
Fair Poor
Ware and Raynor37 2000 NS United States NS - - 77 Oxytocin,
Misoprostol Fair Poor
Wigton and Wolk38* 1994 1989-1989 United States Community
Hospital - - 201 Oxytocin, AROM Poor Fair
Xenakis et al.39* 1997 1993-1995 United States NS - - 597
Oxytocin, AROM, PGE2 gel
Good Fair
KQ=Key Question; NS=not specified; AROM=artificial rupture of membranes; PGE2=prostaglandin; SL=spontaneous labor; EM=expectant management #Also reports predictors of vaginal delivery within 24 hours ×Also reports predictors of overall vaginal delivery ‡Also reports predictors of spontaneous vaginal delivery in the setting of induction of labor ±Nulliparous women only
C-23

C-24
Appendix Table 2. Studies of induction of labor reporting predictors of induction success or failure: Study information
Article
Year of
Public-tion
Study Period Location Setting Control
Group Sample size Induction Method
Measure of success or failure
Study Quality
Applic-ability to KQ3
Control Group
Induced Labor
Bueno et al.40, 41
2007 2002-2003 Spain Academic
Center - - 196 Oxytocin, AROM, PGE2 gel
Overall vaginal delivery, Vaginal delivery within 24
hours
Poor Poor
Pandis et al.42§2001 NS United
Kingdom NS - - 240 Oxytocin, PGE2 gel
Vaginal delivery within 24 hours Fair Poor
Wilson and Philpott43
1976
Mar 1974-
Jul 1974
Rhodesia NS - - 175 Oxytocin, AROM
Overall vaginal delivery Fair Poor
Williams and Craft44‡ 1979 1972-
1973 United
KingdomAcademic
Center - - 1910 Oxytocin, AROM
Rate of emergency
Cesarean section Poor Poor
Williams et al.45
1997
Jun 1991-Dec 1993
United States NS - - 415
Oxytocin, PGE2 gel,
hygroscop-ic dilation
Failure to progress to active labor within 12
hours, failed vaginal delivery
Good Fair
Wing et al.46
2002 1994-2000
United States
Academic Center and Community
Hospital
- - 1373 Oxytocin, AROM,
Misoprostol
Vaginal delivery within 24 hours Fair Fair
KQ=Key Question; AROM=artificial rupture of membranes; PGE2=prostaglandin NS=not specified
§Also reported failure to deliver after 24 hours in the setting of induction of labor; NS=not specified

Appendix Table 3. Additional predictors of cesarean delivery among all women Article Predictor Predictor Predictor Predictor
Ahner et al.2 Presence of Fetal Fibronectin (FFN): FFN+=10.0% FFN-=15.2%
Anderson5 Cervical status: “ripe” (otherwise undefined)=5.3% “unripe” (otherwise undefined)=8.2%
Chan et al.12 Number of PGE2 Doses: 0=19.0% 1-2=16.4% ≥3=48.1%
Gabriel et al.18 Cervical Length upon Arrival: <26 mm=20.6% ≥26 mm=40.2%
Bishop score </=5 AND cervix <26mm=21% Bishop score </=5 AND cervix >/=26mm=43% Bishop score >5 AND cervix <26mm=21%Bishop score >5 AND cervix >/=26mm=25%
Garite et al.19 Presence of FFN: FFN+=14.8% FFN-=26.9% (P=0.05)
Morgan and Thurnau24
Ultrasound Estimated Fetal Weight (EFW) (grams): EFW≥4000 =22.2% EFW<4000 =25.0% EFW ≥4500 =25.0% EFW<4500 =24.4%
Fetal-Pelvic Index (FPI) Status: FPI+=83.3% FPI-=5.4%
Colcher-Sussman x-ray Pelvimetry Result: Contract=100% Adequate=22.9%
Orhue et al.28 Cervical Dilation at 8 hours: <4 cm=38.4% 4-8 cm=15.4% >8 cm=0%
Length of latent period: <4 hours=5.1% 4-8 hours=10.3% >8 hours=69.5%
C-25

Peregrine et al.29, 30
Fetal Position: Occipito-posterior=25.3% Not Occipito-posterior=31.2% (P=0.29)
C-26

Appendix Table 3. Additional predictors of cesarean delivery among all women (continued)
Article Predictor Predictor Predictor Predictor Saunders et al.33
Fetal Occipital Position before Induction: Occipito-anterior=17.4% Occipito-transverse=22.5% Occipito-posterior=35.7%
Schreyer et al.34
Presence of Fetal Breathing Movements (FBM): FBM+=9.7% FBM-=0%
Tan et al.36 Cervical Length: >20 mm=30.0% ≤20 mm=12.9% (P=0.018)
EFW (grams): EFW<2500=28.6% EFW 2500-4000=22.2% EFW>4000=33.3%
Maternal Height: <150 cm=27.3% ≥150 cm=21.7% (P=0.59)
Race: Malaysian=22% (P=0.65)
Ware and Raynor37
Cervical Length: <30 mm=4.0% ≥30 mm=81.5% (P<0.001)
Pharmaceutical agent used for induction of labor: Oxytocin=14% Misoprostol=56% (P<0.005)
Wilailak et al.47
Patient Status: Private Patient=19.4% Non-private Patient=17.2%
Peregrine et al.29, 30 reported predictors of cesarean section only as odds ratios and P-values for maternal height, gestational age, amniotic fluid index, estimated fetal weight, transvaginal sonography cervical length, and Bishop score. Rizzo et al.31, 32 reported predictors of cesarean section only as odds ratios for parity, amniotic fluid index, and number of doses of prostaglandin administered. Tan et al.36 also reported that for women who had cervical funneling, 14.3% delivered by cesarean section (P=0.18).
C-27

Appendix Table 4. Additional predictors of cesarean delivery among nulliparous women
Article Predictor Anderson5 Cervical status:
“ripe” (otherwise undefined)=5.7%; “unripe” (otherwise undefined)=6.5%
Chan et al.12 Number of PGE2 doses: 0=31.6% 1-2=22.8% ≥3=58.8%
Dodd et al.14 Bishop score: 0-3=37%; 4-6=26%
Ecker et al.15 Maternal age (years): <25=15% 25-34=23% 35-39=31% >40=33%
Heffner et al.21 Gestational age (weeks): 36-38 =18%; 39-40 =23%
Nuthalapaty et al.26 Maternal weight (kilograms): 47 to < 72=15% 72 to < 85=20% 85 to < 103=30% 103 to 193=37%
Peregrine et al.29, 30 Fetal Position: Occipito-posterior=39.1%; Not Occipito-posterior=48.6% (P=0.22)
Xenakis et al.39 Bishop score: 0-3=34%; >3=20%
Appendix Table 5. Additional predictors of cesarean delivery among multiparous women
Article Predictor Anderson5 Cervical status:
“ripe” (otherwise undefined)=4.2%; “unripe” (otherwise undefined)=11.1%
Chan et al.12 Number of PGE2 doses: 0=5.5% 1-2=5.2% ≥3=30.0%
Dodd et al.14 Bishop score: 0-3=15%; 4-6=8%
Nuthalapaty et al.26 Maternal weight (kilograms): 47 to < 72=7% 72 to < 85=8% 85 to < 103=13% 103 to 193=9%
Peregrine et al.29, 30 Fetal Position:
C-28

Occipito-posterior=0%; Not Occipito-posterior=15.5% (P<0.05)
Xenakis et al.39 Bishop score: 0-3=23%; >3=13%
Appendix Table 6. Predictors of induction success reported among all women
Article Success Measure Predictor Predictor Predictor
Xenakis et al.39
Ability to achieve active labor
Bishop Score: 0-3=91% >3=99%
NICHHD48 Vaginal delivery within 12 hours
Parity: Nulliparous=2% Multiparous=14%
Ahner et al.2 Vaginal delivery within 24 hours
Presence of fetal fibronectin: FFN+=83% FFN-=43%
Bueno et al.40, 41
Vaginal delivery within 24 hours
Parity: Nulliparous=51% Multiparous=83%
Bishop score: 0=35% 1-4=60% >4=81%
Cervical length: <16.5 mm=91% 16.5-27 mm=65% >27mm =48%
Dhall et al.13 Vaginal delivery within 24 hours
Parity: Nulliparous=69% Multiparous=76%
Bishop Score: 0-3=47% 4-5=68% ≥6=92%
Dhall score: 0-6=34% 7-8=72% ≥9=91%
Dodd et al.14 Vaginal delivery within 24 hours
Parity: Nulliparous=43% Multiparous=76%
Bishop score: 0-3=50% 4-6=66%
Egarter et al.49
Vaginal delivery within 24 hours
Parity: Nulliparous=80% Multiparous=96%
Ekman et al.17
Vaginal delivery within 24 hours
Parity: Nulliparous=66% Multiparous=48%
Pandis et al.42
Vaginal delivery within 24 hours
Parity: Nulliparous=54% Multiparous=74%
Peregrine et al.29, 30
Vaginal delivery within 24 hours
Parity: Nulliparous=34% Multiparous=65%
Fetal position: Non-occipito-posterior=43% occipito-posterior=50%
Wing et al.46 Vaginal delivery within 24 hours
Parity: Nulliparous=32% Multiparous=63%
Buist10 Spontaneous vaginal delivery
Parity: Nulliparous=49% Multiparous=74%
C-29

Chan et al.12 Spontaneous vaginal delivery
Parity: Nulliparous=38% Multiparous=81%
Number of doses of prostaglandin: 0=59% 1-2=57% ≥3=33%
C-30

Appendix Table 6. Predictors of induction success reported among all women (continued)
Success Measure Article Predictor Predictor Predictor
Heimstad et al.22
Spontaneous vaginal delivery
Gestational age: 37 weeks=77% 38 weeks=73% 39 weeks=77% 40 weeks=74% 41 weeks=58% 42+ weeks=63%
Macer et al.50
Spontaneous vaginal delivery
Use of epidural analgesia: Epidural=52% No epidural=85%
Saunders et al.33
Spontaneous vaginal delivery
Fetal position: occipito-anterior=57% occipito-transverse=63% occipito-posterior=64%
Alberico et al.3
Overall vaginal delivery
Parity: Nulliparous=76% Multiparous=95%
Bishop Score: <5=79% ≥5=85%
Ben-Haroush et al.33
Overall vaginal delivery
Parity: Nulliparous=37%
Boulvain et al.41
Overall vaginal delivery
Parity: Nulliparous=41% Multiparous=89%
Medications used: Oxtyocin=86% Misoprostol=44%
Dhall et al.13 Overall vaginal delivery
Parity: Nulliparous=81% Multiparous=81%
Bishop Score: <4=66% ≥4=86%
Dhall score: <7=54% ≥7=90%
Saunders et al.33
Overall vaginal delivery
Fetal position: occipito-anterior=83% occipito-transverse=78% occipito-posterior=64%
Schreyer et al.34
Overall vaginal delivery
Bishop Score: Bishop Score 3-5=91% Bishop Score 6-10=96%
Presence/absence of fetal breathing movements: FBM+=90% FBM-=100%
Wigton and Wolk38
Overall vaginal delivery
Parity: Nulliparous=76% Multiparous=100%
Wilson and Philpott43
Overall vaginal delivery
Parity: >4=35%
Note: Each predictor is reported as the percentage of women with induction success within the specific group; for e.g. in the study by Xenakis et al, 91% of women with a Bishop score 0-3 had successful induction of labor as compared with 99% of women with Bishop score >3.
C-31

FFN=fetal fibronectin Bueno et al.40, 41reported predictors of overall vaginal delivery only as odds ratios for parity, Bishop score, cervical length, gestational age, age, weight at delivery, biparietal diameter, and previous abortion. Rizzo et al.31, 32 reported predictors of overall vaginal delivery only as odds ratios for parity, gestational age, weight at delivery, AFI, and number of doses of prostaglandin administered.
C-32

Appendix Table 7. Predictors of induction success reported among nulliparous women
Success Measure Article Predictor Predictor Predictor
Xenakis et al.39
Ability to achieve active labor
Bishop Score: 0-3=87% >3=99%
Bueno et al.40, 41
Vaginal delivery within 24 hours
Bishop score: <5=45% >=73%
Cervical length: <16.5 mm=92% >16.5 mm=47%
Cervical length >16.5mm AND Bishop score<6=44% Cervical length >16.5mm AND Bishop score >6=88%
Dhall et al.13 Vaginal delivery within 24 hours
Bishop Score: <4=43% ≥4=76%
Dhall score: <7=43% ≥7=80%
Dodd et al.14 Vaginal delivery within 24 hours
Bishop Score: 0-3=33% 4-6=57%
Ekman et al.17
Vaginal delivery within 24 hours
Gestational Age: 40 weeks=67% ≥42 weeks=63%
Peregrine et al.29, 30
Vaginal delivery within 24 hours
Fetal position: Non-occipito-posterior=30% Occipito-posterior=39%
Chan et al.12 Spontaneous vaginal delivery
Number of doses of prostaglandin: 0=38% 1-2=41% ≥3=18%
Alberico et al.3
Overall vaginal delivery
Bishop Score: < 5=71% > 5=82%
Dhall et al.13 Overall vaginal delivery
Bishop Score: <4=71% ≥4=83%
Dhall score: <7=65% ≥7=88%
Bueno et al.40, 41 reported predictors of overall vaginal delivery only as odds ratios for parity, Bishop score, cervical length, gestational age, age, weight at delivery, biparietal diameter, and previous abortion.
C-33

Appendix Table 8. Predictors of induction success reported among multiparous women
Article Success Measure Predictor Predictor Xenakis et al.39 Ability to achieve
active labor Bishop Score: 0-3=95% >3=99%
Bueno et al.40, 41 Vaginal delivery within 24 hours
Bishop score: 0=40% 1-3=78% >3=100%
Cervical length: <27 mm=100% >27 mm=70%
Dhall et al.13 Vaginal delivery within 24 hours
Bishop Score: < 4=53% ≥ 4=86%
Dhall score: <7=10% ≥7=89%
Dodd et al.14 Vaginal delivery within 24 hours
Bishop Score: 0-3=73% 4-6=80%
Ekman et al.17 Vaginal delivery within 24 hours
Gestational Age: ≤ 38 weeks=46% 40 weeks=27% ≥ 41 weeks=67%
Peregrine et al.29, 30
Vaginal delivery within 24 hours
Fetal position: Non-occipito-posterior=61% Occipito-posterior=77%
Chan et al.12 Spontaneous vaginal delivery
Number of doses of prostaglandin: 0=81% 1-2=85% ≥3=60%
Alberico et al.3 Overall vaginal delivery
Bishop Score: < 5=97% > 5=91%
Dhall et al.13 Overall vaginal delivery
Bishop Score: < 4=58% ≥ 4=91%
Dhall score: <7=10% ≥7=94%
Bueno et al.40, 41 reported predictors of overall vaginal delivery only as odds ratios for parity, Bishop score, cervical length, gestational age, age, weight at delivery, biparietal diameter, and previous abortion.
C-34

Appendix Table 9. Predictors of failure
Article Failure Measure Predictor Predictor Garite et al.19¦ Interval of PG administration
to delivery >18hrs
Garite et al.19¦ Interval of PG administration to delivery >24hrs
Pandis et al. 42 Failure to deliver after 24 hours
Bishop Score: < 5=44% ≥ 5=9%
Cervical length: 0-18mm=2% 19-24mm=21% 25-31mm=33% 32-50 mm=84%
Williams and Craft44
Emergency C-section only Parity: Nulliparous=11% Multiparous=4 %
Williams et al.45 Failure to progress to active labor within 12 hours
Parity: Nulliparous=54% Multiparous=45%
Williams et al.45 Failed vaginal delivery Parity: Nulliparous=30% Multiparous=25%
¦Odds ratios are given for entire group and nulliparous women separately on predictors of Bishop score>5 and fetal fibronectin+. PG=prostaglandin
C-35

C-36

Appendix D: List of Excluded Studies
Article Reason for exclusion A randomized control study of oxytocin augmentation of labour. 1. Obstetric outcome. Br J Obstet Gynaecol. 1988 Jan;95(1):104-7.
Not a study of elective induction of labor or predictors of success in the setting of induced labor
Adams JL. The use of obstetrical procedures in the care of low-risk women. Women Health. 1983 Spring;8(1):25-34.
Not a study of elective induction of labor or predictors of success in the setting of induced labor
Adelstein P, Fedrick J, Howat P, Robinson R, Turnbull AC. Obstetric practice and infant morbidity. Br J Obstet Gynaecol. 1977 Oct;84(10):721-5.
Not a study of elective induction of labor or predictors of success in the setting of induced labor
Akyol D, Mungan T, Unsal A, Yuksel K. Prelabour rupture of the membranes at term--no advantage of delaying induction for 24 hours. Aust N Z J Obstet Gynaecol. 1999 Aug;39(3):291-5.
Not a study of elective induction of labor or predictors of success in the setting of induced labor
Albers LL, Savitz DA. Hospital setting for birth and use of medical procedures in low-risk women. J Nurse Midwifery. 1991 Nov-Dec;36(6):327-33.
Not a study of elective induction of labor or predictors of success in the setting of induced labor
Alexander JM, Lucas MJ, Ramin SM, McIntire DD, Leveno KJ. The course of labor with and without epidural analgesia. Am J Obstet Gynecol. 1998 Mar;178(3):516-20.
Not a study of elective induction of labor or predictors of success in the setting of induced labor
Alexander JM, McIntire DD, Leveno KJ. Forty weeks and beyond: pregnancy outcomes by week of gestation. Obstet Gynecol. 2000 Aug;96(2):291-4.
Not a study of elective induction of labor or predictors of success in the setting of induced labor
Allen VM, O'Connell CM, Baskett TF. Maternal morbidity associated with cesarean delivery without labor compared with induction of labor at term. Obstet Gynecol. 2006 Aug;108(2):286-94.
Not a study of elective induction of labor or predictors of success in the setting of induced labor
Al-Taani M. Pregnancies past the estimated date of confinement: labour and delivery outcome. East Mediterr Health J. 2003 Sep-Nov;9(5-6):955-60.
Data not usable
Anderson AB, Turnbull AC, Baird D. The influence of induction of labour on caesarean section rate, duration of labour and perinatal mortality in Aberdeen primigravidae between 1938 and 1966. J Obstet Gynaecol Br Commonw. 1968 Aug;75(8):800-11.
Not a study of elective induction of labor or predictors of success in the setting of induced labor
Anderson T. Induction of labour for suspected fetal macrosomia. Pract Midwife. 2000 Feb;3(2):10-1.
Ineligible Study Design
Arulkumaran S, Gibb DM, Heng SH, Ratnam SS. Perinatal outcome of induced labour. Asia Oceania J Obstet Gynaecol. 1985 Mar;11(1):33-7.
Not a study of elective induction of labor or predictors of success in the setting of induced labor
Bahn SA, Jacobson J, Petersen F. Maternal and neonatal outcome following prolonged labor induction. Obstet Gynecol. 1998 Sep;92(3):403-7.
Not a study of elective induction of labor or predictors of success in the setting of induced labor
Bakketeig LS, Petersen SO, Bersjo P. Statistical comparison in a controlled trial of elective induction of labor. Acta Obstet Gynecol Scand. 1980;59(2):191-2.
Ineligible Study Design
Barda G, Arbel-Alon S, Bernstein D, Zakut H, Menczer J. Pregnancy and delivery in a group of Israeli teenagers. A case-controlled study. Clin Exp Obstet Gynecol. 1998;25(1-2):32-5.
Not a study of elective induction of labor or predictors of success in the setting of induced labor
Barros FC, Velez Mdel P. Temporal trends of preterm birth subtypes and neonatal outcomes. Obstet Gynecol. 2006 May;107(5):1035-41.
Data not usable
Baruffi G, Dellinger WS, Jr., Strobino DM, Rudolph A, Timmons RG, Ross A. Patterns of obstetric procedures use in maternity care. Obstet Gynecol. 1984 Oct;64(4):493-8.
Not a study of elective induction of labor or predictors of success in the setting of induced labor
D-1

Article Reason for exclusion Baxter S. Orgasm and labour in primiparae. J Psychosom Res. 1974 Oct;18(5):357-60.
Not a study of elective induction of labor or predictors of success in the setting of induced labor
Beard R, Boyd I, Holt E. A study of cervical vibration in induced labour. J Obstet Gynaecol Br Commonw. 1973 Nov;80(11):966-9.
Not a study of elective induction of labor or predictors of success in the setting of induced labor
Beard R, Steer PJ. Induction of labour and perinatal mortality. Br Med J. 1977 Aug 20;2(6085):516-7.
Ineligible Study Design
Beazley JM, Alderman B. Neonatal hyperbilirubinaemia following the use of oxytocin in labour. Br J Obstet Gynaecol. 1975 Apr;82(4):265-71.
Not a study of elective induction of labor or predictors of success in the setting of induced labor
Beazley JM, Alderman B. The 'inductograph'--a graph describing the limits of the latent phase of induced labour in low risk situations. Br J Obstet Gynaecol. 1976 Jul;83(7):513-7.
Not a study of elective induction of labor or predictors of success in the setting of induced labor
Beazley JM. Controlled parturition. Br J Hosp Med. 1977 Mar;17(3):237-8, 41-4.
Ineligible Study Design
Beebe LA, Rayburn WF, Beaty CM, Eberly KL, Stanley JR, Rayburn LA. Indications for labor induction. Differences between university and community hospitals. J Reprod Med. 2000 Jun;45(6):469-75.
Not a study of elective induction of labor or predictors of success in the setting of induced labor
Behague DP, Victora CG, Barros FC. Consumer demand for caesarean sections in Brazil: informed decision making, patient choice, or social inequality? A population based birth cohort study linking ethnographic and epidemiological methods. BMJ. 2002 Apr 20;324(7343):942-5.
Not a study of elective induction of labor or predictors of success in the setting of induced labor
Beilin Y, Friedman F, Jr., Andres LA, Hossain S, Bodian CA. The effect of the obstetrician group and epidural analgesia on the risk for cesarean delivery in nulliparous women. Acta Anaesthesiol Scand. 2000 Sep;44(8):959-64.
Not a study of elective induction of labor or predictors of success in the setting of induced labor
Belfrage P, Fernstrom I, Hallenberg G. Routine or selective ultrasound examinations in early pregnancy. Obstet Gynecol. 1987 May;69(5):747-50.
Not a study of elective induction of labor or predictors of success in the setting of induced labor
Ben-Haroush A, Yogev Y, Bar J, Glickman H, Kaplan B, Hod M. Indicated labor induction with vaginal prostaglandin E2 increases the risk of cesarean section even in multiparous women with no previous cesarean section. J Perinat Med. 2004;32(1):31-6.
Data not usable
Ben-Haroush A, Yogev Y, Glickman H, Bar J, Kaplan B, Hod M. Mode of delivery in pregnancies with premature rupture of membranes at or before term following induction of labor with vaginal prostaglandin E2. Am J Perinatol. 2004 Jul;21(5):263-8.
Not a study of elective induction of labor or predictors of success in the setting of induced labor
Bergsjo P, Halle C. Duration of the second stage of labor. Acta Obstet Gynecol Scand. 1980;59(3):193-6.
Not a study of elective induction of labor or predictors of success in the setting of induced labor
Bianco A, Stone J, Lynch L, Lapinski R, Berkowitz G, Berkowitz RL. Pregnancy outcome at age 40 and older. Obstet Gynecol. 1996 Jun;87(6):917-22.
Not a study of elective induction of labor or predictors of success in the setting of induced labor
Black BP, McBride WG. Children born after elective induction of labour. Med J Aust. 1979 Oct 6;2(7):362-3.
No eligible outcomes
Bodner-Adler B, Bodner K, Pateisky N, Kimberger O, Chalubinski K, Mayerhofer K, et al. Influence of labor induction on obstetric outcomes in patients with prolonged pregnancy: a comparison between elective labor induction and spontaneous onset of labor beyond term. Wien Klin Wochenschr. 2005 Apr;117(7-8):287-92.
Post-term
Brinsden PR, Clark AD. Postpartum haemorrhage after induced and spontaneous labour. Br Med J. 1978 Sep 23;2(6141):855-6.
Not a study of elective induction of labor or predictors of success in the setting of induced labor
D-2

Article Reason for exclusion Browne DS. Induction of labour. Med J Aust. 1977 Nov 19;2(21):721. Not a study of elective induction of
labor or predictors of success in the setting of induced labor
Buchan PC. Pathogenesis of neonatal hyperbilirubinaemia after induction of labour with oxytocin. Br Med J. 1979 Nov 17;2(6200):1255-7.
Not a study of elective induction of labor or predictors of success in the setting of induced labor
Bueno B, San-Frutos L, Salazar F, Perez-Medina T, Engels V, Archilla B, et al. Variables that predict the success of labor induction. Acta Obstet Gynecol Scand. 2005 Nov;84(11):1093-7.
Duplicate of Included Study
Caliskan E, Dilbaz S, Gelisen O, Dilbaz B, Ozturk N, Haberal A. Unsucessful labour induction in women with unfavourable cervical scores: predictors and management. Aust N Z J Obstet Gynaecol. 2004 Dec;44(6):562-7.
Method of induction study
Callen P, Goldsworthy S, Graves L, Harvey D, Mellows H, Parkinson C. Mode of delivery and the lecithin/sphingomyelin ratio. Br J Obstet Gynaecol. 1979 Dec;86(12):965-8.
Not a study of elective induction of labor or predictors of success in the setting of induced labor
Cary AJ. Intervention rates in spontaneous term labour in low risk nulliparous women. Aust N Z J Obstet Gynaecol. 1990 Feb;30(1):46-51.
Not a study of elective induction of labor or predictors of success in the setting of induced labor
Caseby NG. Epidural analgesia for the surgical induction of labour. Br J Anaesth. 1974 Oct;46(10):747-51.
Not a study of elective induction of labor or predictors of success in the setting of induced labor
Caughey AB, Bishop JT. Maternal complications of pregnancy increase beyond 40 weeks of gestation in low-risk women. J Perinatol. 2006 Sep;26(9):540-5.
Not a study of elective induction of labor or predictors of success in the setting of induced labor
Chalmers I, Campbell H, Turnbull AC. Use of oxytocin and incidence of neonatal jaundice. Br Med J. 1975 Apr 19;2(5963):116-8.
Not a study of elective induction of labor or predictors of success in the setting of induced labor
Chalmers I, Lawson JG, Turnbull AC. Evaluation of different approaches to obstetric care: Part II. Br J Obstet Gynaecol. 1976 Dec;83(12):930-3.
Not a study of elective induction of labor or predictors of success in the setting of induced labor
Chalmers JA, Prakash A. Optimal dosage of buccal oxytocin for the induction of labor. Am J Obstet Gynecol. 1971 Sep 15;111(2):227-32.
Method of induction study
Chan BC, Lao TT. Influence of parity on the obstetric performance of mothers aged 40 years and above. Hum Reprod. 1999 Mar;14(3):833-7.
Not a study of elective induction of labor or predictors of success in the setting of induced labor
Chance GW. Elective delivery, premature rupture of the membranes and the respiratory distress syndrome. Can Med Assoc J. 1980 Feb 9;122(3):265-7.
Not a study of elective induction of labor or predictors of success in the setting of induced labor
Chandra S, Crane JM, Hutchens D, Young DC. Transvaginal ultrasound and digital examination in predicting successful labor induction. Obstet Gynecol. 2001 Jul;98(1):2-6.
Data not usable
Chang TC, Tan KT, Neow P, Yeo GS. Computerised analysis of foetal heart rate variation: prediction of adverse perinatal outcome in patients undergoing prostaglandin induction of labour at term. Ann Acad Med Singapore. 1997 Nov;26(6):772-5.
Not a study of elective induction of labor or predictors of success in the setting of induced labor
Chanrachakul B, Herabutya Y. Postterm with favorable cervix: is induction necessary? Eur J Obstet Gynecol Reprod Biol. 2003 Feb 10;106(2):154-7.
Not a study of elective induction of labor or predictors of success in the setting of induced labor
Chattopadhyay SK, Sengupta BS, Edrees YB. Intracervical application of prostaglandin E2 tablets for elective induction of labor in grand multiparae: a prospective controlled study. Eur J Obstet Gynecol Reprod Biol. 1986 Jun;22(1-2):7-15.
Not a study of elective induction of labor or predictors of success in the setting of induced labor
D-3

Article Reason for exclusion Chen WH, Lai HC, Tang YH, Liu HS. Fetal Doppler hemodynamic changes in spontaneous versus prostaglandin E1-induced active labor. Acta Obstet Gynecol Scand. 1999 Aug;78(7):599-604.
Not a study of elective induction of labor or predictors of success in the setting of induced labor
Cheng YW, Shaffer BL, Caughey AB. Associated factors and outcomes of persistent occiput posterior position: A retrospective cohort study from 1976 to 2001. J Matern Fetal Neonatal Med. 2006 Sep;19(9):563-8.
Not a study of elective induction of labor or predictors of success in the setting of induced labor
Cheng YW, Shaffer BL, Caughey AB. The association between persistent occiput posterior position and neonatal outcomes. Obstet Gynecol. 2006 Apr;107(4):837-44.
Not a study of elective induction of labor or predictors of success in the setting of induced labor
Chew WC, Swann IL. Influence of simultaneous low amniotomy and oxytocin infusion and other maternal factors on neonatal jaundice: a prospective study. Br Med J. 1977 Jan 8;1(6053):72-3.
Not a study of elective induction of labor or predictors of success in the setting of induced labor
Chia YT, Arulkumaran S, Soon SB, Norshida S, Ratnam SS. Induction of labour: does internal tocography result in better obstetric outcome than external tocography. Aust N Z J Obstet Gynaecol. 1993 May;33(2):159-61.
Not a study of elective induction of labor or predictors of success in the setting of induced labor
Chigbu CO, Ezeome IV, Okezie AO, Oyefara B. Induction of labor on request in a resource-poor setting. Int J Gynaecol Obstet. Apr 18 2007.
Data not usable
Chua S, Arulkumaran S. Intrapartum care. Aust N Z J Obstet Gynaecol. 1997 Feb;37(1):25-35.
Not a study of elective induction of labor or predictors of success in the setting of induced labor
Clinch J. Induction of labour--a six year review. Br J Obstet Gynaecol. 1979 May;86(5):340-2.
Not a study of elective induction of labor or predictors of success in the setting of induced labor
Cnattingius R, Hoglund B, Kieler H. Emergency cesarean delivery in induction of labor: an evaluation of risk factors. Acta Obstet Gynecol Scand. 2005 May;84(5):456-62.
Data not usable
Combs CA, Murphy EL, Laros RK, Jr. Cost-benefit analysis of autologous blood donation in obstetrics. Obstet Gynecol. Oct 1992;80(4):621-625
Not a study of elective induction of labor or predictors of success in the setting of induced labor
Combs CA, Singh NB, Khoury JC. Elective induction versus spontaneous labor after sonographic diagnosis of fetal macrosomia. Obstet Gynecol. Apr 1993;81(4):492-496.
Not a study of elective induction of labor or predictors of success in the setting of induced labor
Conway DL, Adkins WB, Schroeder B, Langer O. Isolated oligohydramnios in the term pregnancy: is it a clinical entity? J Matern Fetal Med. 1998 Jul-Aug;7(4):197-200.
Not a study of elective induction of labor or predictors of success in the setting of induced labor
Conway DL, Langer O. Elective delivery of infants with macrosomia in diabetic women: reduced shoulder dystocia versus increased cesarean deliveries. Am J Obstet Gynecol. 1998 May;178(5):922-5.
Not a study of elective induction of labor or predictors of success in the setting of induced labor
Cooley S, Lissoni D, Geary M, Keane D. Does fetal head position at the term plus 12 scan influence induction, labor and delivery outcome? J Perinat Med. 2004;32(3):258-9.
Not a study of elective induction of labor or predictors of success in the setting of induced labor
Coonrod DV, Bay RC, Kishi GY. The epidemiology of labor induction: Arizona, 1997. Am J Obstet Gynecol. 2000 Jun;182(6):1355-62.
Not a study of elective induction of labor or predictors of success in the setting of induced labor
Cope E. Induction of labour. Practitioner. 1967 Feb;198(184):207-16. Ineligible Study Design Crane JM, Young DC, Butt KD, Bennett KA, Hutchens D. Excessive uterine activity accompanying induced labor. Obstet Gynecol. 2001 Jun;97(6):926-31.
Not a study of elective induction of labor or predictors of success in the setting of induced labor
Cromi A, Ghezzi F, Tomera S, Scandroglio S, Colombo G, Bolis P. Cervical ripening with a Foley catheter: the role of pre- and postripening ultrasound examination of the cervix. Am J Obstet Gynecol. 2007 Jan;196(1):41 e1-7.
Not a study of elective induction of labor or predictors of success in the setting of induced labor
D-4

Article Reason for exclusion Danon D, Ben-Haroush A, Yogev Y, Bar J, Hod M, Pardo J. Prostaglandin E2 induction of labor for isolated oligohydramnios in women with unfavorable cervix at term. Fetal Diagn Ther. 2007;22(1):75-9.
Not a study of elective induction of labor or predictors of success in the setting of induced labor
Daskalakis G, Thomakos N, Hatziioannou L, Mesogitis S, Papantoniou N, Antsaklis A. Sonographic cervical length measurement before labor induction in term nulliparous women. Fetal Diagn Ther. 2006;21(1):34-8.
Not a study of elective induction of labor or predictors of success in the setting of induced labor
de Hemptinne D, Thiery M, Vroman S, Martens S. Uterine contractility in spontaneous and induced labour. Z Geburtshilfe Perinatol. 1976 Aug;180(4):275-8.
Not a study of elective induction of labor or predictors of success in the setting of induced labor
DeMott RK, Sandmire HF. The Green Bay cesarean section study. II. The physician factor as a determinant of cesarean birth rates for failed labor. Am J Obstet Gynecol. 1992 Jun;166(6 Pt 1):1799-806; discussion 806-10.
Not a study of elective induction of labor or predictors of success in the setting of induced labor
Dowding VM, Duignan NM, Henry GR, MacDonald DW. Induction of labour, birthweight and perinatal mortality by day of the week. Br J Obstet Gynaecol. 1987 May;94(5):413-9.
Not a study of elective induction of labor or predictors of success in the setting of induced labor
D'Souza SW, Black P, Macfarlane T, Richards B. The effect of oxytocin in induced labour on neonatal jaundice. Br J Obstet Gynaecol. 1979 Feb;86(2):133-8.
Not a study of elective induction of labor or predictors of success in the setting of induced labor
Duff C, Sinclair M. Exploring the risks associated with induction of labour: a retrospective study using the NIMATS database. Northern Ireland Maternity System. J Adv Nurs. 2000 Feb;31(2):410-7.
Post-term
Ekman G, Persson PH, Ulmsten U. Induction of labor in postterm pregnant women. Int J Gynaecol Obstet. 1986 Feb;24(1):47-52.
Not a study of elective induction of labor or predictors of success in the setting of induced labor
Elferink-Stinkens PM, Brand R, le Cessie S, Van Hemel OJ. Large differences in obstetrical intervention rates among Dutch hospitals, even after adjustment for population differences. Eur J Obstet Gynecol Reprod Biol. 1996 Sep;68(1-2):97-103.
Not a study of elective induction of labor or predictors of success in the setting of induced labor
Elferink-Stinkens PM, Van Hemel OJ, Brand R. Differences in obstetrical intervention rates between Dutch hospitals. Eur J Obstet Gynecol Reprod Biol. 1994 Mar 15;53(3):165-73.
Not a study of elective induction of labor or predictors of success in the setting of induced labor
Elghorori MR, Hassan I, Dartey W, Abdel-Aziz E, Bradley M. Comparison between subjective and objective assessments of the cervix before induction of labour. J Obstet Gynaecol. 2006 Aug;26(6):521-6.
Data not usable
Enkola K, Pulkkinen MO. Induction of human labor at term: uterine activity, inducibility, duration and neonatal jaundice. Acta Physiol Hung. 1985;65(3):281-8.
Not a study of elective induction of labor or predictors of success in the setting of induced labor
Evans SE, Crawford JS, Stevens ID, Durbin GM, Daya H. Fluid therapy for induced labour under epidural analgesia: biochemical consequences for mother and infant. Br J Obstet Gynaecol. 1986 Apr;93(4):329-33.
Not a study of elective induction of labor or predictors of success in the setting of induced labor
Ezra Y, McParland P, Farine D. High delivery intervention rates in nulliparous women over age 35. Eur J Obstet Gynecol Reprod Biol. 1995 Oct;62(2):203-7.
Not a study of elective induction of labor or predictors of success in the setting of induced labor
Farr SL, Jamieson DJ, Rivera HV, Ahmed Y, Heilig CM. Risk Factors for Cesarean Delivery Among Puerto Rican Women. Obstet Gynecol. 2007 Jun;109(6):1351-7.
Not a study of elective induction of labor or predictors of success in the setting of induced labor
Fedrick J, Yudkin P. Obstetric practice in the Oxford Record Linkage Study Area 1965-72. Br Med J. 1976 Mar 27;1(6012):738-40.
Not a study of elective induction of labor or predictors of success in the setting of induced labor
D-5

Article Reason for exclusion Feinstein U, Sheiner E, Levy A, Hallak M, Mazor M. Risk factors for arrest of descent during the second stage of labor. Int J Gynaecol Obstet. 2002 Apr;77(1):7-14.
Not a study of elective induction of labor or predictors of success in the setting of induced labor
Fenton DW, Speedie J, Duncan SL. Does cervical ripening with PGE2 affect subsequent uterine activity in labour? Acta Obstet Gynecol Scand. 1985;64(1):27-30.
Not a study of elective induction of labor or predictors of success in the setting of induced labor
Ferguson JE, 2nd, Newberry YG, DeAngelis GA, Finnerty JJ, Agarwal S, Turkheimer E. The fetal-pelvic index has minimal utility in predicting fetal-pelvic disproportion. Am J Obstet Gynecol. 1998 Nov;179(5):1186-92.
Not a study of elective induction of labor or predictors of success in the setting of induced labor
Fields H. Induction of labor: methods, hazards, complications and contraindications. Hosp Top. 1968 Dec;46(12):63-6.
Ineligible Study Design
Fitzpatrick M, McQuillan K, O'Herlihy C. Influence of persistent occiput posterior position on delivery outcome. Obstet Gynecol. 2001 Dec;98(6):1027-31.
Not a study of elective induction of labor or predictors of success in the setting of induced labor
Flaksman RJ, Vollman JH, Benfield DG. Iatrogenic prematurity due to elective termination of the uncomplicated pregnancy: a major perinatal health care problem. Am J Obstet Gynecol. 1978 Dec 15;132(8):885-8.
Not a study of elective induction of labor or predictors of success in the setting of induced labor
Fleissig A. Prevalence of procedures in childbirth. BMJ. 1993 Feb 20;306(6876):494-5.
Not a study of elective induction of labor or predictors of success in the setting of induced labor
Fok WY, Chan LY, Tsui MH, Leung TN, Lau TK, Chung TK. When to induce labor for post-term? A study of induction at 41 weeks versus 42 weeks. Eur J Obstet Gynecol Reprod Biol. 2006 Apr 1;125(2):206-10.
Post-term
Foley ME, Alarab M, Daly L, Keane D, Rath A, O'Herlihy C. The continuing effectiveness of active management of first labor, despite a doubling in overall nulliparous cesarean delivery. Am J Obstet Gynecol. 2004 Sep;191(3):891-5.
Not a study of elective induction of labor or predictors of success in the setting of induced labor
Foong LC, Vanaja K, Tan G, Chua S. Membrane sweeping in conjunction with labor induction. Obstet Gynecol. 2000 Oct;96(4):539-42.
Not a study of elective induction of labor or predictors of success in the setting of induced labor
Frost O. Augmentation of labour in the primigravid patient. Ethiop Med J. 1984 Oct;22(4):193-201.
Not a study of elective induction of labor or predictors of success in the setting of induced labor
Frost O. Induction of labour in a nondoctor maternity unit. Cent Afr J Med. 1978 Nov;24(11):229-31.
Not a study of elective induction of labor or predictors of success in the setting of induced labor
Fuchs K, Wapner R. Elective cesarean section and induction and their impact on late preterm births. Clin Perinatol. 2006 Dec;33(4):793-801; abstract viii.
Ineligible Study Design
Garzetti GG, Ciavattini A, La Marca N, De Cristofaro F. Longitudinal measurement of amniotic fluid index in term pregnancies and its association with intrapartum fetal distress. Gynecol Obstet Invest. 1997;44(4):234-8.
Not a study of elective induction of labor or predictors of success in the setting of induced labor
Gerhardstein LP, Allswede MT, Sloan CT, Lorenz RP. Reduction in the rate of cesarean birth with active management of labor and intermediate-dose oxytocin. J Reprod Med. 1995 Jan;40(1):4-8.
Not a study of elective induction of labor or predictors of success in the setting of induced labor
Gibb DM, Arulkumaran S, Heng SH, Ratnam SS. Characteristics of induced labour. Asia Oceania J Obstet Gynaecol. 1985 Mar;11(1):27-31.
Duplicate of Included Study
Glantz JC. Labor induction rate variation in upstate New York: what is the difference? Birth. 2003 Sep;30(3):168-74.
Ineligible Study Design
D-6

Article Reason for exclusion Goeree R, Hannah M, Hewson S. Cost-effectiveness of induction of labour versus serial antenatal monitoring in the Canadian Multicentre Postterm Pregnancy Trial. CMAJ. 1995 May 1;152(9):1445-50.
No eligible outcomes
Goldberg CC, Kallen MA, McCurdy CM, Miller HS. Effect of intrapartum use of oxytocin on estimated blood loss and hematocrit change at vaginal delivery. Am J Perinatol. 1996 Aug;13(6):373-6.
Not a study of elective induction of labor or predictors of success in the setting of induced labor
Gonen O, Rosen DJ, Dolfin Z, Tepper R, Markov S, Fejgin MD. Induction of labor versus expectant management in macrosomia: a randomized study. Obstet Gynecol. 1997 Jun;89(6):913-7.
Not a study of elective induction of labor or predictors of success in the setting of induced labor
Gonen R, Degani S, Ron A. Prediction of successful induction of labor: comparison of transvaginal ultrasonography and the Bishop score. Eur J Ultrasound. 1998 Aug;7(3):183-7.
Not a study of elective induction of labor or predictors of success in the setting of induced labor
Gopalani S, Bennett K, Critchlow C. Factors predictive of failed operative vaginal delivery. Am J Obstet Gynecol. 2004 Sep;191(3):896-902.
Not a study of elective induction of labor or predictors of success in the setting of induced labor
Grant JM. Induction of labour confers benefits in prolonged pregnancy. Br J Obstet Gynaecol. 1994 Feb;101(2):99-102.
Ineligible Study Design
Graves BW, DeJoy SA, Heath A, Pekow P. Maternal body mass index, delivery route, and induction of labor in a midwifery caseload. J Midwifery Womens Health. 2006 Jul-Aug;51(4):254-9.
Data not usable
Hack M, Fanaroff AA, Klaus MH, Mendelawitz BD, Merkatz IR. Neonatal respiratory distress following elective delivery. A preventable disease? Am J Obstet Gynecol. 1976 Sep 1;126(1):43-7.
Other
Hallak M, Bottoms SF. Induction of labor in patients with term premature rupture of membranes. Effect on perinatal outcome. Fetal Diagn Ther. 1999 May-Jun;14(3):138-42.
Not a study of elective induction of labor or predictors of success in the setting of induced labor
Halpern SH, Breen TW, Campbell DC, Muir HA, Kronberg J, Nunn R, et al. A multicenter, randomized, controlled trial comparing bupivacaine with ropivacaine for labor analgesia. Anesthesiology. 2003 Jun;98(6):1431-5.
Not a study of elective induction of labor or predictors of success in the setting of induced labor
Hamad SA, el-Domiaty BA, Philips DA, Nayel SA. Neonatal hyperbilirubinemia in oxytocin augmented labour. Asia Oceania J Obstet Gynaecol. 1985 Mar;11(1):69-73.
Not a study of elective induction of labor or predictors of success in the setting of induced labor
Hannah ME, Hodnett ED, Willan A, Foster GA, Di Cecco R, Helewa M. Prelabor rupture of the membranes at term: expectant management at home or in hospital? The TermPROM Study Group. Obstet Gynecol. 2000 Oct;96(4):533-8.
Not a study of elective induction of labor or predictors of success in the setting of induced labor
Hannah ME, Huh C, Hewson SA, Hannah WJ. Postterm pregnancy: putting the merits of a policy of induction of labor into perspective. Birth. 1996 Mar;23(1):13-9.
Duplicate of Included Study
Harlap S, Kaufman R, Prywes R, Davies AM, Sterk VV, Weiskopf P. Patterns of obstetric intervention in a total population. A report from the Jerusalem perinatal study. Isr J Med Sci. 1971 Oct;7(10):1115-27.
Not a study of elective induction of labor or predictors of success in the setting of induced labor
Hatch MC. Maternal deaths associated with induction of labor. N Y State J Med. 1969 Feb 15;69(4):599-602.
Ineligible Study Design
Haukkamaa M, Purhonen M, Teramo K. The monitoring of labor by telemetry. J Perinat Med. 1982;10(1):17-22.
Not a study of elective induction of labor or predictors of success in the setting of induced labor
Hauth JC, Hankins GD, Gilstrap LC, 3rd. Uterine contraction pressures achieved in parturients with active phase arrest. Obstet Gynecol. 1991 Sep;78(3 Pt 1):344-7.
Not a study of elective induction of labor or predictors of success in the setting of induced labor
Hemminki E, Saarikoski S. Ambulation and delayed amniotomy in the first stage of labor. Eur J Obstet Gynecol Reprod Biol. 1983 Jul;15(3):129-39.
Not a study of elective induction of labor or predictors of success in the setting of induced labor
D-7

Article Reason for exclusion Hendricks CH. The control of labor. Gynecol Invest. 1970;1:Suppl:37-54.
Ineligible Study Design
Hess PE, Pratt SD, Soni AK, Sarna MC, Oriol NE. An association between severe labor pain and cesarean delivery. Anesth Analg. 2000 Apr;90(4):881-6.
Not a study of elective induction of labor or predictors of success in the setting of induced labor
Higgins J, Gleeson R, Holohan M, Cooney C, Darling M. Maternal and neonatal hyponatraemia: a comparison of Hartmanns solution with 5% dextrose for the delivery of oxytocin in labour. Eur J Obstet Gynecol Reprod Biol. 1996 Sep;68(1-2):47-8.
Method of induction study
Hin LY, Lau TK, Rogers M, Chang AM. Antepartum and intrapartum prediction of cesarean need: risk scoring in singleton pregnancies. Obstet Gynecol. 1997 Aug;90(2):183-6.
Not a study of elective induction of labor or predictors of success in the setting of induced labor
Horrigan TJ. Physicians who induce labor for fetal macrosomia do not reduce cesarean delivery rates. J Perinatol. 2001 Mar;21(2):93-6.
Not a study of elective induction of labor or predictors of success in the setting of induced labor
Howie P. Induction of labour--does it save babies? Nurs Mirror. 1978 Mar 30;146(13):21-4.
Not a study of elective induction of labor or predictors of success in the setting of induced labor
Howie PW, McNay MB, McIlwaine GM, Macnaughton MC. Induction of labour and perinatal mortality. Br Med J. 1977 Apr 9;1(6066):974-5.
Ineligible Study Design
Hoy J, Venn A, Halliday J, Kovacs G, Waalwyk K. Perinatal and obstetric outcomes of donor insemination using cryopreserved semen in Victoria, Australia. Hum Reprod. 1999 Jul;14(7):1760-4.
Not a study of elective induction of labor or predictors of success in the setting of induced labor
Hueston WJ, McClaflin RR, Claire E. Variations in cesarean delivery for fetal distress. J Fam Pract. 1996 Nov;43(5):461-7.
Not a study of elective induction of labor or predictors of success in the setting of induced labor
Induction of labour. Br Med J. 1979 Aug 18;2(6187):407-8. Ineligible Study Design Induction of labour. Eur J Obstet Gynecol Reprod Biol. 1983 Aug;15(4-6):319-32.
Ineligible Study Design
Jarvelin MR, Hartikainen-Sorri AL, Rantakallio P. Labour induction policy in hospitals of different levels of specialisation. Br J Obstet Gynaecol. 1993 Apr;100(4):310-5.
Not a study of elective induction of labor or predictors of success in the setting of induced labor
Jazayeri A, Heffron JA, Phillips R, Spellacy WN. Macrosomia prediction using ultrasound fetal abdominal circumference of 35 centimeters or more. Obstet Gynecol. 1999 Apr;93(4):523-6.
Not a study of elective induction of labor or predictors of success in the setting of induced labor
Jeffares MJ. A multifactorial survey of neonatal juandice. Br J Obstet Gynaecol. 1977 Jun;84(6):452-5.
Not a study of elective induction of labor or predictors of success in the setting of induced labor
Jensen DM, Damm P, Sorensen B, Molsted-Pedersen L, Westergaard JG, Klebe J, et al. Clinical impact of mild carbohydrate intolerance in pregnancy: a study of 2904 nondiabetic Danish women with risk factors for gestational diabetes mellitus. Am J Obstet Gynecol. 2001 Aug;185(2):413-9.
Not a study of elective induction of labor or predictors of success in the setting of induced labor
Jensen DM, Damm P, Sorensen B, Molsted-Pedersen L, Westergaard JG, Ovesen P, et al. Pregnancy outcome and prepregnancy body mass index in 2459 glucose-tolerant Danish women. Am J Obstet Gynecol. 2003 Jul;189(1):239-44.
Not a study of elective induction of labor or predictors of success in the setting of induced labor
Jensen DM, Ovesen P, Beck-Nielsen H, Molsted-Pedersen L, Sorensen B, Vinter C, et al. Gestational weight gain and pregnancy outcomes in 481 obese glucose-tolerant women. Diabetes Care. 2005 Sep;28(9):2118-22.
No eligible outcomes
Jensen H, Agger AO, Rasmussen KL. The influence of prepregnancy body mass index on labor complications. Acta Obstet Gynecol Scand. 1999 Oct;78(9):799-802.
Not a study of elective induction of labor or predictors of success in the setting of induced labor
D-8

Article Reason for exclusion Johnson EB, Reed SD, Hitti J, Batra M. Increased risk of adverse pregnancy outcome among Somali immigrants in Washington state. Am J Obstet Gynecol. 2005 Aug;193(2):475-82.
Not a study of elective induction of labor or predictors of success in the setting of induced labor
Johnson JD, Aldrich M, Angelus P, Stevenson DK, Smith DW, Herschel MJ, et al. Oxytocin and neonatal hyperbilirubinemia. Studies of bilirubin production. Am J Dis Child. 1984 Nov;138(11):1047-50.
Not a study of elective induction of labor or predictors of success in the setting of induced labor
Johnson JM, Harman CR, Lange IR, Manning FA. Biophysical profile scoring in the management of the postterm pregnancy: an analysis of 307 patients. Am J Obstet Gynecol. 1986 Feb;154(2):269-73.
Not a study of elective induction of labor or predictors of success in the setting of induced labor
Johnson N, Lilford R, Guthrie K, Thornton J, Barker M, Kelly M. Randomised trial comparing a policy of early with selective amniotomy in uncomplicated labour at term. Br J Obstet Gynaecol. 1997 Mar;104(3):340-6.
Not a study of elective induction of labor or predictors of success in the setting of induced labor
Joseph KS, Young DC, Dodds L, O'Connell CM, Allen VM, Chandra S, et al. Changes in maternal characteristics and obstetric practice and recent increases in primary cesarean delivery. Obstet Gynecol. 2003 Oct;102(4):791-800.
Not a study of elective induction of labor or predictors of success in the setting of induced labor
Kabiru W, Raynor BD. Obstetric outcomes associated with increase in BMI category during pregnancy. Am J Obstet Gynecol. 2004 Sep;191(3):928-32.
Data not usable
Kalish RB, McCullough L, Gupta M, Thaler HT, Chervenak FA. Intrapartum elective cesarean delivery: a previously unrecognized clinical entity. Obstet Gynecol. 2004 Jun;103(6):1137-41.
Not a study of elective induction of labor or predictors of success in the setting of induced labor
Kassis A, Mazor M, Leiberman JR, Cohen A, Insler V. Management of post-date pregnancy: a case control study. Isr J Med Sci. 1991 Feb;27(2):82-6.
Not a study of elective induction of labor or predictors of success in the setting of induced labor
Kaul B, Vallejo MC, Ramanathan S, Mandell G, Phelps AL, Daftary AR. Induction of labor with oxytocin increases cesarean section rate as compared with oxytocin for augmentation of spontaneous labor in nulliparous parturients controlled for lumbar epidural analgesia. J Clin Anesth. 2004 Sep;16(6):411-4.
Method of induction study
Kramer MS, Rouleau J, Baskett TF, Joseph KS. Amniotic-fluid embolism and medical induction of labour: a retrospective, population-based cohort study. Lancet. 2006 Oct 21;368(9545):1444-8.
Not a study of elective induction of labor or predictors of success in the setting of induced labor
Kreiser D, el-Sayed YY, Sorem KA, Chitkara U, Holbrook RH, Jr., Druzin ML. Decreased amniotic fluid index in low-risk pregnancy. J Reprod Med. 2001 Aug;46(8):743-6.
Not a study of elective induction of labor or predictors of success in the setting of induced labor
Krohn MA, Hitti J. Characteristics of women with clinical intra-amniotic infection who deliver preterm compared with term. Am J Epidemiol. 1998 Jan 15;147(2):111-6.
Not a study of elective induction of labor or predictors of success in the setting of induced labor
Kulkarni SK, Matadial L. Prolonged pregnancy--a rational approach to management. West Indian Med J. 1986 Dec;35(4):314-7.
Not a study of elective induction of labor or predictors of success in the setting of induced labor
Ladfors L, Tessin I, Mattsson LA, Eriksson M, Seeberg S, Fall O. Risk factors for neonatal sepsis in offspring of women with prelabor rupture of the membranes at 34-42 weeks. J Perinat Med. 1998;26(2):94-101.
Not a study of elective induction of labor or predictors of success in the setting of induced labor
Lampe LG, Komaromy B, Gaal J. Selective planned induction of labor. Acta Chir Acad Sci Hung. 1980;21(1):43-53.
Duplicate of Included Study
Lange AP. Induction of labour. Dan Med Bull. 1984 Apr;31(2):89-108. Ineligible Study Design Laor D, Seidman DS, Yaffe H, Voss E, Diamant YZ, Gale R. A prospective study of the active management of labor in women of high parity. Eur J Obstet Gynecol Reprod Biol. 1989 Feb;30(2):111-5.
Not a study of elective induction of labor or predictors of success in the setting of induced labor
D-9

Article Reason for exclusion Le Guennec JC, Bard H, Teasdale F, Doray B. Elective delivery and the neonatal respiratory distress syndrome. Can Med Assoc J. 1980 Feb 9;122(3):307-9.
Not a study of elective induction of labor or predictors of success in the setting of induced labor
Le Ray C, Carayol M, Zeitlin J, Breart G, Goffinet F. Level of perinatal care of the maternity unit and rate of cesarean in low-risk nulliparas. Obstet Gynecol. 2006 Jun;107(6):1269-77.
Not a study of elective induction of labor or predictors of success in the setting of induced labor
Lea SJ, Lea C. Influence of certain aspects of management of labour upon time and mode of delivery. Midwives Chron. 1987 Oct;100(1197):309-12.
Not a study of elective induction of labor or predictors of success in the setting of induced labor
Leaphart WL, Meyer MC, Capeless EL. Labor induction with a prenatal diagnosis of fetal macrosomia. J Matern Fetal Med. 1997 Mar-Apr;6(2):99-102.
Not a study of elective induction of labor or predictors of success in the setting of induced labor
Leeman L, Leeman R. A Native American community with a 7% cesarean delivery rate: does case mix, ethnicity, or labor management explain the low rate? Ann Fam Med. 2003 May-Jun;1(1):36-43.
Not a study of elective induction of labor or predictors of success in the setting of induced labor
Leeson TJ, smith A. Induction of labour and perinatal mortality. Br Med J. 1977 May 21;1(6072):1354-5.
Ineligible Study Design
Leighton BL, Halpern SH, Wilson DB. Lumbar sympathetic blocks speed early and second stage induced labor in nulliparous women. Anesthesiology. 1999 Apr;90(4):1039-46.
Not a study of elective induction of labor or predictors of success in the setting of induced labor
Leijon I, Finnstrom O, Hedenskog S, Ryden G, Tylleskar J. Spontaneous labor and elective induction--a prospective randomized study. II. Bilirubin levels in the neonatal period. Acta Obstet Gynecol Scand. 1980;59(2):103-6.
Duplicate of Included Study
Leijon I, Finnstrom O, Hedenskog S, Ryden G, Tylleskar J. Spontaneous labour and elective induction--a prospective randomized study. Behavioural assessment and neurological examination in the newborn period. Acta Paediatr Scand. 1979 Jul;68(4):553-60.
Duplicate of Included Study
Leveno KJ, Cunningham FG, Nelson S, Roark M, Williams ML, Guzick D, et al. A prospective comparison of selective and universal electronic fetal monitoring in 34,995 pregnancies. N Engl J Med. 1986 Sep 4;315(10):615-9.
Not a study of elective induction of labor or predictors of success in the setting of induced labor
Leveno KJ, Cunningham FG, Pritchard JA. Cesarean section: an answer to the House of Horne. Am J Obstet Gynecol. 1985 Dec 15;153(8):838-44.
Not a study of elective induction of labor or predictors of success in the setting of induced labor
Lilienthal CM, Ward JP. Medical induction of labour. J Obstet Gynaecol Br Commonw. 1971 Apr;78(4):317-21.
Not a study of elective induction of labor or predictors of success in the setting of induced labor
Lillie EW. Advances in obstetrics. Practitioner. 1973 Oct;211(264):451-8.
Ineligible Study Design
Locatelli A, Vergani P, Toso L, Verderio M, Pezzullo JC, Ghidini A. Perinatal outcome associated with oligohydramnios in uncomplicated term pregnancies. Arch Gynecol Obstet. 2004 Jan;269(2):130-3.
Not a study of elective induction of labor or predictors of success in the setting of induced labor
Lubarsky SL, Schiff E, Friedman SA, Mercer BM, Sibai BM. Obstetric characteristics among nulliparas under age 15. Obstet Gynecol. 1994 Sep;84(3):365-8.
Not a study of elective induction of labor or predictors of success in the setting of induced labor
Lumley J. Antepartum fetal heart rate tests and induction of labour. Women Health. 1982 Fall-Winter;7(3-4):9-28.
Ineligible Study Design
Lyndrup J, Legarth J, Weber T, Nickelsen C, Guldbaek E. Predictive value of pelvic scores for induction of labor by local PGE2. Eur J Obstet Gynecol Reprod Biol. 1992 Oct 23;47(1):17-23.
Not a study of elective induction of labor or predictors of success in the setting of induced labor
Lyndrup J, Weber T, Legarth J, Nickelsen C, Guldbaek E. Prediction of mode of delivery and 'DisFIL score' following induction of labor by local PGE2. Eur J Obstet Gynecol Reprod Biol. 1993 Nov;52(1):11-9.
Data not usable
D-10

Article Reason for exclusion MacDonald D. Surgical induction of labor. Am J Obstet Gynecol. 1970 Jul 15;107(6):908-11.
Not a study of elective induction of labor or predictors of success in the setting of induced labor
Maclnnis DR. Elective induction. N S Med Bull. 1970 Feb;49(1):10-1. Ineligible Study Design Macnaughton MC. Management of labor--British style. Clin Obstet Gynecol. 1982 Mar;25(1):137-44.
Not a study of elective induction of labor or predictors of success in the setting of induced labor
MacVicar J. Acceleration and augmentation of labour. Scott Med J. 1973 Nov;18(6):201-14.
Not a study of elective induction of labor or predictors of success in the setting of induced labor
MacVicar J. Failed induction of labour. J Obstet Gynaecol Br Commonw. 1971 Nov;78(11):1007-9.
Not a study of elective induction of labor or predictors of success in the setting of induced labor
Magann EF, Chauhan SP, Nevils BG, McNamara MF, Kinsella MJ, Morrison JC. Management of pregnancies beyond forty-one weeks' gestation with an unfavorable cervix. Am J Obstet Gynecol. 1998 Jun;178(6):1279-87.
Post-term
Magann EF, Kinsella MJ, Chauhan SP, McNamara MF, Gehring BW, Morrison JC. Does an amniotic fluid index of </=5 cm necessitate delivery in high-risk pregnancies? A case-control study. Am J Obstet Gynecol. 1999 Jun;180(6 Pt 1):1354-9.
Not a study of elective induction of labor or predictors of success in the setting of induced labor
Magann EF, McNamara MF, Whitworth NS, Chauhan SP, Thorpe RA, Morrison JC. Can we decrease postdatism in women with an unfavorable cervix and a negative fetal fibronectin test result at term by serial membrane sweeping? Am J Obstet Gynecol. 1998 Oct;179(4):890-4.
Not a study of elective induction of labor or predictors of success in the setting of induced labor
Main EK, Moore D, Farrell B, Schimmel LD, Altman RJ, Abrahams C, et al. Is there a useful cesarean birth measure? Assessment of the nulliparous term singleton vertex cesarean birth rate as a tool for obstetric quality improvement. Am J Obstet Gynecol. 2006 Jun;194(6):1644-51; discussion 51-2.
Data not usable
Maisels MJ, Rees R, Marks K, Friedman Z. Elective delivery of the term fetus. An obstetrical hazard. JAMA. 1977 Nov 7;238(19):2036-9.
Other
Mancuso S, Ferrazzani S, De Carolis S, Carducci B, De Santis L, Caruso A. Term and postterm low-risk pregnancies: management schemes for the reduction of high rates of cesarean section. Minerva Ginecol. 1996 Mar;48(3):95-8.
Not a study of elective induction of labor or predictors of success in the setting of induced labor
Martel M, Wacholder S, Lippman A, Brohan J, Hamilton E. Maternal age and primary cesarean section rates: a multivariate analysis. Am J Obstet Gynecol. 1987 Feb;156(2):305-8.
Not a study of elective induction of labor or predictors of success in the setting of induced labor
Martin JN, Jr., Sessums JK, Howard P, Martin RW, Morrison JC. Alternative approaches to the management of gravidas with prolonged-postterm-postdate pregnancies. J Miss State Med Assoc. 1989 Apr;30(4):105-11.
Post-term
Mathews TJ. Trends in stimulation and induction of labor 1989-1995. Stat Bull Metrop Insur Co. 1997 Oct-Dec;78(4):20-6.
Ineligible Study Design
Mawdsley SD, Baskett TF. Outcome of the next labour in women who had a vaginal delivery in their first pregnancy. BJOG. 2000 Jul;107(7):932-4.
Not a study of elective induction of labor or predictors of success in the setting of induced labor
McNay MB, McIlwaine GM, Howie PW, Macnaughton MC. Perinatal deaths: analysis by clinical cause to assess value of induction of labour. Br Med J. 1977 Feb 5;1(6057):347-50.
Other
D-11

Article Reason for exclusion Michlin R, Oettinger M, Odeh M, Khoury S, Ophir E, Barak M, et al. Maternal obesity and pregnancy outcome. Isr Med Assoc J. 2000 Jan;2(1):10-3.
Not a study of elective induction of labor or predictors of success in the setting of induced labor
Miller F. Uterine activity, labor management, and perinatal outcome. Semin Perinatol. 1978 Apr;2(2):181-6.
Ineligible Study Design
Moore LE, Rayburn WF. Elective induction of labor. Clin Obstet Gynecol. 2006 Sep;49(3):698-704.
Ineligible Study Design
Morgan MA, Thurnau GR, Fishburne JI, Jr. The fetal-pelvic index as an indicator of fetal-pelvic disproportion: a preliminary report. Am J Obstet Gynecol. 1986 Sep;155(3):608-13.
Not a study of elective induction of labor or predictors of success in the setting of induced labor
Morgan MA, Thurnau GR. Efficacy of the fetal-pelvic index for delivery of neonates weighing 4000 grams or greater: a preliminary report. Am J Obstet Gynecol. 1988 May;158(5):1133-7.
Not a study of elective induction of labor or predictors of success in the setting of induced labor
Morita N, Matsushima N, Ogata N, Saeki K, Ishibashi M, Komukai H, et al. Nationwide description of live Japanese births by day of the week, hour, and location. J Epidemiol. 2002 Jul;12(4):330-5.
Not a study of elective induction of labor or predictors of success in the setting of induced labor
Muhlen-Schulte L, Wade K. Intervention in childbirth and neonatal responsiveness. Community Health Stud. 1988;12(1):69-81.
Not a study of elective induction of labor or predictors of success in the setting of induced labor
Muldoon MJ. A prospective study of intrauterine infection following surgical induction of labour. J Obstet Gynaecol Br Commonw. 1968 Nov;75(11):1144-50.
Not a study of elective induction of labor or predictors of success in the setting of induced labor
Mutlu Meydanli M, Caliskan E, Haberal A. Prediction of adverse outcome associated with vaginal misoprostol for labor induction. Eur J Obstet Gynecol Reprod Biol. 2003 Oct 10;110(2):143-8.
Data not usable
Myles TD, Santolaya J. Maternal and neonatal outcomes in patients with a prolonged second stage of labor. Obstet Gynecol. 2003 Jul;102(1):52-8.
Not a study of elective induction of labor or predictors of success in the setting of induced labor
Nassar AH, Fayyumy R, Saab W, Mehio G, Usta IM. Grandmultiparas in modern obstetrics. Am J Perinatol. 2006 Aug;23(6):345-9.
Not a study of elective induction of labor or predictors of success in the setting of induced labor
Nicholson JM, Kellar LC, Cronholm PF, Macones GA. Active management of risk in pregnancy at term in an urban population: an association between a higher induction of labor rate and a lower cesarean delivery rate. Am J Obstet Gynecol. 2004 Nov;191(5):1516-28.
Not a study of elective induction of labor or predictors of success in the setting of induced labor
Niswander KR, Turoff BB, Romans J. Developmental status of children delivered through elective induction of labor. Results of a 4-year follow-up study. Obstet Gynecol. 1966 Jan;27(1):15-20.
No eligible outcomes
Novakov-Mikic A, Ivanovic L, Dukanac J. Transvaginal ultrasonography of uterine cervix in prediction of the outcome of labour induction. Med Pregl. 2000 Nov-Dec;53(11-12):569-78.
Not a study of elective induction of labor or predictors of success in the setting of induced labor
Oats JN, Abell DA, Andersen HM, Beischer NA. Obesity in pregnancy. Compr Ther. 1983 Apr;9(4):51-5.
Not a study of elective induction of labor or predictors of success in the setting of induced labor
O'Connor RA. Induction of labour--not how but why? Br J Hosp Med. 1994 Dec 14-1995 Jan 17;52(11):559-63.
Not a study of elective induction of labor or predictors of success in the setting of induced labor
O'Driscol K, Carroll CJ, Coughlan M. Selective induction of labour. Br Med J. 1975 Dec 27;4(5999):727-9.
Not a study of elective induction of labor or predictors of success in the setting of induced labor
O'Driscoll K, Foley M, MacDonald D. Active management of labor as an alternative to cesarean section for dystocia. Obstet Gynecol. 1984 Apr;63(4):485-90.
Not a study of elective induction of labor or predictors of success in the setting of induced labor
D-12

Article Reason for exclusion Opaneye AA. Labour and delivery after a prolonged interval between the present and the last pregnancy. Br J Obstet Gynaecol. 1983 Dec;90(12):1180-2.
Not a study of elective induction of labor or predictors of success in the setting of induced labor
Ottervanger HP, Keirse MJ, Smit W, Holm JP. Controlled comparison of induction versus expectant care for prelabor rupture of the membranes at term. J Perinat Med. 1996;24(3):237-42.
Not a study of elective induction of labor or predictors of success in the setting of induced labor
Out JJ, Vierhout ME, Verhage F, Duivenvoorden HJ, Wallenburg HC. Characteristics and motives of women choosing elective induction of labour. J Psychosom Res. 1986;30(3):375-80.
No eligible outcomes
Out JJ, Vierhout ME, Verhage F, Duivenvoorden HJ, Wallenburg HC. Elective induction of labor: a prospective clinical study, II: Psychological effects. J Perinat Med. 1985;13(4):163-70.
Duplicate of Included Study
Out JJ, Vierhout ME, Wallenburg HC. Breast-feeding following spontaneous and induced labour. Eur J Obstet Gynecol Reprod Biol. 1988 Dec;29(4):275-9
Duplicate of Included Study
Paterson-Brown S, Fisk NM, Edmonds DK, Rodeck CH. Preinduction cervical assessment by Bishop's score and transvaginal ultrasound. Eur J Obstet Gynecol Reprod Biol. 1991 Jun 5;40(1):17-23.
Not a study of elective induction of labor or predictors of success in the setting of induced labor
Patton LL, English EC, Hambleton JD. Childbirth preparation and outcomes of labor and delivery in primiparous women. J Fam Pract. 1985 Apr;20(4):375-8.
Not a study of elective induction of labor or predictors of success in the setting of induced labor
Peleg D, Hannah ME, Hodnett ED, Foster GA, Willan AR, Farine D. Predictors of cesarean delivery after prelabor rupture of membranes at term. Obstet Gynecol. 1999 Jun;93(6):1031-5.
Data not usable
Peregrine E, O'Brien P, Jauniaux E. Impact on delivery outcome of ultrasonographic fetal head position prior to induction of labor. Obstet Gynecol. 2007 Mar;109(3):618-25.
Duplicate of Included Study
Peregrine E, O'Brien P, Jauniaux E. Ultrasound detection of nuchal cord prior to labor induction and the risk of Cesarean section. Ultrasound Obstet Gynecol. 2005 Feb;25(2):160-4.
Not a study of elective induction of labor or predictors of success in the setting of induced labor
Phillip H, Fletcher H, Reid M. The impact of induced labour on postpartum blood loss. J Obstet Gynaecol. 2004 Jan;24(1):12-5.
Method of induction study
Phillips WR, Rice GA, Layton RH. Audit of obstetrical care and outcome in family medicine, obstetrics, and general practice. J Fam Pract. 1978 Jun;6(6):1209-16.
Not a study of elective induction of labor or predictors of success in the setting of induced labor
Pinkerton JH, Carson M. Caesarean section after surgical induction of labour. J Obstet Gynaecol Br Commonw. 1968 Dec;75(12):1287-90.
Ineligible Study Design
Pinkerton JH, Martin DH, Thompson W. Selective planned induction in conditions of civil strife. Lancet. 1975 Jan 25;1(7900):197-8.
Ineligible Study Design
Pinkerton JH. Fetal rights. The first Belfast Royal Maternity Hospital Perinatal Lecture. Ulster Med J. 1985 Apr;54(1):30-40.
Not a study of elective induction of labor or predictors of success in the setting of induced labor
Pinkerton JH. Induction of labour on behalf of the fetus. J Ir Med Assoc. 1973 Nov 10;66(21):592-6.
Ineligible Study Design
Poma PA. Effects of obstetrician characteristics on cesarean delivery rates. A community hospital experience. Am J Obstet Gynecol. 1999 Jun;180(6 Pt 1):1364-72.
Not a study of elective induction of labor or predictors of success in the setting of induced labor
Postpartum haemorrhage after induced and spontaneous labour. Br Med J. 1978 Oct 21;2(6145):1162.
Not a study of elective induction of labor or predictors of success in the setting of induced labor
Prolonged pregnancy: the management debate. BMJ. 1988 Sep 17;297(6650):715-7.
Not a study of elective induction of labor or predictors of success in the setting of induced labor
D-13

Article Reason for exclusion Ramanathan G, Yu C, Osei E, Nicolaides KH. Ultrasound examination at 37 weeks' gestation in the prediction of pregnancy outcome: the value of cervical assessment. Ultrasound Obstet Gynecol. 2003 Dec;22(6):598-603.
Not a study of elective induction of labor or predictors of success in the setting of induced labor
Ramsewak S, Roopnarinesingh S, Robinson J. Another look at the effects of advanced maternal age. West Indian Med J. 1991 Jun;40(2):86-8.
Not a study of elective induction of labor or predictors of success in the setting of induced labor
Rane SM, Guirgis RR, Higgins B, Nicolaides KH. Models for the prediction of successful induction of labor based on pre-induction sonographic measurement of cervical length. J Matern Fetal Neonatal Med. 2005 May;17(5):315-22.
Post-term
Rane SM, Guirgis RR, Higgins B, Nicolaides KH. The value of ultrasound in the prediction of successful induction of labor. Ultrasound Obstet Gynecol. 2004 Oct;24(5):538-49.
Data not usable
Reis FM, Gervasi MT, Florio P, Bracalente G, Fadalti M, Severi FM, et al. Prediction of successful induction of labor at term: role of clinical history, digital examination, ultrasound assessment of the cervix, and fetal fibronectin assay. Am J Obstet Gynecol. 2003 Nov;189(5):1361-7.
Data not usable
Rhoades DA, Latza U, Mueller BA. Risk factors and outcomes associated with nuchal cord. A population-based study. J Reprod Med. 1999 Jan;44(1):39-45.
Not a study of elective induction of labor or predictors of success in the setting of induced labor
Richards MP. The induction and acceleration of labour: some benefits and complications. Early Hum Dev. 1977 Oct;1(1):3-17.
Ineligible Study Design
Rindfuss RR, Gortmaker SL, Ladinsky JL. Elective induction and stimulation of labor and the health of the infant. Am J Public Health. 1978 Sep;68(9):872-7.
Not a study of elective induction of labor or predictors of success in the setting of induced labor
Rindfuss RR, Ladinsky JL. Patterns of births: implications for the incidence of elective induction. Med Care. 1976 Aug;14(8):685-93.
No eligible outcomes
Rinehart BK, Terrone DA, Hudson C, Isler CM, Larmon JE, Perry KG, Jr. Lack of utility of standard labor curves in the prediction of progression during labor induction. Am J Obstet Gynecol. 2000 Jun;182(6):1520-6.
Not a study of elective induction of labor or predictors of success in the setting of induced labor
Ritchie JW, Boyle DD. The active management of labour. Br J Hosp Med. 1981 Jul;26(1):61-5.
Not a study of elective induction of labor or predictors of success in the setting of induced labor
Rizzo N, Farina A, Santarsiero G, Di Luzio L, Vitarelli M, Bovicelli A, et al. Amniotic fluid index and labor length of pregnancies induced beyond 41 weeks of gestation with unfavorable cervix. Gynecol Obstet Invest. 2000;49(4):244-8.
Duplicate of Included Study
Roach VJ, Rogers MS. Pregnancy outcome beyond 41 weeks gestation. Int J Gynaecol Obstet. 1997 Oct;59(1):19-24.
Post-term
Roberts A. Midwifery. 1. Induction of labour. Nurs Mirror. 1981 Jul 8;153(2):xxi-xxv.
Ineligible Study Design
Roberts CL, Taylor L, Henderson-Smart D. Trends in births at and beyond term: evidence of a change? Br J Obstet Gynaecol. 1999 Sep;106(9):937-42.
Not a study of elective induction of labor or predictors of success in the setting of induced labor
Robertson EG. Induction of labour. Br Med J. 1970 Aug 15;3(5719):405.
Ineligible Study Design
Rogers R, Gilson GJ, Miller AC, Izquierdo LE, Curet LB, Qualls CR. Active management of labor: does it make a difference? Am J Obstet Gynecol. 1997 Sep;177(3):599-605.
Other
Rojansky N, Tanos V, Reubinoff B, Shapira S, Weinstein D. Effect of epidural analgesia on duration and outcome of induced labor. Int J Gynaecol Obstet. 1997 Mar;56(3):237-44.
Not a study of elective induction of labor or predictors of success in the setting of induced labor
D-14

Article Reason for exclusion Roman H, Verspyck E, Vercoustre L, Degre S, Col JY, Firmin JM, et al. Does ultrasound examination when the cervix is unfavorable improve the prediction of failed labor induction? Ultrasound Obstet Gynecol. 2004 Apr;23(4):357-62.
Not a study of elective induction of labor or predictors of success in the setting of induced labor
Rosen R. Planned early birth vs. expectant management for PROM. Am Fam Physician. 2006 Jul 1;74(1):79-80.
Ineligible Study Design
Rouse DJ, Owen J, Hauth JC. Criteria for failed labor induction: prospective evaluation of a standardized protocol. Obstet Gynecol. 2000 Nov;96(5 Pt 1):671-7.
Not a study of elective induction of labor or predictors of success in the setting of induced labor
Rovas L, Sladkevicius P, Strobel E, Valentin L. Three-dimensional power Doppler ultrasound assessment of the cervix for the prediction of successful induction of labor with prostaglandin in prolonged pregnancy. J Ultrasound Med. 2005 Jul;24(7):933-9.
Post-term
Rozenberg P, Chevret S, Chastang C, Ville Y. Comparison of digital and ultrasonographic examination of the cervix in predicting time interval from induction to delivery in women with a low Bishop score. BJOG. 2005 Feb;112(2):192-6.
Not a study of elective induction of labor or predictors of success in the setting of induced labor
Rozenberg P, Goffinet F, Hessabi M. Comparison of the Bishop score, ultrasonographically measured cervical length, and fetal fibronectin assay in predicting time until delivery and type of delivery at term. Am J Obstet Gynecol. 2000 Jan;182(1 Pt 1):108-13.
Not a study of elective induction of labor or predictors of success in the setting of induced labor
Russo JN, Kosar WP. Elective inductions at Hartford Hospital. Trans N Engl Obstet Gynecol Soc. 1964;18:33-41.
No eligible outcomes
Russo JN, Kosar WP. The use of intramuscular oxytocin for the elective induction of labor. Am J Obstet Gynecol. 1967 Jan 15;97(2):203-7.
Data not usable
Sabir N, Dicle O, Yurdakul B, Akkemik B. Can magnetic resonance imaging predict the success of parturition in oxytocin-induced pregnant women? Eur Radiol. 2000;10(5):768-71.
Not a study of elective induction of labor or predictors of success in the setting of induced labor
Sande HA, Tuveng J, Fonstelien T. A prospective randomized study of induction of labor. Int J Gynaecol Obstet. 1983 Aug;21(4):333-6.
Data not usable
Santana W, Meyer A, Flake D, Neher JO. Clinical inquiries. What are the risks and benefits of elective induction for uncomplicated term pregnancies? J Fam Pract. 2006 Nov;55(11):983-5.
Ineligible Study Design
Schulman H, Farmakides G. Role of the unfavorable cervix in the induction of labor. Clin Obstet Gynecol. 1987 Mar;30(1):50-5.
Ineligible Study Design
Schwarcz RL, Belizan JM, Cifuentes JR, Cuadro JC, Marques MB, Caldeyro-Barcia R. Fetal and maternal monitoring in spontaneous labors and in elective inductions. A comparative study. Am J Obstet Gynecol. 1974 Oct 10;120(3):356-62.
No eligible outcomes
Sciscione A, Hoffman MK, DeLuca S, O'Shea A, Benson J, Pollock M, et al. Fetal fibronectin as a predictor of vaginal birth in nulliparas undergoing preinduction cervical ripening. Obstet Gynecol. 2005 Nov;106(5 Pt 1):980-5.
Not a study of elective induction of labor or predictors of success in the setting of induced labor
Searing KA. Induction vs. post-date pregnancies. Exploring the controversy of who's really at risk. AWHONN Lifelines. 2001 Apr-May;5(2):44-8.
Ineligible Study Design
Seffah JD, Armah JO. Amniotic fluid index for screening late pregnancies. East Afr Med J. 1999 Jun;76(6):348-51.
Not a study of elective induction of labor or predictors of success in the setting of induced labor
Seitchik J, Castillo M. Oxytocin augmentation of dysfunctional labor. III. Multiparous patients. Am J Obstet Gynecol. 1983 Apr 1;145(7):777-80.
Not a study of elective induction of labor or predictors of success in the setting of induced labor
D-15

Article Reason for exclusion Seitchik J, Castillo M. Oxytocin augmentation of dysfunctional labor. II. Uterine activity data. Am J Obstet Gynecol. 1983 Mar 1;145(5):526-9.
Not a study of elective induction of labor or predictors of success in the setting of induced labor
Seitchik J, Holden AE, Castillo M. Spontaneous rupture of the membranes, functional dystocia, oxytocin treatment, and the route of delivery. Am J Obstet Gynecol. 1987 Jan;156(1):125-30.
Not a study of elective induction of labor or predictors of success in the setting of induced labor
Semczuk M, Lopucka M. Evaluation of cervix condition according to Bishop score in post term pregnancy. Ann Univ Mariae Curie Sklodowska [Med]. 1986;41:125-31.
Not a study of elective induction of labor or predictors of success in the setting of induced labor
Seneviratne HR, de Silva GD, de Silva MV, Rudra T. Obstetric performance, perinatal outcome and risk of infection to the newborn in spontaneous and artificial rupture of membranes during labour. Ceylon Med J. 1998 Mar;43(1):11-5.
Not a study of elective induction of labor or predictors of success in the setting of induced labor
Setna F, Chatterjee TK, Black MD. An assessment of the safety of surgical induction of labour. J Obstet Gynaecol Br Commonw. 1967 Apr;74(2):262-5.
Not a study of elective induction of labor or predictors of success in the setting of induced labor
Sharma U, Idnani N, Saxena S. Eftects of obstetrical interference on the newborn. Indian J Pediatr. 1978 May;45(364):143-53.
Not a study of elective induction of labor or predictors of success in the setting of induced labor
Shaw KJ, Medearis AL, Horenstein J, Walla CA, Paul RH. Selective labor induction in postterm patients. Observations and outcomes. J Reprod Med. 1992 Feb;37(2):157-61.
Data not usable
Sheikh GN, Prysor-Jones D. The duration of induced labour. J Obstet Gynaecol Br Commonw. 1970 Dec;77(12):1070-6.
Not a study of elective induction of labor or predictors of success in the setting of induced labor
Sheiner E, Levy A, Feinstein U, Hallak M, Mazor M. Risk factors and outcome of failure to progress during the first stage of labor: a population-based study. Acta Obstet Gynecol Scand. 2002 Mar;81(3):222-6.
Not a study of elective induction of labor or predictors of success in the setting of induced labor
Sheiner E, Levy A, Katz M, Mazor M. Short stature--an independent risk factor for Cesarean delivery. Eur J Obstet Gynecol Reprod Biol. 2005 Jun 1;120(2):175-8.
Not a study of elective induction of labor or predictors of success in the setting of induced labor
Sima DG, Neligan GA. Factors affecting the increasing incidence of severe non-haemolytic neonatal jaundice. Br J Obstet Gynaecol. 1975 Nov;82(11):863-7.
Not a study of elective induction of labor or predictors of success in the setting of induced labor
Simhayoff N, Sheiner E, Levy A, Hammel RD, Mazor M, Hallak M. To induce or not to induce labor: a macrosomic dilemma. Gynecol Obstet Invest. 2004;58(3):121-5.
Primarily addressed women with existing medical or obstetric complications
Simpson KR, Poole JH. Labor induction & augmentation. Knowing when, and how, to assist women in labor. AWHONN Lifelines. 1998 Dec;2(6):39-42.
Ineligible Study Design
Simpson KR. Elective preterm birth. MCN Am J Matern Child Nurs. 2006 Jan-Feb;31(1):68.
Ineligible Study Design
Singhi S, Singh M. Erythrocytic osmotic fragility in neonates born following oxytocin infusion during labour. Indian J Med Res. 1980 Dec;72:843-5.
Not a study of elective induction of labor or predictors of success in the setting of induced labor
Sivasuriya M, Tan KL, Salmon YM, Karim SM. Neonatal serum bilirubin levels in spontaneous and induced labour. Br J Obstet Gynaecol. 1978 Aug;85(8):619-23.
Not a study of elective induction of labor or predictors of success in the setting of induced labor
Smith LP, Nagourney BA, McLean FH, Usher RH. Hazards and benefits of elective induction of labor. Am J Obstet Gynecol. Mar 1 1984;148(5):579-585.
Post-term
D-16

Article Reason for exclusion Smith GC, Dellens M, White IR, Pell JP. Combined logistic and Bayesian modeling of cesarean section risk. Am J Obstet Gynecol. 2004 Dec;191(6):2029-34.
Ineligible Study Design
Sobande AA, Albar HM. Outcome of induced labour in pregnancies at 41 weeks gestation and over in Saudi Arabia. East Mediterr Health J. 2003 May;9(3):316-23.
Post-term
Soliman SR, Burrows RF. Cesarean section: analysis of the experience before and after the National Consensus Conference on Aspects of Cesarean Birth. CMAJ. 1993 Apr 15;148(8):1315-20.
Not a study of elective induction of labor or predictors of success in the setting of induced labor
Stewart P, Calder AA. Cervical ripening. Br J Obstet Gynaecol. 1981 Oct;88(10):1071-2.
Ineligible Study Design
Sweeny AL. Elective induction versus spontaneous labor: a case-control analysis of safety and efficacy. Obstet Gynecol. 1998 Dec;92(6):1056-7.
Ineligible Study Design
Tam WH, Tai SM, Rogers MS. Prediction of cervical response to prostaglandin E2 using fetal fibronectin. Acta Obstet Gynecol Scand. 1999 Nov;78(10):861-5.
Data not usable
Tan YY, Yeo GS. Impaired glucose tolerance in pregnancy--is it of consequence? Aust N Z J Obstet Gynaecol. 1996 Aug;36(3):248-55.
Not a study of elective induction of labor or predictors of success in the setting of induced labor
Tannirandorn Y, Jumrustanasan T. A comparative study of membrane stripping and nonstripping for induction of labor in uncomplicated term pregnancy. J Med Assoc Thai. Mar 1999;82(3):229-233.
Not a study of elective induction of labor or predictors of success in the setting of induced labor
Taylor HA. Induction of labor vs. antenatal monitoring in post-term pregnancy. Am Fam Physician. 1997 May 15;55(7):2428, 31.
Ineligible Study Design
The obstetrician's dilemma. Med J Aust. 1976 Dec 4;2(23):855. Ineligible Study Design Thiery M, Martens G, Parewijck W. Induction of labour and postpartum haemorrhage. Br Med J. 1979 May 26;1(6175):1422.
Ineligible Study Design
Thiery M, Vroman S, Vanderheyden K, De Hemptinne D, Derom R, Van Kets H, et al. The fetal effect of prostaglandin F 2 applied in the elective induction of labor at term. J Reprod Med. 1972 Dec;9(6):314-26.
Method of induction study
Traynor JD, Dooley SL, Seyb S, Wong CA, Shadron A. Is the management of epidural analgesia associated with an increased risk of cesarean delivery? Am J Obstet Gynecol. 2000 May;182(5):1058-62.
Not a study of elective induction of labor or predictors of success in the setting of induced labor
Tuck SM, Cardozo LD, Studd JW, Gibb DM, Cooper DJ. Obstetric characteristics in different racial groups. Br J Obstet Gynaecol. 1983 Oct;90(10):892-7.
Not a study of elective induction of labor or predictors of success in the setting of induced labor
Turnbull AC, Anderson AB. Induction of labour. J Obstet Gynaecol Br Commonw. 1967 Dec;74(6):849-54.
Not a study of elective induction of labor or predictors of success in the setting of induced labor
Turner MJ, Brassil M, Gordon H. Active management of labor associated with a decrease in the cesarean section rate in nulliparas. Obstet Gynecol. 1988 Feb;71(2):150-4.
Not a study of elective induction of labor or predictors of success in the setting of induced labor
Turner MJ, Fox R, Brassil M, Gleeson R, Gordon H. Induction of labour postdates in primiparae using vaginal prostaglandin tablets. Ir J Med Sci. 1990 Jan;159(1):6-9.
Not a study of elective induction of labor or predictors of success in the setting of induced labor
Ugwumadu A. Induction of labour confers benefits in prolonged pregnancy. Br J Obstet Gynaecol. 1995 Jan;102(1):79-81.
Ineligible Study Design
Unger C, Zimmermann R, Huch A, Huch R. Does labor start too late? J Perinat Med. 1996;24(6):661-7.
Not a study of elective induction of labor or predictors of success in the setting of induced labor
D-17

Article Reason for exclusion Vahratian A, Zhang J, Troendle JF, Sciscione AC, Hoffman MK. Labor progression and risk of cesarean delivery in electively induced nulliparas. Obstet Gynecol. 2005 Apr;105(4):698-704.
Did not utilize prostaglandins for cervical ripening.
van Enk A, Doornbos HP, Nordbeck HJ. Some characteristics of labor in ethnic minorities in Amsterdam. Int J Gynaecol Obstet. 1990 Dec;33(4):307-11.
Not a study of elective induction of labor or predictors of success in the setting of induced labor
Venturini P, Contu G, Mazza V, Facchinetti F. Induction of labor in women with oligohydramnios. J Matern Fetal Neonatal Med. 2005 Feb;17(2):129-32.
Not a study of elective induction of labor or predictors of success in the setting of induced labor
Vergani P, Ceruti P, Strobelt N, Locatelli A, D'Oria P, Mariani S. Transabdominal amnioinfusion in oligohydramnios at term before induction of labor with intact membranes: a randomized clinical trial. Am J Obstet Gynecol. 1996 Aug;175(2):465-70.
Not a study of elective induction of labor or predictors of success in the setting of induced labor
Vorherr H. Induction and stimulation of labor. Obstet Gynecol Annu. 1974;3(0):283-344.
Ineligible Study Design
Watson WJ, Stevens D, Welter S, Day D. Factors predicting successful labor induction. Obstet Gynecol. 1996 Dec;88(6):990-2.
Not a study of elective induction of labor or predictors of success in the setting of induced labor
Weber DO. At Saddleback Memorial, care maps detail birth process interventions, cutting C-section rate and raising VBACs. Strateg Healthc Excell. 1997 May;10(5):7-9.
Ineligible Study Design
Weekes AR, Beazley JM. Neonatal serum bilirubin levels following the use of prostaglandin E2 in labour. Prostaglandins. 1975 Oct;10(4):699-714.
Not a study of elective induction of labor or predictors of success in the setting of induced labor
Weeks JW, Pitman T, Spinnato JA, 2nd. Fetal macrosomia: does antenatal prediction affect delivery route and birth outcome? Am J Obstet Gynecol. 1995 Oct;173(4):1215-9.
Not a study of elective induction of labor or predictors of success in the setting of induced labor
Weiss G, Goldsmith LT. Relaxin and the cervix. Front Horm Res. 2001;27:105-12.
Ineligible Study Design
Wells J. Effect on the newborn of induced versus spontaneous labor. Obstet Gynecol. 1965 Oct;26(4):580-4.
Not a study of elective induction of labor or predictors of success in the setting of induced labor
Wu BT, Wan M, Zhao X. Labor induction--methods, outcome and inductograph. Chin Med J (Engl). 1987 Apr;100(4):323-6.
Not a study of elective induction of labor or predictors of success in the setting of induced labor
Xenakis EM, Piper JM, Field N, Conway D, Langer O. Preeclampsia: is induction of labor more successful? Obstet Gynecol. 1997 Apr;89(4):600-3.
Primarily addressed women with existing medical or obstetric complications
Yang SH, Roh CR, Kim JH. Transvaginal ultrasonography for cervical assessment before induction of labor. J Ultrasound Med. 2004 Mar;23(3):375-82, quiz 84-5.
Not a study of elective induction of labor or predictors of success in the setting of induced labor
Yogev Y, Ben-Haroush A, Gilboa Y, Chen R, Kaplan B, Hod M. Induction of labor with vaginal prostaglandin E2. J Matern Fetal Neonatal Med. 2003 Jul;14(1):30-4.
Not a study of elective induction of labor or predictors of success in the setting of induced labor
Yudkin P, Frumar AM, Anderson AB, Turnbull AC. A retrospective study of induction of labour. Br J Obstet Gynaecol. 1979 Apr;86(4):257-65.
Not a study of elective induction of labor or predictors of success in the setting of induced labor
Yudkin P. Problems in assessing effects of induction of labour on perinatal mortality. Br J Obstet Gynaecol. 1976 Aug;83(8):603-7.
Not a study of elective induction of labor or predictors of success in the setting of induced labor
Yudkin PL, Redman CW. Caesarean section dissected, 1978-1983. Br J Obstet Gynaecol. 1986 Feb;93(2):135-44.
Not a study of elective induction of labor or predictors of success in the setting of induced labor
D-18

Article Reason for exclusion Zamzami TY. A comparison of induction with vaginal prostaglandin E2 versus spontaneous of labor in grand multiparous women. Arch Gynecol Obstet. 2005 Dec;273(3):176-9.
Not a study of elective induction of labor or predictors of success in the setting of induced labor
Ziadeh SM, Sunna E. Obstetric and perinatal outcome of pregnancies with term labour and meconium-stained amniotic fluid. Arch Gynecol Obstet. 2000 Sep;264(2):84-7.
Not a study of elective induction of labor or predictors of success in the setting of induced labor
D-19

Appendix E. Technical Expert Panel and Peer Reviewers Technical Expert Panel William A. Grobman, M.D., M.B.A., Associate Professor, Division of Maternal-Fetal Medicine,
Department of Medicine, Obstetrics & Gynecology, Northwestern University. George A. Macones, M.D., M.S.C.E., Mitchell and Elaine Yanow Professor, Obstetrics and
Gynecology Chairman, Department of Obstetrics and Gynecology, Washington University in St. Louis.
Susan Meikle, M.D. M.S.P.H., Senior Medical Officer, Office of Research on Women's Health, Office of the Director, NIH.
James M. Nicholson, M.D. M.S.C.E., Assistant Professor, Department of Family Medicine and Community Health, 2 Gates, Hospital of the University of Pennsylvania.
Patrick S. Ramsey, M.D., Associate Professor of Obstetrics and Gynecology, Obstetrics and Gynecology Chair Office, University of Alabama at Birmingham.
Laura E. Riley, M.D., Assistant Professor of Obstetrics, Gynecology and Reproductive Biology, Harvard Medical School, Harvard University.
Julian N. Robinson, M.D., Associate Clinical Professor of Obstetrics, Gynecology and Reproductive Biology, Harvard Medical School, Harvard University.
Dwight J. Rouse, M.D., M.S.P.H., Associate Professor, Obstetrics and Gynecology Maternal and Fetal Medicine, Kirkland Clinic, University of Alabama at Birmingham.
Andrew J. Satin, M.D., F.A.C.O.G., Chair Department of Obstetrics and Gynecology, Johns Hopkins Bayview Medical Center; Vice Chair/Deputy Director, Department of Gynecology and Obstetrics, Johns Hopkins University School of Medicine.
Deborah A. Wing, M.D., Associate Professor and Division Director, Department of Obstetrics and Gynecology, Division of Maternal Fetal Medicine, University of California, Irvine.
Jun "Jim" Zhang, Ph.D., M.D., Senior Investigator, Epidemiology Branch, National Institute of Child Health and Human Development, National Institutes of Health.
Peer Reviewers Leah Albers, C.N.M., Dr.P.H., F.A.C.N.M., F.A.A.N., Professor, U.N.M. College of Nursing,
University of New Mexico, Albuquerque, N.M. Tekoa King, R.N., M.P.H., C.N.M., Deputy Editor of the Journal of Midwifery & Women's
Health and Associate Professor in the Department of Obstetrics, Gynecology and Reproductive Health, University of California San Francisco.
Donna R Halloran, M.D., M.S.P.H., Assistant Professor of Pediatrics, Saint Louis University. Nancy O'Reilly, M.H.S., Manager, Practice Bulletins, American College of Obstetricians and
Gynecologists. Stephen Ratcliffe, M.D., M.S.P.H., Director, Lancaster Pennsylvania Residency Program.
Family and Community Medicine, Lancaster General Hospital, Lancaster, Pennsylvania.
E-1

References for Appendix Tables 1. Abou el-Leil LA, Nasrat AA, Fayed HM.
Prostaglandin E2 vaginal pessaries in the grandmultipara with an unripe cervix, a comparison of different parity groups. Int J Gynaecol Obstet. Feb 1993;40(2):119-122.
2. Ahner R, Egarter C, Kiss H, et al. Fetal
fibronectin as a selection criterion for induction of term labor. Am J Obstet Gynecol. Nov 1995;173(5):1513-1517.
3. Alberico S, Fadalti M, Grimaldi E, De Seta
F, Mazza S, Guaschino S. Eligibility criteria for labor induction with prostaglandins. Clin Exp Obstet Gynecol. 1997;24(2):61-66.
4. Alchalabi HA, Obeidat BR, Jallad MF,
Khader YS. Induction of labor and perinatal outcome: the impact of the amniotic fluid index. Eur J Obstet Gynecol Reprod Biol. Dec 2006;129(2):124-127.
5. Anderson MM. The state of the cervix, and
surgical induction of labour. J Obstet Gynaecol Br Commonw. Oct 1965;72(5):711-716.
6. Arulkumaran S, Gibb DM, TambyRaja RL,
Heng SH, Ratnam SS. Failed induction of labour. Aust N Z J Obstet Gynaecol. Aug 1985;25(3):190-193.
7. Gibb DM, Arulkumaran S, Heng SH,
Ratnam SS. Characteristics of induced labour. Asia Oceania J Obstet Gynaecol. Mar 1985;11(1):27-31.
8. Ben-Haroush A, Glickman H, Yogev Y,
Kaplan B, Feldberg D, Hod M. Induction of labor in pregnancies with suspected large-for-gestational-age fetuses and unfavorable cervix. Eur J Obstet Gynecol Reprod Biol. Oct 15 2004;116(2):182-185.
9. Boyd ME, Usher RH, McLean FH, Kramer
MS. Obstetric consequences of postmaturity. Am J Obstet Gynecol. Feb 1988;158(2):334-338.
10. Buist R. Induction of labour: indications and
obstetric outcomes in a tertiary referral hospital. N Z Med J. Jul 9 1999;112(1091):251-253.
11. Caughey AB, Nicholson JM, Cheng YW, Lyell DJ, Washington AE. Induction of labor and cesarean delivery by gestational age. Am J Obstet Gynecol. Sep 2006;195(3):700-705.
12. Chan LY, Fu L, Leung TN, Wong SF, Lau
TK. Obstetric outcomes after cervical ripening by multiple doses of vaginal prostaglandin E2. Acta Obstet Gynecol Scand. Jan 2004;83(1):70-74.
13. Dhall K, Mittal SC, Kumar A. Evaluation of
preinduction scoring systems. Aust N Z J Obstet Gynaecol. Nov 1987;27(4):309-311.
14. Dodd JM, Crowther CA, Robinson JS.
Morning compared with evening induction of labor: a nested randomized controlled trial. A nested randomized controlled trial. Obstet Gynecol. Aug 2006;108(2):350-360.
15. Ecker JL, Chen KT, Cohen AP, Riley LE,
Lieberman ES. Increased risk of cesarean delivery with advancing maternal age: indications and associated factors in nulliparous women. Am J Obstet Gynecol. Oct 2001;185(4):883-887.
16. Edris FE, von Dadelszen P, Ainsworth LM,
Liston RM. Predictors of cesarean section following elective post-dates induction of labor in nullipara with uncomplicated singleton vertex pregnancies. Saudi Med J. Aug 2006;27(8):1167-1172.
17. Ekman G, Perssen PH, Ulmsten U,
Wingerup L. The impact on labor induction of intracervically applied PGE2-gel, related to gestational age in patients with an unripe cervix. Acta Obstet Gynecol Scand Suppl. 1983;113:173-175.
18. Gabriel R, Darnaud T, Chalot F, Gonzalez
N, Leymarie F, Quereux C. Transvaginal sonography of the uterine cervix prior to labor induction. Ultrasound Obstet Gynecol. Mar 2002;19(3):254-257.
19. Garite TJ, Casal D, Garcia-Alonso A, et al.
Fetal fibronectin: a new tool for the prediction of successful induction of labor. Am J Obstet Gynecol. Dec 1996;175(6):1516-1521.
F-1

20. Goeschen K, Pakzad S. Risks occurring in birth induction without considering cervix maturity. J Perinat Med. 1980;8(1):27-37.
21. Heffner LJ, Elkin E, Fretts RC. Impact of
labor induction, gestational age, and maternal age on cesarean delivery rates. Obstet Gynecol. Aug 2003;102(2):287-293.
22. Heimstad R, Romundstad PR, Eik-Nes SH,
Salvesen KA. Outcomes of pregnancy beyond 37 weeks of gestation. Obstet Gynecol. Sep 2006;108(3 Pt 1):500-508.
23. Johnson DP, Davis NR, Brown AJ. Risk of
cesarean delivery after induction at term in nulliparous women with an unfavorable cervix. Am J Obstet Gynecol. Jun 2003;188(6):1565-1569; discussion 1569-1572.
24. Morgan MA, Thurnau GR. Efficacy of the
fetal-pelvic index in patients requiring labor induction. Am J Obstet Gynecol. Sep 1988;159(3):621-625.
25. Nooh A, Baghdadi S, Raouf S. Induction of labour: how close to the evidence-based guidelines are we? J Obstet Gynaecol. Jul 2005;25(5):451-454.
26. Nuthalapaty FS, Rouse DJ, Owen J. The
association of maternal weight with cesarean risk, labor duration, and cervical dilation rate during labor induction. Obstet Gynecol. Mar 2004;103(3):452-456.
27. Onifade A. Induction of labour. West Afr
Med J. Jun 1970;19(3):105-108. 28. Orhue AA, Unuigbe JA, Ezimokhai M, Ojo
VA. Outcome of induced labor in 931 term pregnancies. Obstet Gynecol. Jul 1984;64(1):108-114.
29. Peregrine E, O'Brien P, Omar R, Jauniaux E.
Clinical and ultrasound parameters to predict the risk of cesarean delivery after induction of labor. Obstet Gynecol. Feb 2006;107(2 Pt 1):227-233.
30. Peregrine E, O'Brien P, Jauniaux E. Impact
on delivery outcome of ultrasonographic fetal head position prior to induction of labor. Obstet Gynecol. Mar 2007;109(3):618-625.
31. Rizzo N, Farina A, Santarsiero G, et al.
Correlation among amniotic fluid index (AFI), cesarean section rate, and labor length in inducted pregnancies beyond 41 weeks' gestation with unfavorable cervix. Am J Perinatol. 2000;17(6):319-324.
32. Rizzo N, Farina A, Santarsiero G, et al. Amniotic fluid index and labor length of pregnancies induced beyond 41 weeks of gestation with unfavorable cervix. Gynecol Obstet Invest. 2000;49(4):244-248.
33. Saunders N, Amis S, Marsh M. The
prognostic value of fetal ultrasonography before induction of labour. Br J Obstet Gynaecol. Nov 1992;99(11):903-906.
34. Schreyer P, Bar-Natan N, Sherman DJ,
Arieli S, Caspi E. Fetal breathing movements before oxytocin induction in prolonged pregnancies. Am J Obstet Gynecol. Sep 1991;165(3):577-581.
35. Simon CE, Grobman WA. When has an induction failed? Obstet Gynecol. Apr 2005;105(4):705-709.
36. Tan PC, Suguna S, Vallikkannu N, Hassan
J. Ultrasound and clinical predictors for Caesarean delivery after labour induction at term. Aust N Z J Obstet Gynaecol. Dec 2006;46(6):505-509.
37. Ware V, Raynor BD. Transvaginal
ultrasonographic cervical measurement as a predictor of successful labor induction. Am J Obstet Gynecol. May 2000;182(5):1030-1032.
38. Wigton TR, Wolk BM. Elective and routine induction of labor. A retrospective analysis of 274 cases. J Reprod Med. Jan 1994;39(1):21-26.
39. Xenakis EM, Piper JM, Conway DL, Langer
O. Induction of labor in the nineties: conquering the unfavorable cervix. Obstet Gynecol. Aug 1997;90(2):235-239.
40. Bueno B, San-Frutos L, Perez-Medina T,
Barbancho C, Troyano J, Bajo J. The labor induction: integrated clinical and sonographic variables that predict the outcome. J Perinatol. Jan 2007;27(1):4-8.
41. Bueno B, San-Frutos L, Salazar F, et al.
Variables that predict the success of labor induction. Acta Obstet Gynecol Scand. Nov 2005;84(11):1093-1097.
42. Pandis GK, Papageorghiou AT, Ramanathan
VG, Thompson MO, Nicolaides KH. Preinduction sonographic measurement of cervical length in the prediction of successful induction of labor. Ultrasound Obstet Gynecol. Dec 2001;18(6):623-628.
43. Wilson PD, Philpott RH. Induction of labour
in Black patients. S Afr Med J. Mar 24 1976;50(13):498-502.
F-2

44. Williams RM, Craft I. Caesarean section
following modern induction of labour. Br J Clin Pract. Mar 1979;33(3):80-81, 84.
47. Wilailak S, Saropala N, Chaturachinda K. Elective induction of labor: Ramathibodi Hospital (Jan-Jun, 1990). J Med Assoc Thai. Jan 1993;76 Suppl 1:44-47.
45. Williams MC, Krammer J, O'Brien WF. The value of the cervical score in predicting successful outcome of labor induction. Obstet Gynecol. Nov 1997;90(5):784-789.
48. A clinical trial of induction of labor versus
expectant management in postterm pregnancy. The National Institute of Child Health and Human Development Network of Maternal-Fetal Medicine Units. Am J Obstet Gynecol. Mar 1994;170(3):716-723.
46. Wing DA, Tran S, Paul RH. Factors
affecting the likelihood of successful induction after intravaginal misoprostol application for cervical ripening and labor induction. Am J Obstet Gynecol. Jun 2002;186(6):1237-1240; discussion 1240-1233.
F-3

F-4