evidence of interseismic coupling variations along the
TRANSCRIPT

HAL Id: hal-01689807https://hal.archives-ouvertes.fr/hal-01689807
Submitted on 22 Jan 2018
HAL is a multi-disciplinary open accessarchive for the deposit and dissemination of sci-entific research documents, whether they are pub-lished or not. The documents may come fromteaching and research institutions in France orabroad, or from public or private research centers.
L’archive ouverte pluridisciplinaire HAL, estdestinée au dépôt et à la diffusion de documentsscientifiques de niveau recherche, publiés ou non,émanant des établissements d’enseignement et derecherche français ou étrangers, des laboratoirespublics ou privés.
Evidence of interseismic coupling variations along theBhutan Himalayan arc from new GPS data
Anais Marechal, Stephane Mazzotti, Rodolphe Cattin, Gaël Cazes, PhilippeVernant, Dowchu Drukpa, Kinzang Thinley, Alizia Tarayoun, Romain Le
Roux-Mallouf, Bal Bahadur Thapa, et al.
To cite this version:Anais Marechal, Stephane Mazzotti, Rodolphe Cattin, Gaël Cazes, Philippe Vernant, et al..Evidence of interseismic coupling variations along the Bhutan Himalayan arc from new GPSdata. Geophysical Research Letters, American Geophysical Union, 2016, 43 (24), pp.12399-12406.�10.1002/2016GL071163�. �hal-01689807�

Evidence of interseismic coupling variations alongthe Bhutan Himalayan arc from new GPS dataAnais Marechal1 , Stephane Mazzotti1 , Rodolphe Cattin1, Gael Cazes2 , Philippe Vernant1 ,Dowchu Drukpa3, Kinzang Thinley4 , Alizia Tarayoun1, Romain Le Roux-Mallouf1 ,Bal Bahadur Thapa4, Phuntsho Pelgay3 , Jampel Gyeltshen3 , Erik Doerflinger1, andStéphanie Gautier1
1Geosciences Montpellier, UMR5243, Université de Montpellier, Montpellier, France, 2School of Earth and EnvironmentalSciences, University of Wollongong, Wollongong, New South Wales, Australia, 3Seismology and Geophysics Division,Department of Geology and Mines, Ministry of Economic Affairs, Thimphu, Bhutan, 4National Land Commission, RoyalGovernment of Bhutan, Thimphu, Bhutan
Abstract Although the first-order pattern of present-day deformation is relatively well resolved across theHimalayas, irregular data coverage limits detailed analyses of spatial variations of interseismic coupling. Weprovide the first GPS velocity field for the BhutanHimalaya. Combinedwith published data, these observationsshow strong east-west variations in coupling between central and eastern Bhutan. In contrast with previousestimations of first-order uniform interseismic coupling along the Himalayan arc, we identify significant lateralvariations: In western and central Bhutan, the fully coupled segment is 135–155 kmwide with an abruptdowndip transition, whereas in eastern Bhutan the fully coupled segment is 100–120 kmwide and is limitedupdipanddowndipbypartiallycreepingsegments.This is thefirstobservationofdecouplingontheupper rampalong the Himalayan arc, with important implications for large earthquake surface rupture and seismic hazard.
1. Introduction
In the Himalayas, as in all active tectonic regions, strain budget on the main seismogenic faults during largeearthquakes and over interseismic periods is a key element to improve seismic hazard assessment. The first-order present-day crustal deformation along the Himalayan arc is now relatively well constrained from level-ing data [Jackson and Bilham, 1994], interferometric synthetic aperture radar observations [Grandin et al.,2012], and GPS measurements [e.g., Bettinelli et al., 2006; Jade et al., 2011; Vernant et al., 2014]. Altogether,these observations show that nearly all of the present-day convergence is accommodated along the MainHimalayan Thrust (MHT), which reaches the surface at the Main Boundary Thrust (MBT) and Main FrontalThrust (MFT). However, data coverage remains irregular, and areas such as Bhutan Himalaya are poorly con-strained. This lack of data results in significant limitations in the interseismic strain analysis. Although theMHTis considered as fully locked along its entire length without any aseismic barrier [Stevens and Avouac, 2015],small-scale decoupled or aseismic region might exist in regions such as Bhutan, where the geodetic data are,up to now, limited to a few stations [Vernant et al., 2014].
Here we provide the first detailed GPS velocity solution for the region of Bhutan Himalaya, consisting in (1)north-south profiles composed of nineteen campaign stations installed and surveyed in western, central, andeastern Bhutan since 2003, (2) nine new campaign stations deployed in central and eastern Bhutan in 2012,and (3) eight permanent stations distributed across the country and operating since 2011 (except for two olderstations thatoperated from2003 to2008).Combinedwithpublisheddata, thesenewGPSobservationsareusedto improve the assessments of interseismic coupling along the MHT and of the first-order geometry of theunlocked portions of the fault at depth. After a brief presentation of the GPS data, we describe the modelingapproach and discuss its results and implications in terms of east-west lateral variations of present-dayinterseismic strain buildup.
2. Methodology2.1. GPS Data
We extend the GPS data published for the Kingdom of Bhutan by Vernant et al. [2014] with (1) nine newcampaign sites installed in 2013 and 2014 in central and eastern Bhutan, surveyed between 2013 and
MARECHAL ET AL. INTERSEISMIC COUPLING IN BHUTAN 12,399
PUBLICATIONSGeophysical Research Letters
RESEARCH LETTER10.1002/2016GL071163
Key Points:• New detailed GPS velocity field inBhutan showing lateral variations ofinterseismic coupling
• Decoupled upper ramp of the MainHimalayan Thrust in eastern Bhutan
• Potential first evidence of transientevents on the Main Himalayan Thrust
Supporting Information:• Supporting Information S1
Correspondence to:A. Marechal,[email protected]
Citation:Marechal, A., et al. (2016), Evidence ofinterseismic coupling variations alongthe Bhutan Himalayan arc from newGPS data, Geophys. Res. Lett., 43,12,399–12,406, doi:10.1002/2016GL071163.
Received 9 SEP 2016Accepted 5 DEC 2016Accepted article online 9 DEC 2016Published online 26 DEC 2016
©2016. American Geophysical Union.All Rights Reserved.

2016, (2) four campaign sites installed and surveyed in 2003 and reoccupied between 2013 and 2016, and (3)six permanent sites installed in 2011 and 2012 by the National Land Commission (NLC) of Bhutan. The fullnetwork comprises 28 campaign stations and 8 permanent sites (Figure 1). The continuous site data span2003–2008 (TIMP and RBIT) and 2011–2016 (new NLC sites). Data for the campaign sites range between2003 and 2016, with a minimum of two surveys over 2 years for the newest sites (Table S1 in the supportinginformation). Campaign and permanent sites are instrumented with geodetic-grade receivers and antennas,and campaign sites were surveyed at the same period (March-April) for at least 24 h (commonly over 48 h) foreach campaign.
GPS daily positions in the International GNSS Service reference frame IGb08 are calculated with the CSRS-Precise Point Positioning v1.5 software [Héroux and Kouba, 2001] using the approach described inMarechal et al. [2015]. Velocities are estimated by a least squares inversion weighted by the position formaluncertainties. The inverted model comprises a linear term (velocity) and, for the permanent stations, anannual sinusoid to account for seasonal effects, mostly related to the load variations of the BrahmaputraRiver alluvial plain. The final velocities (Table S1) are expressed relative to stable India using theIndia/International Terrestrial Reference Frame rotation defined by Ader et al. [2012]. We do not applycorrections for transient events such as coseismic displacements, which are not significant in Bhutan[Vernant et al., 2014].
Figure 1. New GPS velocity field for Bhutan Himalaya relative to stable India (as defined by Ader et al. [2012]). Blue and red vectors show campaign and permanentGPS data from this study, respectively. Black vectors are from Banerjee et al. [2008], Bettinelli et al. [2006], Gahalaut et al. [2013], Gan et al. [2007], Jade [2004], Jade et al.[2007], Jade et al. [2014], Liang et al. [2013],Mahesh et al. [2012],Mukul et al. [2010], Tang et al. [2010], and Vernant et al. [2014]. Ellipses indicate 1σ confidence regions.
Geophysical Research Letters 10.1002/2016GL071163
MARECHAL ET AL. INTERSEISMIC COUPLING IN BHUTAN 12,400
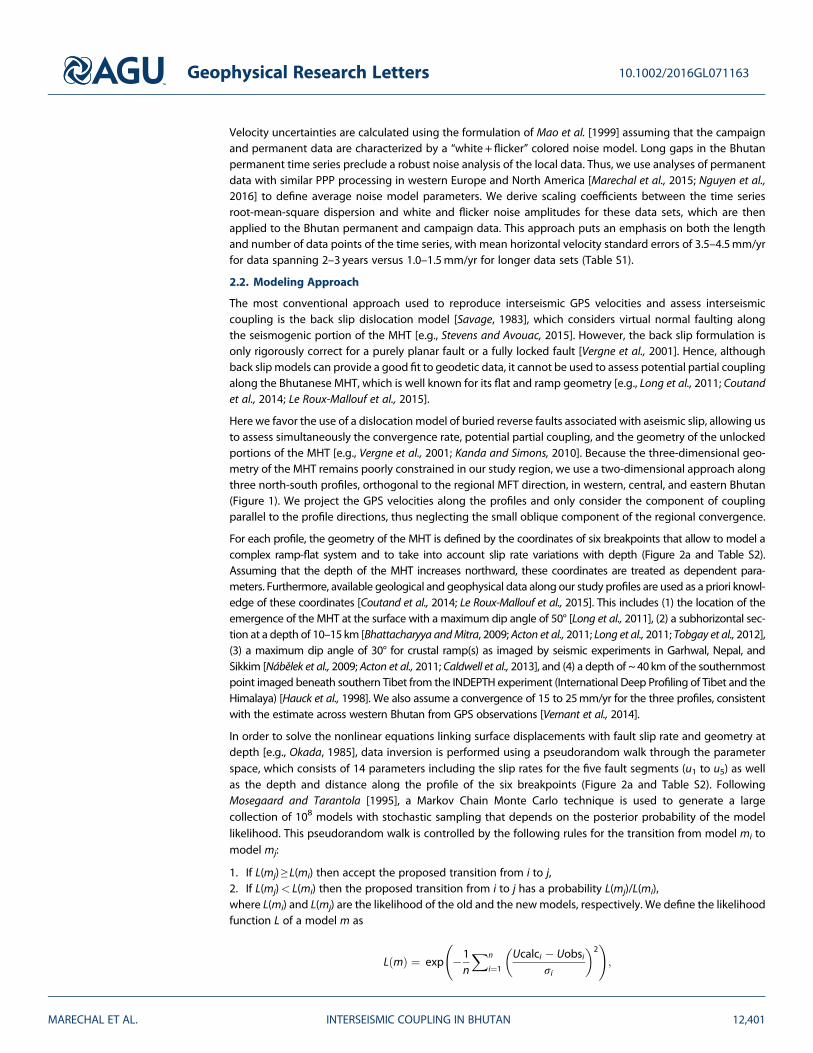
Velocity uncertainties are calculated using the formulation of Mao et al. [1999] assuming that the campaignand permanent data are characterized by a “white + flicker” colored noise model. Long gaps in the Bhutanpermanent time series preclude a robust noise analysis of the local data. Thus, we use analyses of permanentdata with similar PPP processing in western Europe and North America [Marechal et al., 2015; Nguyen et al.,2016] to define average noise model parameters. We derive scaling coefficients between the time seriesroot-mean-square dispersion and white and flicker noise amplitudes for these data sets, which are thenapplied to the Bhutan permanent and campaign data. This approach puts an emphasis on both the lengthand number of data points of the time series, with mean horizontal velocity standard errors of 3.5–4.5mm/yrfor data spanning 2–3 years versus 1.0–1.5mm/yr for longer data sets (Table S1).
2.2. Modeling Approach
The most conventional approach used to reproduce interseismic GPS velocities and assess interseismiccoupling is the back slip dislocation model [Savage, 1983], which considers virtual normal faulting alongthe seismogenic portion of the MHT [e.g., Stevens and Avouac, 2015]. However, the back slip formulation isonly rigorously correct for a purely planar fault or a fully locked fault [Vergne et al., 2001]. Hence, althoughback slip models can provide a good fit to geodetic data, it cannot be used to assess potential partial couplingalong the Bhutanese MHT, which is well known for its flat and ramp geometry [e.g., Long et al., 2011; Coutandet al., 2014; Le Roux-Mallouf et al., 2015].
Here we favor the use of a dislocation model of buried reverse faults associated with aseismic slip, allowing usto assess simultaneously the convergence rate, potential partial coupling, and the geometry of the unlockedportions of the MHT [e.g., Vergne et al., 2001; Kanda and Simons, 2010]. Because the three-dimensional geo-metry of the MHT remains poorly constrained in our study region, we use a two-dimensional approach alongthree north-south profiles, orthogonal to the regional MFT direction, in western, central, and eastern Bhutan(Figure 1). We project the GPS velocities along the profiles and only consider the component of couplingparallel to the profile directions, thus neglecting the small oblique component of the regional convergence.
For each profile, the geometry of the MHT is defined by the coordinates of six breakpoints that allow to model acomplex ramp-flat system and to take into account slip rate variations with depth (Figure 2a and Table S2).Assuming that the depth of the MHT increases northward, these coordinates are treated as dependent para-meters. Furthermore, available geological and geophysical data along our study profiles are used as a priori knowl-edge of these coordinates [Coutand et al., 2014; Le Roux-Mallouf et al., 2015]. This includes (1) the location of theemergence of the MHT at the surface with a maximum dip angle of 50° [Long et al., 2011], (2) a subhorizontal sec-tion at a depth of 10–15km [Bhattacharyya andMitra, 2009; Acton et al., 2011; Long et al., 2011; Tobgay et al., 2012],(3) a maximum dip angle of 30° for crustal ramp(s) as imaged by seismic experiments in Garhwal, Nepal, andSikkim [Nábělek et al., 2009; Acton et al., 2011; Caldwell et al., 2013], and (4) a depth of ~40km of the southernmostpoint imaged beneath southern Tibet from the INDEPTH experiment (International Deep Profiling of Tibet and theHimalaya) [Hauck et al., 1998]. We also assume a convergence of 15 to 25mm/yr for the three profiles, consistentwith the estimate across western Bhutan from GPS observations [Vernant et al., 2014].
In order to solve the nonlinear equations linking surface displacements with fault slip rate and geometry atdepth [e.g., Okada, 1985], data inversion is performed using a pseudorandom walk through the parameterspace, which consists of 14 parameters including the slip rates for the five fault segments (u1 to u5) as wellas the depth and distance along the profile of the six breakpoints (Figure 2a and Table S2). FollowingMosegaard and Tarantola [1995], a Markov Chain Monte Carlo technique is used to generate a largecollection of 108 models with stochastic sampling that depends on the posterior probability of the modellikelihood. This pseudorandom walk is controlled by the following rules for the transition from model mi tomodel mj:
1. If L(mj) ≥ L(mi) then accept the proposed transition from i to j,2. If L(mj)< L(mi) then the proposed transition from i to j has a probability L(mj)/L(mi),where L(mi) and L(mj) are the likelihood of the old and the newmodels, respectively. We define the likelihoodfunction L of a model m as
L mð Þ ¼ exp �1n
Xn
i¼1
Ucalci � Uobsiσi
� �2 !
;
Geophysical Research Letters 10.1002/2016GL071163
MARECHAL ET AL. INTERSEISMIC COUPLING IN BHUTAN 12,401

where n is the number of data points, Uobsi is the observed GPS velocity and σi is the velocity uncertainty,and Ucalci is the velocity calculated from the analytical solution given by Singh and Rani [1993] assuming atwo-dimensional dip-slip fault embedded in a homogeneous half-space.
We only use the horizontal components of the GPS velocity vectors, projected along the profile direction, dueto the limited availability of good-quality vertical velocities (see section 4 for a comparison of the models withvertical data). The posterior probability of each model parameter is obtained from the final collection of thesampled models (Figures 2, 3, and S1). In the following, the results of the inversion are presented in terms ofhighest density probability value (preferred value) and full width at half maximum (uncertainty).
3. Results
Our results indicate a present-day far-field convergence rate ~ 16.5–17.5mm/a, without significant lateral var-iations along the Bhutan Himalaya arc (Figures 2b and 3), consistent with estimates of 17.6� 0.9mm/a[Stevens and Avouac, 2015] and 15.5� 1.5mm/a [Vernant et al., 2014]. In contrast with this uniform conver-gence rate, we highlight lateral variations of interseismic slip pattern at depth (cf. Figures 2b and 3).
Figure 2. Model geometry and fault slip rates. (a) Geometry used in the inversion. Orange: a priori geometry. The ranges of the fault breakpoints (blue dots andsegments) and allowed slip rates are detailed in Table S2. Dashed blue segments represent the angle constraint for points 2 and 5. Note that vertical scales aredifferent for the topography and at depth. (b) Horizontal velocity profiles across western, central, and eastern Bhutan (see Figure 1 for locations). Gray lines areassociated with the 100 best models. (top) GPS (circles, cf. Figure 1 for color legend) and calculated (lines) velocities. Note that GPS horizontal velocities are projectedalong the profile. (bottom) Obtained fault geometry (gray lines) and overthrusting slip rates (in red rectangles). Numbers in bracket corresponds to the slip rateuncertainties. Orange lines show the a priori model.
Geophysical Research Letters 10.1002/2016GL071163
MARECHAL ET AL. INTERSEISMIC COUPLING IN BHUTAN 12,402
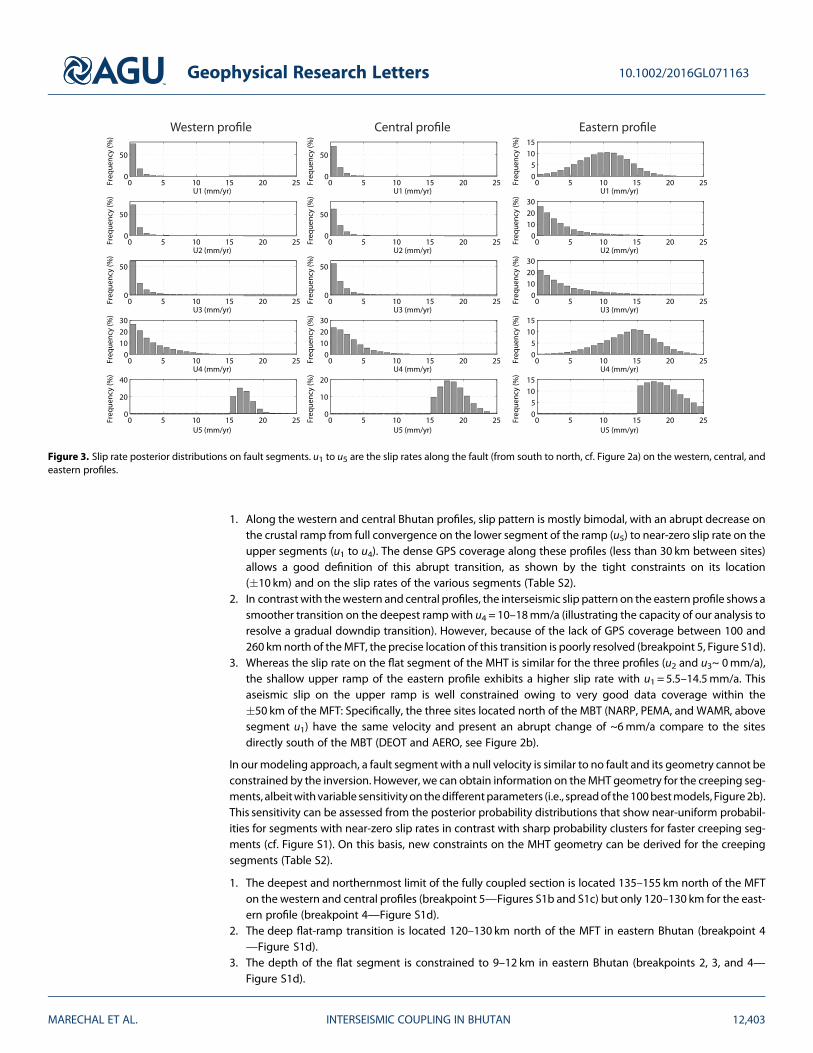
1. Along the western and central Bhutan profiles, slip pattern is mostly bimodal, with an abrupt decrease onthe crustal ramp from full convergence on the lower segment of the ramp (u5) to near-zero slip rate on theupper segments (u1 to u4). The dense GPS coverage along these profiles (less than 30 km between sites)allows a good definition of this abrupt transition, as shown by the tight constraints on its location(�10 km) and on the slip rates of the various segments (Table S2).
2. In contrast with thewestern and central profiles, the interseismic slip pattern on the eastern profile shows asmoother transition on the deepest rampwith u4 = 10–18mm/a (illustrating the capacity of our analysis toresolve a gradual downdip transition). However, because of the lack of GPS coverage between 100 and260 kmnorth of theMFT, the precise location of this transition is poorly resolved (breakpoint 5, Figure S1d).
3. Whereas the slip rate on the flat segment of the MHT is similar for the three profiles (u2 and u3~ 0mm/a),the shallow upper ramp of the eastern profile exhibits a higher slip rate with u1 = 5.5–14.5mm/a. Thisaseismic slip on the upper ramp is well constrained owing to very good data coverage within the�50 km of the MFT: Specifically, the three sites located north of the MBT (NARP, PEMA, and WAMR, abovesegment u1) have the same velocity and present an abrupt change of ~6mm/a compare to the sitesdirectly south of the MBT (DEOT and AERO, see Figure 2b).
In ourmodeling approach, a fault segment with a null velocity is similar to no fault and its geometry cannot beconstrained by the inversion. However, we can obtain information on theMHT geometry for the creeping seg-ments, albeitwithvariable sensitivityon thedifferentparameters (i.e., spreadof the100bestmodels, Figure2b).This sensitivity can be assessed from the posterior probability distributions that show near-uniform probabil-ities for segments with near-zero slip rates in contrast with sharp probability clusters for faster creeping seg-ments (cf. Figure S1). On this basis, new constraints on the MHT geometry can be derived for the creepingsegments (Table S2).
1. The deepest and northernmost limit of the fully coupled section is located 135–155 km north of the MFTon the western and central profiles (breakpoint 5—Figures S1b and S1c) but only 120–130 km for the east-ern profile (breakpoint 4—Figure S1d).
2. The deep flat-ramp transition is located 120–130 km north of the MFT in eastern Bhutan (breakpoint 4—Figure S1d).
3. The depth of the flat segment is constrained to 9–12 km in eastern Bhutan (breakpoints 2, 3, and 4—Figure S1d).
Figure 3. Slip rate posterior distributions on fault segments. u1 to u5 are the slip rates along the fault (from south to north, cf. Figure 2a) on the western, central, andeastern profiles.
Geophysical Research Letters 10.1002/2016GL071163
MARECHAL ET AL. INTERSEISMIC COUPLING IN BHUTAN 12,403

4. On the eastern profile, active faulting takes place on the MBT, i.e., 13–20 km north of the MFT (breakpoint1—Figure S1d). On both sides and nearby the surface expression of the upper fault segment, the GPS cov-erage is dense: DEOT and AERO, located between the MFT and MBT, have similar velocities to those southof the MFT, and wemeasure an abrupt change of ~ 6mm/yr across the MBT (Figure 2b). These results indi-cate that the MBT in eastern Bhutan is currently active and that it accommodates part of the convergenceby aseismic creep.
4. Discussion
In order to compare our results with other studies, we describe the interseismic state of the MHT in terms ofcoupling, defined as the ratio between the fault interseismic slip rate and the present-day far-field conver-gence rate (u5 = 17� 2mm/a). On the basis of a smooth back slip model, Stevens and Avouac [2015] concludethat a frontal ~ 100 km large portion of the MHT is fully locked in Bhutan (coupling> 50%). They argue for anabrupt transition to a decoupled segment along the downdip ramp, although their smoothed large-scale cou-pling map does not clearly resolve this transition pattern (Figure 4). The addition of new GPS data in westernand central Bhutan allows us to better define this transition and its location. Our slip rate posterior distribution(Figure 3) shows that the interseismic coupling decreases northward from 100% to 0% along the deep ramp
Figure 4. Interseismic coupling of the Main Himalayan Thrust in Bhutan. Rectangles show our estimates of interseismic coupling for the different fault segments. Thehatched segment represents the flat part of the MHT constrained by the inversion. The colored base map represents the estimates of Stevens and Avouac [2015].Dashed blue lines show the possible limits of the fully coupled zone. Green triangles show the locations of our new GPS stations. Black triangles are GPS stations usedin the solution of Stevens and Avouac [2015].
Geophysical Research Letters 10.1002/2016GL071163
MARECHAL ET AL. INTERSEISMIC COUPLING IN BHUTAN 12,404
segment, about 145 kmnorth of theMFT inwestern and central Bhutan (Figure 4 and Table S2). Our results alsoindicate a significant change in the coupling pattern between central and eastern Bhutan, with a smoothertransition (17% of coupling on the deeper ramp) and a slightly less wide coupled zone (100–120 km versus135–155 km) along the eastern profile. We show for the first time in the Himalayas that the upper ramp ispartially decoupled (40% (17–70%) of coupling), suggesting that the long-term convergence may not be fullyexpressed in large earthquakes in this particular region.
The current resolutionof the vertical GPS velocities remains too low toprovide significant constraints to our sliprate analysis. However, a first-order comparison of uplift rates from our campaign stations (with other 10 yearsof data) versus other geological indicators shows the potential importance of these data sets for short-andlong-termuplift constraints. Inwestern Bhutan, our vertical GPS velocities suggest a peak of 2–3.5mm/a about100 km north of the MFT (Figure S2), whereas Holocene denudation rates indicate a sharp peak of ~2mm/a130–150 km north of the MFT with near-zero rates between 40 and 110 km [Le Roux-Mallouf et al., 2015;Portengaet al., 2014;Adamset al.,2016]. This difference inpatterns likely reflects thedifference inmeasurementtime scales: GPS data cover a decadal interseismic period and are mostly sensitive to the coupled-decoupledtransition; denudationdata are representative of several thousand years over several seismic cycles and arepri-marily sensitive to the fault geometry. A fewadditional years of campaignGPSdata combinedwith longer-termdenudationand incisiondatamay thusprovide important constraints on thegeometry and seismicbehavior ofthe MHT.
Our analysis of newGPS data in Bhutan provide threemajor constraints to the interseismic state of theMHT: (1)An abrupt downdip termination of the fully coupled segment, about 145 km north of the MFT in western andcentral Bhutan; (2) a less wide fully coupled segment in eastern Bhutan (~110 km), with a partially unlockeddeeper crustal ramp; (3) in this eastern region, the MBT is creeping and is part of the active thrusting front.These observations raise questions regarding the seismic and interseismic behavior of theMHT.We infer creepon the eastern BhutanMBT on the basis of velocitymeasurements over 3 years (2013–2016); hence, we cannotresolve whether this represents long-term creep or could potentially correspond to a transient slip episode onthe upper part of the MHT, which would contribute to release part of the interseismic stress buildup. Similarly,our observation of partial creep on the MBT suggests that an event similar to the recent 2015 Gorkha earth-quake occurring on the MHT could potentially not reach the surface in eastern Bhutan.
ReferencesActon, C. E., K. Priestley, S. Mitra, and V. K. Gaur (2011), Crustal structure of the Darjeeling—Sikkim Himalaya and southern Tibet, Geophys. J.
Int., 184(2), 829–852.Adams, B. A., K. X. Whipple, K. V. Hodges, and A. M. Heimsath (2016), In situ development of high-elevation, low-relief landscapes via duplex
deformation in the Eastern Himalayan hinterland, Bhutan, J. Geophys. Res. Earth Surf., 121, 294–319, doi:10.1002/2015JF003508.Ader, T., et al. (2012), Convergence rate across the Nepal Himalaya and interseismic coupling on the Main Himalayan Thrust: Implications for
seismic hazard, J. Geophys. Res., 117, B04403, doi:10.1029/2011JB009071.Banerjee, P., R. Bürgmann, B. Nagarajan, and E. Apel (2008), Intraplate deformation of the Indian subcontinent, Geophys. Res. Lett., 35, L18301,
doi:10.1029/2008GL035468.Bettinelli, P., J. P. Avouac, M. Flouzat, F. Jouanne, L. Bollinger, P. Willis, and G. R. Chitrakar (2006), Plate motion of India and interseismic strain
in the Nepal Himalaya from GPS and DORIS measurements, J. Geod., 80(8–11), 567–589.Bhattacharyya, K., and G. Mitra (2009), A new kinematic evolutionary model for the growth of a duplex—An example from the Rangit duplex,
Sikkim Himalaya, India, Gondwana Res., 16(3), 697–715.Caldwell, W. B., S. L. Klemperer, J. F. Lawrence, S. S. Rai, and Ashish (2013), Characterizing the Main Himalayan Thrust in the Garhwal Himalaya,
India with receiver function CCP stacking, Earth Planet. Sci. Lett., 367, 15–27, doi:10.1016/j.epsl.2013.02.009.Coutand, I., D. M. Whipp Jr., D. Grujic, M. Bernet, M. G. Fellin, B. Bookhagen, K. R. Landry, S. K. Ghalley, and C. Duncan (2014), Geometry and
kinematics of the Main Himalayan Thrust and Neogene crustal exhumation in the Bhutanese Himalaya derived from inversion of multi-thermochronologic data, J. Geophys. Res. Solid Earth, 119, 1446–1481, doi:10.1002/2013JB010891.
Gahalaut, V. K., et al. (2013), Aseismic plate boundary in the Indo-Burmese wedge, northwest Sunda Arc, Geology, 41(2), 235–238.Gan, W., P. Zhang, Z.-K. Shen, Z. Niu, M. Wang, Y. Wan, D. Zhou, and J. Cheng (2007), Present-day crustal motion within the Tibetan Plateau
inferred from GPS measurements, J. Geophys. Res., 112, B08416, doi:10.1029/2005JB004120.Grandin, R., M. P. Doin, L. Bollinger, B. Pinel-Puysségur, G. Ducret, R. Jolivet, and S. N. Sapkota (2012), Long-term growth of the Himalaya
inferred from interseismic InSAR measurement, Geology, 40(12), 1059–1062.Hauck, M. L., K. D. Nelson, L. D. Brown, W. Zhao, and A. R. Ross (1998), Crustal structure of the Himalayan orogen at ~90 east longitude from
Project INDEPTH deep reflection profiles, Tectonics, 17, 481–500, doi:10.1029/98TC01314.Héroux, P., and J. Kouba (2001), GPS precise point positioning using IGS orbit products, Phys. Chem. Earth, Part A, 26(6), 573–578.Jackson, M., and R. Bilham (1994), Constraints on Himalayan deformation inferred from vertical velocity fields in Nepal and Tibet, J. Geophys.
Res., 99, 13–897, doi:10.1029/94JB00714.Jade, S. (2004), Estimates of plate velocity and crustal deformation in the Indian subcontinent using GPS geodesy, Curr. Sci., 86, 1443–1448.Jade, S., et al. (2007), Estimates of interseismic deformation in northeast India from GPS measurements, Earth Planet. Sci. Lett., 263(3),
221–234.
Geophysical Research Letters 10.1002/2016GL071163
MARECHAL ET AL. INTERSEISMIC COUPLING IN BHUTAN 12,405
AcknowledgmentsThis project is funded by the FrenchAgence Nationale de la Recherche(ANR-13-BS06-0006-01). We are gratefulto the Department of Geology andMines, M. Chokila and the National LandCommission of Bhutan for their majorcontributions to the field campaigns.The 2013–2016 surveys benefited fromthe support of the French RESIF-GPSMob Research Infrastructure (http://www.resif.fr). The discussion greatlybenefited from talks with J.-P. Avouacwhom we warmly thank. The manu-script has been greatly improved byhelpful suggestions by Editor A.V.Newman and two anonymousreviewers. Data availability: CampaignGPS data for the 2003 survey are from R.Bilham project (NSF CooperativeAgreement EAR-0735156) and areavailable on the UNAVCO archive(https://www.unavco.org/data/gps-gnss/gps-gnss.html). Campaign GPSdata for the 2013–2016 surveys areavailable on the RESIF-GPSMob archive(https://gpsmob.resif.fr) and by requestto the authors for other periods.Permanent GPS data are available byrequest to the National LandCommission of Bhutan. GPS data pro-cessing was done with CSRS-PPP v1.5provided by Natural Resources Canada(https://webapp.geod.nrcan.gc.ca/geod/tools-outils/ppp.php), using theInternational GNSS Service precise pro-ducts (http://www.igs.org/products).GPS time series analysis was done withR software (https://www.r-project.org)with codes available by request to theauthors. The slip rate and geometryinversion software is available byrequest to the authors.

Jade, S., H. R. Rao, M. S. M. Vijayan, V. K. Gaur, B. C. Bhatt, K. Kumar, S. Jaganathan, M. B. Ananda, and P. D. Kumar (2011), GPS-deriveddeformation rates in northwestern Himalaya and Ladakh, Int. J. Earth Sci., 100(6), 1293–1301.
Jade, S., et al. (2014), Contemporary deformation in the Kashmir–Himachal, Garhwal and Kumaon Himalaya: Significant insights from1995–2008 GPS time series, J. Geod., 88(6), 539–557.
Kanda, R. V. S., and M. Simons (2010), An elastic plate model for interseismic deformation in subduction zones, J. Geophys. Res., 115, B03405,doi:10.1029/2009JB006611.
Le Roux-Mallouf, R., et al. (2015), Evidence for a wide and gently dipping Main Himalayan Thrust in western Bhutan, Geophys. Res. Lett., 42,3257–3265, doi:10.1002/2015GL063767.
Liang, S., W. Gan, C. Shen, G. Xiao, J. Liu, W. Chen, X. Ding, and D. Zhou (2013), Three-dimensional velocity field of present-day crustal motionof the Tibetan Plateau derived from GPS measurements, J. Geophys. Res. Solid Earth, 118, 5722–5732, doi:10.1002/2013JB010503.
Long, S., N. McQuarrie, T. Tobgay, and D. Grujic (2011), Geometry and crustal shortening of the Himalayan fold-thrust belt, eastern andcentral Bhutan, Geol. Soc. Am. Bull., 123(7/8), 1427–1447, doi:10.1130/B30203.1.
Mahesh, P., et al. (2012), Rigid Indian plate: Constraints from GPS measurements, Gondwana Res., 22(3), 1068–1072.Mao, A., C. G. Harrison, and T. H. Dixon (1999), Noise in GPS coordinate time series, J. Geophys. Res., 104, 2797–2816, doi:10.1029/
1998JB900033.Marechal, A., S. Mazzotti, J. L. Elliott, J. T. Freymueller, and M. Schmidt (2015), Indentor-corner tectonics in the Yakutat-St. Elias collision
constrained by GPS, J. Geophys. Res. Solid Earth, 120, 3897–3908, doi:10.1002/2014JB011842.Mosegaard, K., and A. Tarantola (1995), Monte Carlo sampling of solutions to inverse problems, J. Geophys. Res., 100, 12,431–12,447,
doi:10.1029/94JB03097.Mukul, M., S. Jade, A. Bhattacharyya, and K. Bhusan (2010), Crustal shortening in convergent orogens: Insights from Global Positioning
System (GPS) measurements in northeast India, J. Geol. Soc. India, 75(1), 302–312, doi:10.1007/s12594-010-0017-9.Nábělek, J., G. Hetényi, J. Vergne, S. Sapkota, B. Kafle, M. Jiang, H. Su, J. Chen, B. S. Huang, and the Hi-CLIMB Team (2009), Underplating in the
Himalaya-Tibet collision zone revealed by the Hi-CLIMB experiment, Science, 325(5946), 1371–1374, doi:10.1126/science.1167719.Nguyen, H. N., P. Vernant, S. Mazzotti, G. Khazaradze, and E. Asensio (2016), 3D GPS velocity field and its implications on the present-day
post-orogenic deformation of the Western Alps and Pyrenees, Solid Earth, 7, 1349–1363.Okada, Y. (1985), Surface deformation due to shear and tensile faults in a half-space, Bull. Seismol. Soc. Am., 75(4), 1135–1154.Portenga, E. W., P. R. Bierman, C. Duncan, L. B. Corbett, N. M. Kehrwald, and D. H. Rood (2014), Erosion rates of the Bhutanese Himalaya
determined using in situ-produced10
Be, Geomorphology, 233, 112–126.Savage, J. C. (1983), A dislocation model of strain accumulation and release at a subduction zone, J. Geophys. Res., 88, 4984–4996,
doi:10.1029/JB088iB06p04984.Singh, S. J., and S. Rani (1993), Crustal deformation associated with two-dimensional thrust faulting, J. Phys. Earth, 41, 87–101.Stevens, V. L., and J. P. Avouac (2015), Interseismic coupling on the main Himalayan thrust, Geophys. Res. Lett., 42, 5828–5837, doi:10.1002/
2015GL064845.Tang, L., C. Li, J. Zhang, X. ShI, and P. Wei (2010), Precise monitoring technique for regional surface deformation using GPS/CORS observation,
Bull. Surv. Mapp., 5, 6–9.Tobgay, T., N. McQuarrie, S. Long, M. J. Kohn, and S. L. Corrie (2012), The age and rate of displacement along the Main Central Thrust in the
western Bhutan Himalaya, Earth Planet. Sci. Lett., 319, 146–158.Vergne, J., R. Cattin, and J. P. Avouac (2001), On the use of dislocations to model interseismic strain and stress build-up at intracontinental
thrust faults, Geophys. J. Int., 147, 155–162.Vernant, P., R. Bilham, W. Szeliga, D. Drupka, S. Kalita, A. K. Bhattacharyya, V. K. Gaur, P. Pelgay, R. Cattin, and T. Berthet (2014), Clockwise
rotation of the Brahmaputra Valley relative to India: Tectonic convergence in the eastern Himalaya, Naga Hills, and Shillong Plateau,J. Geophys. Res. Solid Earth, 119, 6558–6571, doi:10.1002/2014JB011196.
Geophysical Research Letters 10.1002/2016GL071163
MARECHAL ET AL. INTERSEISMIC COUPLING IN BHUTAN 12,406