every day - teck · teck resources limited ... possibilities in motion. ... few years ago were...
TRANSCRIPT

Every Day 2016 Annual Report
Every Day
Teck 2016 An
nu
al Rep
ort
Teck Resources Limited Suite 3300, 550 Burrard Street Vancouver, British Columbia, Canada V6C 0B3 +1.604.699.4000 Tel +1.604.699.4750 Fax www.teck.com
Setting Possibilities in Motion

Our BusinessTeck is a diversified resource company committed to responsible mining and mineral development with business units focused on steelmaking coal, copper, zinc and energy. Headquartered in Vancouver, British Columbia (B.C.), Canada, we own or have interests in 12 operating mines, one large metallurgical complex, and several major development projects in Canada, the United States, Chile and Peru. We have expertise across a wide range of activities related to exploration, development, mining and minerals processing, including smelting and refining, safety, environmental protection, materials stewardship, recycling and research.
Our corporate strategy is focused on exploring for, developing, acquiring and operating world-class, long-life assets in stable jurisdictions that operate through multiple price cycles. We maximize productivity and efficiency at our existing operations, maintain a strong balance sheet, and are nimble in recognizing and acting on opportunities. The pursuit of sustainability guides our approach to business, and we recognize that our success depends on our ability to establish safe workplaces for our people and collaborative relationships with communities.
Mineral reserve and resource estimates for our properties are disclosed in our most recent Annual Information Form, which is available on our website at www.teck.com, on the Canadian Securities Administrators website at www.sedar.com (SEDAR), and on the EDGAR section of the United States Securities and Exchange Commission (SEC) website at www.sec.gov.
Forward-Looking StatementsThis annual report contains forward-looking statements. Please refer to the “Cautionary Statement on Forward-Looking Information” on page 49.
All dollar amounts expressed throughout this report are in Canadian dollars unless otherwise noted.
Our Business 1
2016 Highlights 2
Letter from the Chairman 3
Letter from the CEO 5
Responsibility 7
Management’s Discussion and Analysis 9
Steelmaking Coal 12
Copper 16
Zinc 21
Energy 25
Exploration 27
Financial Overview 28
Consolidated Financial Statements 51
Board of Directors 114
Officers 114
Corporate Information 115
In This Report
On the cover: Julia Dick, Utilityperson at Highland Valley Copper Operations. 115Corporate Information
Corporate Information
2016 Share Prices and Trading Volume
Class B subordinate voting shares–TSX–CAD$/share
High Low Close Volume
Q1 $ 11.99 $ 3.65 $ 10.14 386,550,338 Q2 $ 17.09 $ 9.05 $ 16.31 414,279,556 Q3 $ 24.89 $ 16.53 $ 24.59 278,290,368 Q4 $ 35.67 $ 22.38 $ 27.45 226,873,363
1,305,993,625
Class B subordinate voting shares–NYSE–US$/share
High Low Close Volume
Q1 $ 9.25 $ 2.56 $ 7.61 107,412,803 Q2 $ 13.20 $ 6.89 $ 13.17 142,055,779Q3 $ 19.07 $ 12.62 $ 18.03 110,330,313 Q4 $ 26.60 $ 16.95 $ 20.03 87,626,571
447,425,466
Class A common shares–TSX–CAD$/share
High Low Close Volume
Q1 $ 14.51 $ 5.69 $ 13.24 206,884 Q2 $ 18.05 $ 11.90 $ 18.05 167,709 Q3 $ 25.00 $ 17.40 $ 23.59 197,126 Q4 $ 36.49 $ 22.65 $ 31.00 523,450
1,095,169
Stock Exchanges Our Class A common shares and Class B subordinate voting shares are listed on the Toronto Stock Exchange under the symbols TECK.A and TECK.B, respectively.
Our Class B subordinate voting shares are also listed on the New York Stock Exchange under the symbol TECK.
Dividends Declared on Class A and B SharesAmount per share Payment Date $0.05 June 30, 2016 $0.05 December 30, 2016
These dividends are eligible for both the federal and provincial enhanced dividend tax credits.
Shares Outstanding at December 31, 2016Class A common shares 9,353,470 Class B subordinate voting shares 567,546,513
Shareholder RelationsKaren L. Dunfee, Corporate Secretary
Annual MeetingOur annual meeting of shareholders will be held at 11:00 a.m. on Wednesday, April 26, 2017, in the Waterfront Ballroom, Fairmont Waterfront Hotel, 900 Canada Place Way, Vancouver, British Columbia.
Transfer AgentsInquiries regarding change of address, stock transfer, registered shareholdings, dividends or lost certificates should be directed to our Registrar and Transfer Agent:
CST Trust Company 1600 – 1066 West Hastings Street, Vancouver, British Columbia V6E 3X1
CST Trust Company provides an AnswerLine Service for the convenience of shareholders:
Toll-free in Canada and the U.S. +1.800.387.0825Outside Canada and the U.S. +1.416.682.3860 Email: [email protected]
American Stock Transfer & Trust Company, LLC 6201 – 15th Avenue, Brooklyn, New York 11219 +1.800.937.5449 or +1.718.921.8124
Email: [email protected] Website: www.amstock.com TTY: +1.866.703.9077 or +1.718.921.8386
AuditorsPricewaterhouseCoopers LLP Chartered Professional Accountants Suite 700, 250 Howe Street, Vancouver, British Columbia V6C 3S7
Annual Information Form
We prepare an Annual Information Form (AIF) that is filed with the securities commissions or similar bodies in all the provinces of Canada. Copies of our AIF and annual and quarterly reports are available on request or on our website at www.teck.com, on the Canadian Securities Administrators website at www.sedar.com (SEDAR), and on the EDGAR section of the United States Securities and Exchange Commission (SEC) website at www.sec.gov.

4
3
2
1
1
2
32
1
12
5
*
Steelmaking Coal1 Cardinal River2 Steelmaking coal sites in B.C.
· Fording River · Greenhills · Line Creek · Elkview · Coal Mountain
Copper1 Highland Valley Copper2 Antamina3 Quebrada Blanca (including
Quebrada Blanca Phase 2 project)4 Carmen de Andacollo5 NuevaUnión
Zinc1 Red Dog2 Trail Operations3 Pend Oreille
Energy1 Frontier2 Fort Hills
Corporate Head Office
* Vancouver
Operation Project
Operations and Major Projects:
Steelmaking CoalWe are the world’s second-largest seaborne exporter of steelmaking coal, with six operations in Western Canada that have significant high-quality steelmaking coal reserves.
CopperWe are a significant copper producer in the Americas, with four operating mines in Canada, Chile and Peru, and copper development projects in North and South America.
ZincWe are the world’s third-largest producer of mined zinc, and operate one of the world’s largest fully integrated zinc and lead smelting and refining facilities.
EnergyWe are creating long-term value by building an energy business with the development of Canadian oil sands mining projects.
1Our Business
2012
2013
2014
2015
2016
2012
2013
2014
2015
2016
2012
2013
2014
2015
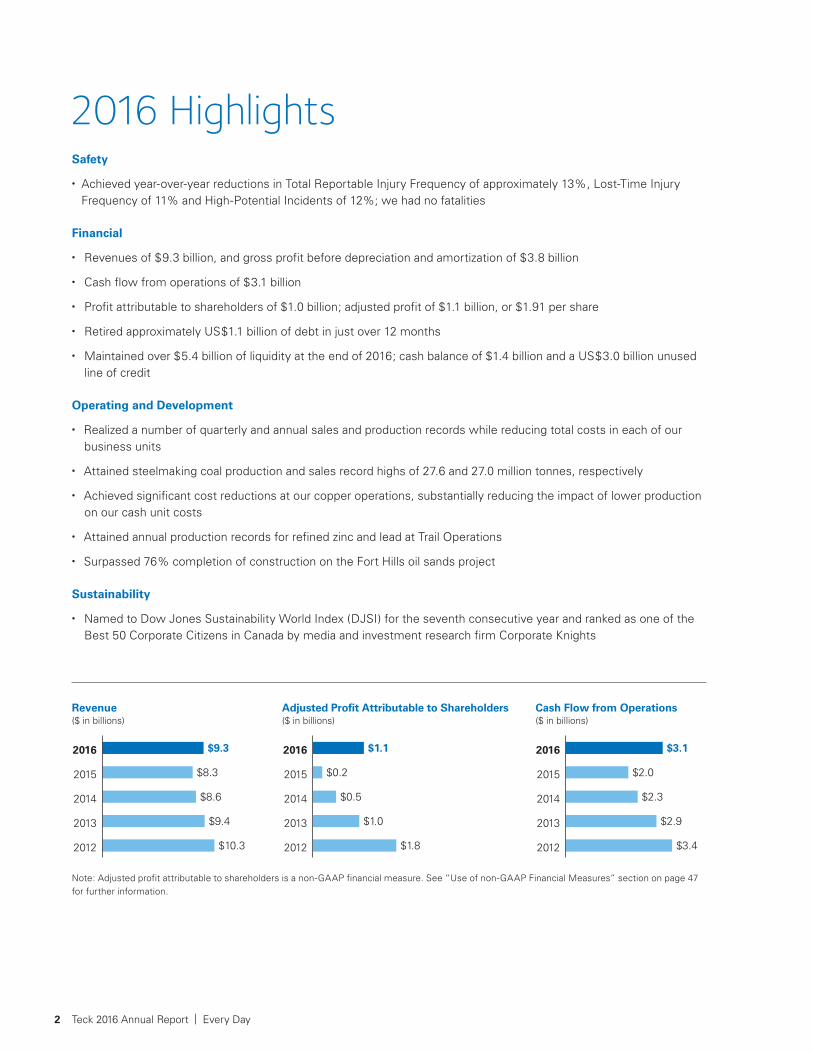
2016$9.3 $1.1
$8.3
$8.6
$9.4
$10.3
$0.2
$0.5
$1.0
$1.8
$3.1
$2.0
$2.3
$2.9
$3.4
Revenue ($ in billions)
Adjusted Profit Attributable to Shareholders ($ in billions)
Cash Flow from Operations ($ in billions)
2016 HighlightsSafety
• Achieved year-over-year reductions in Total Reportable Injury Frequency of approximately 13%, Lost-Time Injury Frequency of 11% and High-Potential Incidents of 12%; we had no fatalities
Financial
• Revenues of $9.3 billion, and gross profit before depreciation and amortization of $3.8 billion
• Cash flow from operations of $3.1 billion
• Profit attributable to shareholders of $1.0 billion; adjusted profit of $1.1 billion, or $1.91 per share
• Retired approximately US$1.1 billion of debt in just over 12 months
• Maintained over $5.4 billion of liquidity at the end of 2016; cash balance of $1.4 billion and a US$3.0 billion unused line of credit
Operating and Development
• Realized a number of quarterly and annual sales and production records while reducing total costs in each of our business units
• Attained steelmaking coal production and sales record highs of 27.6 and 27.0 million tonnes, respectively
• Achieved significant cost reductions at our copper operations, substantially reducing the impact of lower production on our cash unit costs
• Attained annual production records for refined zinc and lead at Trail Operations
• Surpassed 76% completion of construction on the Fort Hills oil sands project
Sustainability
• Named to Dow Jones Sustainability World Index (DJSI) for the seventh consecutive year and ranked as one of the Best 50 Corporate Citizens in Canada by media and investment research firm Corporate Knights
Note: Adjusted profit attributable to shareholders is a non-GAAP financial measure. See “Use of non-GAAP Financial Measures” section on page 47 for further information.
Teck 2016 Annual Report | Every Day2

To the Shareholders
In this letter a year ago, I began by saying 2015 was the year the chickens came home to roost after the most volatile pricing cycle for mined commodities in living memory. Commodity and share prices as well as mining company profits were down across the industry. I expressed hope those chickens had almost finished roosting.
The recent “super-cycle” for mined commodities began a few years into the turn of the millennium. Chinese demand for many of our industry’s products had grown steadily for two decades, ever since Deng Xiaoping had proclaimed in 1980 that China would quadruple its GDP in 20 years. When he was asked what this would entail, his colleague Hu Yaobang had responded that it would require an annual compounded growth rate of 7.2%. By the early 2000s it was becoming evident to many in the Western world that, remarkably, China had in fact achieved Deng’s target, and was continuing to grow.
As a result, China became the world’s largest single consumer of many of the commodities that Teck produces, including metallurgical coal, copper and zinc. Prices naturally rose. By 2006 the price of copper in constant (inflation-adjusted) dollars had reached its highest level since 1974, 32 years earlier. It would keep rising, except for a year’s hiatus after the Global Financial Crisis (GFC), until it peaked in 2011. It was one of those “new eras” that we have seen occur from time to time in the mining business.
The industry naturally responded with new or increased production in the ensuing years, as it always does when prices climb. It is the Aristotelian nature of humanity that managers, as well as entrepreneurs, will rush in to fill any vacuum. When that occurred, coincident with a sense that growth rates in China were slowing, prices naturally began to decline, as they generally do. The second, downward leg of the super-cycle took hold. As a result, by the end of 2015 profits and share prices across the mining industry had fallen dramatically. Woe was throughout the land.
Now, a year later, the situation has improved dramatically. Those chickens do appear to have finished roosting, at least for now.
Some mining companies that a few years ago were declaring loudly they would increase production at all costs to preserve market share, exacerbating the price problem for all, now seem to have rediscovered restraint. China itself is continuing to move logically towards a more balanced economy, and is taking steps to reduce uneconomic overcapacity in some materials. The industry at large has morphed to one that emphasizes reducing costs and excess debt, as it generally does in such times.
By the end of 2016, commodity prices, profitability and share valuations had come back a long way for many industry companies. Our own company achieved all-time record profits in the fourth quarter. Hope and optimism had returned, tempered with caution as memories of recent difficulties persisted.
There is an interesting story that happened towards the end of 2009, as the world was recovering from the GFC. Bob, an American friend who knew me socially but not professionally, told me his broker had put him into a Canadian stock a year earlier. It had become one of the hottest stocks on the New York Exchange over the course of the year, making him a bundle, and he asked if I’d ever heard of it. It was Teck Resources. Talk about “know your shareholders”.
Letter from the Chairman
Dr. Norman B. KeevilChairman of the Board
3Letter from the Chairman
Teck was again the best performing stock in 2016, this time on the Toronto Exchange. We received plaudits from traders and it is tempting to bask in the glow. But we need to recognize that in both cases the amount of recovery was proportional to the amount of lost value in the previous years.
In the earlier situation, Teck’s management did a yeoman’s job of dealing with it effectively and, within a year of the GFC, the company was back in solid condition. Beginning early in 2016 Don Lindsay and his team, with the active assistance of Board members, once again dealt with it effectively through ongoing cost control, refinancing near-term debt into longer maturities, and buying back $1 billion of our outstanding bonds. We are continuing to focus on cost control, and plan to continue deploying part of our operating cash flow to reduce debt further.
Historically, the problem with too high a debt load goes beyond the obvious one of survival in a crisis. Teck is in fine shape in that respect. The more insidious one is the cost of lost opportunity, especially in weak economic times when the best opportunities are most likely to occur. As I wrote here two years ago, each of our Hemlo gold, Bullmoose coal and Antamina copper-zinc mines, transformational for the company at the time, were acquired and/or built in the middle of a financial crisis, and each was possible because we were in a financial position to do so.
Now, we are fortunate to have the Fort Hills oil sands, and the Quebrada Blanca Phase 2 and NuevaUnión copper projects as a similar part of our mining pipeline for the future. Fort Hills should be producing oil less than a year from now, permitting and feasibility studies at Quebrada Blanca 2 are advancing well, and NuevaUnión should not be far behind. But as we have seen, taking a mining project from discovery through permitting and into production takes time, and it is never too early to be acting on early-stage, potential new projects that can augment that pipeline and be the next tier of mines of the future. We can never rest on our ores.
So this is our plan: to continue controlling debt as well as costs at current operations, to focus all hands on deck to get our existing portfolio of development projects off the ground (or out of it, to be more precise), and to seek out opportunities to augment the pipeline cost-effectively with good prospects that may become the next generation of new mines. That in a nutshell is how the company was built, and must go on.
And we must continue to do it professionally, as the partner of choice as well as the employer of choice within the industry and the communities in which we operate.
In closing, I’m sorry to report that Jack Cockwell will be retiring from the Board at the upcoming AGM. Jack joined us in the aftermath of the GFC and was a quiet but strong voice in the recovery. He has been a pleasure to work with and will be missed, although I have a feeling he will still be as close as the telephone as we go on.
Nominated to join the Board at the AGM is Una Power from Calgary, who brings a strong knowledge of finance and the oil business from her years as Chief Financial Officer of Nexen Energy. Una will continue the renewal process of the past few years that has seen several new directors with outstanding experience in finance and/or mining engineering add to the depth of our Board.
On behalf of the Board of Directors,
Dr. Norman B. Keevil Chairman Vancouver, B.C., Canada February 23, 2017
Teck 2016 Annual Report | Every Day4

Letter from the CEO
Donald R. LindsayPresident and Chief Executive Officer
To the Shareholders
The year 2016 was one of extremes. After entering the year with commodity prices at historic lows during one of the longest and deepest downturns in our industry’s history, we saw unprecedented rallies, particularly in steelmaking coal, in the second half of the year. Today, it’s abundantly clear that the steps we took over the last five years to reduce costs, increase efficiency and improve productivity positioned us well to create real benefits for our shareholders as the markets improved.
At the beginning of the downturn, we set out a company-wide strategy focused on five key objectives that we believed would allow us to emerge stronger from those difficult times — and we have delivered against each of them:• We did not sell any core operating assets;• We did not issue equity;• We continued with our investment in Fort Hills;• We maintained strong liquidity; and,• We reduced debt.
We knew that if we remained focused on these objectives, our company would be better positioned than our competitors when commodity markets improved. As a result, we are emerging from this cycle with all of our operating assets intact, in a stronger financial position, and poised to deliver increased production per share.
While the market rally at the end of the year is fresh in our minds, the volatility we witnessed in 2016 was reflected in the significant shifts in prices for our key commodities over short periods of time. In steelmaking coal, spot prices ranged from historically low levels of US$74 per tonne in February to over US$300 per tonne in November. Our annual average realized price rose by 24% to US$115 per tonne, compared to 2015. The increase was largely due to a number of supply-side factors, and, as current coal prices have since come down from that peak, we still face a volatile price environment. In copper, prices ranged from a low of US$1.96 per pound in January to a high of US$2.69 per pound in November. Average prices fell by 11% to US$2.21 per pound, compared to last year. In zinc, prices again ranged from US$0.66 per pound in January to US$1.32 per pound in November as the global zinc deficit finally took hold in the market. Average prices rose by 9% to US$0.95 per pound, compared to 2015.
These significant price swings demonstrate the kind of volatility that is becoming the “new normal” for our industry, with commodity cycles that have the potential to be faster moving and more extreme. This makes it more important than ever that we build resilience into our business to weather the dramatic lows in the commodity price cycle, while remaining ready to capitalize on high prices when they occur.
The tenet that has guided us through the downturn has been “controlling the controllable”: ensuring safety, remaining focused on sustainability, driving down costs, controlling capital spending and maintaining strong production. In that respect, our operations continued to perform well in 2016, with 11 of our 13 operations increasing production while decreasing unit costs compared with a year ago. We also set a number of quarterly and year-to-date sales and production records. This included achieving record annual production and sales of steelmaking coal of 27.6 million tonnes and 27.0 million tonnes, respectively, as well as record annual production of refined zinc and lead at Trail Operations.
5Letter from the CEO

We generated significant free cash flow in 2016, particularly from our steelmaking coal and zinc operations. Our gross profit before depreciation and amortization in 2016 was $3.8 billion, compared with $2.6 billion in 2015, with the increase due mainly to higher commodity prices. One of our key objectives has been to reduce debt, and we are delivering on that by applying some of the additional free cash flow from higher commodity prices to strengthen our balance sheet. In just over 12 months, we reduced our debt by approximately US$1.1 billion, bringing our total debt down to $8.3 billion at year-end. Our financial position and liquidity remain strong. At December 31, 2016, we had CAD$1.4 billion of cash and US$3.0 billion (CAD$4.0 billion) of unused lines of credit, providing us with CAD$5.4 billion of liquidity. We will continue to consider opportunities to opportunistically reduce debt.
We are close to adding a fourth major commodity to our business, with construction of the Fort Hills oil sands project now surpassing 76% completion. Project execution is now effectively site-based, as the module program has been completed and all remaining construction components are now substantially on-site. While the project has seen some modest capital cost escalation, it remains on schedule to produce first oil in late 2017. The project’s economics are robust, and significant free cash flow is expected over its 44-year mine life.
We remain focused on our core value of safety across every aspect of our business. In 2016, we reduced Total Reportable Injury Frequency by approximately 13% compared with 2015, and we had zero fatalities. Lost-Time Injury Frequency fell by 11% and High-Potential Incidents by 12%. We continue to be vigilant in pursuing our vision of everyone going home safe and healthy every day. This past year, we rolled out the fourth phase of our Courageous Safety Leadership program, and we continue our focus on reducing High-Potential Incidents — those incidents that have the greatest potential to seriously injure someone.
Our 2016 progress in sustainability was recognized by a number of prominent international ranking institutes. We were named to the Dow Jones Sustainability World Index (DJSI) for the seventh consecutive year, and ranked as one of the Best 50 Corporate Citizens in Canada by media and investment research firm Corporate Knights. Following the successful completion of our first set of short-term goals in our Sustainability Strategy in 2015, we are now pursuing our next set of short-term goals that will guide our progress through to 2020, with added focus on air quality and climate change.
Looking ahead, we will continue to stay focused on delivering on our production and cost targets for each of our steelmaking coal and base metals business units in 2017. We will also continue to focus on improving operating excellence and increasing our margins to take advantage of the current positive price environment — particularly in steelmaking coal.
In addition, following project optimization work in 2016, we will continue to advance permitting in light of the updated feasibility study for our Quebrada Blanca Phase 2 project in 2017. We will also advance the NuevaUnión joint-venture project in Chile with an emphasis on technical and exploration drilling, completion of a prefeasibility study, and community relations. We will also continue to contribute to the successful completion of the Fort Hills oil sands project.
As previously announced, we had a number of senior executives retire in 2016, and I am pleased to say that the transition to our new realigned organizational structure has been a smooth one. As part of these changes, Dale Andres, Senior Vice President, Copper assumed responsibility for our zinc business, becoming Senior Vice President, Base Metals; Alex Christopher was promoted to Senior Vice President, Exploration, Projects and Technical Services; and Robin Sheremeta was promoted to Senior Vice President, Coal. The tremendous experience Dale, Alex and Robin bring to their new roles has already proven beneficial as we navigated through a volatile 2016.
We have come a long way this year. Thanks to the hard work of our employees, we have come through some of the most challenging market conditions in recent history and emerged stronger. By maintaining our focus every day on the factors within our control — safety, sustainability, costs, productivity and efficiency — I know our team is ready to take advantage of any opportunities and tackle any challenges that come our way in 2017.
Donald R. Lindsay President and Chief Executive Officer Vancouver, B.C., Canada February 23, 2017
Teck 2016 Annual Report | Every Day6

Health and SafetySafety is a core value of our company and we believe all incidents that could cause serious harm to our employees and contractors are preventable. That is why we are committed to providing strong leadership and resources to our people so we can effectively manage health and safety risks to ensure a safe workplace. Through leadership, empowerment and continuous improvement, we know it is possible to achieve our vision of everyone going home safe and healthy every day.
In 2016, we continued to see improvements in our safety performance and we had no fatalities. Total Reportable Injury Frequency was reduced by approximately 13% compared with 2015. Lost-Time Injury Frequency decreased by 11% and our High-Potential Incidents (HPIs) were 12% lower compared to last year. Additionally, we had a 23% reduction in medical aid frequency, compared to 2015.
In early 2016, we conducted a company-wide safety culture survey. The feedback we received from our people has informed the development of the fourth phase of our Courageous Safety Leadership (CSL) program, which focuses on enhancing a positive culture of safety. The launch of this next phase of CSL across our operations and offices began in late 2016 and will be a major part of our efforts in 2017.
Throughout the year, we continued to implement our Occupational Health and Hygiene strategy. We completed comprehensive occupational exposure risk assessments at 10 operations and developed a company-wide standard for hygiene programs. We plan to undertake additional assessments in 2017.
In 2017, we will continue our focus on reducing HPIs by continuing to advance our High-Potential Risk Control strategy. We will also make improvements to our occupational health and hygiene monitoring and exposure controls to protect the longer-term health of workers.
Our PeopleOur nearly 10,000 employees and contractors worldwide have expertise across a wide range of activities related to mining and mineral processing, including exploration, development, smelting, refining, safety, environmental protection, product stewardship, recycling and research.
In response to the sustained downturn in commodity markets, we began implementing workforce reductions
across our offices and operations in 2014, primarily through attrition. In total, we reduced our labour force by approximately 13% by the end of 2016.
In 2016, we continued to work towards strengthening diversity across our company. We believe that a range of backgrounds and perspectives allows for more informed decision-making and, ultimately, a stronger company. As part of our commitment to supporting an inclusive and diverse workplace that recognizes and values difference, we established a formal Inclusion and Diversity Policy in 2016. Guided by this policy, we are implementing initiatives and training programs to further enhance inclusion and diversity at Teck, including working towards increasing the number of women and Indigenous Peoples in our workforce to better reflect the communities in which we operate.
SustainabilityWe produce materials that are essential to a modern, sustainable society and help improve the quality of life for people throughout the world. To do this responsibly, we focus on meeting the expectations of communities, Indigenous Peoples and others while taking into account the broader environmental, social and economic context in which we operate.
Our approach to responsible resource development is outlined in our sustainability strategy, which sets short-term goals out to 2020 and long-term goals stretching out to 2030 in six areas of focus representing the most significant sustainability issues and opportunities facing our company: Water, Biodiversity, Energy and Climate Change, Air, Our People, and Community.
In 2016, all of our operations, projects and exploration sites continued to demonstrate a high level of social and environmental performance. Our achievements in these areas resulted in Teck being named to the Dow Jones Sustainability World Index for the seventh consecutive year, and we ranked as one of the Best 50 Corporate Citizens in Canada by media and investment research firm Corporate Knights.
Our 2016 Sustainability Report, to be released in April 2017, will cover a variety of material topics aligned with our sustainability strategy, including Health and Safety of our Workforce, Economic Performance and Contributions, Water Management, Tailings and Mine Waste Management, Relationships with Indigenous Peoples, Community Engagement, and Emergency Preparedness.
Responsibility
7Responsibility
Sustainability (continued)We take into consideration external standards and best practices in our governance of sustainability. Through our membership and involvement with several external organizations, we are able to contribute to, and engage with, others on the development of best practice in areas of sustainability performance and global sustainability trends. This includes the United Nations Global Compact, the International Council on Mining and Metals Sustainable Development Framework, the Mining Association of Canada’s Towards Sustainable Mining Initiative and the United Nations Sustainable Development Goals (SDGs).
Teck is working to support progress on the SDGs. We recognize that the mining industry has an opportunity to contribute positively to all 17 SDGs. Teck has chosen to focus on four goals in particular: • Goal 3 — Ensure healthy lives and promote well-
being for all at all ages• Goal 5 — Achieve gender equality and empower all
women and girls• Goal 8 — Promote sustainable and inclusive
economies• Goal 13 — Take urgent action to combat climate
change and its impacts
Moving forward, we are focused on working to achieve our 2020 goals, managing emerging risks and embracing opportunities created by developing issues — such as the transition to a low-carbon economy — and supporting sustainable development on the world stage through the SDGs and other frameworks.
More information on our sustainability strategy and performance can be found on our website at www.teck.com/responsibility.
8 Teck 2016 Annual Report | Every Day

Our business is exploring for, acquiring, developing and producing natural resources. We are organized into business units focused on steelmaking coal, copper, zinc and energy. These are supported by our corporate offices, which manage our corporate growth initiatives and provide marketing, administrative, technical, financial and other services.
Through our interests in mining and processing operations in Canada, the United States (U.S.), Chile and Peru, we are the world’s second-largest seaborne exporter of steelmaking coal, an important producer of copper and one of the world’s largest producers of mined zinc. We also produce lead, silver, molybdenum and various specialty and other metals, chemicals and fertilizers. In addition, we own a 20% interest in the Fort Hills oil sands project and interests in other oil sands assets in the Athabasca region of Alberta. We actively explore for copper, zinc and gold.
This Management’s Discussion and Analysis of our results of operations is prepared as at February 23, 2017 and should be read in conjunction with our audited consolidated financial statements as at and for the year ended December 31, 2016. Unless the context otherwise dictates, a reference to Teck, Teck Resources, the Company, us, we, or our, refers to Teck Resources Limited and its subsidiaries including Teck Metals Ltd. and Teck Coal Partnership. All dollar amounts are in Canadian dollars, unless otherwise stated, and are based on our consolidated financial statements that are prepared in accordance with International Financial Reporting Standards (IFRS). In addition, we use certain financial measures, which are identified throughout the Management’s Discussion and Analysis in this report, that are not measures recognized under IFRS in Canada and do not have a standardized meaning prescribed by IFRS or by Generally Accepted Accounting Principles (GAAP) in the U.S. See “Use of Non-GAAP Financial Measures” on page 47 for an explanation of these financial measures and reconciliation to the most directly comparable financial measures under IFRS.
This Management’s Discussion and Analysis contains certain forward-looking information and forward-looking statements. You should review the cautionary statement on forward-looking information under the heading “Cautionary Statement on Forward-Looking Information” on page 49, which forms part of this Management’s Discussion and Analysis, as well as the risk factors discussed in our most recent Annual Information Form.
Additional information about us, including our most recent Annual Information Form, is available on our website at www.teck.com, on the Canadian Securities Administrators website at www.sedar.com (SEDAR), and on the EDGAR section of the United States Securities and Exchange Commission (SEC) website at www.sec.gov.
Management’s Discussion and Analysis
9Management’s Discussion and Analysis

Business Unit Results
The table below shows a summary of our production of our major commodities for the last five years and estimated production for 2017.
Five-Year Production Record and Our Estimated Production in 2017
Units in 000’s 2017(2)
(excluding steelmaking coal and molybdenum) 2012 2013 2014 2015 2016 estimate
Principal Products
Steelmaking coal million 24.7 25.6 26.7 25.3 27.6 27.5 tonnes
Copper(1) tonnes 373 364 333 358 324 282
Zinc
Contained in concentrate tonnes 598 623 660 658 662 670
Refined tonnes 284 290 277 307 312 302
Other Products
Lead
Contained in concentrate tonnes 95 97 123 124 128 112
Refined tonnes 88 86 82 84 99 95
Molybdenum contained million in concentrate pounds 12.7 8.3 5.9 4.4 7.7 11.2
Notes:(1) We include 100% of the production and sales from Quebrada Blanca and Carmen de Andacollo mines in our production and sales volumes,
even though we own 76.5% and 90%, respectively, of these operations, because we fully consolidate their results in our financial statements. We include 22.5% of production and sales from Antamina, representing our proportionate interest in Antamina.
(2) Production estimate for 2017 represents the mid-range of our production guidance.
10 Teck 2016 Annual Report | Every Day

Average commodity prices and exchange rates for the past three years, which are key drivers of our profit, are summarized in the following table.
US$ CAD$
2016 % chg 2015 % chg 2014 2016 % chg 2015 % chg 2014
Steelmaking coal (realized — $/tonne) 115 +24% 93 -19% 115 153 +31% 117 -7% 126
Copper (LME cash — $/pound) 2.21 -11% 2.49 -20% 3.11 2.94 -8% 3.19 -7% 3.43
Zinc (LME cash — $/pound) 0.95 +9% 0.87 -11% 0.98 1.26 +14% 1.11 +3% 1.08
Exchange rate (Bank of Canada)
US$1 = CAD$ 1.33 +4% 1.28 +16% 1.10
CAD$1 = US$ 0.75 -4% 0.78 -14% 0.91
Our revenues and gross profit before depreciation and amortization, and gross profit, by business unit for the past three years are summarized in the following table.
Gross Profit Before Revenues Depreciation and Amortization(1) Gross Profit (Loss)
($ in millions) 2016 2015 2014 2016 2015 2014 2016 2015 2014
Steelmaking coal $ 4,144 $ 3,049 $ 3,335 $ 2,007 $ 906 $ 920 $ 1,379 $ 200 $ 208
Copper 2,007 2,422 2,586 788 931 1,177 190 426 678
Zinc 3,147 2,784 2,675 984 805 779 830 655 649
Energy 2 4 3 2 3 3 (3) (2) –
Total $ 9,300 $ 8,259 $ 8,599 $ 3,781 $ 2,645 $ 2,879 $ 2,396 $ 1,279 $ 1,535
Note:(1) Gross profit before depreciation and amortization is a non-GAAP financial measure. See “Use of Non-GAAP Financial Measures” section for
further information.
11Management’s Discussion and Analysis

In 2016, our steelmaking coal operations produced 27.6 million tonnes of steelmaking coal, with sales of 27.0 million tonnes. The majority of our sales are to the Asia-Pacific region, with lesser amounts going primarily to Europe and the Americas. Our current production capacity is approximately 28 million tonnes, and we have total proven and probable reserves of 962 million tonnes of steelmaking coal.
During the third quarter of 2016, our Elkview Operations was granted an environmental assessment certificate for the Baldy Ridge Extension project, which is expected to extend the life of the mine by approximately 23 years. Capital spending for this project is currently estimated to be approximately $60 million over the next five years. First steelmaking coal production from these mining areas is planned for early 2018. In 2015, our Fording River Operations was granted all the necessary permits to begin mining the Swift area of Greenhills Ridge, which will extend the life of the mine by approximately 25 years.
New five-year collective labour agreements were reached in 2016 at Fording River and Elkview operations, and a four-year agreement was ratified at Coal Mountain Operations.
In 2016, our steelmaking coal business unit accounted for 44% of revenue and 53% of gross profit before depreciation and amortization.
($ in millions) 2016 2015 2014
Revenues $ 4,144 $ 3,049 $ 3,335
Gross profit before depreciation and amortization(1) $ 2,007 $ 906 $ 920
Gross profit $ 1,379 $ 200 $ 208
Production (million tonnes) 27.6 25.3 26.7
Sales (million tonnes) 27.0 26.0 26.2
Operations Gross profit before depreciation and amortization increased in 2016, primarily due to higher steelmaking coal prices. Our average realized selling price in 2016 increased to US$115 per tonne, compared with US$93 per tonne in 2015 and US$115 per tonne in 2014. The results of our steelmaking coal business unit for 2016 were strongly affected by a dramatic increase in prices in the fourth quarter.
Sales volumes of 27.0 million tonnes in 2016, a new record high, were 1.0 million tonnes higher than in 2015, mainly due to strong market conditions arising from a combination of tightness in supply and robust demand in all market areas.
Our 2016 production of 27.6 million tonnes was up 2.3 million tonnes from 2015, primarily due to strong production performance from the business unit. We set a new production record with annual records at our Elkview and Line Creek operations.
Steelmaking Coal
Note:(1) Gross profit before depreciation and amortization is a non-GAAP financial measure. See “Use of Non-GAAP Financial Measures” section for further information.
12 Teck 2016 Annual Report | Every Day

The cost of product sold in 2016, before transportation, depreciation and one-time collective agreement settlement charges, was $43 per tonne, compared with $45 per tonne in 2015. This cost reduction was achieved through significantly increased production rates, the impacts of initiatives undertaken to improve productivity, improved maintenance and supply management, and lower energy prices, partially offset by the strengthening U.S. dollar on some inputs. During the fourth quarter, we incurred one-time labour settlement charges of $49 million as a result of new collective agreements at Fording River and Elkview operations.
Capital spending in 2016 included $38 million for sustaining capital, $33 million for major enhancements to increase productive capacity and $277 million on stripping activities.
Elk Valley Water Management
We continue to implement the water quality management measures required by the Elk Valley Water Quality Plan (the “Plan”), which was approved in the fourth quarter of 2014 by the B.C. Minister of Environment.
In 2016, we spent approximately $40 million towards implementation of the Plan and, in 2017, we expect to spend approximately $100 million.
Our West Line Creek active water treatment facility is operating consistent with design parameters and in compliance with permit limits. We are continuing to investigate an issue regarding selenium compounds in effluent. Work is ongoing to assess the potential implications of this issue and, if associated environmental impacts are identified, modifications to operating parameters or facilities may be required. The cost of modifications may be material. Permitting of future mine expansions may be delayed, and design and construction of additional water treatment facilities will likely be delayed while we determine the significance of the issue and how to address it. We are reviewing the design of the proposed Fording River active water treatment facility, the next facility contemplated by the Plan to ensure that the same selenium compound issue does not arise.
We expect that, in order to maintain water quality, water treatment will need to continue for an indefinite period after mining operations end. The Plan contemplates ongoing monitoring of the regional environment to ensure that the water quality targets set out in the Plan are in fact protective of the environment and human health, and provide for adjustments if warranted by monitoring results. This ongoing monitoring, as well as our continued research into treatment technologies, could reveal unexpected environmental implications or technical issues or advances associated with potential treatment technologies that could increase or decrease both capital and operating costs associated with water quality management.
Rail
Rail transportation of product from our five steelmaking coal mines in southeast B.C. to Vancouver port terminals is provided under a 10-year agreement with Canadian Pacific Railway (CP Rail) that expires March 31, 2021. Most of Teck’s eastbound coal deliveries to North American customers are shipped pursuant to an agreement with CP Rail. The remaining portion of Teck’s eastbound coal deliveries are shipped via the Burlington Northern Santa Fe (BNSF) railway. Our Cardinal River Operations in Alberta is served by Canadian National Railway, which transports our product to ports on the west coast.
Ports
We maintain access to terminal loading capacity in excess of our planned 2017 shipments. Neptune Bulk Terminals, in which we have a 46% ownership interest, received the final permit required for execution of a project to expand steelmaking coal throughput capacity. Work is now underway to update engineering, which was previously suspended in 2013, to increase throughput capacity to approximately 18.5 million tonnes. The potential for greater throughput is being studied. If sanctioned in 2017, the project is scheduled to be completed by early 2020.
In addition, our contract with Westshore Terminals provides us with 19 million tonnes of annual capacity through to March 2021, and we have contracted capacity at Ridley Terminals near Prince Rupert to provide for steelmaking coal shipments from our Cardinal River Operations in Alberta.
13Management’s Discussion and Analysis

Spot price assessments(US$ per tonne FOB Australia) Quarterly benchmark(US$ per tonne FOB Australia)
Rest of the world (tonnes in millions) China (tonnes in millions)
Mongolia (tonnes in millions) Seaborne (tonnes in millions)
Daily Steelmaking Coal AssessmentsSource: Argus
Hot Metal (Pig Iron) ProductionSource: World Steel Association, NationalBureau of Statistics of China
China Steelmaking Coal ImportsSource: GTIS, China’s Customs
$50
$100
$150
$200
$250
$300
$350
2011 2012 2013 2014 2015 2016 1996 2000 2004 2008 2012 2016 2008 2010 2012 2014 2016 0
200
400
600
800
1,000
1,200
0
10
20
30
40
50
60
70
80
Tonnes Tonnes
Sales
Our steelmaking coal marketing strategy is focused on maintaining and building relationships with our traditional customers while establishing new customers in markets where we anticipate long-term growth in steel production and demand for seaborne steelmaking coal. In 2016, we continued to focus our marketing in areas with the greatest demand growth, increasing sales to India and Vietnam, as well as increasing sales volume to areas such as Japan, Korea and Taiwan.
MarketsIn late 2016, there was a dramatic increase in steelmaking coal prices due to tightness in supply. This was the result of numerous factors, including: the implementation of production curtailments that began in 2014 that have depleted global production capacity and inventories, a reduction in Chinese domestic production resulting from the implementation of a 276-day operating policy for steelmaking coal mines, production disruptions at key Australian mines, and increased seaborne demand from most market areas.
The benchmark price for our highest-quality products increased from US$81 per tonne in early 2016 to US$285 per tonne for the first quarter of 2017. Spot price assessments trended up for most of 2016, starting after the Lunar New Year holiday in China. After a short correction in May, price assessments resumed their progression upwards from June and exceeded US$200 in mid-September, crossing US$300 in early November and then fell in December. As of mid-February 2017, spot price assessments have dropped below the reported benchmark level by more than 45% at approximately US$155 per tonne. The proportion of our steelmaking coal sales priced on a spot basis remained stable in 2016 at approximately 60% of total volumes.
Market expectations are that global steel production and demand for steelmaking coal will continue to increase in 2017, but there is uncertainty on where prices will ultimately settle. The high price environment observed from September to November 2016 encouraged increased supply from existing producers and a number of mine restarts. While it is unclear how long the price correction that started in December will last, we are well positioned and prepared to be highly successful in numerous future market scenarios.
The following graphs show key metrics affecting steelmaking coal sales: spot price assessments and quarterly benchmark pricing, hot metal production (each tonne of hot metal, or pig iron, produced requires approximately 650–700 kilograms of steelmaking coal), and China’s steelmaking coal imports by source.
14 Teck 2016 Annual Report | Every Day

OutlookSteelmaking coal production in 2017 is expected to be between 27 and 28 million tonnes. As in prior years, annual volumes produced will be adjusted if necessary to reflect market demand for our products. Meeting this production target will require adequate rail and port service. Assuming that current market conditions persist, production from 2018 to 2020 is expected to remain similar to 2017, despite the closure of the Coal Mountain Operations in late 2017 as reserves become depleted in the current mining area.
We are expecting sales volumes in the first quarter of 2017 to be approximately 6.0 million tonnes. As steel mills draw down on inventories built up in the fourth quarter, we are expecting sales to be weighted towards the back of the quarter, with the result that we expect our first quarter realized price to be approximately 75% of the benchmark price. Our sales volumes in the first quarter of each year are typically lower than other quarters in the year due to winter weather-related issues and Lunar New Year holidays in China.
Vessel nominations for quarterly contract shipments are determined by customers and final sales and average prices for the quarter will depend on product mix, market direction for spot priced sales and timely arrival of vessels, as well as the performance of the rail transportation network and port loading facilities. Poor rail performance in the fourth quarter of 2016 and in 2017 to date has reduced port inventories and has required production cutbacks as mine inventories reached critical levels at some sites.
We intend to replace the approximately 2.25 million tonnes of annual steelmaking coal production from Coal Mountain by increasing production at our other Elk Valley mines. We received permits in the latter half of 2016 to commence mining in new areas at the Fording River, Elkview and Greenhills operations, which will extend the lives of these mines and allow us to increase production. This will require some investment in the processing plants and the transfer of mining assets from Coal Mountain in order to develop the recently permitted mining areas at each of the sites. The strip ratios in these new areas will be higher as they are developed and we may require some additional mining capacity to balance coal production targets.
With this additional mining activity, we expect our site costs in 2017 to be in the range of $46 to $50 per tonne (US$35 to US$39). This range is higher than in 2016, primarily as the result of the efforts described above to maintain total production after the closure of Coal Mountain, which will require use of additional equipment and labour. We also anticipate increased costs for inputs, including diesel. Additionally, as we did in the fourth quarter of 2016, we plan to spend funds as required to maximize production and sales in the current market environment, while maintaining appropriate cost discipline.
Transportation costs in 2017 are expected to be approximately $35 to $37 per tonne (US$27 to US$29).
Strip ratios vary as mining progresses, and with the accelerated mining activity as described above, we expect our overall mining costs to increase from 2016 levels and a higher proportion of mining costs are expected to relate to capitalized stripping as we enter into the new mining areas at Fording River, Elkview, Greenhills and Line Creek operations in preparation for the mine life extensions. As a result, we expect an increase in capitalized stripping from $277 million in 2016 to $430 million in 2017.
Capital spending planned for 2017 also includes $140 million for sustaining capital and $120 million for major enhancement projects, the latter of which largely relates to the initial development costs to enter into the new mining areas mentioned above at our Elk Valley operations.
15Management’s Discussion and Analysis

In 2016, we produced 324,200 tonnes of copper from our Highland Valley Copper Operations in B.C., our 22.5% interest in Antamina in Peru, and our Quebrada Blanca and Carmen de Andacollo operations in Chile. Copper production fell 9% from 2015, primarily due to lower grades and recoveries at Highland Valley Copper, partially offset by higher grades and recoveries at Antamina.
In 2016, our copper operations accounted for 22% of our revenue and 21% of our gross profit before depreciation and amortization. Gross Profit (Loss) Before Revenues Depreciation and Amortization(1) Gross Profit (Loss)
($ in millions) 2016 2015 2014 2016 2015 2014 2016 2015 2014
Highland Valley Copper $ 750 $ 999 $ 943 $ 268 $ 449 $ 419 $ 86 $ 278 $ 265
Antamina 627 634 659 409 412 450 305 304 373
Carmen de Andacollo 401 442 504 86 86 164 (211) (141) (16)
Quebrada Blanca 229 288 375 24 (19) 118 9 (4) 67
Duck Pond – 53 96 – (3) 16 – (17) (21)
Other – 6 9 1 6 10 1 6 10
Total $ 2,007 $ 2,422 $ 2,586 $ 788 $ 931 $ 1,177 $ 190 $ 426 $ 678
Production Sales
(000’s tonnes) 2016 2015 2014 2016 2015 2014
Highland Valley Copper 119 152 121 122 150 124
Antamina 97 88 78 95 87 78
Carmen de Andacollo 73 73 72 73 72 74
Quebrada Blanca 35 39 48 35 40 49
Duck Pond – 6 14 – 8 13
Total 324 358 333 325 357 338
Copper
Note:(1) Gross profit before depreciation and amortization is a non-GAAP financial measure. See “Use of Non-GAAP Financial Measures” section for
further information.
16 Teck 2016 Annual Report | Every Day

Operations
Highland Valley Copper
Highland Valley Copper Operations is located in south-central B.C. We increased our interest in the mine to 100% in the third quarter of 2016 by acquiring the remaining 2.5% minority stake. Gross profit before depreciation and amortization was $268 million in 2016, compared to $449 million in 2015 and $419 million in 2014, resulting from lower metal prices and a decline in sales volumes, despite significant operating cost reductions. Highland Valley Copper’s 2016 production was 119,300 tonnes of copper in concentrate, compared to 151,400 tonnes in 2015 and 121,500 tonnes in 2014. The decrease was primarily due to lower copper grades and lower recoveries, partially offset by higher mill throughput. Molybdenum production was 59% higher in 2016 at 5.4 million pounds, compared to 3.4 million pounds in 2015, primarily due to higher grades.
Ore is currently mined from the Valley, Lornex and Highmont pits. The transition to mining more of the lower grade Lornex ores progressed during the final quarter of 2016 as the current high-grade phase of the Valley pit was exhausted.
Our labour agreement at Highland Valley Copper expired at the end of the third quarter of 2016 and negotiations are ongoing.
As anticipated in the mine plan, production at Highland Valley Copper will vary significantly over the next few years due to significant fluctuations in ore grades and hardness in the three active pits. The production plan relies primarily on Lornex ore in 2017, supplemented by the similarly low-grade Highmont pit and lower grade sources in the Valley pit, which is now in a heavier stripping phase over the next three to four years. Copper production in 2017 is anticipated to be between 95,000 and 100,000 tonnes, with lower production in the first half of the year, before gradually recovering in 2018 and 2019. Annual copper production from 2018 to 2020 is expected to be between 115,000 and 135,000 tonnes per year. Copper production is anticipated to return to above life of mine average levels of 140,000 tonnes per year after 2020, through to the end of the current mine plan in 2026. Molybdenum production in 2017 is expected to be approximately 9.0 to 9.5 million pounds contained in concentrate, before declining to approximately 7.0 million pounds contained in concentrate annually from 2018 to 2020.
Antamina
We have a 22.5% share interest in Antamina, a copper-zinc mine in Peru. The other shareholders are BHP Billiton plc (33.75%), Glencore plc (33.75%) and Mitsubishi Corporation (10%). In 2016, our share of gross profit before depreciation and amortization was $409 million, compared with $412 million in 2015 and $450 million in 2014. Gross profit in 2016 remained similar to a year ago as higher production and sales levels were offset by lower copper prices.
Antamina’s copper production (100% basis) in 2016 was 431,100 tonnes, compared to 390,600 tonnes in 2015, with the increase primarily as a result of higher grades and recovery. Zinc production decreased by 16% to 198,000 tonnes in 2016, primarily due to a lower portion of copper-zinc ore processed, partially offset by higher zinc grades and recoveries. Molybdenum production totalled 10.3 million pounds, which was 134% higher than in 2015, due to higher grades.
Pursuant to a long-term streaming agreement made in 2015, Teck has agreed to deliver an equivalent to 22.5% of payable silver sold by Compañía Minera Antamina S.A., using a silver payability factor of 90%, to a subsidiary of Franco-Nevada Corporation (FNC). FNC pays a cash price of 5% of the spot price at the time of each delivery. In 2016, approximately 4.4 million ounces of silver were delivered under the agreement. After 86 million ounces of silver have been delivered under the agreement, the stream will be reduced by one-third.
In January 2016, a new labour agreement was ratified that expires in the third quarter of 2018.
Our 22.5% share of Antamina’s 2017 production is expected to be in the range of 88,000 to 92,000 tonnes of copper, 75,000 to 80,000 tonnes of zinc and approximately 2.0 million pounds of molybdenum in concentrate. Our share of copper production is expected to be between 90,000 and 100,000 tonnes from 2018 to 2020. Zinc production is expected to remain strong as the mine enters a phase with high zinc grades and a higher proportion of copper-zinc ore processed. Our share of zinc production is anticipated to average 80,000 tonnes per year during the same 2018 to 2020 period; however, annual production will fluctuate due to feed grades and the amount of copper-zinc ore processed, as anticipated in the mine plan. Our share of annual molybdenum production is expected to be between 2.5 and 3.0 million pounds between 2018 and 2020.
17Management’s Discussion and Analysis

Carmen de Andacollo
We have a 90% interest in the Carmen de Andacollo mine in Chile, which is located in the Coquimbo Region of central Chile. The remaining 10% is owned by Empresa Nacional de Minería (ENAMI), a state-owned Chilean mining company. Gross profit before depreciation and amortization was $86 million in 2016, the same as in 2015, and $164 million in 2014. Despite lower copper prices in 2016, gross profit was unchanged as a result of our cost reduction initiatives.
Carmen de Andacollo produced 69,500 tonnes of copper contained in concentrate in 2016, similar to 2015. Copper cathode production was 3,700 tonnes in 2016, compared with 4,700 tonnes in 2015. Gold production, on a 100% basis, of 53,300 ounces was 12% higher than production of 47,600 ounces in 2015, with 100% of the gold produced for the account of RGLD Gold AG (RGLDAG), a wholly owned subsidiary of Royal Gold, Inc., pursuant to an agreement made in 2015. RGLDAG pays a cash price of 15% of the monthly average gold price at the time of each delivery.
Consistent with the mine plan, copper grades are expected to continue to gradually decline in 2017 and in future years, which we expect to largely offset with planned throughput improvements in the mill. Carmen de Andacollo’s production in 2017 is expected to be similar to 2016 and in the range of 68,000 to 72,000 tonnes of copper in concentrate and 3,000 to 4,000 tonnes of copper cathode. Copper concentrate production is expected to be in the range of 65,000 to 70,000 tonnes for the subsequent three-year period, with cathode production volumes uncertain past 2017, although there is potential to extend.
Quebrada Blanca
Quebrada Blanca is located in the Tarapacá Region of northern Chile. We own a 76.5% interest in Quebrada Blanca. The other shareholders are Inversiones Mineras S.A. (13.5%) and ENAMI (10%). ENAMI’s interest is a carried interest and, as a result, ENAMI is generally not required to contribute further funding to Quebrada Blanca. The operation mines ore from an open pit and leaches the ore to produce copper cathodes via a conventional solvent extraction and electrowinning (SX-EW) process.
Quebrada Blanca’s gross profit before depreciation and amortization was $24 million in 2016, compared with a gross loss before depreciation and amortization of $19 million in 2015 and a gross profit before depreciation and amortization of $118 million in 2014. The improvement in 2016 was primarily due to significant reductions in operating costs compared to 2015, partially offset by lower copper prices and declining copper cathode production and sales volumes.
In 2016, Quebrada Blanca produced 34,700 tonnes of copper cathode, compared to 39,100 tonnes in 2015, with the reduction primarily as a result of ore availability and declining ore grades as the supergene deposit is depleted.
During the third quarter of 2016, we received our updated environmental permits for the existing facilities. During the first quarter of 2017, the agglomeration circuit will be halted with all remaining supergene ore sent to the dump leach circuit, further reducing operating costs, although with a longer leaching cycle. Work is continuing on optimizing the mine plan based on the lower operating cost profile and current copper price. Opportunities to recover additional copper from previously processed material continue to be evaluated.
In February 2017, we extended the life of two of the three labour agreements at Quebrada Blanca into the first quarter of 2019, leaving only one labour agreement expiring in 2017 at the end of November.
We expect production of approximately 20,000 to 24,000 tonnes of copper cathode in 2017. Future production plans will depend on copper prices and further cost reduction efforts, although we currently anticipate cathode production to continue until mid-2019 at reduced cathode production rates as the supergene deposit is exhausted.
Quebrada Blanca Phase 2
In early 2017, we completed an updated feasibility study on our Quebrada Blanca Phase 2 project, which incorporates recent project optimization and certain scope changes, including a revised tailings facility located closer to the mine. This project has the potential to be a large-scale, long-life copper asset for Teck in the stable mining jurisdiction of Chile, with a large resource base and the potential to significantly extend the mine life beyond the feasibility case. The project is expected to generate strong economic returns with all-in cash costs very well placed on the cost curve. Sustaining capital is expected to be quite low for this project due to the low strip ratio and shorter initial mine life of 25 years, hence a reduced need for replacement mobile equipment. Annual tailings construction costs are included as operating costs, with minimal sustaining capital requirements. Major process equipment as well as infrastructure, such as the
18 Teck 2016 Annual Report | Every Day

water supply pipeline from the coast, have been designed to last the life of mine without significant capital investment. The project is currently undergoing environmental permitting, with permit approval anticipated in early 2018.
The updated study estimates a capital cost for the development of the project on a 100% basis of US$4.7 billion (in first quarter of 2016 dollars, not including working capital or interest during construction), of which our funding share would be US$4.0 billion. This compares to the 2012 feasibility study estimate of US$5.6 billion (in January 2012 dollars).
The study is based upon an initial mine life of 25 years, consistent with the capacity of the new tailings facility. The mine plan includes 1.259 billion tonnes of proven and probable mineral reserves grading 0.51% copper and 0.019% molybdenum. The project scope includes the construction of a 140,000 tonne-per-day concentrator and related facilities connected to a new port facility and desalination plant by 165 kilometre-long concentrate and desalinated water pipelines.
The project contemplates annual production of 275,000 tonnes of copper and over 7,700 tonnes of molybdenum in concentrate for the first full five years of mine life. On the basis of copper equivalent production of approximately 301,000 tonnes per year over the first full five years of mine life this equates to a capital intensity of less than US$16,000 per annual tonne.
As part of the regulatory process, we submitted the Social and Environmental Impact Assessment to the Region of Tarapacá Environmental Authority in the third quarter of 2016. A decision to proceed with development would be contingent upon regulatory approvals and market conditions, among other considerations. Given the timeline of the regulatory process, we do not expect to be in a position to consider such a decision before mid-2018. Assuming a mid-2018 full construction start, the project schedule anticipates first ore processed in the latter half of 2021.
NuevaUnión (formerly Project Corridor)
In October 2016, work began on a pre-feasibility study concurrently with early and ongoing engagement with Indigenous Peoples and non-Indigenous communities to gather feedback and help inform project design. In addition, the first environmental baseline campaign was completed in December 2016. Planned 2017 activities include 16,750 metres of technical drilling on the Relincho and La Fortuna (El Morro) deposits in support of the studies. We expect to complete the pre-feasibility study at the end of the third quarter of 2017.
Other Copper Projects
In 2016, we completed a prefeasibility study at the Zafranal copper-gold project, located in southern Peru. The project is held by Compañía Minera Zafranal S.A.C. In January 2017, we increased our ownership of Compañía Minera Zafranal S.A.C. to 80% through an acquisition of all of the outstanding shares of AQM Copper Inc., not already owned by us. The remaining 20% share is held by Mitsubishi Materials Corporation. Additional drilling and a feasibility study are planned to start in 2017 along with additional community engagement activities, environmental studies and archeological studies, and permitting work necessary to prepare and submit an Environmental Impact Assessment.
MarketsCopper prices on the London Metal Exchange (LME) averaged US$2.21 per pound in 2016, down US$0.28 per pound or 11% from the average of 2015. Copper was the worst performer of all the LME metals through the first 10 months of 2016, before rebounding in early November back above US$2.50 per pound.
Global demand for copper metal grew by 2.0% in 2016 to reach an estimated 22.3 million tonnes. Copper consumption growth was lower than initially projected, but at 2.0% was higher than the 1.3% growth rate in 2015. Stronger than expected construction and automotive growth have partially offset declines in manufacturing. Demand growth in both the U.S. and Europe was above previous forecasts on better automotive sales, while a stronger U.S. dollar has had an impact on U.S. manufacturing exports. The availability of copper scrap remains constrained, with imports of scrap into China down an estimated 8% in 2016.
Copper stocks on the LME rose by 36% to 322,000 tonnes in 2016, while Shanghai stocks fell by 18% to 147,000 tonnes and COMEX warehouse stocks increased 18% to 76,000 tonnes. Combined exchange stocks increased 66,850 tonnes during the year and ended the year at 544,200 tonnes. Total reported global stocks — including producer, consumer, merchant and terminal stocks — stood at an estimated 22 days of global consumption versus the 25-year average of 28 days.
19Management’s Discussion and Analysis

2011 2012 2013 2014 2015 2016 1996 2000 2004 2008 2012 2016 2011 2012 2013 2014 2015 2016
Rest of the world (tonnes in millions) China (tonnes in millions)
LME inventory (tonnes in thousands)Copper price (US$ per pound)
Inventories (tonnes in thousands) Days of global consumption25-year average days inventory
Copper Price and LME InventorySource: LME
Global Demand for CopperSource: ICSG, Wood Mackenzie
Global Copper InventoriesSource: ICSG, LME, CME, SHFE
$0.00
$1.00
$2.00
$3.00
$4.00
$5.00
0
5
10
15
20
25
0
200
400
600
800
1,000
1,200
1,400
Tonnes DaysTonnes Tonnes0
150
300
450
600
750
0
5
10
15
20
25
30
35
In 2016, global copper mine production increased 3.8% to reach 19.9 million tonnes. Operational issues at copper mines had less of an impact on mine production in 2016 than in years past, with estimates of only 2.7% net production lost over initial projections. While the pace of disruptions increased in the second half of 2016, several mines achieved higher than projected output during the year by adjusting mine plans, high-grading, and increasing throughput to keep costs down. Mine production growth is expected to slow in 2017 after two years of above-trend growth. According to Metal Bulletin, copper spot treatment charges have fallen from US$103 per tonne in July 2016 to US$83 per tonne by the end of the year. Market fundamentals remain positive over the medium to long term, with supply constrained by lower grades, ongoing operational difficulties, and project delays or deferrals due to low prices during most of 2016.
In China, estimated copper mine production in 2016 fell 4.5% compared to 2015 levels, while refined production increased 13.1% over the previous year. This was achieved through a 27% increase in imported concentrates into China in the first 11 months of 2016, setting a new record for concentrate imports of 4.4 million tonnes of copper contained in concentrate.
Wood Mackenzie, a commodity research consultancy, is forecasting a 0.7% decrease in base case global mine production in 2017 to 19.8 million tonnes. Scrap supply is expected to remain constrained through 2017 following a year of weak manufacturing production.
With global copper metal demand projected by Wood Mackenzie to increase by 2.1% in 2017, projected supply is now expected to be slightly below demand, placing the refined market in a small deficit in 2017.
OutlookWe expect 2017 copper production to be in the range of 275,000 to 290,000 tonnes, a decline of approximately 13% from 2016 production levels. The lower production is primarily due to continued lower grades and recoveries at Highland Valley Copper and further planned production declines at Quebrada Blanca as it nears the end of its life for the supergene deposit.
In 2017, we expect our copper unit costs to be in the range of US$1.75 to US$1.85 per pound before margins from by-products and US$1.40 to US$1.50 per pound after by-products based on current production plans, by-product prices and exchange rates.
We expect copper production to be in the range of 280,000 to 300,000 tonnes from 2018 to 2020.
20 Teck 2016 Annual Report | Every Day

We are one of the world’s largest producers of mined zinc, primarily from our Red Dog Operations in Alaska, as a co-product from the Antamina copper mine in northern Peru, and from our Pend Oreille mine in Washington state. Our metallurgical complex in Trail, B.C. is one of the world’s largest integrated zinc and lead smelting and refining operations. In total, we produced 661,600 tonnes of zinc in concentrate, while our Trail Operations produced a record 311,600 tonnes of refined zinc in 2016.
In 2016, our zinc business unit accounted for 34% of revenue and 26% of gross profit before depreciation and amortization.
Gross Profit (Loss) Before Revenues Depreciation and Amortization(1) Gross Profit (Loss)
($ in millions) 2016 2015 2014 2016 2015 2014 2016 2015 2014
Red Dog $ 1,444 $ 1,220 $ 1,240 $ 749 $ 600 $ 638 $ 668 $ 537 $ 574
Trail Operations 2,049 1,847 1,699 241 205 142 178 124 76
Pend Oreille 77 47 – – (9) – (10) (15) –
Other 7 7 11 (6) 9 (1) (6) 9 (1)
Inter-segment (430) (337) (275) – – – – – –
Total $ 3,147 $ 2,784 $ 2,675 $ 984 $ 805 $ 779 $ 830 $ 655 $ 649
Production Sales
(000’s tonnes) 2016 2015 2014 2016 2015 2014
Refined zinc
Trail Operations 312 307 277 312 308 277
Contained in concentrate
Red Dog 583 567 596 600 613 594
Pend Oreille 34 31 – 34 31 –
Copper business unit(1) 45 60 64 43 62 63
Total 662 658 660 677 706 657
Note:(1) Includes zinc production from Antamina and Duck Pond (closed in 2015).
Zinc
Note:(1) Gross profit before depreciation and amortization is a non-GAAP financial measure. See “Use of Non-GAAP Financial Measures” section for further
information.
21Management’s Discussion and Analysis

Operations
Red Dog
Red Dog Operations, located in northwest Alaska, is one of the world’s largest zinc mines. Red Dog’s gross profit before depreciation and amortization in 2016 was $749 million, compared with $600 million in 2015 and $638 million in 2014. Gross profit increased from a year ago, primarily due to higher zinc and lead prices.
In 2016, zinc production at Red Dog increased to 583,000 tonnes compared to 567,000 tonnes in 2015, primarily due to increased mill throughput with softer ores processed. Lead production in 2016 rose to 122,300 tonnes, compared to 117,600 tonnes in 2015, primarily due to higher mill throughput.
Planned activities in 2017 will include an US$18 million exploration drilling program, with associated study work focused on extending the life of Red Dog past 2031. In addition, a feasibility study is in progress that aims to increase the mill throughput rate to help offset future grade declines and harder ores anticipated in the current mine plan.
Red Dog’s location exposes the operation to severe weather and winter ice conditions, which can significantly affect production, sales volumes and operating costs. In addition, the mine’s bulk supply deliveries and all concentrate shipments occur during a short ocean shipping season that normally runs from early July to late October. This short shipping season means that Red Dog’s sales volumes are usually higher in the last six months of the year, resulting in significant variability in its quarterly profit, depending on metal prices.
In accordance with the operating agreement governing the Red Dog mine between Teck and NANA Regional Corporation, Inc. (NANA), we pay a 30% royalty on net proceeds of production to NANA. This royalty increases by 5% every fifth year to a maximum of 50%, with the next adjustment to 35% occurring in October 2017. The NANA royalty charge in 2016 was US$213 million, compared with US$137 million in 2015. NANA has advised us that it ultimately shares approximately 64% of the royalty, net of allowable costs, with other Regional Alaska Native corporations pursuant to section 7(i) of the Alaska Native Claims Settlement Act.
A payment in lieu of taxes (PILT) agreement between Teck Alaska and the North West Arctic Borough (the last regional municipality) expired December 31, 2015. Prior to the expiry of the PILT agreement, the Borough enacted a new tax ordinance, imposing a severance tax that would have significantly increased local taxes paid by Teck Alaska. Teck Alaska filed a legal complaint challenging the legality of the severance tax and seeking to compel the Borough to engage in good faith negotiations with respect to a new PILT agreement. Early in 2017, Teck Alaska and the Borough agreed on a term sheet, with respect to the terms of a new 10-year PILT agreement. Under the terms contemplated by the term sheet, PILT payments to the Borough, based on the assessed property value of the mine, would increase by approximately 30%. In addition, Teck Alaska would make annual payments based on mine profitability to a separate fund aimed at social investment in villages in the region. This agreement is subject to approvals by the Borough and Teck Alaska and will not be effective until a definitive PILT agreement and related documents are settled.
Red Dog’s production of contained metal in 2017 is expected to be in the range of 545,000 to 565,000 tonnes of zinc and 110,000 to 115,000 tonnes of lead. From 2018 to 2020, Red Dog’s production of contained metal is expected to be in the range of 500,000 to 525,000 tonnes of zinc and 85,000 to 115,000 tonnes of lead.
Pend Oreille
Pend Oreille, located in Washington state, achieved zinc production of 34,100 tonnes in 2016, compared to 30,700 tonnes in 2015.
The current mine plan sustains the operation through to early 2018, although there is still significant potential to extend the mine life. We identified high-potential areas in the currently producing East Mine area and initiated a major exploration and drilling program during 2016, which will continue in 2017.
We expect 2017 production to be between 35,000 and 40,000 tonnes of zinc in concentrate. Production rates beyond 2017 are uncertain, although the potential exists to extend the mine life at similar rates for several more years.
Teck 2016 Annual Report | Every Day22

Trail Operations
Our Trail Operations in B.C. is one of the world’s largest fully integrated zinc and lead smelting and refining complexes. It also produces a variety of precious and specialty metals, chemicals and fertilizer products. Teck also has a two-thirds interest in the Waneta hydroelectric dam as well as 100% ownership of the related transmission system. The Waneta Dam provides low-cost, clean, renewable power to the metallurgical operations.
Trail Operations contributed $241 million to gross profits before depreciation and amortization in 2016, compared with $205 million in 2015 and $142 million in 2014. The increase was primarily due to higher zinc prices and record production in 2016.
Refined zinc production in 2016 was an annual record of 311,600 tonnes, compared with 307,000 tonnes the previous year, primarily due to higher plant availability. Refined lead production also set a new annual record of 99,200 tonnes, up from 83,500 tonnes in 2015. Silver production rose slightly to 24.2 million ounces in 2016 from 23.5 million ounces in 2015.
Our recycling process treated 45,500 tonnes of material during the year, and we plan to treat about 43,000 tonnes in 2017. Our focus remains on treating lead acid batteries and cathode ray tube glass, plus small quantities of zinc alkaline batteries and other post-consumer waste through our recycling program.
In November 2016, we announced that we would invest $174 million in the installation of a second new acid plant to improve efficiency and environmental performance at Trail Operations. Construction is expected to start in the first quarter of 2017, with the plant becoming operational in the summer of 2019.
In 2017, we expect Trail Operations to produce in the range of 300,000 to 305,000 tonnes of refined zinc, approximately 95,000 tonnes of refined lead and 23 to 25 million ounces of silver. Zinc and lead production from 2018 to 2020 is expected to remain at similar levels, while silver production is dependent on the amount of silver contained in the purchased concentrates.
Other Zinc Projects
In October 2016, we announced an agreement to increase our interest to 100% in the Teena/Reward zinc project by acquiring the outstanding 49% interest held by Rox Resources Limited. The transaction closed in the first quarter of 2017. Teena is located eight kilometres west of the McArthur River Mine in the Northern Territory of Australia.
MarketsZinc prices on the LME averaged US$0.95 per pound for the year, up US$0.08 per pound or 8.6% from the 2015 average.
Global mine production fell by 6.7% in 2016 to 12.3 million tonnes of contained zinc, while global smelter production fell by 0.2% to 13.7 million tonnes. As a result, we believe that the global concentrate market recorded a significant deficit in 2016, equivalent to 6.8% of global mine production. According to Wood Mackenzie, zinc spot treatment charges fell from US$200 per tonne in 2015 to US$40 per tonne by the end of 2016.
In China, estimated zinc mine production in 2016 remained relatively flat over 2015, with Wood Mackenzie estimating an increase of 1.7% to 4.2 million tonnes. Chinese smelter production is estimated to have increased 17% in 2016 to just over 6.9 million tonnes. China had been able to import 50% more concentrates in 2015 over 2016, building stockpiles for their new smelter capacity. In 2016, Chinese concentrate imports dropped 41%, forcing Chinese smelters to draw down on the 2015 stocks as the concentrate market tightened.
In 2016, global refined zinc metal demand increased 2.7% over 2015 levels to 14.3 million tonnes. During 2016, trade actions by the U.S. government against subsidized imports of coated steels from several countries, including China, Italy and South Korea, have resulted in a 13% reduction in imports of galvanized steel sheet into the U.S., helping to increase demand for refined zinc in our key North American markets.
LME stocks fell by 36,550 tonnes in 2016, a 7.9% decline from 2015 levels, finishing the year at 427,850 tonnes and then dropping below 400,000 tonnes in January 2017. We estimate that total reported global stocks — which include producer, consumer, merchant and terminal stocks — fell by approximately 87,700 tonnes in 2016 and, at year-end, were 1.1 million tonnes, representing an estimated 29 days of global demand, compared to the 25-year average of 42 days.
23Management’s Discussion and Analysis

2011 2012 2013 2014 2015 2016 1996 2000 2004 2008 2012 2016 2011 2012 2013 2014 2015 2016
Rest of the world (tonnes in millions) China (tonnes in millions)
LME inventory (tonnes in thousands)Zinc price (US$ per pound)
Inventories (tonnes in thousands) Days of global consumption25-year average days inventory
Zinc Price and LME InventorySource: LME
Global Demand for ZincSource: ILZSG, Wood Mackenzie
Global Zinc InventoriesSource: ILZSG, LME, SHFE
Tonnes DaysTonnes Tonnes0
200
400
600
800
1,000
1,200
1,400
0
4
8
12
16
20
0
275
550
825
1,100
1,375
1,650
1,925
2,200
$0.00
$0.20
$0.40
$0.60
$0.80
$1.00
$1.20
0
10
20
30
40
50
60
Wood Mackenzie estimates that refined zinc production will be limited to a 3% increase over 2016 levels, to 14.1 million tonnes, and that the refined metal market will remain in deficit with global consumption estimated to grow by 2% to 14.6 million tonnes. Global zinc mine production is expected to grow to 13.6 million tonnes, largely attributable to Indian mine production returning to normal levels in 2017, higher zinc production from Antamina, an 8% increase in Chinese mine production, and the potential restart of the Glencore zinc mines in the second half of 2017. Global smelter capacity will increase in 2017; however, refined production of zinc metal will again be limited by a lack of concentrates, despite the increases to mine production noted above.
Wood Mackenzie is also forecasting an increase in global zinc refined metal demand in 2017 of 2.1% to 14.6 million tonnes, keeping the refined market in deficit and further reducing global stockpiles of zinc metal.
OutlookWe expect zinc in concentrate production in 2017, including co-product zinc production from our copper business unit, to be in the range of 660,000 to 680,000 tonnes.
For the 2018 to 2020 period, we expect total zinc in concentrate production to be in the range of 580,000 to 605,000 tonnes excluding Pend Oreille, which has an uncertain production profile beyond 2017.
24 Teck 2016 Annual Report | Every Day

Located in the Athabasca oil sands region of northeastern Alberta, our energy assets include a 20% interest in the Fort Hills oil sands project, a 100% interest in the Frontier oil sands project and a 50% interest in various other oil sands leases in the exploration phase, including the Lease 421 Area.
Our proved and probable reserves totalled 573 million barrels from Fort Hills and our best estimate of unrisked contingent bitumen resources totalled 3.2 billion barrels from Frontier at the end of 2016. These valuable long-term assets are located in a politically stable jurisdiction and are expected to be mined using conventional technologies that build on our core skills in large-scale truck and shovel operations.
We recognize that there are concerns over the potential environmental effects of developing oil sands projects. We are researching methods to improve extraction and processing to enhance the sustainability of our projects. We are proud to be one of the founding members of Canada’s Oil Sands Innovation Alliance (COSIA) and are encouraged by the progress of the industry towards improving environmental performance, reducing water consumption, improving tailings management, and increasing land reclamation and revegetation.
The disclosure regarding our oil sands assets includes references to reserves and contingent bitumen resource estimates. Further information about these resource estimates, the related risks and uncertainties, and contingencies that prevent the classification of resources as reserves is set out on page 50 under the heading “Contingent Resource Disclosure”. For further information about these reserve estimates, see our most recent Annual Information Form, which is available on our website at www.teck.com, on the Canadian Securities Administrators website at www.sedar.com (SEDAR), and under cover of Form 40-F on the EDGAR section of the Securities Exchange Commission (SEC) website at www.sec.gov.
Fort Hills Oil Sands Project
The Fort Hills oil sands project is located in northern Alberta. We hold a 20% interest in the Fort Hills Energy Limited Partnership (Fort Hills Partnership), which owns Fort Hills, with 29.2% held by Total E&P Canada Ltd. (Total) and the remaining 50.8% held by Suncor Energy Inc. (Suncor). An affiliate of Suncor is the operator of the project.
Suncor has provided an update regarding its recently completed review of schedule, project costs and throughput. Suncor advises that the review, at this advanced stage of project development, provides a high degree of confidence on schedule and project costs to completion. A review of the plant throughput conducted in parallel has confirmed the steady state production target and expected ramp up. Suncor has announced an 8% increase in the nameplate capacity to 194,000 barrels per day (100% basis). We anticipate an average production rate of 186,000 barrels per day over the life of the project.
Energy
25Management’s Discussion and Analysis

Construction at the end of 2016 has surpassed 76% of completion, with two of the six major project areas (mining and infrastructure) turned over to operations. All major plant equipment and materials are on-site, and all major vessels and process modules have been installed. Shovels, trucks and equipment are mobilizing for operations. As at December 31, 2016, 58% of operations personnel have been hired. Our share of capital expenditures for 2016 was $987 million.
The project remains on track to produce first oil in late 2017. The majority of project scope areas are progressing in line with the original plan and budget, but effects of the 2016 Fort McMurray wild fire, as well as productivity challenges, have caused an increase in the capital cost estimate for the secondary extraction facility. The revised total project capital forecast is approximately 10% above the project sanction estimate, excluding foreign exchange impacts. Our share of project capital costs through to completion (including foreign exchange) is now expected to be $805 million, of which approximately $640 million will be spent in 2017. We recorded an impairment charge of $222 million in our fourth quarter results that was triggered by an increase in the expected development costs for the project.
Oil production from the first of three secondary extraction units is still expected by the end of 2017. The other two secondary extraction units are scheduled to be completed and commissioned in the first half of 2018, and it is expected that production will reach 90% nameplate capacity by the end of 2018. Suncor is also exploring the opportunity to reduce the ramp-up period.
Frontier Project
We hold a 100% interest in the Frontier project, which is located in northern Alberta. A federal-provincial hearing panel is reviewing the environmental impact assessment for the project and other information filed to date. The regulatory application review process for Frontier is continuing, with a federal-provincial hearing panel reviewing information filed to date. This process is expected to continue through 2017, making 2018 the earliest a federal decision statement is expected. Our expenditures on Frontier are limited to supporting this process. We are evaluating the future project schedule and development options as part of our ongoing capital review and prioritization process.
As of December 31, 2016, our best estimate of unrisked contingent bitumen resources for the Frontier project is approximately 3.2 billion barrels. The project has been designed for a total nominal production of approximately 260,000 barrels per day of bitumen. The Frontier contingent resources have been subcategorized as “development pending” and “economically viable”. There is uncertainty that it will be commercially viable to produce any portion of the resources.
Lease 421 Area
We hold a 50% interest in the Lease 421 Area, which is located east of the Fort Hills project in northern Alberta. To date, a total of 89 core holes have been completed in the Lease 421 Area.
Wintering Hills Wind Power Facility
Wintering Hills Wind Power Facility is located near Drumheller, Alberta. At December 31, 2016, we held a 49% interest in Wintering Hills with TransAlta Corporation, the current project operator, holding the remaining 51%. In January 2017, we announced that we had entered into an agreement to sell our interest in Wintering Hills for $59 million. TransAlta has also agreed to sell its interest pursuant to the same agreement. The transaction is expected to close in the first quarter of 2017. Following closing, we will retain 265,000 tonnes of CO2-equivalent offset credits earned during our ownership of the operation that will be used to reduce emissions from our Cardinal River Operations. During the sale process, we recorded a $19 million charge ($26 million pre-tax) to earnings in the third quarter of 2016 to write down our investment in Wintering Hills to the expected net realizable value.
26 Teck 2016 Annual Report | Every Day

Throughout 2016, we conducted exploration around the world through our eight regional offices. Expenditures of $51 million in 2016 were focused on copper, zinc and gold.
Exploration plays three critical roles at Teck: discovery of new orebodies through early stage exploration and acquisition; pursuit, evaluation and acquisition of development opportunities; and delivery of geoscience solutions and services to create value at our existing mines and development projects.
Our copper exploration is focused primarily on porphyry copper deposits and, during 2016, we continued to advance porphyry copper projects in Canada, Chile, Peru, the United States and Turkey. Significant exploration work was again focused in and around our existing operations and advanced projects in 2016. In 2017, we plan to drill several early stage copper projects, and we will continue to explore around our existing operations and advanced projects.
Zinc exploration remains focused on four areas: the Red Dog mine district in Alaska, western Canada, northeastern Australia, and Ireland. In Alaska, Australia and Canada, the targets are large, high-grade, sediment-hosted deposits similar to major world-class deposits such as Red Dog in Alaska and Century or McArthur River in Australia. We continued to drill on the Noatak project near our existing Red Dog mine, where we completed 11 kilometres of drilling on high-quality targets with continued good results. Exploration programs will continue in these regions in 2017.
We have ongoing exploration for, and partnerships in, gold opportunities. Our plan is to explore, find and advance gold resources through targeted exploration in select jurisdictions. Once an opportunity has been recognized, the strategy is to optimize that opportunity or asset through further definition drilling and engineering studies, then capture value through periodic divestitures. Our current exploration efforts and drill testing for gold are primarily focused in Turkey, Canada and Peru.
In addition to exploring for copper, zinc and gold, we continue to support our steelmaking coal operations by providing exploration and geoscience services to our existing operations and projects.
Exploration
27Management’s Discussion and Analysis
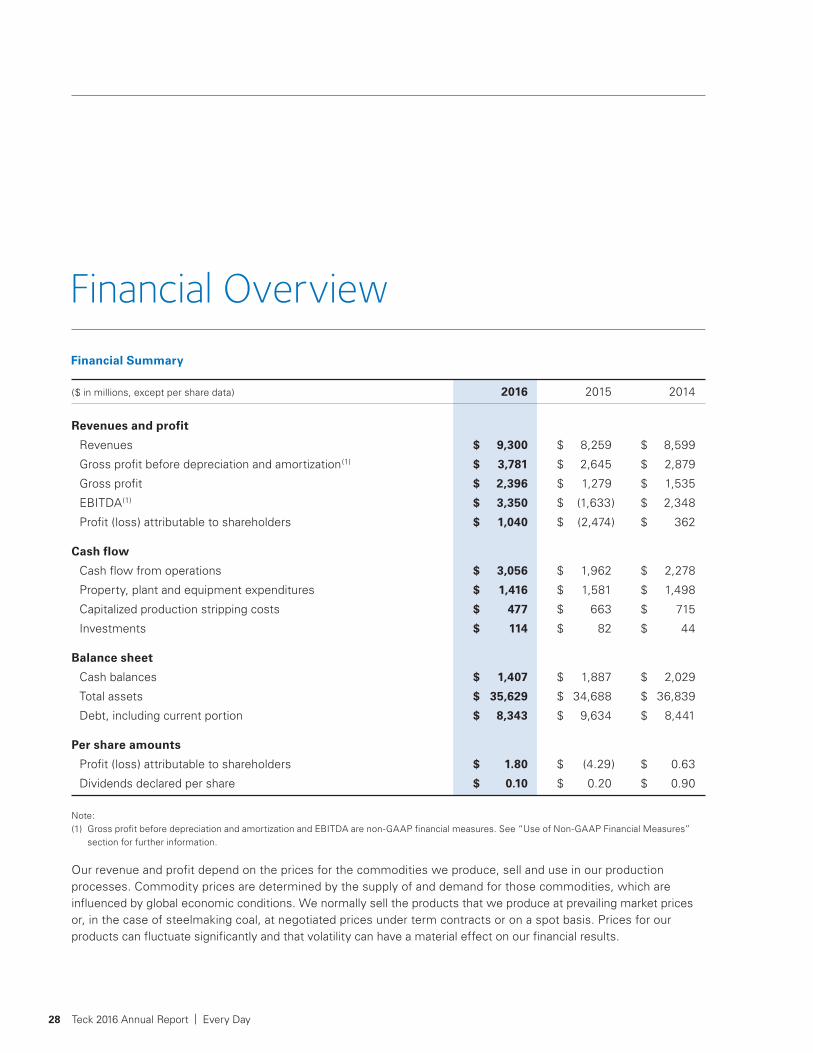
Financial Summary
($ in millions, except per share data) 2016 2015 2014
Revenues and profit
Revenues $ 9,300 $ 8,259 $ 8,599
Gross profit before depreciation and amortization(1) $ 3,781 $ 2,645 $ 2,879
Gross profit $ 2,396 $ 1,279 $ 1,535
EBITDA(1) $ 3,350 $ (1,633) $ 2,348
Profit (loss) attributable to shareholders $ 1,040 $ (2,474) $ 362
Cash flow
Cash flow from operations $ 3,056 $ 1,962 $ 2,278
Property, plant and equipment expenditures $ 1,416 $ 1,581 $ 1,498
Capitalized production stripping costs $ 477 $ 663 $ 715
Investments $ 114 $ 82 $ 44
Balance sheet
Cash balances $ 1,407 $ 1,887 $ 2,029
Total assets $ 35,629 $ 34,688 $ 36,839
Debt, including current portion $ 8,343 $ 9,634 $ 8,441
Per share amounts
Profit (loss) attributable to shareholders $ 1.80 $ (4.29) $ 0.63
Dividends declared per share $ 0.10 $ 0.20 $ 0.90
Note:(1) Gross profit before depreciation and amortization and EBITDA are non-GAAP financial measures. See “Use of Non-GAAP Financial Measures”
section for further information.
Our revenue and profit depend on the prices for the commodities we produce, sell and use in our production processes. Commodity prices are determined by the supply of and demand for those commodities, which are influenced by global economic conditions. We normally sell the products that we produce at prevailing market prices or, in the case of steelmaking coal, at negotiated prices under term contracts or on a spot basis. Prices for our products can fluctuate significantly and that volatility can have a material effect on our financial results.
Financial Overview
28 Teck 2016 Annual Report | Every Day

Foreign exchange rate movements can also have a significant effect on our results and cash flows, as a substantial portion of our operating costs are incurred in Canadian and other currencies, and most of our revenue and debt are denominated in U.S. dollars. We determine our financial results in local currency and report those results in Canadian dollars and, accordingly, our reported operating results and cash flows are affected by changes in the Canadian dollar exchange rate relative to the U.S. dollar, as well as the Peruvian sol and Chilean peso.
In 2016, our profit attributable to shareholders was $1.0 billion, or $1.80 per share. This compares with a loss of $2.5 billion or $4.29 per share in 2015, and a profit of $362 million or $0.63 per share in 2014. The changes are due mainly to varying commodity prices and sales volumes, partially offset by the effect of the strengthening U.S. dollar and our cost reduction initiatives. The results from 2015 also include $2.7 billion of after-tax impairment charges.
Our profit over the past three years has included items that we segregate for presentation to investors so that the ongoing profit of the company may be more clearly understood. These are described below and summarized in the table that follows.
In 2016, we recorded an impairment of our investment in the Fort Hills oil sands project as a result of increased development costs. We also recorded asset impairments relating to a project at our Trail Operations and our interest in the Wintering Hills Wind Power Facility. These non-cash charges totalled $294 million on a pre-tax basis and $217 million on an after-tax basis.
In 2015, we recorded asset and goodwill impairment charges on a number of our operating assets, including our investment in the Fort Hills project, the Carmen de Andacollo copper mine, the Pend Oreille zinc mine and a number of our steelmaking coal mines, as a result of lowered expectations for commodity prices in both the short and long term. These non-cash charges totalled $3.6 billion on a pre-tax basis and $2.7 billion on an after-tax basis. In 2014, the only unusual item was a $58 million tax charge as a result of a Chilean tax reform bill being signed into law.
The table below shows the effect of these items on our profit.
($ in millions, except per share data) 2016 2015 2014
Profit (loss) attributable to shareholders as reported $ 1,040 $ (2,474) $ 362
Add (deduct) the after-tax effect of:
Asset sales and provisions (53) (107) 13
Foreign exchange (gains) losses (45) 80 8
Debt repurchase gains (44) – –
Debt prepayment options gain (84) – –
Collective agreement charges 42 10 –
Impairments 217 2,691 7
Tax items and other items 30 (12) 62
Adjusted profit(1) $ 1,103 $ 188 $ 452
Adjusted earnings per share (1) $ 1.91 $ 0.33 $ 0.78
Note:(1) Adjusted profit and adjusted earnings per share are non-GAAP financial measures. See “Use of Non-GAAP Financial Measures” section for
further information.
Cash flow from operations in 2016 was $3.1 billion, compared with $2.0 billion in 2015 and $2.3 billion in 2014. The changes in cash flow from operations are mainly due to varying commodity prices and sales volumes, offset to some extent by changes in the currency exchange rates.
At December 31, 2016, our cash balance was $1.4 billion. Total debt was $8.3 billion and our net-debt to net-debt-plus-equity ratio was 28% at December 31, 2016, compared with 32% at December 31, 2015 and 25% at the end of 2014.
29Management’s Discussion and Analysis

2016 Revenue by Business Unit
22%Copper
34%Zinc
44%Steelmaking
Coal
21%Copper
26% Zinc
53%Steelmaking
Coal
2016 Revenue by Commodity
19% Zinc
7%Silver4%
Other6%Lead
44%Steelmaking
Coal
20%Copper
2016 Gross Profit by Business Unit(Before depreciation and amortization)
Gross ProfitOur gross profit is made up of our revenue less the operating, depreciation and amortization expenses at our producing operations. Income and expenses from our business activities that do not produce commodities for sale are included in our other operating income and expenses or in our non-operating income and expenses.
Our principal commodities are steelmaking coal, copper and zinc, which accounted for 44%, 20% and 19% of revenue respectively in 2016. Silver and lead are significant by-products of our zinc operations, accounting for 7% and 6%, respectively, of our 2016 revenue. We also produce a number of other by-products, including molybdenum, various specialty metals, and chemicals and fertilizers, which in total accounted for 4% of our revenue in 2016.
Our revenue is affected by sales volumes, which are determined by our production levels and by demand for the commodities we produce, commodity prices and currency exchange rates.
Our revenue was $9.3 billion in 2016, compared with $8.3 billion in 2015 and $8.6 billion in 2014. The increase in 2016 revenue was due mainly to higher steelmaking coal and zinc prices, higher sales volumes of steelmaking coal and zinc, and a stronger U.S. dollar. The reduction in 2015 over 2014 was due mainly to lower commodity prices and marginally lower sales volumes of steelmaking coal, partially offset by a stronger U.S. dollar.
Our cost of sales includes all of the expenses required to produce our products, such as labour, energy, operating supplies, concentrates purchased for our Trail Operations’ refining and smelting activities, royalties, and marketing and distribution costs required to sell and transport our products to various delivery points. Our cost of sales also includes depreciation and amortization expense. Due to the geographic locations of many of our operations, we are highly dependent on third parties for the provision of rail, port and other distribution services. In certain circumstances, we negotiate prices and other terms for the provision of these services where we may not have viable alternatives to using specific providers, or may not have access to regulated rate-setting mechanisms or appropriate remedies for service failures. Contractual disputes, demurrage charges, rail and port capacity issues, availability of vessels and railcars, weather problems and other factors can have a material effect on our ability to transport materials from our suppliers and to our customers in accordance with schedules and contractual commitments.
Our costs are dictated mainly by our production volumes, by the costs for labour, operating supplies and concentrate purchases, and by strip ratios, haul distances, ore grades, distribution costs, commodity prices, foreign exchange rates and costs related to non-routine maintenance projects. Production volumes mainly affect our variable operating and our distribution costs. In addition, production affects our sales volumes and, when combined with commodity prices, affects profitability and, ultimately, our royalty expenses.
30 Teck 2016 Annual Report | Every Day

Our cost of sales was $6.9 billion in 2016, compared with $7.0 billion in 2015 and $7.1 billion in 2014. Despite higher sales volumes, our cost of sales decreased in 2016 from 2015, primarily due to our cost reduction program, partly offset by the stronger U.S. dollar and its effect on costs at our foreign operations. Comparing 2015 with 2014, lower costs were due primarily to our cost reduction program and the staggered three-week shutdowns at our steelmaking coal operations, partly offset by the stronger U.S. dollar.
Other Expenses
($ in millions) 2016 2015 2014
General and administration $ 99 $ 108 $ 119
Exploration 51 76 60
Research and development 30 47 29
Asset impairments 294 3,631 12
Other operating expense (income) 197 335 267
Finance income (16) (5) (4)
Finance expense 354 316 304
Non-operating expense (income) (239) 89 21
Share of losses (income) of associates (2) 2 3
$ 768 $ 4,599 $ 811
Our general and administrative costs were reduced a further $9 million in 2016, following an $11 million reduction in 2015. The 17% decrease over the two years is the result of cost reduction measures at our head office.
We must continually replace our reserves as they are depleted in order to maintain production levels over the long term. We try to do this through our exploration and development programs and through acquisition of interests in new properties or in companies that own them. Exploration for minerals and oil is highly speculative and the projects involve many risks. The vast majority of exploration projects are unsuccessful and there are no assurances that current or future exploration programs will find deposits that are ultimately brought into production.
Our research and development expenditures are primarily focused on advancing our proprietary CESL hydrometallurgical technology, the development of internal and external growth opportunities, and the development and implementation of process and environmental technology improvements at operations.
During 2016, we recorded an impairment of our investment in the Fort Hills oil sands project as a result of increased development costs. We also recorded asset impairments relating to a project at our Trail Operations and our interest in the Wintering Hills Wind Power Facility. These charges totalled $294 million on a pre-tax basis and $217 million on an after-tax basis and primarily related to Fort Hills. The economic model used in determining the amount of impairment charges to record for Fort Hills used the current price in the initial year and transitioned to a longer-term price in years three to five. The long-term assumption used in the Fort Hills model for Western Canadian Select (WCS) oil price was US$57 per barrel. A 5.5% real, 7.6% nominal, post-tax discount rate was used to discount the Fort Hills cash flow projections. The discount rate is based on the weighted average cost of capital for an oil sands peer group.
During 2015, we recorded asset and goodwill impairment charges on a number of our operating assets, including our investment in the Fort Hills project, the Carmen de Andacollo copper mine, the Pend Oreille zinc mine and a number of our steelmaking coal mines. These charges totalled $3.6 billion on a pre-tax basis and $2.7 billion on an after-tax basis. The write-downs were triggered primarily by lowered expectations for commodity prices in both the short- and long-term. The key inputs used in determining the recoverable amounts of these assets are outlined on pages 39 to 42 in this Management’s Discussion and Analysis.
31Management’s Discussion and Analysis

The impairment charges were as follows:
($ in millions) 2016 2015 2014
Steelmaking coal operations and goodwill $ – $ 2,032 $ –
Copper — Carmen de Andacollo and goodwill – 506 –
Zinc — Pend Oreille – 31 –
Energy — Fort Hills 222 1,062 –
Other 72 – 12
$ 294 $ 3,631 $ 12
Other operating income and expenses include items we consider to be related to the operation of our business, such as final pricing adjustments (which are further described in the next paragraph), share-based compensation, gains or losses on commodity derivatives, gains or losses on the sale of operating or exploration assets, and provisions for various costs at our closed properties. Significant items in 2016 included $171 million expense for share-based compensation, $153 million of positive pricing adjustments, $106 million change in our decommissioning and reclamation provisions, $48 million charge for take-or-pay contracts and $38 million of environmental costs. Significant items in 2015 included $280 million of negative pricing adjustments, $49 million of environmental costs and $13 million for share-based compensation. Significant items in 2014 included $130 million of negative pricing adjustments, $52 million of environmental costs and $12 million for share-based compensation.
Sales of metals in concentrate or copper cathodes are recognized in revenue on a provisional pricing basis when the rights, obligations, risks and benefits of ownership pass to the customer, which usually occurs upon shipment. However, final pricing is typically not determined until a subsequent date, often in the following quarter. Revenue in a quarter is based on prices at the date of sale. These pricing adjustments result in gains in a rising price environment and losses in a declining price environment, and are recorded as other operating income or expense. The extent of the pricing adjustments also takes into account the actual price participation terms as provided in certain concentrate sales agreements. It should be noted that these effects arise on the sale of concentrates, as well as on the purchase of concentrates at our Trail Operations.
The following table outlines our outstanding receivable positions, which were provisionally valued at December 31, 2016 and 2015, respectively.
Outstanding at Outstanding at December 31, 2016 December 31, 2015
(payable pounds in millions) Pounds US$/lb. Pounds US$/lb.
Copper 114 2.50 257 2.13
Zinc 231 1.17 162 0.73
Our finance expense includes the interest expense on our debt, financing fees and amortization, and the interest components of our pension obligations and accretion on our decommissioning and restoration provisions, less any interest that we capitalize against the cost of our development projects. Debt interest expense increased in 2016 due to the effect of the stronger U.S. dollar, as all of our debt and related interest expense is U.S. dollar denominated. In addition, fees for our letters of credit increased in 2016. These items were partially offset by an increase of our capitalized interest, which totalled $266 million in 2016, compared with $222 million in 2015.
Non-operating income (expense) includes items that arise from financial and other matters and includes such items as foreign exchange gains or losses, debt refinancing costs, gains or losses on the revaluation of debt prepayment options, and realized gains or losses on marketable securities. In 2016, other non-operating expenses included $113 million of gains on debt prepayment options, $46 million of foreign exchange gains, $49 million of gains on debt repurchases and $34 million of gains on sale of investments. In 2015, other non-operating expenses included $21 million for provisions on marketable securities and $76 million of foreign exchange losses. In 2014, other non-operating expenses included $8 million for provisions on marketable securities and $9 million of foreign exchange losses.
32 Teck 2016 Annual Report | Every Day

Provision for income and resource taxes was $587 million, or 36% of pre-tax profits. This rate is higher than the Canadian statutory rate of 26% primarily as a result of resource taxes, higher rates in foreign jurisdictions, inclusive of the newly enacted Peruvian corporate tax increases, and the tax impact of impairments. These were partially reduced by the lower effective tax rate on the gain on debt purchases. Due to available tax pools, we are currently shielded from cash income taxes, but not resource taxes, in Canada. We remain subject to cash taxes in foreign jurisdictions.
Profit attributable to non-controlling interests relates to the ownership interests that are held by third parties in our Quebrada Blanca, Carmen de Andacollo and Elkview operations.
Financial Position and LiquidityOur financial position and liquidity have improved from our strong position at the beginning of the year. At December 31, 2016, we had $1.4 billion of cash and US$3.0 billion of unused lines of credit, providing us with $5.4 billion of liquidity.
Our outstanding debt was $8.3 billion at December 31, 2016, compared with $9.6 billion at the end of 2015 and $8.4 billion at the end of 2014. The decrease is due primarily to the US$759 million of notes that we repurchased and retired in September and October of 2016. A further US$34 million was repaid in January 2017. In total, in just over 12 months, we have retired approximately US$1.1 billion of our term notes to take the principal outstanding to US$6.1 billion.
Our debt positions and credit ratios are summarized in the following table:
December 31, December 31, December 31, 2016 2015 2014
Term notes face value $ 6,141 $ 6,900 $ 7,200
Unamortized fees and discounts (50) (61) (68)
Other 122 122 144
Total debt (US$ in millions) $ 6,213 $ 6,961 $ 7,276
Canadian $ equivalent(1) $ 8,343 $ 9,634 $ 8,441
Less cash balances (1,407) (1,887) (2,029)
Net debt $ 6,936 $ 7,747 $ 6,412
Debt to debt-plus-equity ratio(2)(3) 32% 37% 31%
Net-debt to net-debt-plus-equity ratio(2) 28% 32% 25%
Average interest rate 5.7% 4.8% 4.8%
Notes:(1) Translated at period end exchange rates.(2) Non-GAAP financial measure. See “Use of Non-GAAP Financial Measures” section for further information.(3) Our revolving credit facility requires us to maintain a debt to debt-plus-equity ratio not greater than 50%.
At December 31, 2016, the weighted average maturity of our consolidated indebtedness is approximately 13 years and the weighted average coupon rate is approximately 5.7%.
Our primary sources of liquidity and capital resources are our cash and temporary investments, cash flow provided from operations, and funds available under our committed and uncommitted bank credit facilities, of which approximately US$3.2 billion is currently available. Further information about our liquidity and associated risks is outlined in Notes 16 and 26 to our 2016 annual consolidated financial statements.
Our cash position decreased from $1.9 billion at the end of 2015 to $1.4 billion at December 31, 2016. Significant outflows included $987 million for our share of the Fort Hills project and amounts associated with the purchase of US$759 million of notes during 2016.
33Management’s Discussion and Analysis

We maintain various committed and uncommitted credit facilities for liquidity and for the issuance of letters of credit. Our US$3.0 billion revolving credit facility matures in July 2020 and has a letter of credit sub-limit of US$1.0 billion. There were no drawings on this facility in 2016 and it remains fully available as at February 23, 2017.
We also have a US$1.2 billion facility, of which US$1.14 billion matures in June 2019 and US$60 million matures in June 2017. As at December 31, 2016, there are US$981 million of letters of credit issued on this facility.
Borrowing under our primary committed credit facilities is subject to our compliance with the covenants in the agreement and our ability to make certain representations and warranties at the time of the borrowing request.
In addition to our two primary revolving committed credit facilities, we also maintain surety bond capacity and uncommitted bilateral credit facilities with various banks and with Export Development Canada for the issuance of letters of credit, primarily to support our future reclamation obligations. At December 31, 2016, these bilateral credit facilities totalled $1.4 billion and $1.1 billion of letters of credit were issued thereunder, and our surety bond capacity was $250 million, with $214 million outstanding.
The cost of funds under certain of our credit facilities depends on our credit ratings. Our current credit ratings from Moody’s, S&P, Fitch and DBRS are Ba3, BB, BB (high) and B+, respectively. Moody’s rating has a positive outlook, S&P’s outlook is stable, and Fitch and DBRS have negative outlooks.
Under the terms of the silver streaming agreement relating to Antamina, if there is an event of default under the agreement or Teck insolvency, Teck Base Metals Ltd., our subsidiary that holds our interest in Antamina, is restricted from paying dividends or making other distributions to Teck to the extent that there are unpaid amounts under the agreement.
On February 21, 2017, we commenced cash tender offers to purchase up to US$650 million aggregate principal amount of the following series of notes: 3.000% Notes due 2019; 8.000% Notes due 2021; 4.500% Notes due 2021; 4.750% Notes due 2022; and 8.500% Notes due 2024. In conjunction with the tender offers, we are soliciting consents from holders of certain of the notes to amend the indentures governing those notes to shorten the minimum notice period for optional redemption. The tender offers and consent solicitations are scheduled to expire on March 20, 2017, and may expire earlier in certain circumstances. We have reserved the right to amend, extend, terminate and otherwise modify the tender offers and consent solicitations.
Operating Cash Flow
Cash flow from operations was $3.1 billion in 2016, compared with $2.0 billion in 2015 and $2.3 billion in 2014. The increase in 2016 compared to 2015 was mainly due to varying commodity prices and sales volumes, offset to some extent by changes in currency exchange rates. The decrease in 2015 compared to 2014 was due mainly to lower gross profits at our steelmaking coal and copper operations from lower commodity prices, particularly steelmaking coal.
Investing Activities
Capital expenditures were $1.9 billion in 2016, as summarized in the table below:
Major New Mine Capitalized ($ in millions) Sustaining Enhancement Development Subtotal Stripping Total
Steelmaking coal $ 38 $ 33 $ – $ 71 $ 277 $ 348
Copper 106 8 69 183 156 339
Zinc 142 – 4 146 44 190
Energy 5 – 1,005 1,010 – 1,010
Corporate 6 – – 6 – 6
$ 297 $ 41 $ 1,078 $ 1,416 $ 477 $ 1,893
The largest components of sustaining capital included $85 million at Trail Operations, $61 million for our share of spending at Antamina, $46 million at Red Dog Operations and $38 million at our steelmaking coal operations.
34 Teck 2016 Annual Report | Every Day

Major enhancement expenditures included $33 million at our steelmaking coal operations to increase production capacity.
New mine development included $68 million for the Quebrada Blanca Phase 2 project, $987 million for our share of spending on the Fort Hills oil sands project and $18 million on the Frontier oil sands project.
Investments in 2016 and 2015 were $114 million and $82 million, respectively. Included in 2016 was our $33 million purchase of the remaining 2.5% minority interest stake in Highland Valley Copper Operations.
Cash proceeds from the sale of assets and investments were $170 million in 2016, $1.2 billion in 2015 and $34 million in 2014. Significant items in 2016 were proceeds of $122 million from the sale of marketable securities and various royalty interests.
Financing Activities
In June 2016, we made certain amendments to the terms of our US$1.2 billion credit facility, including a maturity extension from June 2017 to June 2019 for US$1.0 billion of commitments, with a further extension to 2019 for US$140 million obtained since then. Both of our committed credit facilities received guarantees from certain subsidiaries. These amendments are described in Note 16 to our annual consolidated financial statements. There were no amendments to the terms of our US$3.0 billion credit facility, which matures in July 2020.
Immediately following the amendments to the US$1.2 billion credit facility, we issued US$650 million of senior unsecured notes due June 2021 with a coupon of 8.00% and US$600 million of senior unsecured notes due June 2024 with a coupon of 8.50%. These notes are guaranteed on a senior unsecured basis by various wholly owned subsidiaries of Teck and are described in Note 16 to our annual consolidated financial statements.
The net proceeds from these issuances and available cash were used to finance the purchase of US$1.25 billion aggregate principal amount of our outstanding notes pursuant to cash tender offers. The purchased notes comprise US$266 million of 3.15% notes due 2017, US$284 million of 3.85% notes due 2017, US$478 million of 2.50% notes due 2018, and US$222 million of 3.00% notes due 2019. The tender offer is described in Note 16 in our annual consolidated financial statements.
In September and early October 2016, we purchased US$759 million aggregate principal amount of our outstanding notes through private and open market purchases at a total cost of US$693 million, which was funded from cash on hand. The principal amount of notes purchased was US$80 million of 3.75% notes due 2023, US$91 million of 6.125% notes due 2035, US$159 million of 6.00% notes due 2040, US$205 million of 6.25% notes due 2041, US$101 million of 5.20% notes due 2042, and US$123 million of 5.40% notes due 2043. The purchases are discussed further in Note 16 to our annual consolidated financial statements.
We repurchased 200,000 Class B subordinate voting shares for cancellation pursuant to normal course issuer bids at a cost of $5 million in 2014. We have not repurchased any shares since 2014 and our last normal course issuer bid expired on July 1, 2015.
Quarterly Earnings and Cash Flow
($ in millions except per share data) 2016 2015
Q4 Q3 Q2 Q1 Q4 Q3 Q2 Q1
Revenue $ 3,557 $ 2,305 $ 1,740 $ 1,698 $ 2,135 $ 2,101 $ 1,999 $ 2,024
Gross profit 1,577 452 212 155 281 339 311 348
EBITDA 1,561 804 468 517 (269) (2,506) 596 546
Profit (loss) attributable to shareholders 697 234 15 94 (459) (2,146) 63 68
Basic earnings (loss) per share $ 1.21 $ 0.41 $ 0.03 $ 0.16 $ (0.80) $ (3.73) $ 0.11 $ 0.12
Diluted earnings (loss) per share $ 1.19 $ 0.40 $ 0.03 $ 0.16 $ (0.80) $ (3.73) $ 0.11 $ 0.12
Cash flow from operations 1,490 854 339 373 693 560 335 374
35Management’s Discussion and Analysis

Gross profit from our steelmaking coal business unit in the fourth quarter was $1.2 billion compared with $29 million a year ago. Gross profit before depreciation and amortization increased by $1.1 billion in the fourth quarter compared with the same period in 2015 due to significantly higher realized steelmaking coal prices.
Fourth quarter production of 7.3 million tonnes was 14% higher than the same period a year ago and set a second consecutive quarterly production record. Annual production of 27.6 million tonnes also represents an all-time production record. This performance in the quarter and year was the result of record fourth quarter production from four of our six operations and record annual production from Elkview, Greenhills and Line Creek. We also settled five-year collective agreements at Fording River and Elkview during the quarter.
Sales volumes of 6.9 million tonnes in the fourth quarter were 6% higher than the same period in 2015 and represented the third-highest quarterly sales in our history and best ever fourth quarter. Annual sales of 27.0 million tonnes also represents an all-time record high. This strong performance resulted from a combination of tightness in supply and robust demand in all market areas.
Gross profit in the fourth quarter from our copper business unit was $52 million compared with $76 million a year ago. Gross profit before depreciation and amortization from our copper business unit increased by $23 million in the fourth quarter compared with the same period in 2015. This was primarily due to successful cost reduction efforts and higher realized copper and by-product prices, which more than offset significantly lower sales volumes. In addition, due to the improving copper price environment and reduced unit costs, we reversed $23 million of previously recorded inventory write-downs in the quarter compared with $20 million of write-downs a year ago. These inventory adjustments were primarily related to Quebrada Blanca Operations.
Fourth quarter copper production decreased by 24% from a year ago primarily due to reduced production at Highland Valley Copper as a result of lower ore grades, as anticipated in the mine plan. Significant cost reduction efforts at our operations substantially reduced the effect of lower copper production on our cash unit costs, after by-product margins, which only increased by 6% to US$1.45 per pound compared with the same period in 2015.
Gross profit from our zinc business unit in the fourth quarter was $348 million compared with $176 million a year ago. Gross profit before depreciation and amortization from our zinc business unit increased by $181 million compared to the fourth quarter of 2015 primarily due to significantly higher zinc prices.
Zinc in concentrate production in the fourth quarter was 7% higher than the fourth quarter of 2015. A year-end inventory correction recorded in the quarter resulted in reported production being 8% lower than a year ago. Trail Operations set a new annual refined zinc production record, as refined zinc production continued to be strong in the fourth quarter and rose 2% compared to the same quarter in 2015 due to better plant availability and operational improvements.
During the fourth quarter of 2016, we recorded asset impairment charges primarily relating to our investment in the Fort Hills oil sands project. These charges totalled approximately $268 million on a pre-tax basis (after-tax $198 million), of which $222 million related to Fort Hills, but also include the write-off of costs relating to the halted fuming furnace project at Trail Operations.
Our profit attributable to shareholders was $697 million, or $1.21 per share, in the fourth quarter compared with a loss of $459 million, or $0.80 per share, in the same period a year ago, which included asset impairment charges on our investment in Fort Hills, and on our Coal Mountain and Carmen de Andacollo operations. These charges in 2015 totalled $736 million on a pre-tax basis and $536 million on an after-tax basis. The write-downs were triggered by lower market expectations for some future commodity prices and capital market conditions. In addition, profit in the fourth quarter of 2015 was lower due to substantially lower U.S. dollar prices for our primary products, partly offset by reduced operating costs and the positive effect of a stronger U.S. dollar. Declining metal prices resulted in after-tax negative pricing adjustments of approximately $42 million in the fourth quarter of 2015. We also had after-tax profits of $91 million derived from royalty sales and a gain on the formation of NuevaUnión (formerly Project Corridor).
Cash flow from operations was $1.5 billion in the fourth quarter compared with $693 million a year ago. This performance was a result of significantly higher realized steelmaking coal prices in the quarter and, to a lesser extent, higher zinc prices.
36 Teck 2016 Annual Report | Every Day

Outlook Prices for our key commodities have recently improved and are contributing additional revenue and cash flows. Tight steelmaking coal supply and increased demand from steel mills during the fourth quarter of 2016 drove prices up rapidly. Steelmaking coal inventories are now being reduced, driving the large price correction, which started in December 2016. With increased supply from existing producers and a number of mine restarts, it is unclear how long the price correction will last. In addition, contributing to the volatility in steelmaking coal prices were changes in the Chinese government’s working day policy for coal mines, future changes in that policy, or other Chinese government action, may have a significant positive or negative effect on steelmaking coal prices. Commodity markets have historically been volatile and prices can change rapidly, which we have seen recently with the sharp rise and fall in steelmaking coal prices since the third quarter of 2016, and customers can alter shipment plans. This volatility can have a substantial effect on our business. We are also significantly affected by foreign exchange rates. Over the past year, the U.S. dollar average has strengthened by approximately 4% against the Canadian dollar. This has had a positive effect on the profitability of our Canadian operations and translation of profits from our foreign operations. It will, to a lesser extent, put upward pressure on the portion of our operating costs and capital spending that is denominated in U.S. dollars.
Our labour agreement at Highland Valley Copper expired at the end of the third quarter, and negotiations are continuing. Our labour agreements at Trail Operations and at Cardinal River expire in May 2017 and June 2017, respectively. In February 2017, we extended the life of two of the three labour agreements at Quebrada Blanca into the first quarter of 2019, leaving only one labour agreement expiring in 2017 at the end of November.
Commodity Prices and 2017 Production
Commodity prices are a key driver of our profit and cash flows. On the supply side, the depleting nature of ore reserves, difficulties in finding new orebodies, the permitting processes, the availability of skilled resources to develop projects, as well as infrastructure constraints, political risk and significant cost inflation may continue to have a moderating effect on the growth in future production for the industry as a whole. We believe that, over the longer term, the industrialization of emerging market economies will continue to be a major positive factor in the future demand for commodities. Therefore, we believe that the long-term price environment for the products that we produce and sell remains favourable.
The sensitivity of our annual profit attributable to shareholders and EBITDA to changes in the Canadian/U.S. dollar exchange rate and commodity prices, before pricing adjustments, based on our current balance sheet, our expected 2017 mid-range production estimates, current commodity prices and a Canadian/U.S. dollar exchange rate of $1.30, are as follows:
2017 Mid-Range Estimated Effect Estimated Production of Change Effect on Estimates(1) Change on Profit(2) EBITDA(2)
US$ exchange CAD$0.01 $ 42 million $ 68 million
Steelmaking coal (000’s tonnes) 27,500 US$1/tonne $ 21 million $ 32 million
Copper (tonnes) 280,000 US$0.01/lb. $ 5 million $ 7 million
Zinc (tonnes)(3) 972,000 US$0.01/lb. $ 9 million $ 14 million
Notes:(1) All production estimates are subject to change based on market and operating conditions.(2) The effect on our profit attributable to shareholders and on EBITDA of commodity price and exchange rate movements will vary from quarter to quarter depending
on sales volumes. Our estimate of the sensitivity of profit and EBITDA to changes in the U.S. dollar exchange rate is sensitive to commodity price assumptions.(3) Zinc includes 300,000 tonnes of refined zinc and 670,000 tonnes of zinc contained in concentrate.
The increase in our estimated foreign exchange sensitivity from previous estimates is primarily due to the effect of higher commodity prices, which are all denominated in U.S. dollars.
Our steelmaking coal production in 2017 is expected to be in the range of 27 to 28 million tonnes compared with 27.6 million tonnes produced in 2016. Our actual production will depend primarily on customer demand for deliveries of steelmaking coal. Depending on market conditions and the sales outlook, we may adjust our production plans.
37Management’s Discussion and Analysis

Our copper production for 2017 is expected to decrease and be in the range of 275,000 to 290,000 tonnes compared with 324,200 tonnes produced in 2016. Copper production at Highland Valley Copper is expected to decline as a result of mining lower ore grades. Quebrada Blanca copper cathode production is expected to decline, as the agglomeration circuit will be halted, with all remaining supergene ore mined sent to the dump leach circuit. Our share of production from Antamina is anticipated to decline by approximately 7,000 tonnes due to a decrease in copper-only ore processed in 2017, while copper-zinc ore increases.
Our zinc in concentrate production in 2017 is expected to be in the range of 660,000 to 680,000 tonnes, compared with 661,600 tonnes produced in 2016. Red Dog’s production is expected to decrease by approximately 28,000 tonnes primarily due to lower ore grades. Our share of Antamina’s zinc production is expected to increase by 33,000 tonnes as a result of processing additional copper-zinc ores. Refined zinc production in 2017 from our Trail Operations is expected to be in the range of 300,000 to 305,000 tonnes, compared with a record 311,600 tonnes produced in 2016.
Capital Expenditures
Our forecast approved capital expenditures for 2017, before capitalized stripping costs, are approximately $1.6 billion and are summarized in the table below. We expect to fund our 2017 capital expenditures from cash on hand and cash flow from operations.
Major New Mine Capitalized ($ in millions) Sustaining Enhancement Development Subtotal Stripping Total
Steelmaking coal $ 140 $ 120 $ – $ 260 $ 430 $ 690
Copper 130 20 200 350 140 490
Zinc 210 15 20 245 50 295
Energy 50 – 675 725 – 725
Corporate – – – – – –
$ 530 $ 155 $ 895 $ 1,580 $ 620 $ 2,200
New mine development includes $200 million for Quebrada Blanca Phase 2, $640 million for Fort Hills and $26 million for permitting activities on the Frontier oil sands project. In 2017, the planned sustaining capital expenditures for Fort Hills are spread across a number of areas in the project. The costs are associated with activities that will benefit the future development of the operation and technology initiatives, for example: tailings management technology and autonomous hauling. The amount and timing of actual capital expenditures is also dependent upon being able to secure permits, equipment, supplies, materials and labour on a timely basis and at expected costs to enable the projects to be completed as currently anticipated. We may change capital spending plans in 2017, depending on commodity markets, our financial position, results of feasibility studies and other factors.
Foreign Exchange and Debt Revaluation
The sales of our products are denominated in U.S. dollars, while a significant portion of our expenses are incurred in local currencies, particularly the Canadian dollar and the Chilean peso. Foreign exchange fluctuations can have a significant effect on our operating margins, unless such fluctuations are offset by related changes to commodity prices.
Our U.S. dollar denominated debt is subject to revaluation based on changes in the Canadian/U.S. dollar exchange rate. As at December 31, 2016, $5.4 billion of our U.S. dollar denominated debt is designated as a hedge against our foreign operations that have a U.S. dollar functional currency. As a result, any foreign exchange gains or losses arising on that amount of our U.S. dollar debt are recorded in other comprehensive income, with the remainder being charged to profit.
38 Teck 2016 Annual Report | Every Day
Other Information Carbon Taxes
The Province of B.C. imposes a carbon tax on virtually all fossil fuels used in B.C. at a tax rate of $30 per tonne of CO2-emission equivalent. For 2016, our seven B.C.-based operations incurred $48 million in provincial carbon tax, primarily from our use of coal, diesel fuel and natural gas.
Following the adoption of the Paris Agreement in 2015, both the Provinces of B.C. and Alberta completed reviews of their climate change plans, including a re-examination of their primary carbon price policies, the Carbon Tax (B.C.) and the Specified Gas Emitters Regulation (Alberta). In 2016, the Province of B.C. announced a freeze in the carbon tax at the current rate until other jurisdictions in Canada raise their carbon prices to comparable levels. Additionally, the Province of Alberta announced an economy-wide carbon levy (excluding large industrial facilities) along with a 100 million-tonne GHG emissions cap on oil sands operations and a framework to address emission intensive, trade exposed industries.
Also in 2016, the Government of Canada announced a national pan-Canadian framework that includes a national floor price on carbon. Canadian provinces will be given until 2018 to implement a carbon pricing policy, starting with a minimum price of $10 per tonne in 2018, increasing $10 per year to $50 per tonne by 2022.
We will continue to assess the potential implications of the updated policies on our operations and projects.
Financial Instruments and Derivatives
We hold a number of financial instruments, derivatives and contracts containing embedded derivatives, which are recorded on our balance sheet at fair value with gains and losses in each period included in other comprehensive income and profit for the period as appropriate. The most significant of these instruments are marketable securities, commodity swap contracts, metal-related forward contracts, settlements receivable and payable, embedded debt prepayment options, and gold stream and silver stream embedded derivatives. Some of our gains and losses on metal-related financial instruments are affected by smelter price participation and are taken into account in determining royalties and other expenses. All are subject to varying rates of taxation, depending on their nature and jurisdiction. Further information about our financial instruments, derivatives and contracts containing embedded derivatives and associated risks is outlined in Note 26 to our 2016 annual consolidated financial statements.
Critical Accounting Estimates and Judgments In preparing consolidated financial statements, management makes estimates and judgments that affect the reported amounts of assets, liabilities, revenues and expenses across all reportable segments. Management makes estimates and judgments that are believed to be reasonable under the circumstances. Our estimates and judgments are based on historical experience and other factors we consider to be reasonable, including expectations of future events. Critical accounting estimates and judgments are those that could affect the consolidated financial statements materially, are highly uncertain and where changes are reasonably likely to occur from period to period. The judgments and other sources of estimation uncertainty that have a risk of resulting in a material adjustment to the carrying amounts of assets and liabilities within the next year are outlined below.
Impairment Testing
Judgment is required in assessing whether certain factors would be considered an indicator of impairment or impairment reversal. We consider both internal and external information to determine whether there is an indicator of impairment or impairment reversal present and, accordingly, whether impairment testing is required. When impairment testing is required, discounted cash flow models are used to determine the recoverable amount of respective assets. These models are prepared internally with assistance from third-party advisors when required. When market transactions for comparable assets are available, these are considered in determining the recoverable amount of assets. Significant assumptions used in preparing discounted cash flow models include commodity prices, reserves and resources, mine plans, operating costs, capital expenditures, discount rates, foreign exchange rates and inflation rates. These inputs are based on management’s best estimates of what an independent market participant would consider appropriate.
39Management’s Discussion and Analysis

Changes in these inputs may alter the results of impairment testing, the amount of the impairment charges or reversals recorded in the income statement and the resulting carrying values of assets.
We allocate goodwill arising from business combinations to the cash-generating unit (CGU) or group of CGUs acquired that is expected to receive the benefits from the business combination. When performing annual goodwill impairment tests, we are required to determine the recoverable amount of each CGU or group of CGUs to which goodwill has been allocated. The recoverable amount of each CGU or group of CGUs is determined as the higher of its fair value less costs of disposal (FVLCD) and its value in use.
Year Ended December 31, 2016
In 2016, we performed our annual goodwill impairment testing at October 31 for our steelmaking coal operations and Quebrada Blanca, as these are the CGUs with goodwill balances. We did not identify any impairment losses for these CGUs in 2016 based on their FVLCD, which was calculated using a discounted cash flow methodology taking into account assumptions likely to be made by market participants.
Our annual goodwill impairment test resulted in the total recoverable amount of our steelmaking coal operations exceeding their carrying value by approximately $4.9 billion. The recoverable amount is most sensitive to the long-term steelmaking coal price assumption. The recoverable amount is based on a long-term steelmaking coal price of US$130 per tonne. An 11% decrease in the long-term price assumption would result in the recoverable amount of our steelmaking coal operations equalling their carrying value.
The recoverable amount of Quebrada Blanca exceeded the carrying amount at the date of our annual goodwill impairment test, and significant changes to key inputs would be required to result in the recoverable amount being equal to the carrying value.
During the year ended December 31, 2016, we recorded asset impairments of $294 million, of which $222 million related to the Fort Hills oil sands project, $46 million related to a project at our Trail Operations that will not be completed, and $26 million related to the Wintering Hills Wind Power Facility.
As a result of the changes in reported reserves and resources at Carmen de Andacollo and increased development costs associated with the Fort Hills oil sands project, we performed a detailed review of the recoverable amounts of these CGUs on a FVLCD basis using a discounted cash flow methodology and taking into account assumptions likely to be made by market participants as at December 31, 2016.
We have determined that the estimated recoverable amount of Carmen de Andacollo exceeded its carrying value as at December 31, 2016 and accordingly, no impairment charge was recorded.
We have estimated a post-tax recoverable amount for Fort Hills of $2.52 billion, which was lower than the carrying value as at December 31, 2016. Accordingly, we have recorded a pre-tax impairment of $222 million (after-tax $164 million) of the Fort Hills project.
The key inputs used to estimate the FVLCD of Carmen de Andacollo and Fort Hills as at December 31, 2016, were determined as follows:
Commodity Prices
Commodity price assumptions are based on a number of factors, including forward curves in the near term, and are benchmarked with external sources of information, including information published by our peers and, where possible, market transactions, to ensure they are within the range of values used by market participants.
Our key commodity price assumptions are based on a current price in the initial year and gradually escalated to an assumed real long-term price in 2021. For copper and WCS oil prices, we started with a 2016 current price in the initial year and gradually escalated that over the following three years, reaching real long-term prices in 2021 of US$3.00 per pound for copper and US$57 per barrel for oil.
40 Teck 2016 Annual Report | Every Day

Reserves and Resources
Future mineral production is included in projected cash flows based on mineral reserve and resource estimates and exploration and evaluation work, undertaken by appropriately qualified persons.
Operating Costs and Capital Expenditures
Operating costs and capital expenditures are based on life of mine plans and internal management forecasts. Cost estimates incorporate management experience and expertise, current operating costs, the nature and location of each operation, and the risks associated with each operation. Future capital expenditures are based on management’s best estimate of expected future capital requirements, which are generally for the extraction and processing of existing reserves and resources. All committed and anticipated capital expenditures based on future cost estimates have been included in the projected cash flows. Operating cost and capital expenditure assumptions are continuously subjected to ongoing optimization and review by management.
Discount Rates
A 6.0% real, 8.1% nominal, post-tax discount rate was used to discount cash flow projections for Carmen de Andacollo as at December 31, 2016, based on a mining weighted average cost of capital.
A 5.5% real, 7.6% nominal, post-tax discount rate was used to discount cash flow projections for the Fort Hills project, based on an oil sands weighted average cost of capital.
Foreign Exchange Rates
Foreign exchange rates are benchmarked with external sources of information based on a range used by market participants. The long-term Canadian-U.S. dollar foreign exchange rate assumption used as at December 31, 2016 was CAD$1.25 to US$1.00.
Inflation Rates
Inflation rates are based on average historical inflation for the location of each operation and long-term government bond yields. The inflation rate for all FVLCD calculations as at December 31, 2016 was 2%.
Sensitivity Analysis
We noted impairment indicators at Carmen de Andacollo and Fort Hills and the recoverable amounts of the associated CGUs have been estimated. The recoverable amount of Carmen de Andacollo exceeded its carrying value and we did not record an impairment charge as at December 31, 2016. We have adjusted the carrying value of Fort Hills down to its recoverable amount as at December 31, 2016.
These recoverable amounts are most sensitive to changes in long-term copper and WCS oil prices, the Canadian-U.S. dollar exchange rates (for Fort Hills) and discount rates. The key inputs used in our determination of recoverable amounts interrelate significantly with each other and with our operating plans. For example, a decrease in long-term commodity prices would result in us making amendments to the mine plans that would partially offset the effect of lower prices through lower operating and capital costs. It is difficult to determine how all of these factors would interrelate, but in estimating the effect of changes in these assumptions on fair values, we believe that all of these factors need to be considered together. In addition, variations in assumptions could potentially cause some assets to be fully written off and not be subject to further impairment. Therefore, once an asset is fully impaired, a further decrease in these assumptions does not necessarily correspond with a proportionate increase in a potential impairment charge and a linear extrapolation of these effects becomes less meaningful as the change in assumption increases.
Fort Hills has been written down to its recoverable amount. Ignoring the above-described interrelationships, in isolation a US$1 decrease per barrel in the long-term WCS oil price would result in an additional reduction in the recoverable amount of $120 million. A $0.01 strengthening of the Canadian dollar against the U.S. dollar would result in an additional reduction in the recoverable amount of $42 million. A 25 basis point increase in the discount rate would result in an additional reduction in the recoverable amount of approximately $120 million.
41Management’s Discussion and Analysis

Carmen de Andacollo was written down to its recoverable amount as at December 31, 2015 and the estimated recoverable amount has not changed significantly since that date. Accordingly, the recoverable amount is sensitive to any change in the long-term copper price assumption or discount rate. Ignoring the above-described interrelationships, in isolation a US$0.01 decrease in the long-term copper price and a 25 basis point increase in the discount rate would result in a reduction in the recoverable amount of approximately $13 million and $19 million, respectively.
Year Ended December 31, 2015
In light of economics in the third and fourth quarters of 2015, we identified CGUs with carrying values that exceeded their estimated recoverable amounts and recorded impairments. The FVLCD was estimated using a discounted cash flow methodology taking into account assumptions likely to be made by market participants. For the year ended December 31, 2015, we recorded pre-tax impairment adjustments of $3.6 billion. The details of the impairment adjustments are outlined on page 31 of this Management’s Discussion and Analysis.
The key inputs used to estimate the FVLCD of each CGU as at December 31, 2015, where applicable, were derived in the same manner as those noted above for our December 31, 2016 impairment testing and were as follows:
Commodity Prices
Our key commodity price assumptions were based on current prices over the first three years escalating to an assumed real long-term price. For steelmaking coal, copper, zinc and Western Canadian Select oil prices, we started with a 2015 current price in the initial year and gradually escalated that over the next three years, reaching real long-term prices in 2020 of US$130 per tonne for steelmaking coal, US$3.00 per pound for copper, US$1.00 per pound for zinc and US$60 per barrel for oil.
Discount Rates
A 6.2% real, 8.3% nominal, post-tax discount rate was used to discount cash flow projections in all of our FVLCD discounted cash flows as at December 31, 2015.
Foreign Exchange Rates
The long-term Canadian-U.S. dollar foreign exchange rate assumption used as at December 31, 2015 was CAD$1.25 to US$1.00.
Inflation Rates
The inflation rate for all FVLCD calculations as at December 31, 2015 was 2%.
Joint Arrangements
We are a party to a number of arrangements in which we do not have control. Judgment is required in determining whether joint control over these arrangements exists and, if so, which parties have joint control and whether each arrangement is a joint venture or joint operation. In assessing whether we have joint control, we analyze the activities of each arrangement and determine which activities most significantly affect the returns of the arrangement over its life. These activities are determined to be the relevant activities of the arrangement. If unanimous consent is required over the decisions about the relevant activities, the parties whose consent is required would have joint control over the arrangement. The judgments around which activities are considered the relevant activities of the arrangement are subject to analysis by each of the parties to the arrangement and may be interpreted differently. When performing this assessment, we generally consider decisions about activities such as managing the asset while it is being constructed, during its operating life and during the closure period. We may also consider other activities, including the approval of budgets, expansion and disposition of assets, financing, significant operating and capital expenditures, appointment of key management personnel, representation on the board of directors, and other items. When circumstances or contractual terms change, we reassess the control group and the relevant activities of the arrangement.
If we have joint control over the arrangement, an assessment of whether the arrangement is a joint venture or joint operation is required. This assessment is based on whether we have rights to the assets, and obligations for the liabilities, relating to the arrangement, or whether we have rights to the net assets of the arrangement. In making this determination, we review the legal form of the arrangement, the terms of the contractual arrangement, and other
42 Teck 2016 Annual Report | Every Day

facts and circumstances. In a situation where the legal form and the terms of the contractual arrangement do not give us rights to the assets and obligations for the liabilities, an assessment of other facts and circumstances is required, including whether the activities of the arrangement are primarily designed for the provision of output to the parties and whether the parties are substantially the only source of cash flows contributing to the arrangement. In such circumstances, we may consider the application of other facts and circumstances to conclude that a joint arrangement is a joint operation. This conclusion requires judgment and is specific to each arrangement. We have applied the use of other facts and circumstances to conclude that Antamina and Fort Hills are joint operations for the purposes of our consolidated financial statements. The other facts and circumstances considered for both of these arrangements are the provisions for output to the parties of the joint arrangements. For both Antamina and Fort Hills, we will take our share of the output from the assets directly over the life of the arrangement. We have concluded that this, combined with other factors, gives us direct rights to the assets and obligations for the liabilities of these arrangements, proportionate to our ownership interests.
Streaming Transactions
When we enter into long-term streaming arrangements linked to production at specific operations, judgment is required in assessing the appropriate accounting treatment of the transaction on the closing date and in future periods. We consider the specific terms of each arrangement to determine whether we have disposed of an interest in the reserves and resources of the respective operation. This assessment considers what the counterparty is entitled to, and the associated risks and rewards attributable to them over the life of the operation, including the contractual terms related to the total production over the life of the arrangement as compared to the expected production over the life of the mine, the percentage being sold, the percentage of payable metals produced, the commodity price referred to in the ongoing payment, and any guarantee relating to the upfront payment if production ceases.
Estimated Recoverable Reserves and Resources
Mineral reserve and resource estimates are based on various assumptions relating to operating matters as set forth in National Instrument 43-101. These include production costs, mining and processing recoveries, cut-off grades, long-term commodity prices and, in some cases, exchange rates, inflation rates and capital costs. Cost estimates are based on feasibility study estimates or operating history. Estimates are prepared by appropriately qualified persons, but will be affected by forecasted commodity prices, inflation rates, exchange rates, and capital and production costs and recoveries, amongst other factors. Estimated recoverable reserves and resources are used to determine the depreciation of property, plant and equipment at operating mine sites, in accounting for capitalized production stripping costs, in performing impairment testing, and for forecasting the timing of the payment of decommissioning and restoration costs. Therefore, changes in the assumptions used could change the carrying value of assets, depreciation and impairment charges recorded in the income statement, and the carrying value of the decommissioning and restoration provision.
Decommissioning and Restoration Provisions
The decommissioning and restoration provision is based on future cost estimates using information available at the balance sheet date. The decommissioning and restoration provision is adjusted at each reporting period for changes to factors such as the expected amount of cash flows required to discharge the liability, the timing of such cash flows and the discount rate. The decommissioning and restoration provision requires other significant estimates and assumptions, including the requirements of the relevant legal and regulatory framework and the timing, extent and costs of required decommissioning and restoration activities. To the extent the actual costs differ from these estimates, adjustments will be recorded and the income statement may be affected.
Current and Deferred Income Taxes
We calculate current and deferred tax provisions for each of the jurisdictions in which we operate. Actual amounts of income tax expense are not final until tax returns are filed and accepted by the relevant authorities. This occurs subsequent to the issuance of our financial statements and the final determination of actual amounts may not be completed for a number of years. Therefore, profit in subsequent periods will be affected by the amount that estimates differ from the final tax return.
43Management’s Discussion and Analysis

Judgment is required in assessing whether deferred tax assets and certain deferred tax liabilities are recognized on the balance sheet and what tax rate is expected to be applied in the year when the related temporary differences reverse, particularly in regard to the utilization of the tax loss carryforwards. We also evaluate the recoverability of deferred tax assets based on an assessment of our ability to use the underlying future tax deductions before they expire against future taxable income. Deferred tax liabilities arising from temporary differences on investments in subsidiaries, joint ventures and associates are recognized unless the reversal of the temporary differences is not expected to occur in the foreseeable future and can be controlled. Assumptions about the generation of future taxable profits and repatriation of retained earnings depend on management’s estimates of future production and sales volumes, commodity prices, reserves and resources, operating costs, decommissioning and restoration costs, capital expenditures, dividends and other capital management transactions. Judgment is also required on the application of income tax legislation. These estimates and judgments are subject to risk and uncertainty and could result in an adjustment to the deferred tax provision and a corresponding credit or charge to profit.
Adoption of New Accounting Standards and Accounting Developments
Accounting Developments
New IFRS pronouncements that have been issued but are not yet effective are listed below. We plan to apply the new standard or interpretation in the annual period for which it is required.
Revenue from Contracts with Customers
In May 2014, the IASB issued IFRS 15, Revenue from Contracts with Customers (IFRS 15) as a result of a joint revenue project with the Financial Accounting Standards Board (FASB).
The new revenue standard introduces a single principles-based five-step model for the recognition of revenue when control of goods is transferred to, or a service is performed, for the customer. The five steps are to: identify the contract(s) with the customer, identify the performance obligations in the contract, determine the transaction price, allocate the transaction price, and recognize revenue when the performance obligation is satisfied. IFRS 15 also requires enhanced disclosures about revenue to help investors better understand the nature, amount, timing and uncertainty of revenue and cash flows from contracts with customers, and improves the comparability of revenue from contracts with customers.
The standard initially had an effective date of January 1, 2017 but was subsequently deferred by one year to January 1, 2018. Early application of IFRS 15 is still permitted.
We are currently assessing the effect of this standard on our financial statements.
Financial Instruments
IFRS 9, Financial Instruments (IFRS 9), addresses the classification, measurement and recognition of financial assets and financial liabilities. The July 2014 publication of IFRS 9 is the completed version of the standard, replacing earlier versions of IFRS 9 and superseding the guidance relating to the classification and measurement of financial instruments in IAS 39, Financial Instruments: Recognition and Measurement (IAS 39).
IFRS 9 requires financial assets to be classified into three measurement categories on initial recognition: those measured at fair value through profit and loss, those measured at fair value through other comprehensive income and those measured at amortized cost. Investments in equity instruments are required to be measured by default at fair value through profit or loss. However, there is an irrevocable option for each equity instrument to present fair value changes in other comprehensive income. Measurement and classification of financial assets is dependent on the entity’s business model for managing the financial assets and the contractual cash flow characteristics of the financial asset. For financial liabilities, the standard retains most of the IAS 39 requirements. The main change is that, in cases where the fair value option is taken for financial liabilities, the part of a fair value change relating to an entity’s own credit risk is recorded in other comprehensive income rather than the income statement, unless this creates an accounting mismatch.
44 Teck 2016 Annual Report | Every Day

IFRS 9 introduces a new three-stage expected credit loss model for calculating impairment for financial assets. IFRS 9 no longer requires a triggering event to have occurred before credit losses are recognized. An entity is required to recognize expected credit losses when financial instruments are initially recognized and to update the amount of expected credit losses recognized at each reporting date to reflect changes in the credit risk of the financial instruments. In addition, IFRS 9 requires additional disclosure requirements about expected credit losses and credit risk.
The new hedge accounting model in IFRS 9 aligns hedge accounting with risk management activities undertaken by an entity. Components of both financial and non-financial items will now be eligible for hedge accounting, as long as the risk component can be identified and measured. The hedge accounting model includes eligibility criteria that must be met, but these criteria are based on an economic assessment of the strength of the hedging relationship. New disclosure requirements relating to hedge accounting will be required and are meant to simplify existing disclosures. The IASB currently has a separate project on macro hedging activities; until the project is completed, the IASB has provided a policy choice for entities to either apply the hedge accounting model in IFRS 9 or IAS 39 in full. Additionally, there is a hybrid option to use IAS 39 to account for macro hedges only and to use IFRS 9 for all other hedges.
The completed version of IFRS 9 is effective for annual periods beginning on or after January 1, 2018, with early adoption permitted. We are currently assessing the effect of this standard and its related amendments on our financial statements.
Leases
In January 2016, the IASB issued IFRS 16, Leases (IFRS 16), which eliminates the classification of leases as either operating or finance leases for a lessee. Under IFRS 16, all leases are considered finance leases and will be recorded on the balance sheet. The only exemptions to this classification will be for leases that are 12 months or less in duration or for leases of low-value assets. The requirement to record all leases as finance leases under IFRS 16 will increase lease assets and financial liabilities on an entity’s financial statements. IFRS 16 will also change the nature of expenses relating to leases, as the straight-line lease expense previously recognized for operating leases will be replaced with depreciation expense for lease assets and finance expense for lease liabilities. IFRS 16 includes an overall disclosure objective and requires a company to disclose (a) information about lease assets and expenses and cash flows related to leases; (b) a maturity analysis of lease liabilities; and (c) any additional company-specific information that is relevant to satisfying the disclosure objective. IFRS 16 is effective from January 1, 2019 and can be applied before that date, but only if IFRS 15 is also applied. We are currently assessing the effect of this standard on our financial statements.
Outstanding Share DataAs at February 23, 2017, there were 567,846,944 Class B subordinate voting shares and 9,353,470 Class A common shares outstanding. In addition, there were 22,551,735 employee stock options outstanding, with exercise prices ranging between $4.15 and $58.80 per share. More information on these instruments and the terms of their conversion are set out in Note 21 to our 2016 consolidated financial statements.
45Management’s Discussion and Analysis
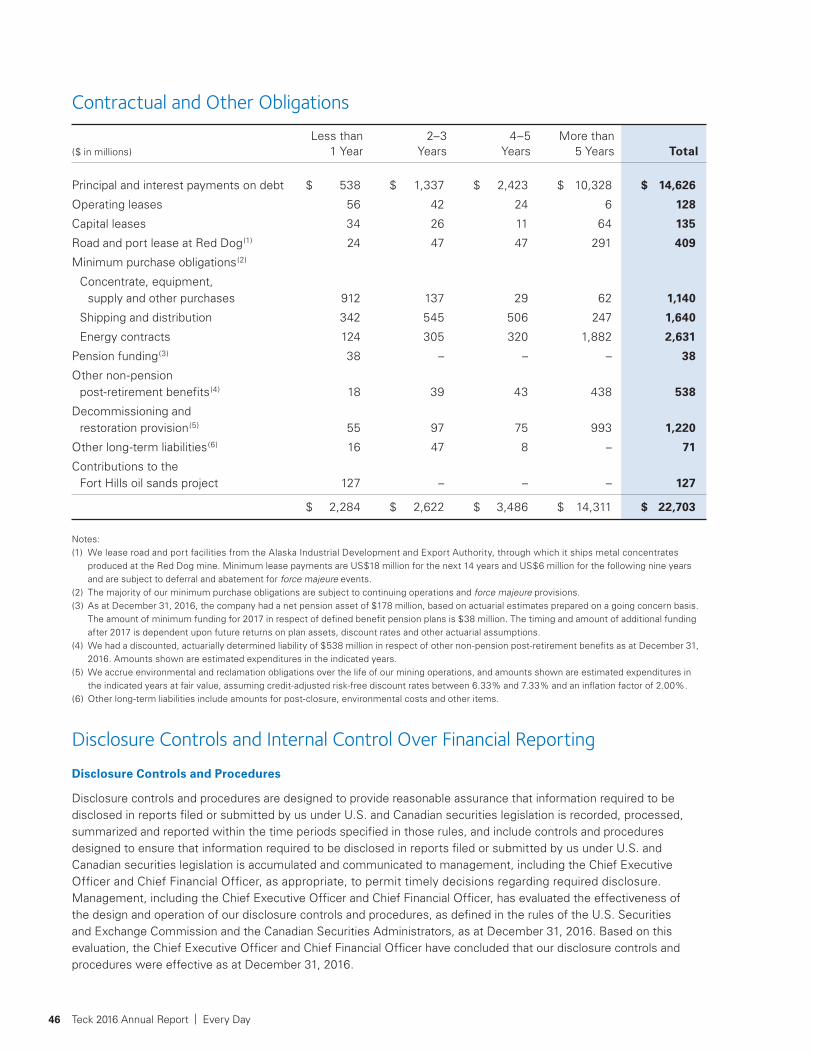
Contractual and Other Obligations
Less than 2–3 4–5 More than ($ in millions) 1 Year Years Years 5 Years Total
Principal and interest payments on debt $ 538 $ 1,337 $ 2,423 $ 10,328 $ 14,626
Operating leases 56 42 24 6 128
Capital leases 34 26 11 64 135
Road and port lease at Red Dog(1) 24 47 47 291 409
Minimum purchase obligations(2)
Concentrate, equipment, supply and other purchases 912 137 29 62 1,140
Shipping and distribution 342 545 506 247 1,640
Energy contracts 124 305 320 1,882 2,631
Pension funding(3) 38 – – – 38
Other non-pension post-retirement benefits(4) 18 39 43 438 538
Decommissioning and restoration provision(5) 55 97 75 993 1,220
Other long-term liabilities(6) 16 47 8 – 71
Contributions to the Fort Hills oil sands project 127 – – – 127
$ 2,284 $ 2,622 $ 3,486 $ 14,311 $ 22,703
Notes:(1) We lease road and port facilities from the Alaska Industrial Development and Export Authority, through which it ships metal concentrates
produced at the Red Dog mine. Minimum lease payments are US$18 million for the next 14 years and US$6 million for the following nine years and are subject to deferral and abatement for force majeure events.
(2) The majority of our minimum purchase obligations are subject to continuing operations and force majeure provisions.(3) As at December 31, 2016, the company had a net pension asset of $178 million, based on actuarial estimates prepared on a going concern basis.
The amount of minimum funding for 2017 in respect of defined benefit pension plans is $38 million. The timing and amount of additional funding after 2017 is dependent upon future returns on plan assets, discount rates and other actuarial assumptions.
(4) We had a discounted, actuarially determined liability of $538 million in respect of other non-pension post-retirement benefits as at December 31, 2016. Amounts shown are estimated expenditures in the indicated years.
(5) We accrue environmental and reclamation obligations over the life of our mining operations, and amounts shown are estimated expenditures in the indicated years at fair value, assuming credit-adjusted risk-free discount rates between 6.33% and 7.33% and an inflation factor of 2.00%.
(6) Other long-term liabilities include amounts for post-closure, environmental costs and other items.
Disclosure Controls and Internal Control Over Financial Reporting
Disclosure Controls and Procedures
Disclosure controls and procedures are designed to provide reasonable assurance that information required to be disclosed in reports filed or submitted by us under U.S. and Canadian securities legislation is recorded, processed, summarized and reported within the time periods specified in those rules, and include controls and procedures designed to ensure that information required to be disclosed in reports filed or submitted by us under U.S. and Canadian securities legislation is accumulated and communicated to management, including the Chief Executive Officer and Chief Financial Officer, as appropriate, to permit timely decisions regarding required disclosure. Management, including the Chief Executive Officer and Chief Financial Officer, has evaluated the effectiveness of the design and operation of our disclosure controls and procedures, as defined in the rules of the U.S. Securities and Exchange Commission and the Canadian Securities Administrators, as at December 31, 2016. Based on this evaluation, the Chief Executive Officer and Chief Financial Officer have concluded that our disclosure controls and procedures were effective as at December 31, 2016.
46 Teck 2016 Annual Report | Every Day
Management’s Report on Internal Control Over Financial Reporting
Our management is responsible for establishing and maintaining adequate internal control over financial reporting. Any system of internal control over financial reporting, no matter how well designed, has inherent limitations. Therefore, even those systems determined to be effective can provide only reasonable assurance with respect to financial statement preparation and presentation. Management has used the Committee of Sponsoring Organizations of the Treadway Commission (COSO) 2013 framework to evaluate the effectiveness of our internal control over financial reporting. Based on this assessment, management has concluded that as at December 31, 2016, our internal control over financial reporting was effective.
The effectiveness of our internal controls over financial reporting has been audited by PricewaterhouseCoopers LLP, an independent registered public accounting firm, who have expressed their opinion in their report included with our annual consolidated financial statements.
Use of Non-GAAP Financial MeasuresOur financial results are prepared in accordance with International Financial Reporting Standards (IFRS). This document refers to gross profit before depreciation and amortization, gross profit margins before depreciation, EBITDA, adjusted EBITDA, adjusted profit, adjusted earnings per share, cash unit costs, adjusted cash costs of sales, cash margins for by-products, adjusted revenue, net debt, debt to debt-plus-equity ratio, and the net-debt to net-debt-plus-equity ratio, which are not measures recognized under IFRS in Canada and do not have a standardized meaning prescribed by IFRS or Generally Accepted Accounting Principles (GAAP) in the United States, and therefore may not be comparable to similar measures presented by other issuers.
Gross profit before depreciation and amortization is gross profit with the depreciation and amortization expense added back. EBITDA is profit attributable to shareholders before net finance expense, income and resource taxes, and depreciation and amortization. Adjusted EBITDA is EBITDA before impairment charges. For adjusted profit, we adjust profit attributable to shareholders as reported to remove the effect of certain types of transactions that in our judgment are not indicative of our normal operating activities or do not necessarily occur on a regular basis. This both highlights these items and allows us to analyze the rest of our results more clearly. We believe that disclosing these measures assists readers in understanding the cash-generating potential of our business in order to provide liquidity to fund working capital needs, service outstanding debt, fund future capital expenditures and investment opportunities, and pay dividends.
Gross profit margins before depreciation are gross profit before depreciation and amortization, divided by revenue for each respective business unit.
Cash unit costs are calculated by dividing the cost of sales for the principal product by sales volumes. We include this information, as it is frequently requested by investors and investment analysts who use it to assess our cost structure and margins and compare it to similar information provided by many companies in our industry.
We sell both copper concentrates and refined copper cathodes. The price for concentrates sold to smelters is based on average LME prices over a defined quotational period, from which processing and refining deductions are made. In addition, we are paid for an agreed percentage of the copper contained in concentrates, which constitutes payable pounds. Adjusted revenue excludes the revenue from co-products and by-products, but adds back the processing and refining allowances to arrive at the value of the underlying payable pounds of copper. Readers may compare this on a per unit basis with the price of copper on the LME.
The adjusted cash cost of sales for our steelmaking coal operations is defined as the cost of the product as it leaves the mine excluding depreciation and amortization charges. Adjusted cash cost of sales for our copper operations is defined as the cost of the product delivered to the port of shipment, excluding depreciation and amortization charges. It is common practice in the industry to exclude depreciation and amortization, as these costs are ‘non-cash’ and discounted cash flow valuation models used in the industry substitute expectations of future capital spending for these amounts. In order to arrive at adjusted cash costs of sales for copper, we also deduct the costs of by-products and co-products. Total cash unit costs include the smelter and refining allowances added back in determining adjusted revenue. This presentation allows a comparison of unit costs, including smelter allowances, to the underlying price
47Management’s Discussion and Analysis
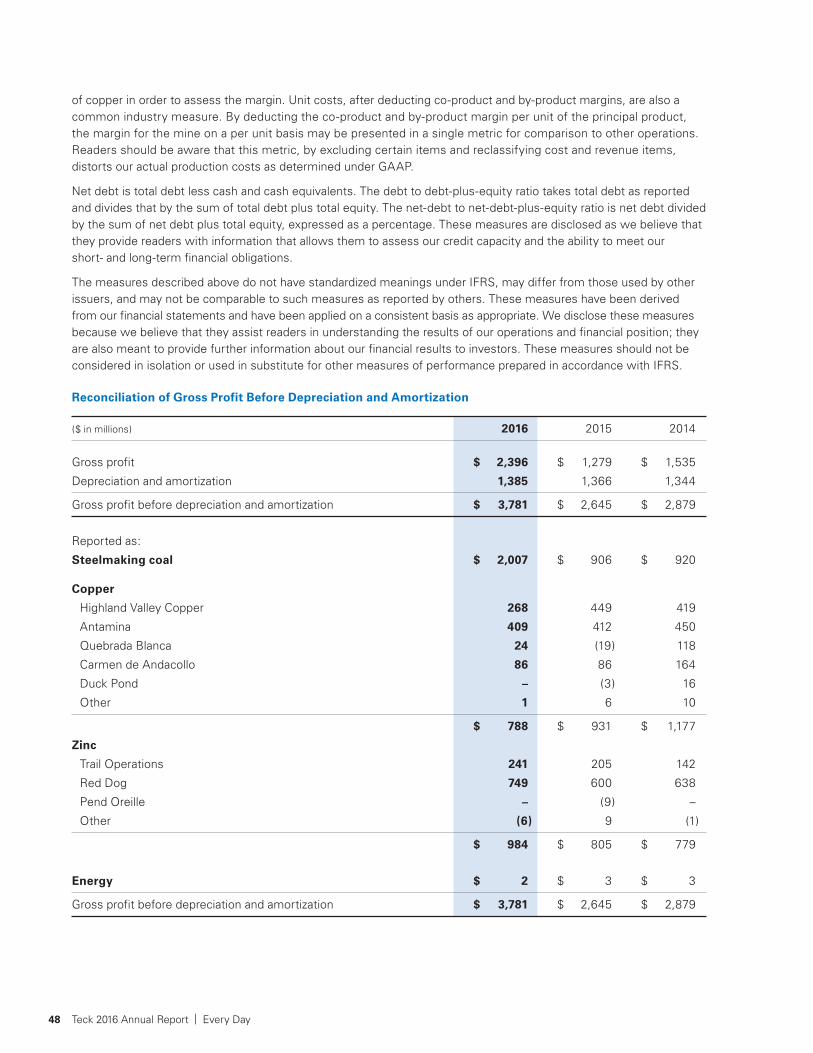
of copper in order to assess the margin. Unit costs, after deducting co-product and by-product margins, are also a common industry measure. By deducting the co-product and by-product margin per unit of the principal product, the margin for the mine on a per unit basis may be presented in a single metric for comparison to other operations. Readers should be aware that this metric, by excluding certain items and reclassifying cost and revenue items, distorts our actual production costs as determined under GAAP.
Net debt is total debt less cash and cash equivalents. The debt to debt-plus-equity ratio takes total debt as reported and divides that by the sum of total debt plus total equity. The net-debt to net-debt-plus-equity ratio is net debt divided by the sum of net debt plus total equity, expressed as a percentage. These measures are disclosed as we believe that they provide readers with information that allows them to assess our credit capacity and the ability to meet our short- and long-term financial obligations.
The measures described above do not have standardized meanings under IFRS, may differ from those used by other issuers, and may not be comparable to such measures as reported by others. These measures have been derived from our financial statements and have been applied on a consistent basis as appropriate. We disclose these measures because we believe that they assist readers in understanding the results of our operations and financial position; they are also meant to provide further information about our financial results to investors. These measures should not be considered in isolation or used in substitute for other measures of performance prepared in accordance with IFRS.
Reconciliation of Gross Profit Before Depreciation and Amortization
($ in millions) 2016 2015 2014
Gross profit $ 2,396 $ 1,279 $ 1,535
Depreciation and amortization 1,385 1,366 1,344
Gross profit before depreciation and amortization $ 3,781 $ 2,645 $ 2,879
Reported as:
Steelmaking coal $ 2,007 $ 906 $ 920
Copper
Highland Valley Copper 268 449 419
Antamina 409 412 450
Quebrada Blanca 24 (19) 118
Carmen de Andacollo 86 86 164
Duck Pond – (3) 16
Other 1 6 10
$ 788 $ 931 $ 1,177
Zinc
Trail Operations 241 205 142
Red Dog 749 600 638
Pend Oreille – (9) –
Other (6) 9 (1)
$ 984 $ 805 $ 779
Energy $ 2 $ 3 $ 3
Gross profit before depreciation and amortization $ 3,781 $ 2,645 $ 2,879
48 Teck 2016 Annual Report | Every Day

Quarterly Reconciliation
($ in millions) 2016 2015
Q4 Q3 Q2 Q1 Q4 Q3 Q2 Q1
Profit (loss) attributable to shareholders $ 697 $ 234 $ 15 $ 94 $ (459) $ (2,146) $ 63 $ 68
Finance expense net of finance income 82 86 82 88 79 76 78 78
Provision (recovery of) for income taxes 395 119 47 26 (222) (767) 90 63
Depreciation and amortization 387 365 324 309 333 331 365 337
EBITDA $ 1,561 $ 804 $ 468 $ 517 $ (269) $ (2,506) $ 596 $ 546
Impairments $ 268 $ 26 – – $ 736 $ 2,895 – –
Adjusted EBITDA $ 1,829 $ 830 $ 468 $ 517 $ 467 $ 389 $ 596 $ 546
Cautionary Statement on Forward-Looking InformationThis document contains certain forward-looking information and forward-looking statements as defined in applicable securities laws. All statements other than statements of historical fact are forward-looking statements. These forward-looking statements, principally under the heading “Outlook”, but also elsewhere in this document, include estimates, forecasts and statements as to management’s expectations with respect to, among other things, anticipated future production at our business units and individual operations (including our long-term production guidance), cost and spending guidance for our business units and individual operations, our expectation that we will meet our production guidance, sales volume and selling prices for our products (including settlement of coal contracts with customers), forecast capital expenditures, expected prices and demand for our products, expected receipt of regulatory approvals and timing thereof, expected receipt of pre-feasibility studies, feasibility studies and other studies and the timing thereof, plans and expectations for our development projects, including resulting increases in forecast operating costs and costs of product sold, expected production, expected progress, planned activities, costs and outcomes of our various projects and investments, including, but not limited to, those described in the discussions of our operations, the sensitivity of our estimated profit and EBITDA to changes in commodity prices and exchange rates, the effect of currency exchange rates, our strategies and objectives, our expectations for the general market for our commodities, future trends for the company, costs associated with the Elk Valley Water Quality Plan and goals of that plan, anticipated mine life for our operations, expected copper and zinc production rates at Antamina, expectations that the agglomeration circuit at Quebrada Blanca will be halted in 2017 and that this will reduce operating costs, expectations regarding the Quebrada Blanca Phase 2 project, including that the project has the potential to be a large-scale, long-life copper asset, has the potential to significantly extend mine life beyond the feasibility case, expectations that the project is expected to generate strong economic returns with operating cash costs well placed on the long-term copper C1 cost curve, capital cost and mine life and production estimates for the project, expectations regarding regulatory approvals for the Quebrada Blanca Phase 2 project and timing of any development decision in respect thereof and first ore, the potential to expand the Pend Oreille mine life at rates similar to its 2017 anticipated production for several more years, planned exploration activities at NuevaUnión, planned exploration activities and feasibility studies at Red Dog and any aim to increase mine life or mill throughput as a result, any anticipated extension to the Pend Oreille mine life, planned construction of a new acid plant at our Trail Operations and the timing thereof, our ability to continue our cost reduction initiatives and the anticipated results of the initiatives, the expected timing and amount of production at the Fort Hills oil sands project, capital costs and our remaining capital commitment at Fort Hills, Fort Hills anticipated production rate, timing expectations regarding the Frontier review and permitting process as well as anticipated cost to achieve first commercial production, reserve and resources estimates, the availability of our credit facilities, sources of liquidity and capital resources forecast and demand and market outlook for commodities. These forward-looking statements involve numerous assumptions, risks and uncertainties and actual results may vary materially.
These statements are based on a number of assumptions, including, but not limited to, assumptions regarding general business, regulatory and economic conditions, the supply and demand for, deliveries of, and the level and volatility of prices of zinc, copper and steelmaking coal and other primary metals and minerals as well as oil, and related products, the timing of the receipt of regulatory and governmental approvals for our development projects and other operations, our costs of production, and production and productivity
49Management’s Discussion and Analysis

levels, as well as those of our competitors, power prices, continuing availability of water and power resources for our operations, market competition, the accuracy of our reserve and resource estimates (including with respect to size, grade and recoverability) and the geological, operational and price assumptions on which these are based, conditions in financial markets, the future financial performance of the company, our ability to attract and retain skilled staff, our ability to procure equipment and operating supplies, positive results from the studies on our expansion projects, our steelmaking coal and other product inventories, our ability to secure adequate transportation for our products, our ability to obtain permits for our operations and expansions, and our ongoing relations with our employees, business partners and joint venturers. Assumptions regarding capital costs, mine life and other parameters for Quebrada Blanca Phase 2 are based on assumptions in the feasibility study. Statements regarding the availability of our credit facilities are based on assumptions that we will be able to satisfy the conditions for borrowing at the time of a borrowing request and that the credit facilities are not otherwise terminated or accelerated due to an event of default. The sensitivity of our project profit and EBITDA to changes in the Canadian/U.S. dollar exchange rate and commodity prices, before pricing adjustments, is based on our current balance sheet, our expected 2017 mid-range production estimates, current commodity prices and a Canadian/U.S. dollar exchange rate of $1.30. The foregoing list of assumptions is not exhaustive. Events or circumstances could cause actual results to vary materially.
Factors that may cause actual results to vary materially include, but are not limited to, changes in commodity and power prices, changes in market demand for our products, changes in interest and currency exchange rates, acts of foreign or domestic governments and the outcome of legal proceedings, inaccurate geological and metallurgical assumptions (including with respect to the size, grade and recoverability of mineral reserves and resources), unanticipated operational difficulties (including failure of plant, equipment or processes to operate in accordance with specifications or expectations, cost escalation, unavailability of materials and equipment, government action or delays in the receipt of government approvals, changes in tax or royalty rates, industrial disturbances or other job action, adverse weather conditions and unanticipated events related to health, safety and environmental matters), union labour disputes, political risk, social unrest, failure of customers or counterparties to perform their contractual obligations, changes in our credit ratings, unanticipated increases in costs to construct our development projects, difficulty in obtaining permits, inability to address concerns regarding permits or environmental impact assessments, and changes or further deterioration in general economic conditions. The amount and timing of actual capital expenditures is dependent upon, among other matters, being able to secure permits, equipment, supplies, materials and labour on a timely basis and at expected costs to enable the related capital project to be completed as currently anticipated. Our Fort Hills project is not controlled by us and construction and production schedules may be adjusted by our partners.
Statements concerning future production costs or volumes, and the sensitivity of the company’s profit to changes in commodity prices and exchange rates, are based on numerous assumptions of management regarding operating matters and on assumptions that demand for products develops as anticipated, that customers and other counterparties perform their contractual obligations, that operating and capital plans will not be disrupted by issues such as mechanical failure, unavailability of parts and supplies, labour disturbances, interruption in transportation or utilities, and adverse weather conditions, and that there are no material unanticipated variations in the cost of energy or supplies.
We assume no obligation to update forward-looking statements except as required under securities laws. Further information concerning risks and uncertainties associated with these forward-looking statements and our business can be found in our Annual Information Form for the year ended December 31, 2016, filed under our profile on SEDAR (www.sedar.com) and on EDGAR (www.sec.gov) under cover of Form 40-F.
Quebrada Blanca Phase 2 reserve and grade information was approved by Mr. Rodrigo Alves Marinho, P.Geo., an employee of Teck. Mr. Marinho is a qualified person, as defined under National Instrument (NI) 43-101.
Contingent Resource Disclosure
The contingent bitumen resources at Frontier have been prepared by Sproule Unconventional Limited, a qualified resources evaluator, in accordance with the guidelines set out in the Canadian Oil and Gas Evaluation Handbook. There is uncertainty that any of these resources will be commercially viable to produce any portion of the resources. Contingent bitumen resources are defined for this purpose as those quantities of petroleum estimated, as of a given date, to be potentially recoverable from known accumulations using established technology or technology under development, but which are not currently considered to be commercially recoverable due to one or more contingencies. The entire contingent bitumen resources for Frontier oil sands mine are sub-classified into the development pending project maturity sub-class as extensive pre-development work has been completed. Contingencies may include factors such as economic, legal, environmental, political and regulatory matters or a lack of markets. Contingent resources do not constitute, and should not be confused with, reserves. There is no certainty that the Frontier project will produce any portion of the volumes currently classified as contingent resources. The primary contingencies that currently prevent the classification of the contingent resources disclosed above for the Frontier project as reserves include project economics due to the uncertainty in oil price and uncertainty in exchange rate; uncertainties around receiving regulatory approval to develop the project; potential issues regarding social licence for oil sands mining generally and climate change policy costs. In addition, there would be a need for approval of a decision to proceed to construction of the project by Teck. The Frontier project is based on a development study. The recovery technology at Frontier is expected to be a paraffinic froth treatment process. The total cost required to achieve first commercial production has been estimated by the resources evaluator at$16.2 billion.
50 Teck 2016 Annual Report | Every Day

Consolidated Financial StatementsFor the Years Ended December 31, 2016 and 2015
51Consolidated Financial Statements

Management’s Responsibility for Financial ReportingManagement is responsible for the integrity and fair presentation of the financial information contained in this annual report. Where appropriate, the financial information, including financial statements, reflects amounts based on the best estimates and judgments of management. The financial statements have been prepared in accordance with International Financial Reporting Standards as issued by the International Accounting Standards Board. Financial information presented elsewhere in the annual report is consistent with that disclosed in the financial statements.
Management is responsible for establishing and maintaining adequate internal control over financial reporting. Any system of internal control over financial reporting, no matter how well designed, has inherent limitations. Therefore, even those systems determined to be effective can provide only reasonable assurance with respect to financial statement preparation and presentation. The system of controls is also supported by a professional staff of internal auditors who conduct periodic audits of many aspects of our operations and report their findings to management and the Audit Committee.
Management has a process in place to evaluate internal control over financial reporting based on the criteria established by the Committee of Sponsoring Organizations of the Treadway Commission (COSO) 2013 framework.
The Board of Directors oversees management’s responsibility for financial reporting and internal control systems through an Audit Committee, which is composed entirely of independent directors. The Audit Committee meets periodically with management, our internal auditors and independent auditors to review the scope and results of the annual audit, and to review the financial statements and related financial reporting and internal control matters before the financial statements are approved by the Board of Directors and submitted to the shareholders.
PricewaterhouseCoopers LLP, an independent registered public accounting firm, appointed by the shareholders, have audited our financial statements in accordance with Canadian generally accepted auditing standards and have expressed their opinion in the Independent Auditor’s Report.
Donald R. Lindsay President and Chief Executive Officer
Ronald A. Millos Senior Vice President, Finance and Chief Financial Officer February 23, 2017
Consolidated Financial Statements For the Years Ended December 31, 2016 and 2015
52 Teck 2016 Annual Report | Every Day

Independent Auditor’s Report
To the Shareholders of Teck Resources Limited
We have completed integrated audits of Teck Resources Limited’s (the Company) December 31, 2016 and December 31, 2015 consolidated financial statements and its internal control over financial reporting as at December 31, 2016. Our opinions, based on our audits are presented below.
Report on the Consolidated Financial Statements
We have audited the accompanying consolidated financial statements of Teck Resources Limited, which comprise the consolidated balance sheets as at December 31, 2016 and December 31, 2015 and the consolidated statements of income (loss), comprehensive income (loss), cash flows and changes in equity for the years then ended, and the related notes, which comprise a summary of significant accounting policies and other explanatory information.
Management’s Responsibility for the Consolidated Financial Statements
Management is responsible for the preparation and fair presentation of these consolidated financial statements in accordance with International Financial Reporting Standards as issued by the International Accounting Standards Board and for such internal control as management determines is necessary to enable the preparation of consolidated financial statements that are free from material misstatement, whether due to fraud or error.
Auditor’s Responsibility
Our responsibility is to express an opinion on these consolidated financial statements based on our audits. We conducted our audits in accordance with Canadian generally accepted auditing standards and the standards of the Public Company Accounting Oversight Board (United States). Those standards require that we plan and perform the audit to obtain reasonable assurance about whether the consolidated financial statements are free from material misstatement. Canadian generally accepted auditing standards also require that we comply with ethical requirements.
An audit involves performing procedures to obtain audit evidence, on a test basis, about the amounts and disclosures in the consolidated financial statements. The procedures selected depend on the auditor’s judgement, including the assessment of the risks of material misstatement of the consolidated financial statements, whether due to fraud or error. In making those risk assessments, the auditor considers internal control relevant to the company’s preparation and fair presentation of the consolidated financial statements in order to design audit procedures that are appropriate in the circumstances. An audit also includes evaluating the appropriateness of accounting principles and policies used and the reasonableness of accounting estimates made by management, as well as evaluating the overall presentation of the consolidated financial statements.
We believe that the audit evidence we have obtained in our audits is sufficient and appropriate to provide a basis for our audit opinion on the consolidated financial statements.
Opinion
In our opinion, the consolidated financial statements present fairly, in all material respects, the financial position of Teck Resources Limited as at December 31, 2016 and December 31, 2015 and its financial performance and its cash flows for the years then ended in accordance with International Financial Reporting Standards as issued by the International Accounting Standards Board.
Report on Internal Control Over Financial Reporting
We have also audited Teck Resources Limited’s internal control over financial reporting as at December 31, 2016, based on criteria established in Internal Control — Integrated Framework (2013), issued by the Committee of Sponsoring Organizations of the Treadway Commission (COSO).
53Consolidated Financial Statements

Management’s Responsibility for Internal Control Over Financial Reporting
Management is responsible for maintaining effective internal control over financial reporting and for its assessment of the effectiveness of internal control over financial reporting included in Management’s Report on Internal Control Over Financial Reporting.
Auditor’s Responsibility
Our responsibility is to express an opinion on the company’s internal control over financial reporting based on our audit. We conducted our audit of internal control over financial reporting in accordance with the standards of the Public Company Accounting Oversight Board (United States). Those standards require that we plan and perform the audit to obtain reasonable assurance about whether effective internal control over financial reporting was maintained in all material respects.
An audit of internal control over financial reporting includes obtaining an understanding of internal control over financial reporting, assessing the risk that a material weakness exists, testing and evaluating the design and operating effectiveness of internal control, based on the assessed risk, and performing such other procedures as we consider necessary in the circumstances.
We believe that our audit provides a reasonable basis for our audit opinion on the company’s internal control over financial reporting.
Definition of Internal Control Over Financial Reporting
A company’s internal control over financial reporting is a process designed to provide reasonable assurance regarding the reliability of financial reporting and the preparation of financial statements for external purposes in accordance with Generally Accepted Accounting Principles (GAAP). A company’s internal control over financial reporting includes those policies and procedures that: (i) pertain to the maintenance of records that, in reasonable detail, accurately and fairly reflect the transactions and dispositions of the assets of the company; (ii) provide reasonable assurance that transactions are recorded as necessary to permit preparation of financial statements in accordance with generally accepted accounting principles, and that receipts and expenditures of the company are being made only in accordance with authorizations of management and directors of the company; and (iii) provide reasonable assurance regarding prevention or timely detection of unauthorized acquisition, use, or disposition of the company’s assets that could have a material effect on the financial statements.
Inherent Limitations
Because of its inherent limitations, internal control over financial reporting may not prevent or detect misstatements. Also, projections of any evaluation of effectiveness to future periods are subject to the risk that controls may become inadequate because of changes in conditions or that the degree of compliance with the policies or procedures may deteriorate.
Opinion
In our opinion, Teck Resources Limited maintained, in all material respects, effective internal control over financial reporting as at December 31, 2016, based on criteria established in Internal Control — Integrated Framework (2013) issued by COSO.
Chartered Professional Accountants February 23, 2017 Vancouver, B.C.
54 Teck 2016 Annual Report | Every Day

55Consolidated Financial Statements
Consolidated Statements of Income (Loss) Years ended December 31
(CAD$ in millions, except for share data) 2016 2015
Revenues $ 9,300 $ 8,259
Cost of sales (6,904) (6,980)
Gross profit 2,396 1,279
Other operating expenses
General and administration (99) (108)
Exploration (51) (76)
Research and development (30) (47)
Asset impairments (Note 13(a)) (294) (3,631)
Other operating income (expense) (Note 6) (197) (335)
Profit (loss) from operations 1,725 (2,918)
Finance income (Note 7) 16 5
Finance expense (Note 7) (354) (316)
Non-operating income (expense) (Note 8) 239 (89)
Share of income (losses) of associates and joint ventures (Note 12) 2 (2)
Profit (loss) before taxes 1,628 (3,320)
(Provision for) recovery of income taxes (Note 17) (587) 836
Profit (loss) for the year $ 1,041 $ (2,484)
Profit (loss) attributable to:
Shareholders of the company $ 1,040 $ (2,474)
Non-controlling interests 1 (10)
Profit (loss) for the year $ 1,041 $ (2,484)
Earnings (loss) per share (Note 21(f))
Basic $ 1.80 $ (4.29)
Diluted $ 1.78 $ (4.29)
Weighted average shares outstanding (millions) 576.4 576.2
Shares outstanding at end of year (millions) 576.9 576.3
The accompanying notes are an integral part of these financial statements.

56 Teck 2016 Annual Report | Every Day
Consolidated Statements of Comprehensive Income (Loss) Years ended December 31
(CAD$ in millions) 2016 2015
Profit (loss) for the year $ 1,041 $ (2,484)
Other comprehensive income (loss) in the year
Items that may be reclassified to profit (loss)
Currency translation differences (net of taxes of $ (27) and $163) (21) 202 Change in fair value of available-for-sale financial instruments
(net of taxes of $(2) and $(2)) 16 7 Cash flow hedges (net of taxes of $nil and $(1)) – 4 Share of other comprehensive income of associates and joint ventures 1 3
(4) 216
Items that will not be reclassified to profit (loss)
Remeasurements of retirement benefit plans (net of taxes of $(7) and $(18)) 19 40
Total other comprehensive income for the year 15 256
Total comprehensive income (loss) for the year $ 1,056 $ (2,228)
Total other comprehensive income attributable to:
Shareholders of the company $ 15 $ 241
Non-controlling interests – 15
$ 15 $ 256
Total comprehensive income (loss) attributable to:
Shareholders of the company $ 1,055 $ (2,233)
Non-controlling interests 1 5
$ 1,056 $ (2,228)
The accompanying notes are an integral part of these financial statements.

57Consolidated Financial Statements
Consolidated Statements of Cash Flows Years ended December 31
(CAD$ in millions) 2016 2015
Operating activities Profit (loss) for the year $ 1,041 $ (2,484) Depreciation and amortization 1,385 1,366 Provision for (recovery of) income taxes 587 (836) Asset impairments 294 3,631 Gain on sale of investments and assets (96) (120) Foreign exchange (gains) losses (46) 76 Gain on debt repurchase (49) – Gain on debt prepayment options (113) – Finance expense 354 316 Income taxes paid (272) (255) Other 331 54 Net change in non-cash working capital items (360) 214
3,056 1,962
Investing activities Property, plant and equipment (1,416) (1,581) Capitalized production stripping costs (477) (663) Expenditures on investments and other assets (114) (82) Proceeds from the sale of investments and other assets 170 1,222
(1,837) (1,104)Financing activities Issuance of debt 1,567 28 Repayment of debt (2,560) (476) Debt interest and finance charges paid (571) (455) Issuance of Class B subordinate voting shares 8 – Dividends paid (58) (374) Distributions to non-controlling interests (21) (27)
(1,635) (1,304)
Effect of exchange rate changes on cash and cash equivalents (64) 304
Decrease in cash and cash equivalents (480) (142)
Cash and cash equivalents at beginning of year 1,887 2,029
Cash and cash equivalents at end of year $ 1,407 $ 1,887
Supplemental cash flow information (Note 9)
The accompanying notes are an integral part of these financial statements.

58 Teck 2016 Annual Report | Every Day
Consolidated Balance Sheets
December 31, December 31, (CAD$ in millions) 2016 2015
Assets
Current assets Cash and cash equivalents (Note 9) $ 1,407 $ 1,887 Current income taxes receivable 97 183 Trade accounts receivable 1,585 1,115 Inventories (Note 10) 1,673 1,620
4,762 4,805
Financial and other assets (Note 11) 1,034 858Investments in associates and joint ventures (Note 12) 1,012 1,017Property, plant and equipment (Note 13) 27,595 26,791Deferred income tax assets (Note 17) 112 90Goodwill (Note 14) 1,114 1,127
$ 35,629 $ 34,688
Liabilities and Equity
Current liabilities Trade accounts payable and other liabilities (Note 15) $ 1,902 $ 1,673 Current income taxes payable 199 25 Debt (Note 16) 99 28
2,200 1,726
Debt (Note 16) 8,244 9,606Deferred income tax liabilities (Note 17) 4,896 4,828Deferred consideration (Note 18) 723 785Retirement benefit liabilities (Note 19) 643 626Other liabilities and provisions (Note 20) 1,322 480
18,028 18,051
Equity Attributable to shareholders of the company 17,442 16,407 Attributable to non-controlling interests 159 230
17,601 16,637
$ 35,629 $ 34,688
Contingencies (Note 23)Commitments (Note 24)Subsequent event (Note 30)
Approved on behalf of the Board of Directors
Tracey L. McVicar Warren S. R. Seyffert, Q.C.Chair of the Audit Committee Director
The accompanying notes are an integral part of these financial statements.

59Consolidated Financial Statements
Consolidated Statements of Changes in Equity Years ended December 31
(CAD$ in millions) 2016 2015
Class A common shares (Note 21) $ 7 $ 7
Class B subordinate voting shares (Note 21)Beginning of year 6,627 6,502 Issued on exercise of options 10 1 Reversal of tax provision – 124
End of year 6,637 6,627
Retained earningsBeginning of year 9,174 11,723 Profit (loss) for the year attributable to shareholders of the company 1,040 (2,474) Dividends declared (58) (115) Gain on purchase of non-controlling interest (Note 22(a)) 8 – Remeasurements of retirement benefit plans 19 40
End of year 10,183 9,174
Contributed surplus Beginning of year 173 149 Share option compensation expense (Note 21(c)) 22 24 Transfer to Class B subordinate voting shares on exercise of options (2) –
End of year 193 173
Accumulated other comprehensive income (loss) (Note 21(e))Beginning of year 426 225 Other comprehensive income 15 241 Less remeasurements of retirement benefit plans recorded in retained earnings (19) (40)
End of year 422 426
Non-controlling interests (Note 22)Beginning of year 230 230 Profit (loss) for the year attributable to non-controlling interests 1 (10) Other comprehensive income attributable to non-controlling interests – 15 Purchase of non-controlling interest (Note 22(a)) (46) – Other (5) 22 Dividends or distributions (21) (27)
End of year 159 230
Total equity $ 17,601 $ 16,637
The accompanying notes are an integral part of these financial statements.

60 Teck 2016 Annual Report | Every Day
Notes to Consolidated Financial Statements Years ended December 31, 2016 and 2015
1. Nature of Operations
Teck Resources Limited and its subsidiaries (Teck, we, us or our) are engaged in mining and related activities including research, exploration and development, processing, smelting, refining and reclamation. Our major products are steelmaking coal, copper, zinc and lead. We also produce precious metals, molybdenum, electrical power, fertilizers and other metals. Metal products are sold as refined metals or concentrates. Our energy assets include a partnership interest in an oil sands development project now under construction and certain oil sands leases.
Teck Resources Limited is a Canadian corporation and our registered office is at 550 Burrard Street, Vancouver, British Columbia, Canada, V6C 0B3.
2. Basis of Preparation and New IFRS Pronouncements
a) Basis of Preparation
These annual consolidated financial statements have been prepared by management in accordance with International Financial Reporting Standards (IFRS) as issued by the International Accounting Standards Board (IASB) and were approved by the Board of Directors on February 23, 2017.
b) New IFRS Pronouncements
New IFRS pronouncements that have been issued but are not yet effective are listed below. We plan to apply the new standards or interpretations in the annual period for which they are first required.
Revenue from Contracts with Customers
In May 2014, the IASB issued IFRS 15, Revenue from Contracts with Customers (IFRS 15) as a result of a joint revenue project with the Financial Accounting Standards Board (FASB).
The new revenue standard introduces a single principles-based five-step model for the recognition of revenue when control of goods is transferred to, or a service is performed, for the customer. The five steps are to: identify the contract(s) with the customer, identify the performance obligations in the contract, determine the transaction price, allocate the transaction price, and recognize revenue when the performance obligation is satisfied. IFRS 15 also requires enhanced disclosures about revenue to help investors better understand the nature, amount, timing and uncertainty of revenue and cash flows from contracts with customers.
The standard initially had an effective date of January 1, 2017 but was subsequently deferred by one year to January 1, 2018. Early application of IFRS 15 is still permitted. We are currently assessing the effect of this standard on our financial statements.
Financial Instruments
IFRS 9, Financial Instruments (IFRS 9), addresses the classification, measurement and recognition of financial assets and financial liabilities. The July 2014 publication of IFRS 9 is the completed version of the standard, replacing earlier versions of IFRS 9 and superseding the guidance relating to the classification and measurement of financial instruments in IAS 39, Financial Instruments: Recognition and Measurement (IAS 39).
IFRS 9 requires financial assets to be classified into three measurement categories on initial recognition: those measured at fair value through profit and loss, those measured at fair value through other comprehensive income and those measured at amortized cost. Investments in equity instruments are required to be measured by default at fair value through profit or loss. However, there is an irrevocable option for each equity instrument to present fair value changes in other comprehensive income. Measurement and classification of financial assets is dependent on the entity’s business model for managing the financial assets and the contractual cash flow characteristics of the financial asset. For financial liabilities, the standard retains most of the IAS 39 requirements. The main change is that, in cases where the fair value option is taken for financial liabilities, the part of a fair value change relating to an entity’s own credit risk is recorded in other comprehensive income rather than the income statement, unless this creates an accounting mismatch.

61Consolidated Financial Statements
IFRS 9 introduces a new three-stage expected credit loss model for calculating impairment for financial assets. IFRS 9 no longer requires a triggering event to have occurred before credit losses are recognized. An entity is required to recognize expected credit losses when financial instruments are initially recognized and to update the amount of expected credit losses recognized at each reporting date to reflect changes in the credit risk of the financial instruments. In addition, IFRS 9 requires additional disclosure requirements about expected credit losses and credit risk.
The new hedge accounting model in IFRS 9 aligns hedge accounting with risk management activities undertaken by an entity. Components of both financial and non-financial items will now be eligible for hedge accounting, as long as the risk component can be identified and measured. The hedge accounting model includes eligibility criteria that must be met, but these criteria are based on an economic assessment of the strength of the hedging relationship. New disclosure requirements relating to hedge accounting will be required and are meant to simplify existing disclosures. The IASB currently has a separate project on macro hedging activities and until the project is completed, the IASB has provided a policy choice for entities to either apply the hedge accounting model in IFRS 9 or IAS 39 in full. Additionally, there is a hybrid option to use IAS 39 to account for macro hedges only and to use IFRS 9 for all other hedges.
The completed version of IFRS 9 is effective for annual periods beginning on or after January 1, 2018, with early adoption permitted. We are currently assessing the effect of this standard and its related amendments on our financial statements.
Leases
In January 2016, the IASB issued IFRS 16, Leases (IFRS 16), which eliminates the classification of leases as either operating or finance leases for a lessee. Under IFRS 16, all leases are considered finance leases and will be recorded on the balance sheet. The only exemptions to this classification will be for leases that are 12 months or less in duration or for leases of low-value assets. The requirement to record all leases as finance leases under IFRS 16 will increase lease assets and lease liabilities on an entity’s financial statements. IFRS 16 will also change the nature of expenses relating to leases as the straight-line lease expense previously recognized for operating leases will be replaced with depreciation expense for lease assets and finance expense for lease liabilities. IFRS 16 includes an overall disclosure objective and requires a company to disclose (a) information about lease assets and expenses and cash flows related to leases; (b) a maturity analysis of lease liabilities; and (c) any additional company-specific information that is relevant to satisfying the disclosure objective. IFRS 16 is effective from January 1, 2019 and can be applied before that date but only if IFRS 15 is also applied. We are currently assessing the effect of this standard on our financial statements.

Notes to Consolidated Financial Statements Years ended December 31, 2016 and 2015
62 Teck 2016 Annual Report | Every Day
3. Summary of Significant Accounting Policies
The significant accounting policies applied in the preparation of these consolidated financial statements are set out below. These policies have been consistently applied to all periods presented, unless otherwise stated.
Basis of Presentation
Our consolidated financial statements include the accounts of Teck Resources Limited and all of its subsidiaries. Our significant operating subsidiaries include Teck Metals Ltd. (TML), Teck Alaska Incorporated (TAK), Teck Highland Valley Copper Partnership (Highland Valley Copper), Teck Coal Partnership (Teck Coal), Teck Washington Incorporated (TWI), Compañia Minera Teck Quebrada Blanca S.A. (Quebrada Blanca) and Compañia Minera Teck Carmen de Andacollo (Carmen de Andacollo).
All subsidiaries are entities that we control, either directly or indirectly. Control is defined as the exposure, or rights, to variable returns from involvement with an investee and the ability to affect those returns through power over the investee. Power over an investee exists when our existing rights give us the ability to direct the activities that significantly affect the investee’s returns. This control is generally evidenced through owning more than 50% of the voting rights or currently exercisable potential voting rights of a company’s share capital. All of our intra-group balances and transactions, including unrealized profits and losses arising from intra-group transactions, have been eliminated in full. For subsidiaries that we control but do not own 100% of, the net assets and net profit attributable to outside shareholders are presented as amounts attributable to non-controlling interests in the consolidated balance sheet and consolidated statements of income (loss) and comprehensive income (loss).
Certain of our business activities are conducted through joint arrangements. Our interests in joint operations include Galore Creek Partnership (Galore Creek, 50% share), Fort Hills Energy Limited Partnership (Fort Hills, 20% share) and Waneta Dam (66.7% share), which operate in Canada and Compañia Minera Antamina (Antamina, 22.5%), which operates in Peru. We account for our interests in these joint operations by recording our share of the respective assets, liabilities, revenue, expenses and cash flows. We also have an interest in a joint venture, NuevaUnión (50% share), in Chile that we account for using the equity method (Note 12(a)).
All dollar amounts are presented in Canadian dollars unless otherwise specified.
Interests in Joint Arrangements
A joint arrangement can take the form of a joint venture or joint operation. All joint arrangements involve a contractual arrangement that establishes joint control, which exists only when decisions about the activities that significantly affect the returns of the investee require unanimous consent of the parties sharing control. A joint operation is a joint arrangement in which we have rights to the assets and obligations for the liabilities relating to the arrangement. A joint venture is a joint arrangement in which we have rights to only the net assets of the arrangement.
Joint ventures are accounted for in accordance with the policy “Investments in Associates and Joint Ventures”. Joint operations are accounted for by recognizing our share of the assets, liabilities, revenue, expenses and cash flows of the joint operation in our consolidated financial statements.
63Consolidated Financial Statements
Investments in Associates and Joint Ventures
Investments over which we exercise significant influence but do not control or jointly control are associates. Investments in associates are accounted for using the equity method, except when classified as held for sale. Investments in joint ventures as determined in accordance with the policy “Interests in Joint Arrangements” are also accounted for using the equity method.
The equity method involves recording the initial investment at cost and subsequently adjusting the carrying value of the investment for our proportionate share of the profit or loss, other comprehensive income or loss and any other changes in the associate’s or joint venture’s net assets such as dividends.
Our proportionate share of the associate’s or joint venture’s profit or loss and other comprehensive income or loss is based on its most recent financial statements. Adjustments are made to align any inconsistencies between our accounting policies and our associate’s or joint venture’s policies before applying the equity method. Adjustments are also made to account for depreciable assets based on their fair values at the acquisition date of the investment and for any impairment losses recognized by the associate or joint venture.
If our share of the associate’s or joint venture’s losses were equal to or exceeded our investment in the associate or joint venture, recognition of further losses would be discontinued. After our interest is reduced to zero, additional losses would be provided for and a liability recognized only to the extent that we have incurred legal or constructive obligations to provide additional funding or make payments on behalf of the associate or joint venture. If the associate or joint venture subsequently reports profits, we resume recognizing our share of those profits only when we have a positive interest in the entity.
At each balance sheet date, we consider whether there is objective evidence of impairment in associates and joint ventures. If there is such evidence, we determine the amount of impairment to record, if any, in relation to the associate or joint venture.
Foreign Currency Translation
The functional currency of each of our subsidiaries and our joint operations, joint ventures and associates is the currency of the primary economic environment in which the entity operates. Transactions in foreign currencies are translated to the functional currency of the entity at the exchange rate in existence at the date of the transaction. Monetary assets and liabilities denominated in foreign currencies at the balance sheet date are retranslated at the period end date exchange rates.
The functional currency of Teck Resources Limited, the parent entity, is the Canadian dollar, which is also the presentation currency of our consolidated financial statements.
Foreign operations are translated from their functional currencies into Canadian dollars on consolidation. Items in the statement of income (loss) are translated using weighted average exchange rates that reasonably approximate the exchange rate at the transaction date. Items in the balance sheet are translated at the closing spot exchange rate. Exchange differences on the translation of the net assets of entities with functional currencies other than the Canadian dollar, and any offsetting exchange differences on net debt used to hedge those assets, are recognized in a separate component of equity through other comprehensive income (loss).
Exchange differences that arise relating to long-term intra-group balances that form part of the net investment in a foreign operation are also recognized in this separate component of equity through other comprehensive income (loss).
On disposition or partial disposition of a foreign operation, the cumulative amount of related exchange differences recorded in a separate component of equity is recognized in the statement of income (loss).

Notes to Consolidated Financial Statements Years ended December 31, 2016 and 2015
64 Teck 2016 Annual Report | Every Day
Revenue
Recognition
Sales of product, including by-product, are recognized in revenue when there is persuasive evidence that all of the following criteria have been met: the significant risks and rewards of ownership pass to the customer, neither continuing managerial involvement nor effective control remains over the goods sold, the selling price and costs to sell can be measured reliably, and it is probable that the economic benefits associated with the sale will flow to us. All of these criteria are generally met by the time the significant risks and rewards of ownership pass to the customer. Royalties related to production are recorded in cost of sales.
For sales of steelmaking coal and a majority of sales of metal concentrates, significant risks and rewards of ownership pass to the customer when the product is loaded onto a carrier specified by the customer. We generally retain title to these products until we receive the first contracted payment, solely to protect the collectibility of the amounts due to us, which are typically received shortly after loading. A minority of metal concentrate sales are made on consignment. For these transactions, significant risks and rewards of ownership pass to the customer at the time the product is consumed in the customer’s processes.
For sales of refined metal, significant risks and rewards of ownership generally pass to the customer when the product is loaded onto a carrier specified by the customer. For these products, loading generally coincides with the transfer of title.
Pricing agreements
Steelmaking coal is sold under spot, quarterly or annual pricing contracts, and pricing is final when the product is delivered.
The majority of our cathode and metal concentrates are sold under pricing arrangements where final prices are determined by quoted market prices in a period subsequent to the date of sale. For these sales, the price is determined on a provisional basis at the date of sale and revenue is recorded at that time based on current market prices.
Adjustments are made to the customer receivables in subsequent periods based on movements in quoted market prices up to the date of final pricing. As a result, the value of our cathode and concentrate sales receivables changes as the underlying commodity market prices vary and this adjustment mechanism has the characteristics of a derivative. Accordingly, the fair value of the embedded derivative is adjusted each reporting period by reference to forward market prices and the changes in fair value are recorded as an adjustment to other operating income (expense).
Streaming transactions
The treatment of upfront and ongoing payments received from counterparties under streaming arrangements depends on the specific terms of the arrangement. For arrangements we have entered into to date, we consider these transactions to be a disposition of a portion of the associated mineral properties, and therefore do not recognize revenue for payments received under these arrangements. Any deferred consideration recorded for streaming transactions and any ongoing payments received from our streaming transactions are recognized in profit (loss) as a reduction of cost of sales as deliveries are made under the respective streaming transaction.
3. Summary of Significant Accounting Policies (continued)
65Consolidated Financial Statements
Financial Instruments
We recognize financial assets and liabilities on the balance sheet when we become a party to the contractual provisions of the instrument.
Cash and cash equivalents
Cash and cash equivalents include cash on account, demand deposits and money market investments with maturities from the date of acquisition of three months or less, which are readily convertible to known amounts of cash and are subject to insignificant changes in value. Cash is classified as loans and receivables. Cash equivalents are classified as available-for-sale.
Trade receivables and payables
Trade receivables and payables are non-interest bearing if paid when due and are recognized at face amount, except when fair value is materially different, and are subsequently measured at amortized cost. Where necessary, trade receivables are net of allowances for uncollectible amounts.
Investments in marketable securities
Investments in marketable securities are classified as available-for-sale and recorded at fair value. Fair values are determined by reference to quoted market prices at the balance sheet date. Unrealized gains and losses on available-for-sale investments are recognized in other comprehensive income until investments are disposed of or when there is objective evidence of an impairment in value. Investment transactions are recognized on the trade date with transaction costs included in the underlying balance.
At each balance sheet date, we assess for any objective evidence of an impairment in value of our investments and record such impairments in non-operating income (expense) for the period. If an impairment of an investment in a marketable equity security has been recorded in profit (loss), that loss cannot be reversed through profit (loss) in future periods prior to sale.
Debt
Debt is initially recorded at fair value, less transaction costs. Debt is subsequently measured at amortized cost, calculated using the effective interest rate method.
Derivative instruments
Derivative instruments, including embedded derivatives, are classified as at fair value through profit or loss and, accordingly, are recorded on the balance sheet at fair value. Unrealized gains and losses on derivatives held for trading are recorded as part of other operating income (expense) or non-operating income (expense) in profit depending on the nature of the derivative. Fair values for derivative instruments are determined using inputs based on market conditions existing at the balance sheet date or settlement date of the derivative. Derivatives embedded in non-derivative contracts are recognized separately unless they are closely related to the host contract.
Hedging
Certain derivative investments may qualify for hedge accounting. For fair value hedges, any gains or losses on both the hedged item and the hedging instrument are recognized in the same line item in profit (loss).
For cash flow hedges, any unrealized gains and losses on the hedging instrument relating to the effective portion of the hedge are initially recorded in other comprehensive income. Gains and losses are recognized in profit (loss) upon settlement of the hedging instrument, when the hedged item ceases to exist, or when the hedge is determined to be ineffective.
For hedges of net investments in foreign operations, any foreign exchange gains or losses on the hedging instrument relating to the effective portion of the hedge are initially recorded in other comprehensive income. Gains and losses are recognized in profit (loss) on the ineffective portion of the hedge, or when there is a disposition or partial disposition of a foreign operation being hedged.

Notes to Consolidated Financial Statements Years ended December 31, 2016 and 2015
66 Teck 2016 Annual Report | Every Day
Inventories
Finished products, work in-process, raw materials and supplies inventories are valued at the lower of weighted average cost and net realizable value. Raw materials include concentrates for use at smelting and refining operations. Work in-process inventory includes inventory in the milling, smelting or refining process and stockpiled ore at mining operations.
For work in-process and finished product inventories, cost includes all direct costs incurred in production, including direct labour and materials, freight, depreciation and amortization and directly attributable overhead costs. Production stripping costs that are not capitalized are included in the cost of inventories as incurred. Depreciation and amortization of capitalized production stripping costs are included in the cost of inventory.
When inventories have been written down to net realizable value, we make a new assessment of net realizable value in each subsequent period. If the circumstances that caused the write-down no longer exist, the remaining amount of the write-down is reversed.
We use both joint-product and by-product costing for work in-process and finished product inventories. Joint-product costing is applied where the profitability of the operations is dependent upon the production of a number of primary products. Joint-product costing allocates total production costs based on the relative values of the products. Where by-product costing is used, by-products are allocated only the incremental costs of processes that are specific to the production of that product.
Supplies inventory is valued at the lower of weighted average cost and net realizable value. Cost includes acquisition, freight and other directly attributable costs.
Property, Plant and Equipment
Land, buildings, plant and equipment
Land is recorded at cost and buildings, plant and equipment are recorded at cost less accumulated depreciation and impairment losses. Cost includes the purchase price and the directly attributable costs to bring the assets to the location and condition necessary for them to be capable of operating in the manner intended by management.
Depreciation of mobile equipment, buildings used for production, and plant and processing equipment at our mining operations is calculated on a units-of-production basis. Depreciation of buildings not used for production, and of plant and equipment at our smelting operations is calculated on a straight-line basis over the assets’ estimated useful lives. Where components of an asset have different useful lives, depreciation is calculated on each component separately. Depreciation commences when an asset is ready for its intended use. Estimates of remaining useful lives and residual values are reviewed annually. Changes in estimates are accounted for prospectively.
The expected useful lives are as follows:• Buildings and equipment (not used in production) 2–40 years• Plant and equipment (smelting operations) 3–30 years
3. Summary of Significant Accounting Policies (continued)

67Consolidated Financial Statements
Mineral properties and mine development costs
The cost of acquiring and developing mineral properties or property rights, including pre-production waste rock stripping costs related to mine development and costs incurred during production to increase future output, are capitalized.
Waste rock stripping costs incurred in the production phase of a surface mine are recorded as capitalized production stripping costs within property, plant and equipment when it is probable that the stripping activity will improve access to the orebody when the component of the orebody or pit to which access has been improved can be identified, and when the costs relating to the stripping activity can be measured reliably. When the actual waste-to-ore stripping ratio in a period is greater than the expected life-of-component waste-to-ore stripping ratio for that component, the excess is recorded as capitalized production stripping costs.
Once available for use, mineral properties and mine development costs are depreciated on a units-of-production basis over the proven and probable reserves to which they relate. Since the stripping activity within a component of a mine generally only improves access to the reserves of the same component, capitalized production stripping costs incurred during the production phase of a mine are depreciated on a units-of-production basis over the proven and probable reserves expected to be mined from the same component.
Underground mine development costs are depreciated using the block depreciation method, where development costs associated with each distinct section of the mine are depreciated over the reserves to which they relate.
Exploration and evaluation costs
Property acquisition costs are capitalized. Other exploration and evaluation costs are capitalized if they relate to specific properties for which resources, as defined under National Instrument 43-101, exist or are near a specific property with a defined resource and it is expected that the expenditure can be recovered by future exploitation or sale. All other costs are charged to profit (loss) in the year in which they are incurred. Capitalized exploration and evaluation costs are considered to be tangible assets. These assets are not depreciated as they are not currently available for use. When proven and probable reserves are determined and development is approved, capitalized exploration and evaluation costs are reclassified to mineral properties within property, plant and equipment.
Development costs of oil sands properties
The costs of acquiring, exploring, evaluating and developing oil sands properties are capitalized when it is expected that these costs will be recovered through future exploitation or sale of the property. Capitalized development costs of oil sands properties are tangible assets. These assets are not depreciated as they are not currently available for use. When proven and probable reserves are determined and development is approved, capitalized development costs for oil sands properties are reclassified to mineral properties within property, plant and equipment.
Construction in-progress
Assets in the course of construction are capitalized as construction in-progress. On completion, the cost of construction is transferred to the appropriate category of property, plant and equipment, and depreciation commences when the asset is available for its intended use.
Impairment of non-current assets
The carrying amounts of assets included in property, plant and equipment are reviewed for impairment whenever facts and circumstances indicate that the carrying amounts are less than the recoverable amounts. If there are indicators of impairment, the recoverable amount of the asset is estimated in order to determine the extent of any impairment. Where the asset does not generate cash flows that are independent from other assets, the recoverable amount of the cash-generating unit (CGU) to which the asset belongs is determined. The recoverable amount of an asset or CGU is determined as the higher of its fair value less costs of disposal and its value in use. An impairment loss exists if the asset’s or CGU’s carrying amount exceeds the recoverable amount, and is recorded as an expense immediately.

Notes to Consolidated Financial Statements Years ended December 31, 2016 and 2015
68 Teck 2016 Annual Report | Every Day
Fair value is the price that would be received from selling an asset in an orderly transaction between market participants at the measurement date. Costs of disposal are incremental costs directly attributable to the disposal of an asset. For mining assets, when a binding sale agreement is not readily available, fair value less costs of disposal is estimated using a discounted cash flow approach. Estimated future cash flows are calculated using estimated future commodity prices, mineral reserves and resources, and operating and capital costs. All inputs used are those that an independent market participant would consider appropriate. Value in use is determined as the present value of the future cash flows expected to be derived from continuing use of an asset or CGU in its present form. These estimated future cash flows are discounted to their present value using a pre-tax discount rate that reflects current market assessments of the time value of money and the risks specific to the asset or CGU for which estimates of future cash flows have not been adjusted.
Indicators of impairment and impairment of exploration and evaluation assets or oil sands development costs are assessed on a project-by-project basis or as part of the existing operation to which they relate.
Tangible assets that have been impaired in prior periods are tested for possible reversal of impairment whenever events or significant changes in circumstances indicate that the impairment has reversed. Indicators of a potential reversal of an impairment loss mainly mirror the indicators present when the impairment was originally recorded. If the impairment has reversed, the carrying amount of the asset is increased to its recoverable amount, but not beyond the carrying amount that would have been determined, net of depreciation, had no impairment loss been recognized for the asset in the prior periods. A reversal of an impairment loss is recognized into profit immediately.
Repairs and maintenance
Repairs and maintenance costs, including shutdown maintenance costs, are charged to expense as incurred, except when these repairs significantly extend the life of an asset or result in a significant operating improvement. In these instances, the portion of these repairs relating to the betterment is capitalized as part of plant and equipment.
Borrowing costs
We capitalize borrowing costs that are directly attributable to the acquisition, construction or production of an asset that takes a substantial period of time to construct or prepare for its intended use. We begin capitalizing borrowing costs when there are general or specific borrowings, expenditures are incurred, and activities are undertaken to prepare the asset for its intended use. The amount of borrowing costs capitalized cannot exceed the actual amount of borrowing costs incurred during the period. All other borrowing costs are expensed as incurred.
We discontinue the capitalization of borrowing costs when substantially all of the activities necessary to prepare the qualifying asset for its intended use or sale are complete. In addition, we cease capitalization of borrowing costs when there is suspension of activities to prepare an asset for its intended use or sale. Capitalization recommences when the activities are restarted. Capitalized borrowing costs are amortized over the useful life of the related asset.
Leased assets
Leased assets from which we receive substantially all of the risks and rewards of ownership of the asset are capitalized as finance leases at the lower of the fair value of the asset or the estimated present value of the minimum lease payments. The corresponding lease obligation is recorded within debt on the balance sheet.
Assets under operating leases are not capitalized, and rental payments are expensed based on the terms of the lease.
3. Summary of Significant Accounting Policies (continued)

69Consolidated Financial Statements
Goodwill
We allocate goodwill arising from business combinations to each CGU or group of CGUs that are expected to receive the benefits from the business combination. The carrying amount of the CGU or group of CGUs to which goodwill has been allocated is tested annually for impairment or when there is an indication that the goodwill may be impaired. Any impairment is recognized as an expense immediately. Should there be a recovery in the value of a CGU, any impairment of goodwill previously recorded is not subsequently reversed.
Income Taxes
Taxes, comprising both income taxes and resource taxes, are accounted for as income taxes under IAS 12, Income Taxes and are recognized in the statement of income (loss), except where they relate to items recognized in other comprehensive income (loss) or directly in equity, in which case the related taxes are recognized in other comprehensive income (loss) or equity.
Current taxes receivable or payable are based on estimated taxable income for the current year at the statutory tax rates enacted or substantively enacted less amounts paid or received on account.
Deferred tax assets and liabilities are recognized based on temporary differences (the difference between the tax and accounting values of assets and liabilities) and are calculated using enacted or substantively enacted tax rates for the periods in which the differences are expected to reverse. The effect of tax rate changes is recognized in the period of substantive enactment.
Deferred tax assets are recognized only to the extent that it is probable that future taxable profits of the relevant entity or group of entities in a particular jurisdiction will be available, against which the assets can be utilized.
Deferred tax liabilities are recognized for taxable temporary differences arising on investments in subsidiaries, joint ventures and associates. However, we do not recognize such deferred tax liabilities where the timing of the reversal of the temporary differences can be controlled without affecting our operations or business and it is probable that the temporary differences will not reverse in the foreseeable future.
Deferred tax assets and liabilities are not recognized if the temporary differences arise from the initial recognition of goodwill or an asset or liability in a transaction, other than in a business combination, which will affect neither accounting profit nor taxable profit.
We are subject to assessments by various taxation authorities, who may interpret tax legislation differently than we do. The final amount of taxes to be paid depends on a number of factors, including the outcomes of audits, appeals or negotiated settlements. We account for such differences based on our best estimate of the probable outcome of these matters.
Employee Benefits
Defined benefit pension plans
Defined benefit pension plan obligations are based on actuarial determinations. The projected unit credit method, which sees each period of service as giving rise to an additional unit of benefit entitlement and measures each unit separately to build up the final obligation, is used to determine the defined benefit obligations, the related current service costs and, where applicable, the past service costs. Actuarial assumptions used in the determination of defined benefit pension plan assets and liabilities are based upon our best estimates, including discount rates, salary escalation, expected health care costs and retirement dates of employees.
Vested and unvested costs arising from past service following the introduction of changes to a defined benefit plan are recognized immediately as an expense when the changes are made.

Notes to Consolidated Financial Statements Years ended December 31, 2016 and 2015
70 Teck 2016 Annual Report | Every Day
Actuarial gains and losses can arise from differences between expected and actual outcomes or changes in actuarial assumptions. Actuarial gains and losses, changes in the effect of asset ceiling rules and return on plan assets are collectively referred to as remeasurements of retirement benefit plans and are recognized immediately through other comprehensive income (loss) and directly into retained earnings. Measurement of our net defined benefit asset is limited to the lower of the surplus in the defined benefit plan and the asset ceiling. The asset ceiling is the funded status of the plan on an accounting basis, less the present value of the expected economic benefit available to us in the form of refunds from the plan or reductions in future contributions to the plan.
We apply one discount rate to the net defined benefit asset or liability for the purposes of determining the interest component of the defined benefit cost. This interest component is recorded as part of finance expense. Depending on the classification of the salary of plan members, current service costs and past service costs are included in either operating expenses or general and administration expenses.
Defined contribution pension plans
The cost of providing benefits through defined contribution plans is charged to profit (loss) as the obligation to contribute is incurred.
Non-pension post-retirement plans
We provide health care benefits for certain employees when they retire. Non-pension post-retirement plan obligations are based on actuarial determinations. The cost of these benefits is expensed over the period in which the employees render services. We fund these non-pension post-retirement benefits as they become due.
Termination benefits
We recognize a liability and an expense for termination benefits when we have demonstrably committed to either terminate employees before their normal retirement date or provide termination benefits as a result of an offer made in order to encourage voluntary retirement. We are demonstrably committed to a termination when, and only when, there is a formal plan for the termination with no realistic possibility of withdrawal. The plan should include, at a minimum, the location, function and approximate number of employees whose services are to be terminated, the termination benefits for each job classification or function, and the time at which the plan will be implemented without significant changes.
Share-Based Payments
The fair value method of accounting is used for share-based payment transactions. Under this method, the cost of share options and other equity-settled share-based payment arrangements is recorded based on the estimated fair value at the grant date, including an estimate of the forfeiture rate, and charged to other operating income (expense) over the vesting period. For employees eligible for normal retirement prior to vesting, the expense is charged to other operating income (expense) over the period from the grant date to the date they are eligible for retirement.
Share-based payment expense relating to cash-settled awards, including deferred, restricted and performance share units, is accrued over the vesting period of the units based on the quoted market value of Class B subordinate voting shares. Performance share units have an additional vesting factor determined by our total shareholder return in comparison to a group of specified companies. As these awards will be settled in cash, the expense and liability are adjusted each reporting period for changes in the underlying share price. Our performance share units are also adjusted by the vesting factor relating to our total shareholder return in comparison to the group of specified companies.
3. Summary of Significant Accounting Policies (continued)

71Consolidated Financial Statements
Share Repurchases
Where we repurchase any of our equity share capital, the excess of the consideration paid over book value is deducted from contributed surplus and retained earnings on a pro rata basis.
Provisions
Decommissioning and restoration provisions
Future obligations to retire an asset and to restore a site, including dismantling, remediation and ongoing treatment and monitoring of the site related to normal operations are initially recognized and recorded as a provision based on estimated future cash flows discounted at a credit-adjusted risk-free rate. This decommissioning and restoration provision is adjusted at each reporting period for changes to factors including the expected amount of cash flows required to discharge the liability, the timing of such cash flows and the discount rate.
The provisions are also accreted to full value over time through periodic charges to profit. This unwinding of the discount is charged to finance expense in the statement of income (loss).
The amount of the decommissioning and restoration provision initially recognized is capitalized as part of the related asset’s carrying value. The method of depreciation follows that of the underlying asset. For a closed site or where the asset that generated a decommissioning and restoration provision no longer exists, there is no longer any future benefit related to the costs and, as such, the amounts are expensed through other operating income (expense). For operating sites, a revision in estimates or a new disturbance will result in an adjustment to the provision with an offsetting adjustment to the capitalized asset retirement cost.
During the operating life of an asset, events such as infractions of environmental laws or regulations may occur. These events are not related to the normal operation of the asset. The costs associated with these provisions are accrued and charged to other operating income (expense) in the period in which the event giving rise to the liability occurs. Changes in the estimated liability resulting in an adjustment to the provision are also charged to other operating income (expense) in the period in which the estimate changes.
Other provisions
Provisions are recognized when a present legal or constructive obligation exists as a result of past events, and it is probable that an outflow of resources that can be reliably estimated will be required to settle the obligation. Where the effect is material, the provision is discounted using an appropriate credit-adjusted risk-free rate.
Research and Development
Research costs are expensed as incurred. Development costs are only capitalized when: the product or process is clearly defined; the technical feasibility has been established; the future market for the product or process is clearly defined; and we are committed, and have the resources, to complete the project.
Earnings per Share
Earnings per share is calculated based on the weighted average number of shares outstanding during the year. For diluted earnings per share, dilution is calculated based upon the net number of common shares issued should “in-the-money” options and warrants be exercised and the proceeds be used to repurchase common shares at the average market price in the year.

Notes to Consolidated Financial Statements Years ended December 31, 2016 and 2015
72 Teck 2016 Annual Report | Every Day
4. Critical Accounting Estimates and Judgments
In preparing these consolidated financial statements, we make estimates and judgments that affect the amounts recorded. Actual results could differ from our estimates. Our estimates and judgments are based on historical experience and other factors we consider to be reasonable, including expectations of future events. The judgments and other sources of estimation uncertainty that have a risk of resulting in a material adjustment to the carrying amounts of assets and liabilities within the next year are outlined below.
Impairment Testing
Judgment is required in assessing whether certain factors would be considered an indicator of impairment or impairment reversal. We consider both internal and external information to determine whether there is an indicator of impairment or impairment reversal present and, accordingly, whether impairment testing is required. When impairment testing is required, discounted cash flow models are used to determine the recoverable amount of respective assets. These models are prepared internally with assistance from third-party advisors when required. When market transactions for comparable assets are available, these are considered in determining the recoverable amount of assets. Significant assumptions used in preparing discounted cash flow models include commodity prices, reserves and resources, mine plans, operating costs, capital expenditures, discount rates, foreign exchange rates and inflation rates. Notes 13(a) and 14 outline the significant inputs used when performing goodwill and other asset impairment testing. These inputs are based on management’s best estimates of what an independent market participant would consider appropriate. Changes in these inputs may alter the results of impairment testing, the amount of the impairment charges or reversals recorded in the statement of income (loss) and the resulting carrying values of assets.
Joint Arrangements
We are a party to a number of arrangements over which we do not have control. Judgment is required in determining whether joint control over these arrangements exists and, if so, which parties have joint control and whether each arrangement is a joint venture or joint operation. In assessing whether we have joint control, we analyse the activities of each arrangement and determine which activities most significantly affect the returns of the arrangement over its life. These activities are determined to be the relevant activities of the arrangement. If unanimous consent is required over the decisions about the relevant activities, the parties whose consent is required would have joint control over the arrangement. The judgments around which activities are considered the relevant activities of the arrangement are subject to analysis by each of the parties to the arrangement and may be interpreted differently. When performing this assessment, we generally consider decisions about activities such as managing the asset while it is being designed, developed and constructed, during its operating life, and during the closure period. We may also consider other activities including the approval of budgets, expansion and disposition of assets, financing, significant operating and capital expenditures, appointment of key management personnel, representation on the board of directors, and other items. When circumstances or contractual terms change, we reassess the control group and the relevant activities of the arrangement.

73Consolidated Financial Statements
If we have joint control over the arrangement, an assessment of whether the arrangement is a joint venture or joint operation is required. This assessment is based on whether we have rights to the assets, and obligations for the liabilities, relating to the arrangement or whether we have rights to the net assets of the arrangement. In making this determination, we review the legal form of the arrangement, the terms of the contractual arrangement, and other facts and circumstances. In a situation where the legal form and the terms of the contractual arrangement do not give us rights to the assets and obligations for the liabilities, an assessment of other facts and circumstances is required, including whether the activities of the arrangement are primarily designed for the provision of output to the parties and whether the parties are substantially the only source of cash flows contributing to the arrangement. In such circumstances, we may consider the application of other facts and circumstances to conclude that a joint arrangement is a joint operation. This conclusion requires judgment and is specific to each arrangement. Other facts and circumstances have led us to conclude that Antamina and Fort Hills are joint operations for the purposes of our consolidated financial statements. The other facts and circumstances considered for both of these arrangements are the provisions for output to the parties of the joint arrangements. For both Antamina and Fort Hills, we will take our share of the output from the assets directly over the life of the arrangement. We have concluded that this, combined with other factors, gives us direct rights to the assets and obligations for the liabilities of these arrangements, proportionate to our ownership interests.
Streaming Transactions
When we enter into a long-term streaming arrangement linked to production at specific operations, judgment is required in assessing the appropriate accounting treatment of the transaction on the closing date and in future periods. We consider the specific terms of each arrangement to determine whether we have disposed of an interest in the reserves and resources of the respective operation. This assessment considers what the counterparty is entitled to and the associated risks and rewards attributable to them over the life of the operation. These include the contractual terms related to the total production over the life of the arrangement as compared to the expected production over the life of the mine, the percentage being sold, the percentage of payable metals produced, the commodity price referred to in the ongoing payment and any guarantee relating to the upfront payment if production ceases.
As for both of the streaming arrangements entered into in 2015 (Note 13(b) and Note 18), there is no guarantee associated with the upfront payment and we have concluded that we have effectively disposed of the interest in the gold and silver mineral interests at each of these operations over the life of the arrangement. Accordingly, we consider these arrangements a disposition of a mineral interest.
When the ongoing payment we receive is based on future commodity prices at the date deliveries are made, this may be considered an embedded derivative (Note 26(c)). The valuation of embedded derivatives in these arrangements is an area of estimation and is determined using discounted cash flow models. These models require a variety of inputs, including, but not limited to, contractual terms, market prices, forward curve prices, mine plans and discount rates. Changes in these assumptions could affect the carrying value of derivative assets or liabilities and the amount of unrealized gains or losses recognized in other operating income (expense).
Estimated Recoverable Reserves and Resources
Mineral reserve and resource estimates are based on various assumptions relating to operating matters as set forth in National Instrument 43-101, Standards of Disclosure for Mineral Projects. These include production costs, mining and processing recoveries, cut-off grades, long-term commodity prices and, in some cases, exchange rates, inflation rates and capital costs. Cost estimates are based on feasibility study estimates or operating history. Estimates are prepared by appropriately qualified persons, but will be affected by forecasted commodity prices, inflation rates, exchange rates, capital and production costs, and recoveries, among other factors. Estimated recoverable reserves and resources are used to determine the depreciation of property, plant and equipment at operating mine sites, in accounting for capitalized production stripping costs, in performing impairment testing, and in forecasting the timing of the payment of decommissioning and restoration costs. Therefore, changes in the assumptions used could affect the carrying value of assets, depreciation and impairment charges recorded in the statement of income (loss) and the carrying value of the decommissioning and restoration provision.

Notes to Consolidated Financial Statements Years ended December 31, 2016 and 2015
74 Teck 2016 Annual Report | Every Day
Decommissioning and Restoration Provisions
The decommissioning and restoration provision is based on future cost estimates using information available at the balance sheet date. The decommissioning and restoration provision is adjusted at each reporting period for changes to factors such as the expected amount of cash flows required to discharge the liability, the timing of such cash flows and the discount rate. The decommissioning and restoration provision requires other significant estimates and assumptions, including the requirements of the relevant legal and regulatory framework and the timing, extent and costs of required decommissioning and restoration activities. To the extent the actual costs differ from these estimates, adjustments will be recorded and the income statement may be affected.
Current and Deferred Taxes
We calculate current and deferred tax provisions for each of the jurisdictions in which we operate. Actual amounts of income tax expense are not final until tax returns are filed and accepted by the relevant authorities. This occurs subsequent to the issuance of our financial statements and the final determination of actual amounts may not be completed for a number of years. Therefore, profit (loss) in subsequent periods will be affected by the amount that estimates differ from the final tax return.
Judgment is required in assessing whether deferred tax assets and certain deferred tax liabilities are recognized on the balance sheet and what tax rate is expected to be applied in the year when the related temporary differences reverse, particularly in regard to the utilization of tax loss carry-forwards. We also evaluate the recoverability of deferred tax assets based on an assessment of our ability to use the underlying future tax deductions before they expire against future taxable income. Deferred tax liabilities arising from temporary differences on investments in subsidiaries, joint ventures and associates are recognized unless the reversal of the temporary differences is not expected to occur in the foreseeable future and can be controlled. Assumptions about the generation of future taxable profits and repatriation of retained earnings depend on management’s estimates of future production and sales volumes, commodity prices, reserves and resources, operating costs, decommissioning and restoration costs, capital expenditures, dividends and other capital management transactions. Judgment is also required on the application of income tax legislation. These estimates and judgments are subject to risk and uncertainty and could result in an adjustment to the deferred tax provision and a corresponding credit or charge to profit (loss).
4. Critical Accounting Estimates and Judgments (continued)

75Consolidated Financial Statements
5. Expenses by Nature
(CAD$ in millions) 2016 2015
Wage-related costs:
Wages and salaries $ 858 $ 913
Employee benefits and other wage-related costs 250 243
Bonus payments 162 125
Post-employment benefits and pension costs 112 94
1,382 1,375
Transportation 1,270 1,292
Depreciation and amortization 1,385 1,366
Raw material purchases 876 741
Fuel and energy 596 646
Operating supplies consumed 558 596
Maintenance and repair supplies 586 599
Contractors and consultants 427 482
Overhead costs 293 270
Royalties 312 198
Other operating costs 13 76
7,698 7,641
Less:
Capitalized production stripping costs (477) (663)
Change in inventory (137) 233
Total cost of sales, general and administration, exploration and research and development expenses $ 7,084 $ 7,211
Approximately 29% (2015 — 28%) of our costs are incurred at our foreign operations where the functional currency is the U.S. dollar.
6. Other Operating Income (Expense)
(CAD$ in millions) 2016 2015
Settlement pricing adjustments (Note 26(b)) $ 153 $ (280)
Share based compensation (171) (13)
Environmental and care and maintenance costs (144) (49)
Social responsibility and donations (25) (10)
Gain on sale of assets 62 74
Gain on formation of NuevaUnión (Note 12(a)) – 37
Commodity derivatives (Note 26(b) and Note 26(c)) 32 (12)
Restructuring (8) (22)
Take or pay contract costs (48) (13)
Other (48) (47)
$ (197) $ (335)

Notes to Consolidated Financial Statements Years ended December 31, 2016 and 2015
76 Teck 2016 Annual Report | Every Day
7. Finance Income and Finance Expense
(CAD$ in millions) 2016 2015
Finance income
Investment income $ 16 $ 5
Total finance income $ 16 $ 5
Finance expense
Debt interest $ 476 $ 442
Letters of credit and standby fees 62 20
Net interest expense on retirement benefit plans 14 13
Accretion on decommissioning and restoration provisions (Note 20(a)) 55 59
Other 13 4
620 538
Less capitalized borrowing costs (Note 13(e)) (266) (222)
Total finance expense $ 354 $ 316
8. Non-Operating Income (Expense)
(CAD$ in millions) 2016 2015
Foreign exchange gains (losses) $ 46 $ (76)
Provision for marketable securities (3) (21)
Gain on debt prepayment options (Note 26(c)) 113 –
Gain on sale of investments 34 8
Gain on debt repurchases (Note 16(a) and Note 16(b)) 49 –
$ 239 $ (89)

77Consolidated Financial Statements
9. Supplemental Cash Flow Information
December 31, December 31, (CAD$ in millions) 2016 2015
Cash and cash equivalents
Cash $ 254 $ 247
Investments with maturities from the date of acquisition of three months or less 1,153 1,640
$ 1,407 $ 1,887
(CAD$ in millions) 2016 2015
Net change in non-cash working capital items
Trade accounts receivable $ (480) $ 18
Inventories (86) 242
Trade accounts payable and other liabilities 206 (46)
$ (360) $ 214
Non-cash financing and investing transactions Formation of NuevaUnión (Note 12(a)) $ – $ 486
10. Inventories
December 31, December 31, (CAD$ in millions) 2016 2015
Supplies $ 586 $ 638
Raw materials 204 198
Work in-process 521 432
Finished products 449 408
1,760 1,676
Less long-term portion (Note 11) (87) (56)
$ 1,673 $ 1,620
Cost of sales of $6.9 billion (2015 — $7.0 billion) include $6.3 billion (2015 — $6.5 billion) of inventories recognized as an expense during the year.
Total inventories held at net realizable value amounted to $53 million at December 31, 2016 (December 31, 2015 — $352 million). Total inventory write-downs in 2016 were $7 million (2015 — $127 million), and were included as part of cost of sales. Of the $127 million of inventory write-downs in 2015, $6 million was included as part of other operating expenses as they related to the closed Duck Pond mine. Total reversals of inventory write-downs previously recorded were $23 million in 2016 (2015 — $nil) as a result of an increase in net realizable value primarily relating to commodity price increases. These reversals were included as part of cost of sales.
Long-term inventories consist of ore stockpiles and other in-process materials that are not expected to be processed within one year.
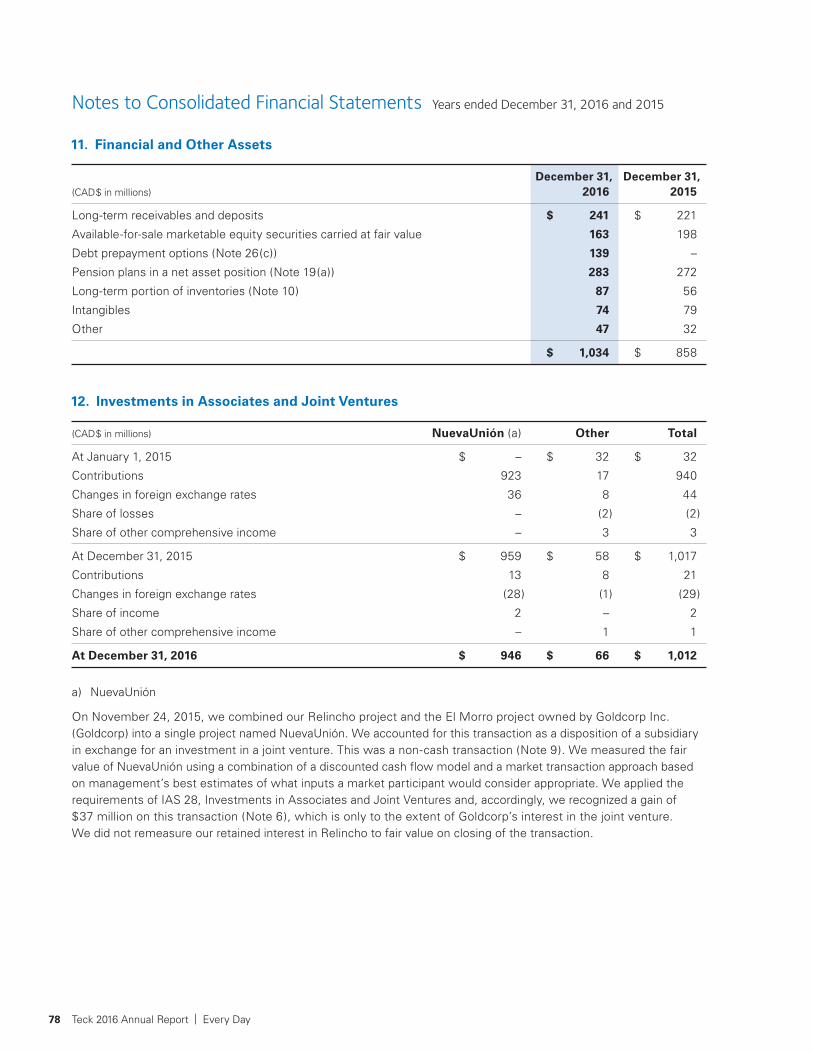
Notes to Consolidated Financial Statements Years ended December 31, 2016 and 2015
78 Teck 2016 Annual Report | Every Day
11. Financial and Other Assets
December 31, December 31, (CAD$ in millions) 2016 2015
Long-term receivables and deposits $ 241 $ 221
Available-for-sale marketable equity securities carried at fair value 163 198
Debt prepayment options (Note 26(c)) 139 –
Pension plans in a net asset position (Note 19(a)) 283 272
Long-term portion of inventories (Note 10) 87 56
Intangibles 74 79
Other 47 32
$ 1,034 $ 858
12. Investments in Associates and Joint Ventures
(CAD$ in millions) NuevaUnión (a) Other Total
At January 1, 2015 $ – $ 32 $ 32
Contributions 923 17 940
Changes in foreign exchange rates 36 8 44
Share of losses – (2) (2)
Share of other comprehensive income – 3 3
At December 31, 2015 $ 959 $ 58 $ 1,017
Contributions 13 8 21
Changes in foreign exchange rates (28) (1) (29)
Share of income 2 – 2
Share of other comprehensive income – 1 1
At December 31, 2016 $ 946 $ 66 $ 1,012
a) NuevaUnión
On November 24, 2015, we combined our Relincho project and the El Morro project owned by Goldcorp Inc. (Goldcorp) into a single project named NuevaUnión. We accounted for this transaction as a disposition of a subsidiary in exchange for an investment in a joint venture. This was a non-cash transaction (Note 9). We measured the fair value of NuevaUnión using a combination of a discounted cash flow model and a market transaction approach based on management’s best estimates of what inputs a market participant would consider appropriate. We applied the requirements of IAS 28, Investments in Associates and Joint Ventures and, accordingly, we recognized a gain of $37 million on this transaction (Note 6), which is only to the extent of Goldcorp’s interest in the joint venture. We did not remeasure our retained interest in Relincho to fair value on closing of the transaction.

79Consolidated Financial Statements
13. Property, Plant and Equipment
Land, Capitalized Exploration Buildings, Production and Mineral Plant and Stripping Construction (CAD$ in millions) Evaluation Properties Equipment Costs In-Progress Total
At December 31, 2014
Cost $ 2,268 $ 19,561 $ 12,021 $ 2,916 $ 2,977 $ 39,743
Accumulated depreciation – (4,151) (5,553) (1,114) – (10,818)
Net book value $ 2,268 $ 15,410 $ 6,468 $ 1,802 $ 2,977 $ 28,925
Year ended December 31, 2015
Opening net book value $ 2,268 $ 15,410 $ 6,468 $ 1,802 $ 2,977 $ 28,925
Additions 39 129 374 726 1,048 2,316
Disposals (Note 12(a) and Note 13(b)) (827) (206) (12) – – (1,045)
Impairment (a) – (1,885) (10) – (1,062) (2,957)
Depreciation and amortization – (404) (571) (464) – (1,439)
Decommissioning and restoration provision change in estimate – (476) (38) – – (514)
Capitalized borrowing costs – 80 – – 142 222
Other – (3) (12) – – (15)
Changes in foreign exchange rates 120 580 435 82 81 1,298
Closing net book value $ 1,600 $ 13,225 $ 6,634 $ 2,146 $ 3,186 $ 26,791
At December 31, 2015
Cost 1,600 18,001 13,208 3,761 3,186 39,756
Accumulated depreciation – (4,776) (6,574) (1,615) – (12,965)
Net book value $ 1,600 $ 13,225 $ 6,634 $ 2,146 $ 3,186 $ 26,791

Notes to Consolidated Financial Statements Years ended December 31, 2016 and 2015
80 Teck 2016 Annual Report | Every Day
Land, Capitalized Exploration Buildings, Production and Mineral Plant and Stripping Construction (CAD$ in millions) Evaluation Properties Equipment Costs In-Progress Total
Year ended December 31, 2016
Opening net book value $ 1,600 $ 13,225 $ 6,634 $ 2,146 $ 3,186 $ 26,791
Additions 24 47 173 531 1,112 1,887
Disposals – – (10) – – (10)
Impairment (a) – – (26) – (268) (294)
Depreciation and amortization – (356) (657) (500) – (1,513)
Transfers between classifications – – 276 – (276) –
Decommissioning and restoration provision change in estimate – 633 26 – – 659
Capitalized borrowing costs – 91 – – 175 266
Other (9) – (6) – – (15)
Changes in foreign exchange rates (2) (78) (58) (16) (22) (176)
Closing net book value $ 1,613 $ 13,562 $ 6,352 $ 2,161 $ 3,907 $ 27,595
At December 31, 2016
Cost $ 1,613 $ 18,667 $ 13,517 $ 4,269 $ 3,907 $ 41,973
Accumulated depreciation – (5,105) (7,165) (2,108) – (14,378)
Net book value $ 1,613 $ 13,562 $ 6,352 $ 2,161 $ 3,907 $ 27,595
a) Asset Impairments
Year Ended December 31, 2016
During the year ended December 31, 2016, we recorded asset impairments of $294 million, of which $222 million related to the Fort Hills project, $46 million related to a project at our Trail Operations that will not be completed and $26 million related to the Wintering Hills Wind Power Facility, which we have entered into an agreement to sell and expect to close in the first quarter of 2017.
As a result of changes in reported reserves and resources at Carmen de Andacollo and an increase in future development costs associated with the Fort Hills project, we performed a detailed review of the recoverable amounts of these CGUs as at December 31, 2016. We estimated the recoverable amount of these CGUs on a fair value less costs of disposal basis (FVLCD) using a discounted cash flow methodology and taking into account assumptions likely to be made by market participants. This is classified as a Level 3 measurement within the fair value measurement hierarchy (Note 27).
We have determined that the estimated recoverable amount of Carmen de Andacollo exceeded its carrying value as at December 31, 2016 and accordingly, no impairment charge was recorded.
We have estimated a post-tax recoverable amount for Fort Hills of $2.52 billion, which was lower than the carrying value as at December 31, 2016. Accordingly, we have recorded a pre-tax impairment of our property, plant and equipment through profit (loss) of $222 million (post-tax $164 million). This affects the profit (loss) of our Energy segment (Note 25).
Cash flow projections were based on current life of mine plans and exploration potential for both CGUs. For Carmen de Andacollo, the cash flows cover a period of 44 years. Fort Hills cash flows cover a period of 44 years.
13. Property, Plant and Equipment (continued)

81Consolidated Financial Statements
The key inputs used to estimate the FVLCD of Carmen de Andacollo and Fort Hills as at December 31, 2016 were derived in the same manner as those inputs used in our 2016 goodwill impairment testing as outlined in Note 14 and include the following:
Commodity Prices
For copper and Western Canadian Select (WCS) oil prices, we used the current price in the initial year and gradually escalated that over the following three years, reaching real long-term prices in 2021 of US$3.00 per pound and US$57 per barrel for WCS oil.
Discount Rates
A 6.0% real, 8.1% nominal post-tax discount rate was used to discount cash flow projections for Carmen de Andacollo based on a mining weighted average cost of capital. A 5.5% real, 7.6% nominal post-tax discount rate was used to discount cash flow projections for the Fort Hills project based on an oils sands weighted average cost of capital.
Foreign Exchange Rates
The long-term Canadian-U.S. dollar foreign exchange rate assumption used from 2021 onwards was 1 U.S. dollar to 1.25 Canadian dollars.
Inflation Rates
The inflation rate for all FVLCD calculations was 2%.
Sensitivity Analysis
We noted impairment indicators at Carmen de Andacollo and Fort Hills and the recoverable amounts of the associated CGUs have been estimated. The recoverable amount of Carmen de Andacollo exceeded its carrying value and we did not record an impairment charge. We have adjusted the carrying value of Fort Hills down to its recoverable amount as at December 31, 2016.
These recoverable amounts are most sensitive to changes in long-term copper and WCS oil prices, the Canadian-U.S. dollar exchange rates (for Fort Hills) and discount rates. The key inputs used in our determination of recoverable amounts interrelate significantly with each other and with our operating plans. For example, a decrease in long-term commodity prices would result in us making amendments to the mine plans that would partially offset the effect of lower prices through lower operating and capital costs. It is difficult to determine how all of these factors would interrelate, but in estimating the effect of changes in these assumptions on fair values, we believe that all of these factors need to be considered together. A linear extrapolation of these effects becomes less meaningful as the change in assumption increases.
Fort Hills has been written down to its recoverable amount. Ignoring the above described interrelationships, in isolation a US$1 decrease in the long-term WCS oil price would result in an additional reduction in the recoverable amount of $120 million. A $0.01 strengthening of the Canadian dollar against the U.S. dollar would result in an additional reduction in the recoverable amount of $42 million. A 25 basis point increase in the discount rate would result in an additional reduction in the recoverable amount of approximately $120 million.
Carmen de Andacollo was written down to its recoverable amount as at December 31, 2015 and the estimated recoverable amount has not changed significantly since that date. Accordingly, the recoverable amount is sensitive to any change in the long-term copper price assumption or discount rate. Ignoring the above described interrelationships, in isolation a US$0.01 decrease in the long-term copper price and a 25 basis point increase in the discount rate would result in a reduction in the recoverable amount of approximately $13 million and $19 million, respectively.

Notes to Consolidated Financial Statements Years ended December 31, 2016 and 2015
82 Teck 2016 Annual Report | Every Day
Year Ended December 31, 2015
In light of economic conditions in the third and fourth quarters of 2015, we identified CGUs with carrying values that exceeded the estimated recoverable amounts and recorded impairments. The FVLCD was estimated using a discounted cash flow methodology taking into account assumptions likely to be made by market participants, which is classified as a Level 3 estimate within the fair value measurement hierarchy (Note 27).
The impairment charges recorded during the year ended December 31, 2015 in each reportable segment are as follows:
Reportable Segment Steelmaking Coal Copper Zinc Energy
Steelmaking Coal Carmen de PendCash-generating unit Assets CGU Andacollo Oreille Fort Hills
Steelmaking Coal Copper Mine Zinc Mine Oil SandsNature of the asset Mines in Canada in Chile in U.S. in Canada
(CAD$ in millions)
Post-tax recoverable amount $ 9,969 $ 954 $ 49 $ 1,786
Post-tax impairment of property, plant and equipment $ 981 $ 231 $ 19 $ 785
Post-tax impairment of goodwill (Note 14) 501 174 – –
Total post-tax impairment $ 1,482 $ 405 $ 19 $ 785
Steelmaking Coal Carmen de Pend (CAD$ in millions) Assets CGU Andacollo Oreille Fort Hills Total
Impairment recorded in profit (loss) $ 2,032 $ 506 $ 31 $ 1,062 $ 3,631
Less tax effect — recovery (550) (101) (12) (277) (940)
Post-tax impairment recorded in profit (loss) $ 1,482 $ 405 $ 19 $ 785 $ 2,691
The key inputs used to estimate the FVLCD of each CGU as at December 31, 2015, when indicators were identified, were derived in the same manner as those inputs used in our 2016 goodwill impairment testing as outlined in Note 14 and include the following:
Commodity Prices
For steelmaking coal, copper, zinc and WCS oil prices, we used the 2015 current price in the initial year and gradually escalated that over the following three years, reaching real long-term prices in 2020 of US$130 per tonne for steelmaking coal, US$3.00 per pound for copper, US$1.00 per pound for zinc and US$60 per barrel for WCS oil.
Discount Rates
A 6.2% real, 8.3% nominal post-tax discount rate was used to discount cash flow projections for all of our FVLCD discounted cash flow models as at December 31, 2015.
13. Property, Plant and Equipment (continued)

83Consolidated Financial Statements
Foreign Exchange Rates
The long-term Canadian-U.S. dollar foreign exchange rate assumption used from 2020 onwards was 1 U.S. dollar to 1.25 Canadian dollars.
Inflation Rates
The inflation rate for all FVLCD calculations was 2%.
b) Gold Stream Agreement
In 2015, Carmen de Andacollo sold an interest in gold reserves and resources from the Carmen de Andacollo mine (Andacollo mine) to RGLD Gold AG (RGLDAG), a wholly owned subsidiary of Royal Gold, Inc. Under the terms of the agreement, RGLDAG is entitled to an amount of gold equal to 100% of the payable gold produced from the Andacollo mine until 900,000 ounces have been delivered, and 50% thereafter. RGLDAG pays a cash price of 15% of the monthly average gold price at the time of each delivery. Carmen de Andacollo and Royal Gold Chile Limitada, a wholly owned subsidiary of Royal Gold, Inc., terminated an earlier agreement entered into in 2010. Under the terminated agreement, Royal Gold Chile Limitada was entitled to a payment based on 75% of payable gold produced from Andacollo mine until 910,000 ounces had been delivered, and 50% thereafter.
We received cash proceeds of $206 million (US$162 million) as a result of Carmen de Andacollo entering into the new agreement and terminating the separate agreement from 2010. We recorded the transaction on a net basis as a sale of an incremental mineral property interest, and the net consideration was accounted for as a recovery of mineral property costs. Accordingly, no gain or loss was recognized on the transaction. We account for the 15% ongoing payment as a reduction of our cost of sales and not as revenue, as we consider it to be payment for the mineral interest and mining and refining services. The 15% ongoing payment contains an embedded derivative relating to the gold price that is marked to market each period with changes flowing through profit (loss) (Note 26(c)).
c) Exploration and Evaluation
Significant exploration and evaluation projects include Galore Creek and oil sands properties.
d) Finance Leases
The carrying value of property, plant and equipment held under finance lease at December 31, 2016 is $220 million (2015 — $166 million). Ownership of leased assets remains with the lessor.
e) Borrowing Costs
Borrowing costs are capitalized at a rate based on our weighted average cost of borrowing or at the rate on the project-specific debt, as applicable. These projects are shown as part of mineral properties and leases, land, buildings, plant and equipment, or construction in-progress. Our weighted average borrowing rate used for capitalization of borrowing costs in 2016 was 5.7% (2015 — 5.0%).
14. Goodwill
Steelmaking Quebrada Carmen de (CAD$ in millions) Coal Operations Blanca Andacollo Total
January 1, 2015 $ 1,203 $ 356 $ 151 $ 1,710
Changes in foreign exchange rates – 69 23 92
Impairment (Note 13(a)) (501) – (174) (675)
December 31, 2015 $ 702 $ 425 $ – $ 1,127
Changes in foreign exchange rates – (13) – (13)
December 31, 2016 $ 702 $ 412 $ – $ 1,114

Notes to Consolidated Financial Statements Years ended December 31, 2016 and 2015
84 Teck 2016 Annual Report | Every Day
The allocation of goodwill to CGUs or groups of CGUs reflects how goodwill is monitored for internal management purposes.
In the third and fourth quarters of 2015, in light of market conditions, we recorded goodwill impairment of $675 million. The key inputs used in determining the impairments in 2015 were determined on a basis consistent with those outlined below and are summarized in Note 13(a).
In 2016, we performed our annual goodwill impairment testing at October 31 and did not identify any impairment losses. The recoverable amounts for our goodwill impairment testing were determined based on a FVLCD approach. The FVLCD was calculated using a discounted cash flow methodology taking account of assumptions that would be made by market participants.
Cash flow projections are based on expected mine life. For our steelmaking coal operations, the cash flows cover periods of 16 to 45 years with a steady state thereafter until reserves and resources are exhausted. For Quebrada Blanca, the cash flows cover a period of 25 years, with a steady state thereafter until reserves and resources are exhausted.
Given the nature of expected future cash flows used to determine the recoverable amount, a material change could occur over time as the cash flows are significantly affected by the key assumptions described below.
The key inputs, where applicable, used to estimate the FVLCD were determined as follows:
Commodity Prices
Commodity price assumptions are based on a number of factors, including forward curves in the near term, and are benchmarked with external sources of information, including information published by our peers and market transactions, where possible, to ensure they are within the range of values used by market participants.
For steelmaking coal, we used the current price in the initial year and gradually de-escalated the price, reaching a real long-term price in 2021 of US$130 per tonne. For copper, we used the current price in the initial year and gradually escalated the price, reaching a real long-term price in 2021 of US$3.00 per pound.
Reserves and Resources
Future mineral production is included in projected cash flows based on mineral reserve and resource estimates and on exploration and evaluation work undertaken by appropriately qualified persons.
Operating Costs and Capital Expenditures
Operating costs and capital expenditures are based on life of mine plans and internal management forecasts. Cost estimates incorporate management experience and expertise, current operating costs, the nature and location of each operation, and the risks associated with each operation. Future capital expenditures are based on management’s best estimate of expected future capital requirements, which are generally for the extraction and processing of existing reserves and resources. All committed and anticipated capital expenditures based on future cost estimates have been included in the projected cash flows. Operating cost and capital expenditure assumptions are continuously subjected to ongoing optimization and review by management.
Discount Rates
A 5.8% real, 7.9% nominal post-tax discount rate was used to discount cash flow projections for our goodwill FVLCD discounted cash flow models.
14. Goodwill (continued)
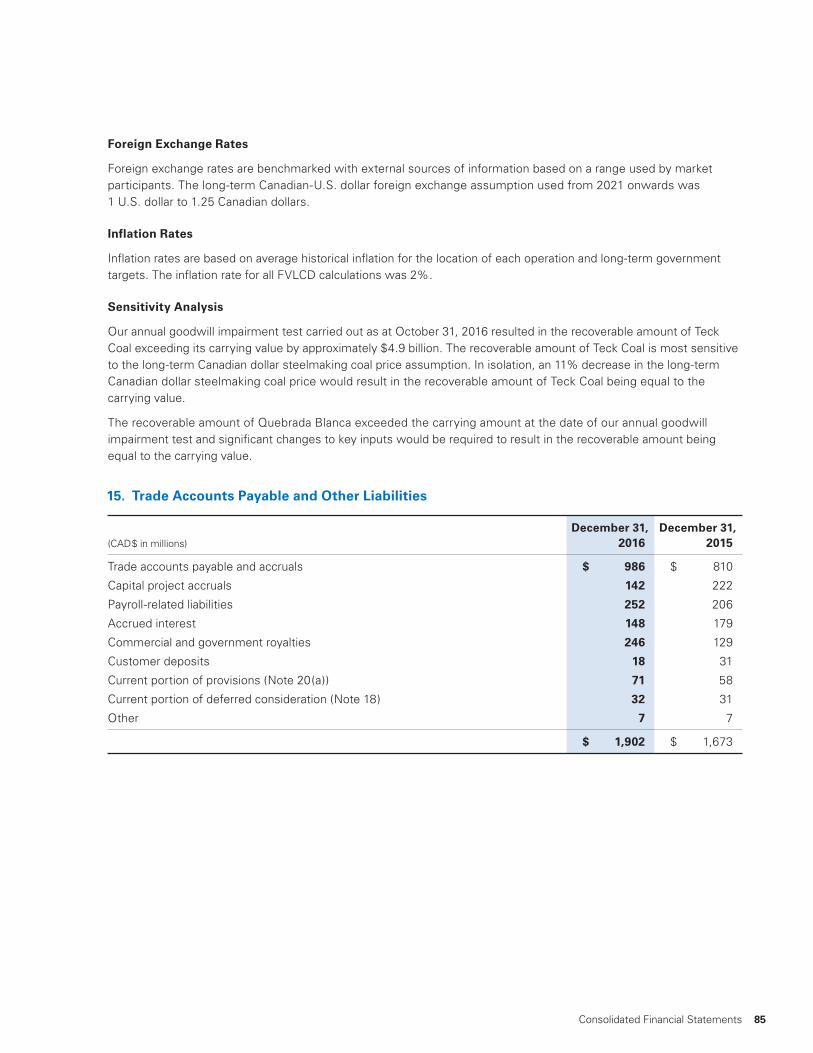
85Consolidated Financial Statements
Foreign Exchange Rates
Foreign exchange rates are benchmarked with external sources of information based on a range used by market participants. The long-term Canadian-U.S. dollar foreign exchange assumption used from 2021 onwards was 1 U.S. dollar to 1.25 Canadian dollars.
Inflation Rates
Inflation rates are based on average historical inflation for the location of each operation and long-term government targets. The inflation rate for all FVLCD calculations was 2%.
Sensitivity Analysis
Our annual goodwill impairment test carried out as at October 31, 2016 resulted in the recoverable amount of Teck Coal exceeding its carrying value by approximately $4.9 billion. The recoverable amount of Teck Coal is most sensitive to the long-term Canadian dollar steelmaking coal price assumption. In isolation, an 11% decrease in the long-term Canadian dollar steelmaking coal price would result in the recoverable amount of Teck Coal being equal to the carrying value.
The recoverable amount of Quebrada Blanca exceeded the carrying amount at the date of our annual goodwill impairment test and significant changes to key inputs would be required to result in the recoverable amount being equal to the carrying value.
15. Trade Accounts Payable and Other Liabilities
December 31, December 31, (CAD$ in millions) 2016 2015
Trade accounts payable and accruals $ 986 $ 810
Capital project accruals 142 222
Payroll-related liabilities 252 206
Accrued interest 148 179
Commercial and government royalties 246 129
Customer deposits 18 31
Current portion of provisions (Note 20(a)) 71 58
Current portion of deferred consideration (Note 18) 32 31
Other 7 7
$ 1,902 $ 1,673

Notes to Consolidated Financial Statements Years ended December 31, 2016 and 2015
86 Teck 2016 Annual Report | Every Day
16. Debt
(CAD$ in millions) December 31, 2016 December 31, 2015
Carrying Fair Carrying Fair Value Value Value Value
3.15% notes due January 2017 (US$34 million) (b) $ 45 $ 45 $ 415 $ 380
3.85% notes due August 2017 (US$16 million) (b) 21 21 413 354
2.5% notes due February 2018 (US$22 million) (b) 30 30 689 534
3.0% notes due March 2019 (US$278 million) (b) 372 375 689 431
4.5% notes due January 2021 (US$500 million) 668 685 688 364
8.0% notes due June 2021 (US$650 million) (b) 866 963 – –
4.75% notes due January 2022 (US$700 million) 936 951 964 474
3.75% notes due February 2023 (US$670 million) (a) 891 858 1,026 496
8.5% notes due June 2024 (US$600 million) (b) 806 935 – –
6.125% notes due October 2035 (US$609 million) (a) 804 801 952 440
6.0% notes due August 2040 (US$491 million) (a) 658 623 895 386
6.25% notes due July 2041 (US$795 million) (a) 1,055 1,043 1,368 623
5.2% notes due March 2042 (US$399 million) (a) 528 477 682 300
5.4% notes due February 2043 (US$377 million) (a) 500 450 684 340
Antamina term loan due April 2020 (c) 30 30 31 31
Other 133 133 138 138
8,343 8,420 9,634 5,291
Less current portion of debt (99) (99) (28) (28)
$ 8,244 $ 8,321 $ 9,606 $ 5,263
The fair values of debt are determined using market values, if available, and using discounted cash flows based on our cost of borrowing where market values are not available. The latter are considered Level 2 fair value measurements with significant other observable inputs on the fair value hierarchy (Note 27).

87Consolidated Financial Statements
a) Note Purchases
In September and October 2016, we purchased US$759 million aggregate principal amount of our outstanding notes through private and open market purchases. The principal amount of notes purchased was US$80 million of 3.75% notes due 2023, US$91 million of 6.125% notes due 2035, US$159 million of 6.00% notes due 2040, US$205 million of 6.25% notes due 2041, US$101 million of 5.20% notes due 2042 and US$123 million of 5.40% notes due 2043. The total cost of the purchases was US$693 million. We recorded a pre-tax accounting gain of $76 million (after-tax $67 million) in non-operating income (expense) (Note 8) in connection with these purchases for the year ended December 31, 2016. All private and open market purchases of our outstanding notes during 2016 were funded from cash on hand.
b) Notes Issued and Cash Tender Offers
In June 2016, we issued US$650 million of senior unsecured notes due June 2021 (June 2021 notes) and US$600 million of senior unsecured notes due June 2024 (2024 notes). The June 2021 notes have a coupon of 8.00% per annum and an effective interest rate, after taking into account issuance costs and the prepayment option value, of 8.22%. These notes were issued at par value and are callable on or after June 1, 2018 at predefined prices based on the date of redemption. Prior to June 1, 2018, the June 2021 notes can be redeemed, in whole or in part, at a redemption price equal to the principal amount plus accrued interest to, but not including, the date of redemption and a make-whole call premium. The 2024 notes have a coupon of 8.50% per annum and an effective interest rate, after taking into account issuance costs and the prepayment option value, of 8.49%. These notes were issued at par value and are callable on or after June 1, 2019 at predefined prices based on the date of redemption. Prior to June 1, 2019, the 2024 notes can be redeemed, in whole or in part, at a redemption price equal to the principal amount plus accrued interest to, but not including, the date of redemption and a make-whole call premium. Our obligations under these notes are guaranteed on a senior unsecured basis by TML, Teck Coal, Teck South American Holdings Ltd. (formerly Teck Financial Corporation Ltd.), TCL U.S. Holdings Ltd., TAK and Highland Valley Copper, each a wholly owned subsidiary of Teck. The 2016 indenture limits the aggregate amount of additional indebtedness for borrowed money that the subsidiary guarantors may guarantee or otherwise incur to 10% of consolidated net tangible assets, subject to certain specified exceptions.
Net proceeds from these issuances, after underwriting and issuance costs, were US$1.227 billion. We used these proceeds and cash on hand to purchase US$1.25 billion aggregate principal amount of our outstanding notes pursuant to cash tender offers. The principal amount of notes purchased pursuant to the tender offers was US$266 million of 3.15% notes due 2017, US$284 million of 3.85% notes due 2017, US$478 million of 2.50% notes due 2018 and US$222 million of 3.00% notes due 2019. The total cost of the purchases, including the premium for the purchase, was US$1.267 billion. We recorded a pre-tax accounting charge of $27 million (after-tax $23 million) in non-operating income (expense) on these transactions (Note 8) during the year ended December 31, 2016.
The June 2021 notes and 2024 notes include prepayment options that are considered to be embedded derivatives (Note 26(c)).
c) Antamina Term Loan
The Antamina term loan is our proportionate share of Antamina’s U.S. dollar denominated term loan, with full repayment due at maturity in April 2020. The Antamina term loan is the obligation of Antamina and is non-recourse to us and the other Antamina project sponsors. The term loan bears interest with reference to the London Interbank Offered Rate (LIBOR) plus an applicable margin.
d) Optional Redemptions
All of our outstanding notes, except the June 2021 notes and 2024 notes, are redeemable at any time by repaying the greater of the principal amount and the present value of the sum of the remaining scheduled principal and interest amounts discounted at a comparable treasury yield plus a stipulated spread, plus, in each case, accrued interest to, but not including, the date of redemption. In addition, the 2023, 2042 and 2043 notes issued in 2012 are callable at 100% (plus accrued interest to, but not including, the date of redemption) at any time on or after November 1, 2022, September 1, 2041, and August 1, 2042, respectively. The 2022 and 2041 notes issued in 2011 are callable at 100% at any time on or after October 15, 2021, and January 15, 2041, respectively. The January 2021 notes are callable at 100% on or after October 15, 2020, and the 2040 notes are callable at 100% on or after February 15, 2040. The June 2021 notes and 2024 notes issued during the year ended December 31, 2016 can be redeemed as described in (b).

Notes to Consolidated Financial Statements Years ended December 31, 2016 and 2015
88 Teck 2016 Annual Report | Every Day
e) Revolving Facilities
At December 31, 2016, we had two committed revolving credit facilities in the amounts of US$3.0 billion and US$1.2 billion, respectively. The US$3.0 billion facility is available until July 2020, includes a letter of credit sub-limit of US$1.0 billion and is undrawn at December 31, 2016. The US$1.2 billion facility can be fully drawn for cash or letters of credit, and has an aggregate of US$981 million in outstanding letters of credit at December 31, 2016.
In June 2016, we made certain amendments to the terms of our US$1.2 billion credit facility, including an extension of the maturity date from June 2017 to June 2019. Lenders holding aggregate commitments of US$200 million declined to extend at that time. In connection with the extension, Teck agreed to provide subsidiary guarantees for the benefit of the credit facility and as a result our obligations under this agreement are guaranteed on a senior unsecured basis by TML, Teck Coal, Teck South American Holdings Ltd. (formerly Teck Financial Corporation Ltd.), TCL U.S. Holdings Ltd., TAK and Highland Valley Copper, each a wholly owned subsidiary of Teck. The amended credit facility contains covenants in addition to those contained in the original facility, including restrictions on new liens and guaranteed indebtedness. In December 2016, an aggregate of US$140 million of the US$200 million non-extending commitments were assigned to new lenders who agreed to extend the maturity of the assigned commitments to June 2019. As a result, the size of the facility will reduce to US$1.14 billion in June 2017.
The amended US$1.2 billion facility includes restrictions regarding the amount of secured debt and guaranteed debt that Teck may issue. The maximum amount of secured debt that Teck and the guarantor subsidiaries may incur without securing the credit facility is equal to 4% of Teck’s consolidated net tangible assets, or US$1 billion, whichever is greater. The maximum amount of debt (including secured debt) permitted to be guaranteed or incurred by the guarantor subsidiaries and other material subsidiaries (not including subsidiaries organized in Chile) is equal to 9% of Teck’s consolidated net tangible assets, or US$2.25 billion, whichever is greater. There are specific exemptions to each of the restrictions. Teck is also subject to covenants regarding asset sales and future subsidiary guarantors.
Teck has provided the same subsidiary guarantees noted above to our obligations under the US$3.0 billion credit facility maturing July 2020, our uncommitted credit facilities and certain hedging lines. At December 31, 2016, Teck’s consolidated net tangible assets were $32 billion (US$24 billion).
Any amounts drawn under the committed revolving credit facilities can be repaid at any time and are due in full at maturity. Amounts outstanding under the US$3.0 billion facility bear interest at LIBOR plus an applicable margin based on our credit ratings, which is 225 basis points when our credit ratings are below investment grade. Amounts outstanding under the US$1.2 billion facility bear interest at LIBOR plus an applicable margin based on our leverage ratio. Based on our December 31, 2016 leverage ratio, the applicable margin is 275 basis points. Both facilities require that our total debt-to-capitalization ratio, which was 0.32 to 1.0 at December 31, 2016, not exceed 0.5 to 1.0.
As a result of the loss of our investment grade ratings, we have been required to deliver letters of credit to satisfy financial security requirements under power purchase contracts at Quebrada Blanca and transportation, tank storage and pipeline capacity agreements for our interest in Fort Hills. At December 31, 2016, we had an aggregate of US$869 million in outstanding letters of credit for these contracts, of which US$672 relates to the Quebrada Blanca power purchase contracts. These letters of credit will be terminated if and when we regain investment grade ratings or reduced if and when certain project milestones are reached.
16. Debt (continued)

89Consolidated Financial Statements
We also maintain uncommitted bilateral credit facilities primarily for the issuance of letters of credit to support our future reclamation obligations. As at December 31, 2016, we were party to various uncommitted credit facilities providing for a total of $1.4 billion of capacity and the aggregate outstanding letters of credit issued thereunder were $1.1 billion. In addition to the letters of credit outstanding under these uncommitted credit facilities, we also had stand-alone letters of credit of $261 million outstanding at December 31, 2016, which were not issued under a credit facility. These uncommitted credit facilities and stand-alone letters of credit are typically renewed on an annual basis. From time to time, at our election, we may reduce the fees paid to banks issuing letters of credit by making short-term deposits of excess cash with those banks. The deposits earn a market rate of interest and are generally refundable on demand. At December 31, 2016, we had $555 million (2015 — $732 million) of such deposits.
In November 2016, we established $250 million in surety bond capacity to support current and future reclamation obligations. At December 31, 2016, an aggregate of $214 million in surety bonds were outstanding thereunder.
f) Scheduled Principal Payments
At December 31, 2016, the scheduled principal payments during the next five years and thereafter are as follows:
CAD$
($ in millions) US$ Equivalent
2017 $ 49 $ 66
2018 22 30
2019 278 374
2020 23 30
2021 1,150 1,544
Thereafter 4,654 6,249
$ 6,176 $ 8,293
g) Debt Continuity
($ in millions) US$ CAD$ Equivalent
2016 2015 2016 2015
As at January 1 $ 6,961 $ 7,276 $ 9,634 $ 8,441
Cash flows
Issuance of debt 1,227 23 1,567 28
Scheduled debt repayments (22) (363) (29) (476)
Debt repurchases (1,960) – (2,531) –
Non-cash changes
Changes in foreign exchange rates – – (308) 1,609
Other 7 25 10 32
As at December 31 $ 6,213 $ 6,961 $ 8,343 $ 9,634

Notes to Consolidated Financial Statements Years ended December 31, 2016 and 2015
90 Teck 2016 Annual Report | Every Day
17. Income Taxes
a) Provision for Income Taxes
(CAD$ in millions) 2016 2015
Current
Current taxes on profits for the year $ 551 $ 161
Adjustments for current taxes of prior periods (14) (5)
Total current taxes $ 537 $ 156
Deferred
Origination and reversal of temporary differences $ 42 $ (1,103)
Adjustments to deferred taxes of prior periods (2) 23
Tax losses not recognized (recognition of previously unrecognized losses) (10) 76
Effect of newly enacted change in tax rates 20 12
Total deferred taxes $ 50 $ (992)
$ 587 $ (836)
b) Reconciliation of income taxes calculated at the Canadian statutory income tax rate to the actual provision for income taxes is as follows:
(CAD$ in millions) 2016 2015
Tax (recovery) expense at the Canadian statutory income tax rate of 26.10% (2015 — 26.04%) $ 425 $ (865)
Tax effect of:
Resource taxes 170 55
Resource and depletion allowances (110) (76)
Non-temporary differences including one-half of capital gains and losses (15) 42
Tax pools not recognized (recognition of previously unrecognized tax pools) (10) 76
Effect of newly enacted change in tax rates 20 12
Withholding taxes 40 (76)
Difference in tax rates in foreign jurisdictions 90 46
Tax settlements – 10
Revisions to prior year estimates (5) (15)
Other (18) (45)
$ 587 $ (836)
The Canadian statutory tax rate increased to 26.10% due to an updated provincial allocation.
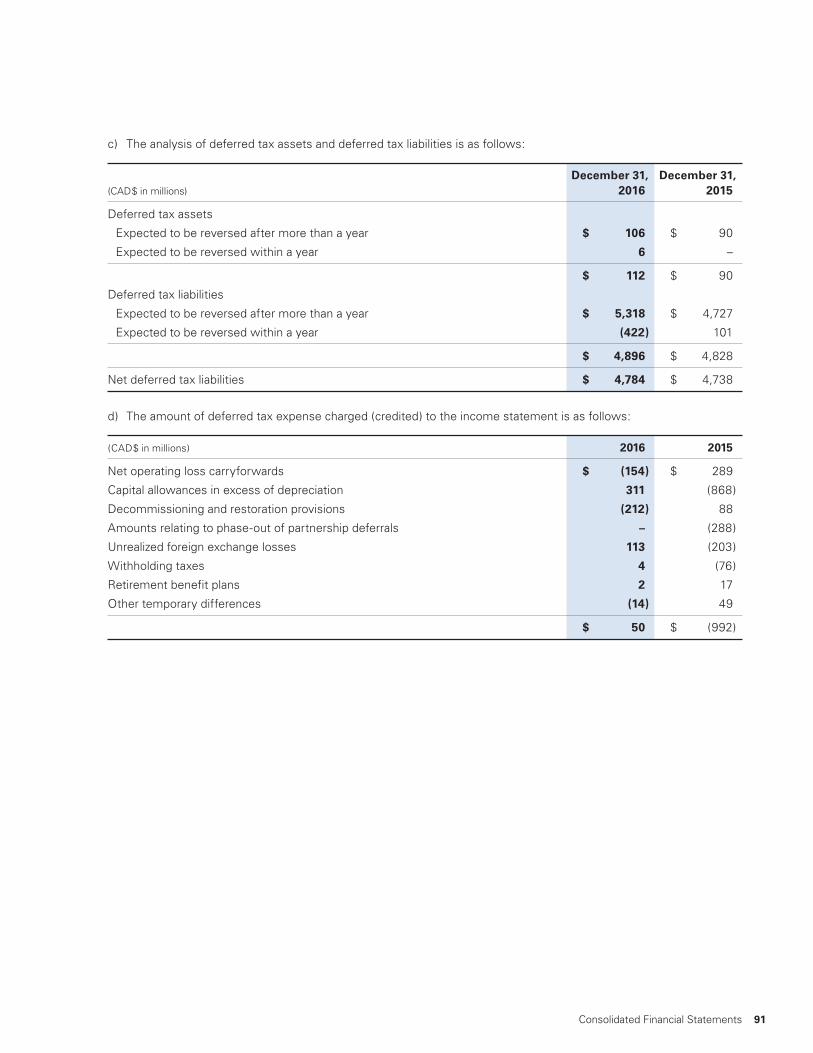
91Consolidated Financial Statements
c) The analysis of deferred tax assets and deferred tax liabilities is as follows:
December 31, December 31, (CAD$ in millions) 2016 2015
Deferred tax assets
Expected to be reversed after more than a year $ 106 $ 90
Expected to be reversed within a year 6 –
$ 112 $ 90
Deferred tax liabilities
Expected to be reversed after more than a year $ 5,318 $ 4,727
Expected to be reversed within a year (422) 101
$ 4,896 $ 4,828
Net deferred tax liabilities $ 4,784 $ 4,738
d) The amount of deferred tax expense charged (credited) to the income statement is as follows:
(CAD$ in millions) 2016 2015
Net operating loss carryforwards $ (154) $ 289
Capital allowances in excess of depreciation 311 (868)
Decommissioning and restoration provisions (212) 88
Amounts relating to phase-out of partnership deferrals – (288)
Unrealized foreign exchange losses 113 (203)
Withholding taxes 4 (76)
Retirement benefit plans 2 17
Other temporary differences (14) 49
$ 50 $ (992)
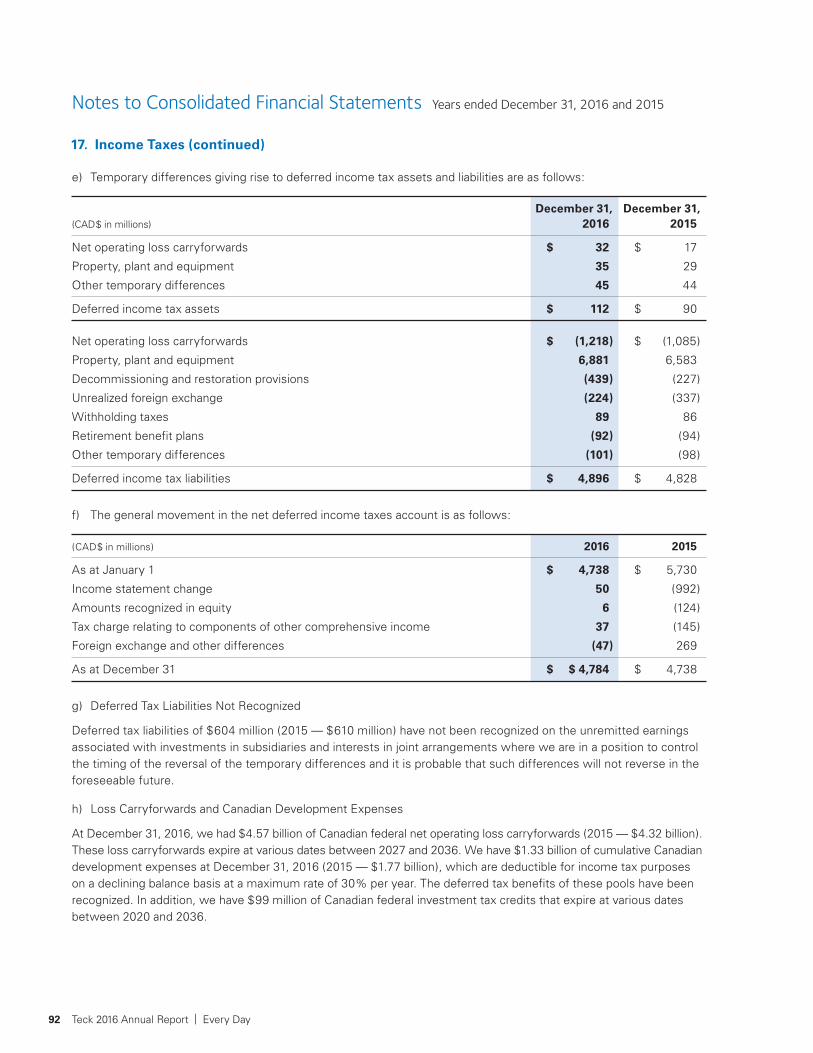
Notes to Consolidated Financial Statements Years ended December 31, 2016 and 2015
92 Teck 2016 Annual Report | Every Day
e) Temporary differences giving rise to deferred income tax assets and liabilities are as follows:
December 31, December 31, (CAD$ in millions) 2016 2015
Net operating loss carryforwards $ 32 $ 17
Property, plant and equipment 35 29
Other temporary differences 45 44
Deferred income tax assets $ 112 $ 90
Net operating loss carryforwards $ (1,218) $ (1,085)
Property, plant and equipment 6,881 6,583
Decommissioning and restoration provisions (439) (227)
Unrealized foreign exchange (224) (337)
Withholding taxes 89 86
Retirement benefit plans (92) (94)
Other temporary differences (101) (98)
Deferred income tax liabilities $ 4,896 $ 4,828
f) The general movement in the net deferred income taxes account is as follows:
(CAD$ in millions) 2016 2015
As at January 1 $ 4,738 $ 5,730
Income statement change 50 (992)
Amounts recognized in equity 6 (124)
Tax charge relating to components of other comprehensive income 37 (145)
Foreign exchange and other differences (47) 269
As at December 31 $ $ 4,784 $ 4,738
g) Deferred Tax Liabilities Not Recognized
Deferred tax liabilities of $604 million (2015 — $610 million) have not been recognized on the unremitted earnings associated with investments in subsidiaries and interests in joint arrangements where we are in a position to control the timing of the reversal of the temporary differences and it is probable that such differences will not reverse in the foreseeable future.
h) Loss Carryforwards and Canadian Development Expenses
At December 31, 2016, we had $4.57 billion of Canadian federal net operating loss carryforwards (2015 — $4.32 billion). These loss carryforwards expire at various dates between 2027 and 2036. We have $1.33 billion of cumulative Canadian development expenses at December 31, 2016 (2015 — $1.77 billion), which are deductible for income tax purposes on a declining balance basis at a maximum rate of 30% per year. The deferred tax benefits of these pools have been recognized. In addition, we have $99 million of Canadian federal investment tax credits that expire at various dates between 2020 and 2036.
17. Income Taxes (continued)

93Consolidated Financial Statements
i) Deferred Tax Assets Not Recognized
We have not recognized $270 million (2015 — $283 million) of deferred tax assets associated with unused tax credits and tax pools in entities and jurisdictions that do not have established sources of taxable income.
18. Deferred Consideration
In 2015, we entered into a long-term streaming agreement with a subsidiary of Franco-Nevada Corporation (Franco-Nevada) linked to our share of silver production at the Antamina mine.
We received a payment of $789 million (US$610 million) from Franco-Nevada on closing of the transaction and we receive 5% of the spot price at the time of delivery for each ounce of silver delivered under the agreement. We deliver silver to Franco-Nevada equivalent to 22.5% of payable silver sold by Antamina, which represents our proportionate share of silver produced by Antamina. In the event that 86 million ounces of silver has been delivered under the agreement, the stream will be reduced by one-third to 15% of payable silver sold by Antamina.
Antamina is not a party to the agreement with Franco-Nevada and our rights as a shareholder of Antamina are unaffected by the agreement.
The following table summarizes the movements in deferred consideration for the years ended December 31, 2016 and 2015:
(CAD$ in millions) 2016 2015
As at January 1 $ 816 $ –
Additions – 789
Recognized in profit (loss) (36) (22)
Changes in foreign exchange rates (25) 49
As at December 31 $ 755 $ 816
Less current portion of deferred consideration (Note 15) (32) (31)
Long-term deferred consideration $ 723 $ 785
19. Retirement Benefit Plans
We have defined contribution pension plans for certain groups of employees. Our share of contributions to these plans is expensed in the year earned by employees.
We have multiple defined benefit pension plans registered in various jurisdictions that provide benefits based principally on employees’ years of service and average annual remuneration. These plans are only available to certain qualifying employees and some are now closed to additional employees. The plans are “flat-benefit” or “final-pay” plans and may provide for inflationary increases in accordance with certain plan provisions. All of our registered defined benefit pension plans are governed and administered in accordance with applicable pension legislation in either Canada or the United States. Actuarial valuations are performed at least every three years to determine minimum annual contribution requirements as prescribed by applicable legislation. For the majority of our plans, current service costs are funded based on a percentage of pensionable earnings or as a flat dollar amount per active member depending on the provisions of the pension plans. For these plans, solvency deficits that are determined on an actuarial basis are funded over a period not to exceed five years. All of our defined benefit pension plans were actuarially valued within the past three years. While the majority of benefit payments are made from held-in-trust funds, there are also several unfunded plans where benefit payment obligations are met as they fall due.
We also have several post-retirement benefit plans that provide post-retirement medical, dental and life insurance benefits to certain qualifying employees and surviving spouses. These plans are unfunded and we meet benefit obligations as they come due.

Notes to Consolidated Financial Statements Years ended December 31, 2016 and 2015
94 Teck 2016 Annual Report | Every Day
a) Actuarial Valuation of Plans
(CAD$ in millions) 2016 2015
Defined Non-Pension Defined Non-Pension Benefit Post- Benefit Post- Pension Retirement Pension Retirement Plans Benefit Plans Plans Benefit Plans
Defined benefit obligation
Balance at beginning of year $ 2,112 $ 518 $ 2,089 $ 494
Current service cost 46 21 47 22
Past service costs arising from plan improvements 7 1 – –
Benefits paid (151) (19) (131) (23)
Interest expense 79 21 80 19
Obligation experience adjustments (8) 2 – (11)
Effect from change in financial assumptions 33 8 (3) 1
Effect from change in demographic assumptions (6) (13) – –
Changes in foreign exchange rates (6) (1) 30 16
Balance at end of year 2,106 538 2,112 518
Fair value of plan assets
Fair value at beginning of year 2,312 – 2,228 –
Interest income 87 – 85 –
Return on plan assets, excluding amounts included in interest income 63 – 71 –
Benefits paid (151) (19) (131) (23)
Contributions by the employer 36 19 33 23
Changes in foreign exchange rates (5) – 26 –
Fair value at end of year 2,342 – 2,312 –
Funding surplus (deficit) 236 (538) 200 (518)
Less effect of the asset ceiling
Balance at beginning of year 36 – 10 –
Interest on asset ceiling 1 – – –
Change in asset ceiling 21 – 26 –
Balance at end of year 58 – 36 –
Net accrued retirement benefit asset (liability) $ 178 $ (538) $ 164 $ (518)
Represented by:
Pension assets (Note 11) $ 283 $ – $ 272 $ –
Accrued retirement benefit liability (105) (538) (108) (518)
Net accrued retirement benefit asset (liability) $ 178 $ (538) $ 164 $ (518)
A number of the plans have a surplus totalling $58 million at December 31, 2016 (December 31, 2015 — $36 million), which is not recognized on the basis that future economic benefits are not available to us in the form of a reduction in future contributions or a cash refund.
19. Retirement Benefit Plans (continued)

95Consolidated Financial Statements
We expect to contribute $38 million to our defined benefit pension plans in 2017 based on minimum funding requirements. The weighted average duration of the defined benefit pension obligation is 12 years and the weighted average duration of the non-pension post-retirement benefit obligation is 14 years.
Defined contribution expense for 2016 was $44 million (2015 — $46 million).
b) Significant Assumptions
The discount rate used to determine the defined benefit obligations and the net interest cost was determined by reference to the market yields on high-quality debt instruments at the measurement date with durations similar to the duration of the expected cash flows of the plans.
Weighted average assumptions used to calculate the defined benefit obligation at the end of each year are as follows:
2016 2015
Defined Non-Pension Defined Non-Pension Benefit Post- Benefit Post- Pension Retirement Pension Retirement Plans Benefit Plans Plans Benefit Plans
Discount rate 3.74% 3.79% 3.84% 3.94%
Rate of increase in future compensation 3.25% 3.25% 3.25% 3.25%
Initial medical trend rate – 5.50% – 6.00%
Ultimate medical trend rate – 5.00% – 5.00%
Years to reach ultimate medical trend rate – 2 – 3
c) Sensitivity of the defined benefit obligation to changes in the weighted average assumptions:
2016
Effect on Defined Benefit Obligation
Change in Increase in Decrease in Assumption Assumption Assumption
Discount rate 1.0% Decrease by 13% Increase by 15%
Rate of increase in future compensation 1.0% Increase by 1% Decrease by 1%
Medical cost claim trend rate 1.0% Increase by 2% Decrease by 2%
2015
Effect on Defined Benefit Obligation
Change in Increase in Decrease in Assumption Assumption Assumption
Discount rate 1.0% Decrease by 12% Increase by 14%
Rate of increase in future compensation 1.0% Increase by 1% Decrease by 1%
Medical cost claim trend rate 1.0% Increase by 2% Decrease by 2%
The above sensitivity analyses are based on a change in each actuarial assumption while holding all other assumptions constant. The sensitivity analyses on our defined benefit obligation are calculated using the same methods as those used for calculating the defined benefit obligation recognized on our balance sheet. The methods and types of assumptions used in preparing the sensitivity analyses did not change from the prior period.

Notes to Consolidated Financial Statements Years ended December 31, 2016 and 2015
96 Teck 2016 Annual Report | Every Day
d) Mortality Assumptions
Assumptions regarding future mortality are set based on management’s best estimate in accordance with published mortality tables and expected experience. These assumptions translate into the following average life expectancies for an employee retiring at age 65:
2016 2015
Male Female Male Female
Retiring at the end of the reporting period 85.1 years 87.6 years 85.1 years 87.5 years
Retiring 20 years after the end of the reporting period 86.3 years 88.6 years 86.2 years 88.5 years
e) Significant Risks
The defined benefit pension plans and post-retirement benefit plans expose us to a number of risks, the most significant of which include asset volatility risk, changes in bond yields, and an increase in life expectancy.
Asset volatility risk
The discount rate used to determine the defined benefit obligations is based on AA-rated corporate bond yields. If our plan assets underperform this yield, the deficit will increase. Our strategic asset allocation includes a significant proportion of equities that increases volatility in the value of our assets, particularly in the short term. We expect equities to outperform corporate bonds in the long-term.
Changes in bond yields
A decrease in bond yields increases plan liabilities, which are partially offset by an increase in the value of the plans’ bond holdings.
Life expectancy
The majority of the plans’ obligations are to provide benefits for the life of the member. Increases in life expectancy will result in an increase in the plans’ liabilities.
f) Investment of Plan Assets
The assets of our defined benefit pension plans are managed by external asset managers under the oversight of the Teck Resources Limited Executive Pension Committee.
Our pension plan investment strategies support the objectives of each defined benefit plan and are related to each plan’s demographics and timing of expected benefit payments to plan members. The objective for the plan asset portfolios is to achieve annualized portfolio returns over five-year periods in excess of the annualized percentage change in the Consumer Price Index plus a certain premium.
Strategic asset allocation policies have been developed for each defined benefit plan to achieve this objective. The policies also reflect an asset/liability matching framework that seeks to reduce the effect of interest rate changes on each plan’s funded status by matching the duration of the bond investments with the duration of the pension liabilities. We do not use derivatives to manage interest risk. Asset allocation is monitored at least quarterly and rebalanced if the allocation to any asset class exceeds its allowable allocation range. Portfolio and investment manager performance is monitored quarterly and the investment guidelines for each plan are reviewed at least annually.
19. Retirement Benefit Plans (continued)
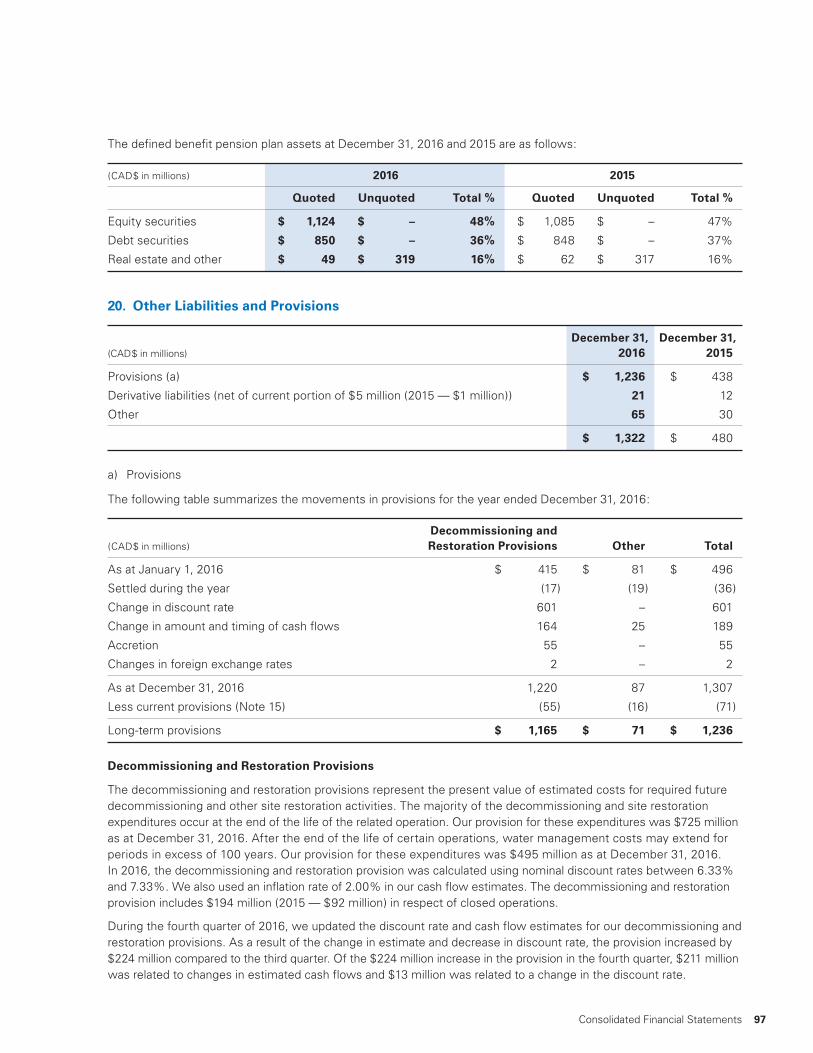
97Consolidated Financial Statements
The defined benefit pension plan assets at December 31, 2016 and 2015 are as follows:
(CAD$ in millions) 2016 2015
Quoted Unquoted Total % Quoted Unquoted Total %
Equity securities $ 1,124 $ – 48% $ 1,085 $ – 47%
Debt securities $ 850 $ – 36% $ 848 $ – 37%
Real estate and other $ 49 $ 319 16% $ 62 $ 317 16%
20. Other Liabilities and Provisions
December 31, December 31, (CAD$ in millions) 2016 2015
Provisions (a) $ 1,236 $ 438
Derivative liabilities (net of current portion of $5 million (2015 — $1 million)) 21 12
Other 65 30
$ 1,322 $ 480
a) Provisions
The following table summarizes the movements in provisions for the year ended December 31, 2016:
Decommissioning and (CAD$ in millions) Restoration Provisions Other Total
As at January 1, 2016 $ 415 $ 81 $ 496
Settled during the year (17) (19) (36)
Change in discount rate 601 – 601
Change in amount and timing of cash flows 164 25 189
Accretion 55 – 55
Changes in foreign exchange rates 2 – 2
As at December 31, 2016 1,220 87 1,307
Less current provisions (Note 15) (55) (16) (71)
Long-term provisions $ 1,165 $ 71 $ 1,236
Decommissioning and Restoration Provisions
The decommissioning and restoration provisions represent the present value of estimated costs for required future decommissioning and other site restoration activities. The majority of the decommissioning and site restoration expenditures occur at the end of the life of the related operation. Our provision for these expenditures was $725 million as at December 31, 2016. After the end of the life of certain operations, water management costs may extend for periods in excess of 100 years. Our provision for these expenditures was $495 million as at December 31, 2016. In 2016, the decommissioning and restoration provision was calculated using nominal discount rates between 6.33% and 7.33%. We also used an inflation rate of 2.00% in our cash flow estimates. The decommissioning and restoration provision includes $194 million (2015 — $92 million) in respect of closed operations.
During the fourth quarter of 2016, we updated the discount rate and cash flow estimates for our decommissioning and restoration provisions. As a result of the change in estimate and decrease in discount rate, the provision increased by $224 million compared to the third quarter. Of the $224 million increase in the provision in the fourth quarter, $211 million was related to changes in estimated cash flows and $13 million was related to a change in the discount rate.
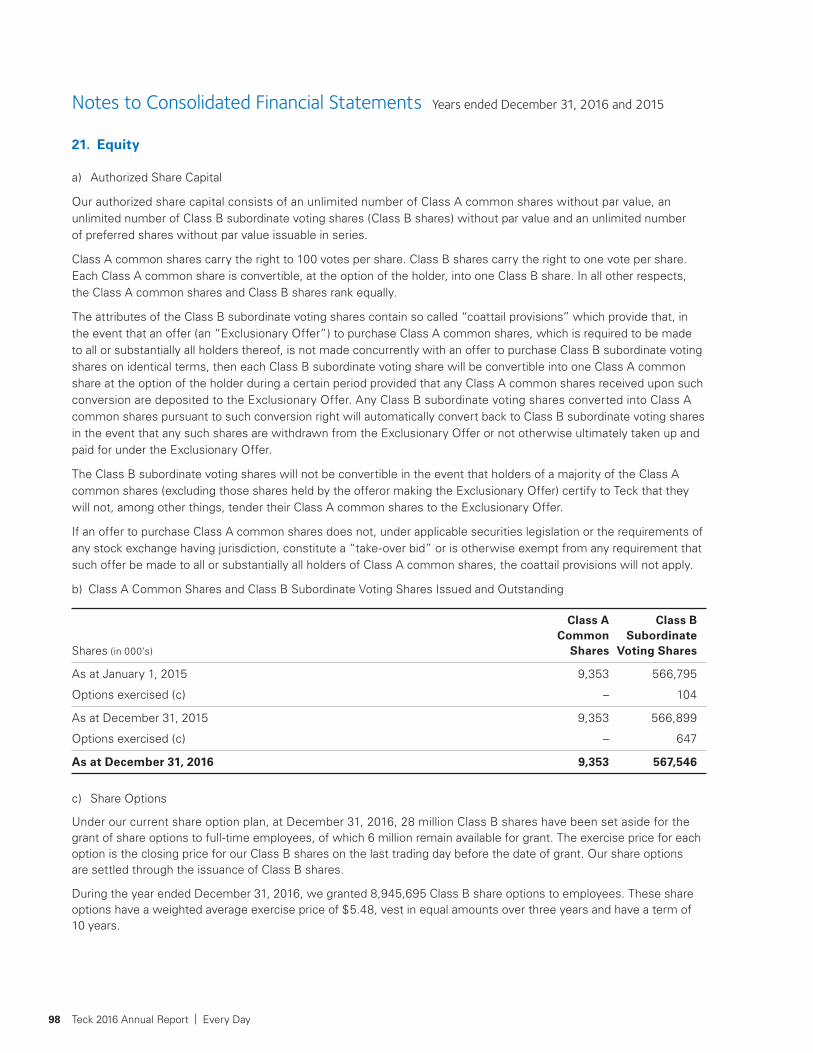
Notes to Consolidated Financial Statements Years ended December 31, 2016 and 2015
98 Teck 2016 Annual Report | Every Day
21. Equity
a) Authorized Share Capital
Our authorized share capital consists of an unlimited number of Class A common shares without par value, an unlimited number of Class B subordinate voting shares (Class B shares) without par value and an unlimited number of preferred shares without par value issuable in series.
Class A common shares carry the right to 100 votes per share. Class B shares carry the right to one vote per share. Each Class A common share is convertible, at the option of the holder, into one Class B share. In all other respects, the Class A common shares and Class B shares rank equally.
The attributes of the Class B subordinate voting shares contain so called “coattail provisions” which provide that, in the event that an offer (an “Exclusionary Offer”) to purchase Class A common shares, which is required to be made to all or substantially all holders thereof, is not made concurrently with an offer to purchase Class B subordinate voting shares on identical terms, then each Class B subordinate voting share will be convertible into one Class A common share at the option of the holder during a certain period provided that any Class A common shares received upon such conversion are deposited to the Exclusionary Offer. Any Class B subordinate voting shares converted into Class A common shares pursuant to such conversion right will automatically convert back to Class B subordinate voting shares in the event that any such shares are withdrawn from the Exclusionary Offer or not otherwise ultimately taken up and paid for under the Exclusionary Offer.
The Class B subordinate voting shares will not be convertible in the event that holders of a majority of the Class A common shares (excluding those shares held by the offeror making the Exclusionary Offer) certify to Teck that they will not, among other things, tender their Class A common shares to the Exclusionary Offer.
If an offer to purchase Class A common shares does not, under applicable securities legislation or the requirements of any stock exchange having jurisdiction, constitute a “take-over bid” or is otherwise exempt from any requirement that such offer be made to all or substantially all holders of Class A common shares, the coattail provisions will not apply.
b) Class A Common Shares and Class B Subordinate Voting Shares Issued and Outstanding
Class A Class B Common Subordinate Shares (in 000’s) Shares Voting Shares
As at January 1, 2015 9,353 566,795
Options exercised (c) – 104
As at December 31, 2015 9,353 566,899
Options exercised (c) – 647
As at December 31, 2016 9,353 567,546
c) Share Options
Under our current share option plan, at December 31, 2016, 28 million Class B shares have been set aside for the grant of share options to full-time employees, of which 6 million remain available for grant. The exercise price for each option is the closing price for our Class B shares on the last trading day before the date of grant. Our share options are settled through the issuance of Class B shares.
During the year ended December 31, 2016, we granted 8,945,695 Class B share options to employees. These share options have a weighted average exercise price of $5.48, vest in equal amounts over three years and have a term of 10 years.

99Consolidated Financial Statements
The weighted average fair value of Class B share options granted in the year was estimated at $1.81 per option (2015 — $4.66) at the grant date based on the Black-Scholes option-pricing model using the following assumptions:
2016 2015
Weighted average exercise price $ 5.48 $ 19.12
Dividend yield 1.85% 4.63%
Risk-free interest rate 0.72% 0.71%
Expected option life 4.2 years 4.2 years
Expected volatility 46% 40%
Forfeiture rate 0.96% 1.36%
The expected volatility is based on a statistical analysis of historical daily share prices over a period equal to the expected option life.
Outstanding share options are as follows:
2016 2015
Weighted Weighted Share Average Share Average Options Exercise Options Exercise (in 000’s) Price (in 000’s) Price
Outstanding at beginning of year 15,929 $ 26.53 10,632 $ 31.29
Granted 8,946 5.48 6,134 19.12
Exercised (647) 12.15 (104) 4.16
Forfeited (219) 10.74 (217) 22.65
Expired (1,155) 35.73 (516) 42.55
Outstanding at end of year 22,854 18.38 15,929 $ 26.53
Vested and exercisable at end of year 9,090 29.70 7,285 $ 32.18
The average share price during the year was $17.59 (2015 — $12.28), with the highest Class B share price at $35.02 (2015 — $20.08) and the lowest Class B share price at $3.80 (2015 — $4.33).
Information relating to share options outstanding at December 31, 2016 is as follows:
Exercise Weighted Average Remaining Life Outstanding Share Options (in 000’s) Price Range of Outstanding Options (months)
9,406 $ 4.15 – $ 12.35 102
5,803 $ 12.36 – $ 20.14 98
2,958 $ 20.15 – $ 26.79 86
2,778 $ 26.80 – $ 36.85 62
1,909 $ 36.86 – $ 58.80 57
22,854 $ 4.15 – $ 58.80 90
Total share option compensation expense recognized for the year was $22 million (2015 — $24 million).
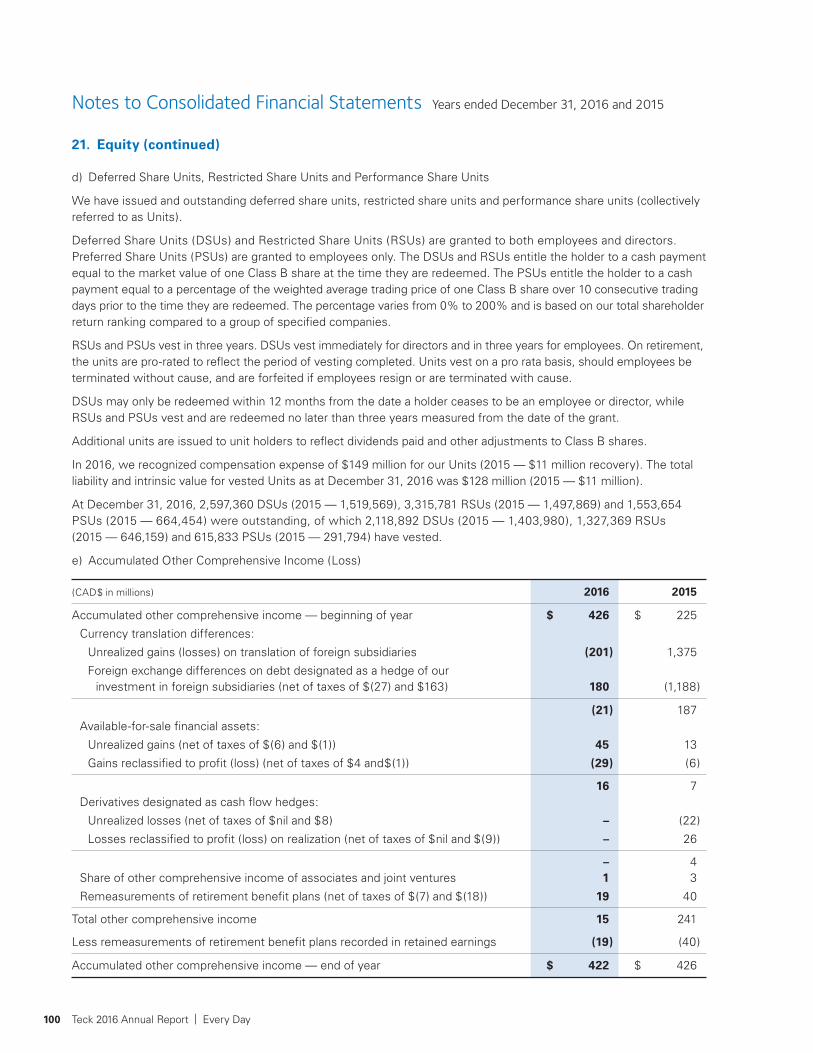
Notes to Consolidated Financial Statements Years ended December 31, 2016 and 2015
100 Teck 2016 Annual Report | Every Day
d) Deferred Share Units, Restricted Share Units and Performance Share Units
We have issued and outstanding deferred share units, restricted share units and performance share units (collectively referred to as Units).
Deferred Share Units (DSUs) and Restricted Share Units (RSUs) are granted to both employees and directors. Preferred Share Units (PSUs) are granted to employees only. The DSUs and RSUs entitle the holder to a cash payment equal to the market value of one Class B share at the time they are redeemed. The PSUs entitle the holder to a cash payment equal to a percentage of the weighted average trading price of one Class B share over 10 consecutive trading days prior to the time they are redeemed. The percentage varies from 0% to 200% and is based on our total shareholder return ranking compared to a group of specified companies.
RSUs and PSUs vest in three years. DSUs vest immediately for directors and in three years for employees. On retirement, the units are pro-rated to reflect the period of vesting completed. Units vest on a pro rata basis, should employees be terminated without cause, and are forfeited if employees resign or are terminated with cause.
DSUs may only be redeemed within 12 months from the date a holder ceases to be an employee or director, while RSUs and PSUs vest and are redeemed no later than three years measured from the date of the grant.
Additional units are issued to unit holders to reflect dividends paid and other adjustments to Class B shares.
In 2016, we recognized compensation expense of $149 million for our Units (2015 — $11 million recovery). The total liability and intrinsic value for vested Units as at December 31, 2016 was $128 million (2015 — $11 million).
At December 31, 2016, 2,597,360 DSUs (2015 — 1,519,569), 3,315,781 RSUs (2015 — 1,497,869) and 1,553,654 PSUs (2015 — 664,454) were outstanding, of which 2,118,892 DSUs (2015 — 1,403,980), 1,327,369 RSUs (2015 — 646,159) and 615,833 PSUs (2015 — 291,794) have vested.
e) Accumulated Other Comprehensive Income (Loss)
(CAD$ in millions) 2016 2015
Accumulated other comprehensive income — beginning of year $ 426 $ 225
Currency translation differences:
Unrealized gains (losses) on translation of foreign subsidiaries (201) 1,375
Foreign exchange differences on debt designated as a hedge of our investment in foreign subsidiaries (net of taxes of $(27) and $163) 180 (1,188)
(21) 187 Available-for-sale financial assets:
Unrealized gains (net of taxes of $(6) and $(1)) 45 13
Gains reclassified to profit (loss) (net of taxes of $4 and$(1)) (29) (6)
16 7 Derivatives designated as cash flow hedges:
Unrealized losses (net of taxes of $nil and $8) – (22)
Losses reclassified to profit (loss) on realization (net of taxes of $nil and $(9)) – 26
– 4 Share of other comprehensive income of associates and joint ventures 1 3
Remeasurements of retirement benefit plans (net of taxes of $(7) and $(18)) 19 40
Total other comprehensive income 15 241
Less remeasurements of retirement benefit plans recorded in retained earnings (19) (40)
Accumulated other comprehensive income — end of year $ 422 $ 426
21. Equity (continued)

101Consolidated Financial Statements
f) Earnings (Loss) Per Share
The following table reconciles our basic and diluted earnings per share:
(CAD$ in millions, except per share data) 2016 2015
Net basic and diluted profit (loss) attributable to shareholders of the company $ 1,040 $ (2,474)
Weighted average shares outstanding (000’s) 576,391 576,224
Dilutive effect of share options 6,496 –
Weighted average diluted shares outstanding (000’s) 582,887 576,224
Basic earnings (loss) per share $ 1.80 $ (4.29)
Diluted earnings (loss) per share $ 1.78 $ (4.29)
At December 31, 2016, 13,333,164 potentially dilutive shares were not included in the diluted earnings per share calculation because their effect was anti-dilutive. At December 31, 2015, there was a net loss attributable to shareholders of the company and, accordingly, all share options would be considered anti-dilutive and have been excluded from the calculation of diluted earnings (loss) per share.
g) Dividends
We declared and paid dividends of $0.05 per share in the second and fourth quarters of 2016 and $0.15 and $0.05 per share in the second and fourth quarters of 2015, respectively.
22. Non-Controlling Interests
Set out below is information about our subsidiaries with non-controlling interests and the non-controlling interest balances included in equity for all comparative periods presented:
Percentage of Ownership Interest and Voting Rights Held by Non- Principal Place Controlling December 31, December 31, (CAD$ in millions) of Business Interest 2016 2015
Highland Valley Copper (a) British Columbia, Canada – $ – $ 43
Carmen de Andacollo Region IV, Chile 10% 45 45
Quebrada Blanca Region I, Chile 23.5% 64 98
Elkview Mine Limited Partnership British Columbia, Canada 5% 50 44
$ 159 $ 230
a) During the year ended December 31, 2016, we acquired the 2.5% non-controlling interest stake in Highland Valley Copper for $33 million. We recorded this transaction as a reduction in our non-controlling interests of $46 million and an increase to our deferred income tax liabilities of $5 million with the difference of $8 million recorded directly in retained earnings.

Notes to Consolidated Financial Statements Years ended December 31, 2016 and 2015
102 Teck 2016 Annual Report | Every Day
23. Contingencies
We consider provisions for all our outstanding and pending legal claims to be adequate. The final outcome with respect to actions outstanding or pending as at December 31, 2016, or with respect to future claims, cannot be predicted with certainty. Significant contingencies not disclosed elsewhere in the notes to our financial statements are as follows:
Upper Columbia River Basin
Teck American Inc. (TAI) continues studies under the 2006 settlement agreement with the U.S. Environmental Protection Agency (EPA) to conduct a remedial investigation on the Upper Columbia River in Washington state. Residential soil testing within the study site has identified certain properties where remediation is required. TAI and EPA reached an agreement regarding the remediation to be undertaken in 2015, which has been completed, and additional sampling has been conducted which suggests that limited additional time-critical remediation will be required.
The Lake Roosevelt litigation involving TML in the Federal District Court for the Eastern District of Washington continues. In September 2012, TML entered into an agreement with the plaintiffs, agreeing that certain facts were established for purposes of the litigation. The agreement stipulated that some portion of the slag discharged from TML’s Trail Operations into the Columbia River between 1896 and 1995, and some portion of the effluent discharged from Trail Operations, have been transported to and are present in the Upper Columbia River in the United States, and that some hazardous substances from the slag and effluent have been released into the environment within the United States. In December 2012, the Court found in favour of the plaintiffs in phase one of the case, issuing a declaratory judgment that TML is liable under the Comprehensive Environmental Response, Compensation, and Liability Act (CERCLA) for response costs, the amount of which will be determined in later phases of the case. A hearing with respect to the claims of the Tribal plaintiffs in respect of approximately $9 million of past response costs was held in December. In August the trial court judge ruled in favour of the plaintiffs and the decision is under appeal.
In October 2013, the Confederated Tribes of the Colville Reservation filed an omnibus motion with the District Court seeking an order stating that they are permitted to seek recovery from TML for environmental response costs, and in a subsequent proceeding, natural resource damages and assessment costs, arising from the alleged deposition of hazardous substances in the United States from aerial emissions from TML’s Trail Operations. Prior allegations by the Tribes related solely to solid and liquid materials discharged to the Columbia River. The motion did not state the amount of response costs allegedly attributable to aerial emissions, nor did it attempt to define the extent of natural resource damages, if any, attributable to past smelter operations. In December 2013, the District Court ruled in favour of the plaintiffs, who subsequently filed amended pleadings in relation to air emissions. The Court dismissed a motion to strike the air claims on the basis that CERCLA does not apply to air emissions in the manner proposed by the plaintiffs, and a subsequent TML motion seeking reconsideration of the dismissal. On July 27, 2016 the Ninth Circuit unanimously ruled in favour of TML on its appeal of the District Court decision. Plaintiffs sought en banc review of the decision in the Ninth Circuit, which was denied in October.
A hearing with respect to natural resource damages and assessment costs is expected to follow after resolution of appeals with respect to issues raised in the first phase of the litigation and completion of the remedial investigation and feasibility study being undertaken by TAI.
There is no assurance that we will ultimately be successful in our defence of the litigation or that we or our affiliates will not be faced with further liability in relation to this matter. Until the studies contemplated by the EPA settlement agreement and additional damage assessments are completed, it is not possible to estimate the extent and cost, if any, of any additional remediation or restoration that may be required or to assess our potential liability for damages. The studies may conclude, on the basis of risk, cost, technical feasibility or other grounds, that no remediation other than some residential soil removal should be undertaken. If other remediation is required and damage to resources found, the cost of that remediation may be material.
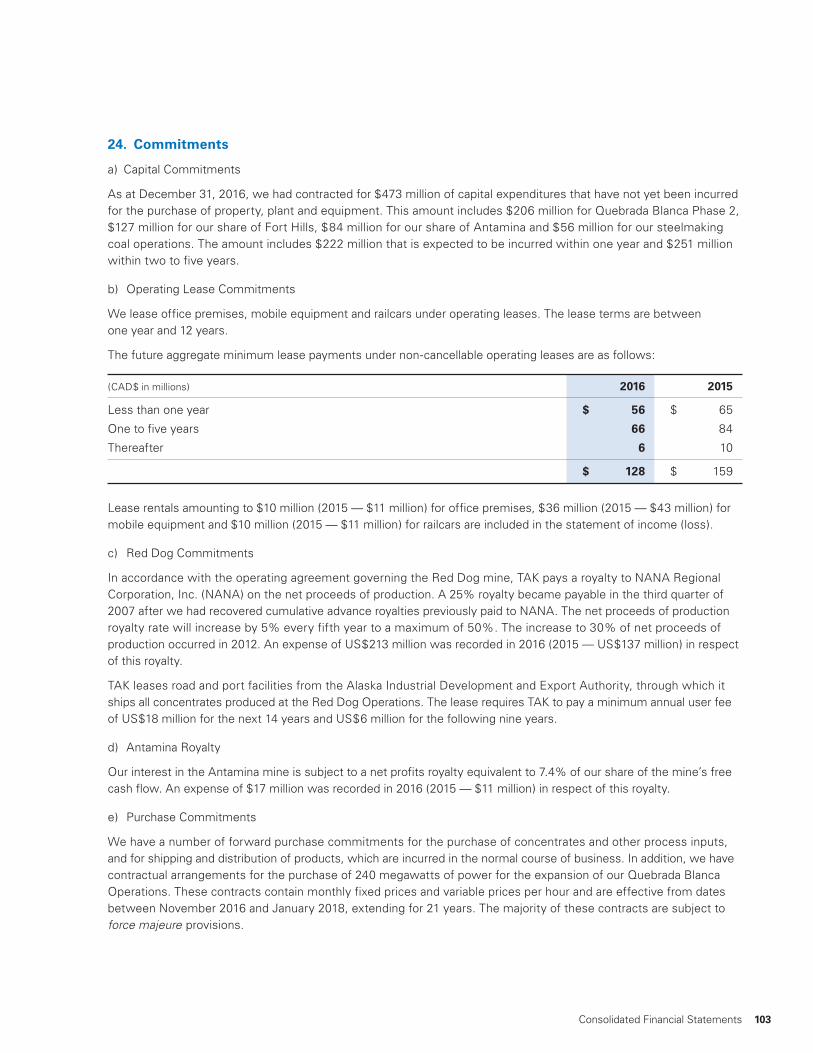
103Consolidated Financial Statements
24. Commitments
a) Capital Commitments
As at December 31, 2016, we had contracted for $473 million of capital expenditures that have not yet been incurred for the purchase of property, plant and equipment. This amount includes $206 million for Quebrada Blanca Phase 2, $127 million for our share of Fort Hills, $84 million for our share of Antamina and $56 million for our steelmaking coal operations. The amount includes $222 million that is expected to be incurred within one year and $251 million within two to five years.
b) Operating Lease Commitments
We lease office premises, mobile equipment and railcars under operating leases. The lease terms are between one year and 12 years.
The future aggregate minimum lease payments under non-cancellable operating leases are as follows:
(CAD$ in millions) 2016 2015
Less than one year $ 56 $ 65
One to five years 66 84
Thereafter 6 10
$ 128 $ 159
Lease rentals amounting to $10 million (2015 — $11 million) for office premises, $36 million (2015 — $43 million) for mobile equipment and $10 million (2015 — $11 million) for railcars are included in the statement of income (loss).
c) Red Dog Commitments
In accordance with the operating agreement governing the Red Dog mine, TAK pays a royalty to NANA Regional Corporation, Inc. (NANA) on the net proceeds of production. A 25% royalty became payable in the third quarter of 2007 after we had recovered cumulative advance royalties previously paid to NANA. The net proceeds of production royalty rate will increase by 5% every fifth year to a maximum of 50%. The increase to 30% of net proceeds of production occurred in 2012. An expense of US$213 million was recorded in 2016 (2015 — US$137 million) in respect of this royalty.
TAK leases road and port facilities from the Alaska Industrial Development and Export Authority, through which it ships all concentrates produced at the Red Dog Operations. The lease requires TAK to pay a minimum annual user fee of US$18 million for the next 14 years and US$6 million for the following nine years.
d) Antamina Royalty
Our interest in the Antamina mine is subject to a net profits royalty equivalent to 7.4% of our share of the mine’s free cash flow. An expense of $17 million was recorded in 2016 (2015 — $11 million) in respect of this royalty.
e) Purchase Commitments
We have a number of forward purchase commitments for the purchase of concentrates and other process inputs, and for shipping and distribution of products, which are incurred in the normal course of business. In addition, we have contractual arrangements for the purchase of 240 megawatts of power for the expansion of our Quebrada Blanca Operations. These contracts contain monthly fixed prices and variable prices per hour and are effective from dates between November 2016 and January 2018, extending for 21 years. The majority of these contracts are subject to force majeure provisions.

Notes to Consolidated Financial Statements Years ended December 31, 2016 and 2015
104 Teck 2016 Annual Report | Every Day
25. Segmented Information
Based on the primary products we produce and our development projects, we have five reportable segments — steelmaking coal, copper, zinc, energy and corporate — which is the way we report information to our Chief Executive Officer. The corporate segment includes all of our initiatives in other commodities, our corporate growth activities and groups that provide administrative, technical, financial and other support to all of our business units. Other operating expenses include general and administration costs, exploration, research and development, and other operating income (expense). Sales between segments are carried out on terms that arm’s-length parties would use. Total assets does not include intra-group receivables between segments. Deferred tax assets and liabilities have been allocated amongst segments.
(CAD$ in millions) December 31, 2016
Steelmaking Coal Copper Zinc Energy Corporate Total
Segment revenues $ 4,144 $ 2,007 $ 3,577 $ 2 $ – $ 9,730
Less: Inter-segment revenues – – (430) – – (430)
Revenues 4,144 2,007 3,147 2 – 9,300
Cost of sales (2,765) (1,817) (2,317) (5) – (6,904)
Gross profit (loss) 1,379 190 830 (3) – 2,396
Asset impairments – – (46) (248) – (294)
Other operating income (expenses) (74) 35 30 (30) (338) (377)
Profit (loss) from operations 1,305 225 814 (281) (338) 1,725
Net finance expense (21) (42) (27) (6) (242) (338)
Non-operating income (expenses) 6 (5) (5) – 243 239
Share of income (losses) of associates and joint ventures – 2 – – – 2
Profit (loss) before taxes 1,290 180 782 (287) (337) 1,628
Capital expenditures 348 339 190 1,010 6 1,893
Goodwill 702 412 – – – 1,114
Total assets 14,894 9,673 3,742 4,129 3,191 35,629
Net assets $ 10,071 $ 6,029 $ 2,464 $ 3,648 $ (4,611) $ 17,601

105Consolidated Financial Statements
(CAD$ in millions) December 31, 2015
Steelmaking Coal Copper Zinc Energy Corporate Total
Segment revenues $ 3,049 $ 2,422 $ 3,121 $ 4 $ – $ 8,596
Less: Inter-segment revenues – – (337) – – (337)
Revenues 3,049 2,422 2,784 4 – 8,259
Cost of sales (2,849) (1,996) (2,129) (6) – (6,980)
Gross profit (loss) 200 426 655 (2) – 1,279
Asset impairments (2,032) (506) (31) (1,062) – (3,631)
Other operating income (expenses) (56) (230) (42) (14) (224) (566)
Profit (loss) from operations (1,888) (310) 582 (1,078) (224) (2,918)
Net finance expense (26) (15) (32) – (238) (311)
Non-operating income (expenses) 39 (13) 34 – (149) (89)
Share of losses of associates and joint ventures – – – – (2) (2)
Profit (loss) before taxes (1,875) (338) 584 (1,078) (613) (3,320)
Capital expenditures 493 539 211 997 4 2,244
Goodwill 702 425 – – – 1,127
Total assets 14,531 9,886 3,406 3,269 3,596 34,688
Net assets $ 10,201 $ 6,335 $ 2,590 $ 2,846 $ (5,335) $ 16,637

Notes to Consolidated Financial Statements Years ended December 31, 2016 and 2015
106 Teck 2016 Annual Report | Every Day
The geographical distribution of our non-current assets is as follows:
December 31, December 31, (CAD$ in millions) 2016 2015
Canada $ 20,853 $ 20,112
Chile 6,332 6,465
Peru 1,286 1,301
United States 1,180 983
Other 70 74
$ 29,721 $ 28,935
Non-current assets attributed to geographical locations exclude deferred income tax assets and financial and other assets.
Revenue is attributed to regions based on the location of the port of delivery as designated by the customer and is as follows:
(CAD$ in millions) 2016 2015
Asia
China $ 1,773 $ 1,786
Japan 1,319 1,343
South Korea 1,181 966
India 553 341
Other 825 614
Americas
United States 1,314 1,291
Canada 770 581
Latin America 294 197
Europe
Germany 354 394
Finland 178 213
Spain 186 9
Other 553 524
$ 9,300 $ 8,259
25. Segmented Information (continued)

107Consolidated Financial Statements
26. Accounting for Financial Instruments
a) Financial Risk Management
Our activities expose us to a variety of financial risks, which include liquidity risk, foreign exchange risk, interest rate risk, commodity price risk, credit risk and other risks associated with capital markets. From time to time, we may use foreign exchange, commodity price and interest rate contracts to manage exposure to fluctuations in these variables. We do not have a practice of trading derivatives. Our use of derivatives is based on established practices and parameters to mitigate risk and is subject to the oversight of our Hedging Committee and our Board of Directors.
Foreign Exchange Risk
We operate on an international basis and therefore, foreign exchange risk exposures arise from transactions denominated in a foreign currency. Our foreign exchange risk arises primarily with respect to the U.S. dollar and to a lesser extent, the Chilean peso and Peruvian sol. Our cash flows from Canadian, Chilean and Peruvian operations are exposed to foreign exchange risk, as commodity sales are denominated in U.S. dollars and a substantial portion of operating expenses are denominated in local currencies.
In the first half of 2015 and in prior years, we hedged a portion of our quarterly U.S. dollar denominated future cash flows with U.S. dollar forward sales contracts. This hedge was discontinued in the second quarter of 2015.
We also have various investments in U.S. dollar foreign operations, whose net assets are exposed to foreign currency translation risk. This currency exposure is managed in part through our U.S. dollar denominated debt as a hedge against net investments in foreign operations. As at December 31, 2016, $5.4 billion of U.S. dollar debt was designated in this manner.
U.S. dollar financial instruments subject to foreign exchange risk are comprised of U.S. dollar denominated items held in Canada and is summarized below. This risk is reduced by our policy to apply a hedge against our U.S. dollar net investments using our U.S. dollar debt.
(US$ in millions) 2016 2015
Cash and cash equivalents $ 521 $ 911
Trade accounts receivable and other assets 867 445
Trade accounts payable and other liabilities (572) (380)
Debt (6,141) (6,900)
(5,325) (5,924)
Net investment in foreign operations hedged 5,424 5,552
Net U.S. dollar exposure $ 99 $ (372)
As at December 31, 2016, with other variables unchanged, a $0.10 strengthening of the Canadian dollar against the U.S. dollar would result in a $10 million pre-tax loss (2015 — $37 million pre-tax gain) from our financial instruments. There would also be an $11 million pre-tax loss (2015 — $nil) in other comprehensive income (loss) from the translation of our foreign operations. The inverse effect would result if the Canadian dollar weakened by $0.10 against the U.S. dollar.

Notes to Consolidated Financial Statements Years ended December 31, 2016 and 2015
108 Teck 2016 Annual Report | Every Day
Liquidity Risk
Liquidity risk arises from our general and capital financing needs. We have planning, budgeting and forecasting processes to help determine our funding requirements to meet various contractual and other obligations. Note 16 details our available credit facilities as at December 31, 2016.
Contractual undiscounted cash flow requirements for financial liabilities as at December 31, 2016 are as follows:
Less Than More Than (CAD$ in millions) 1 Year 2–3 Years 4–5 Years 5 Years Total
Trade accounts payable and other liabilities $ 1,902 $ – $ – $ – $ 1,902
Debt (Note 16(f)) 66 404 1,574 6,249 8,293
Estimated interest payments on debt $ 472 $ 933 $ 849 $ 4,079 $ 6,333
Interest Rate Risk
Our interest rate risk arises mainly in respect of our holdings of cash and cash equivalents. Our interest rate management policy is generally to borrow at fixed rates. However, floating rate funding may be used to fund short-term operating cash flow requirements or, in conjunction with fixed to floating interest rate swaps, be used to offset interest rate risk from our cash. The fair value of fixed-rate debt fluctuates with changes in market interest rates, but the cash flows, denominated in U.S. dollars, do not.
Cash and cash equivalents have short terms to maturity and receive interest based on market interest rates.
As at December 31, 2016 and 2015, with other variables unchanged, a 1% change in the LIBOR rate would not have a significant effect on profit (loss). There would be no effect on other comprehensive income (loss).
Commodity Price Risk
We are subject to price risk from fluctuations in market prices of the commodities that we produce. From time to time, we may use commodity price contracts to manage our exposure to fluctuations in commodity prices. At the balance sheet date, we had zinc and lead derivative contracts outstanding as described in (b) below.
Our commodity price risk associated with financial instruments primarily relates to changes in fair value caused by final settlement pricing adjustments to receivables and payables, derivative contracts for zinc and lead, embedded derivatives in one of our road and port contracts and in the ongoing payments under our silver stream and gold stream arrangements.
The following represents the effect on profit (loss) attributable to shareholders from a 10% change in commodity prices, based on outstanding receivables and payables subject to final pricing adjustments at December 31, 2016. There is no effect on other comprehensive income.
Change in Profit (Loss) Price on December 31, Attributable to Shareholders
(CAD$ in millions, except for US$/lb. data) 2016 2015 2016 2015
Copper US$2.50/lb. US$2.13/lb. $ 24 $ 46
Zinc US$1.17/lb. US$0.73/lb. $ 5 $ 2
Lead US$0.90/lb. US$0.82/lb. $ – $ (1)
A 10% change in the price of zinc, lead, silver and gold, respectively, would change our net liability relating to derivatives and embedded derivatives, excluding receivables and payables subject to final pricing adjustments, and change our pre-tax profit (loss) attributable to shareholders by $45 million (2015 — $32 million). There would be no effect on other comprehensive income.
26. Accounting for Financial Instruments (continued)

109Consolidated Financial Statements
Credit Risk
Credit risk arises from the non-performance by counterparties of contractual financial obligations. Our primary counterparties related to our cash, money market investments and derivative contracts carry investment grade ratings as assessed by external rating agencies. There is ongoing review to evaluate the creditworthiness of these counterparties. We manage credit risk for trade and other receivables through established credit monitoring activities. Our maximum exposure to credit risk at the reporting date is the carrying value of our cash and cash equivalents, trade accounts receivable and derivative assets. While we are exposed to credit losses due to the non-performance of our counterparties, we do not consider this to be a material risk.
b) Derivative Financial Instruments and Hedges
Sale and Purchase Contracts
We record adjustments to our receivable and payable balances for provisionally priced sales and purchases, respectively, in periods up to the date of final pricing based on movements in quoted market prices. These arrangements have the characteristics of a derivative instrument, as the value of our receivables and payables will vary as prices for the underlying commodities vary in the metal markets. These final pricing adjustments result in gains (losses from purchases) in a rising price environment and losses (gains from purchases) in a declining price environment and are recorded in other operating income (expense). It should be noted that while these effects arise on the sale of concentrates, we also purchase concentrates at our Trail Operations where the opposite effects occur. The effect of gains and losses on these contracts on profit (loss) is mitigated by smelter price participation, royalty interests, taxes and non-controlling interests.
The table below outlines our outstanding receivable and payable positions, which were provisionally valued at December 31, 2016 and December 31, 2015.
Outstanding at Outstanding at December 31, 2016 December 31, 2015
(Pounds in millions) Pounds US$/lb. Pounds US$/lb.
Receivable positions
Copper 114 $ 2.50 257 $ 2.13
Zinc 231 $ 1.17 162 $ 0.73
Lead 26 $ 0.90 20 $ 0.82
Payable positions
Zinc payable 114 $ 1.17 83 $ 0.73
Lead payable 20 $ 0.90 35 $ 0.82
At December 31, 2016, total outstanding settlements receivable were $795 million (2015 — $684 million) and total outstanding settlements payable were $43 million (2015 — $25 million). These amounts are included in trade accounts receivable and trade accounts payable, respectively, on the consolidated balance sheet.

Notes to Consolidated Financial Statements Years ended December 31, 2016 and 2015
110 Teck 2016 Annual Report | Every Day
Zinc and Lead Swaps
Due to ice conditions, the port serving our Red Dog mine is normally only able to ship concentrates from July to October each year. As a result, zinc and lead concentrate sales volumes are generally higher in the third and fourth quarter of each year than in the first and second quarter. During 2016 and 2015, we purchased and sold zinc and lead swaps to match our economic exposure to the average zinc and lead prices over our shipping year, which is from July of one year to June of the following year. We do not apply hedge accounting to the zinc or lead swaps.
The fair value of our commodity swaps is calculated using a discounted cash flow method based on forward metal prices. A summary of these derivative contracts and related fair values as at December 31, 2016 is as follows:
Average Price Average Price Fair Value of Purchase of Sale Asset (Liability) Quantity Commitments Commitments (CAD$ in millions)
Derivatives not designated as hedging instruments
Zinc swaps 181 million lbs. US$1.14/lb. US$1.16/lb. $ 4
Lead swaps 95 million lbs. US$0.96/lb. US$0.91/lb. (5)
$ (1)
All free-standing derivative contracts mature in 2017.
Free-standing derivatives, not designated as hedging instruments, are recorded in trade accounts receivable and in trade accounts payable and other liabilities in the amount of $4 million and $5 million, respectively, on the consolidated balance sheet.
Derivatives Not Designated as Hedging Instruments and Embedded Derivatives
Amount of Gain (Loss) Recognized(CAD$ in millions) in Other Operating Income (Expense)
2016 2015
Zinc derivatives $ 45 $ (2)
Lead derivatives (5) (3)
Settlements receivable and payable 153 (280)
Contingent zinc escalation payment embedded derivative (c) (18) 4
Gold stream embedded derivative (c) 6 (8)
Silver stream embedded derivative (c) 4 (3)
$ 185 $ (292)
We also recorded a $113 million gain in non-operating income (expense) (Note 8) related to an increase in the value of debt prepayment options since issuance in June 2016 (c).
26. Accounting for Financial Instruments (continued)

111Consolidated Financial Statements
Hedges
Cash flow hedges
At December 31, 2016, we did not have derivative instruments designated as cash flow hedges.
The following table provides information regarding the effect of U.S. dollar forward sales contracts that were derivative instruments designated as cash flow hedges on our consolidated statements of income and comprehensive income in 2015:
(CAD$ in millions) 2016 2015
Losses reclassified from accumulated other comprehensive income into profit (loss) (effective portion) $ – $ (34)
Location of losses reclassified from accumulated other comprehensive income (loss) into profit – Revenues
Net investment hedge
Our hedges of net investments in foreign operations were effective and no ineffectiveness was recognized in profit (loss) for the period.
c) Embedded Derivatives
One of our road and port contracts contains a contingent zinc escalation payment that is considered to be an embedded derivative. The fair value of this embedded derivative was $20 million at December 31, 2016 (2015 — $2 million), and is included in other liabilities and provisions on the consolidated balance sheet.
The gold stream and silver stream agreements entered into in 2015 (Note 13(b) and Note 18) each contain an embedded derivative in the ongoing future payments due to Teck from Royal Gold and Franco-Nevada, respectively. The gold stream’s 15% ongoing payment contains an embedded derivative relating to the gold price. The fair value of this embedded derivative was $2 million at December 31, 2016 (2015 — $8 million) and is included in other liabilities and provisions on the consolidated balance sheet. The silver stream’s 5% ongoing payment contains an embedded derivative relating to the silver price. The fair value of this embedded derivative was $1 million at December 31, 2016 (2015 — $3 million) and is included in other assets (2015 — other liabilities and provisions) on the consolidated balance sheet.
Our June 2021 and 2024 notes issued in 2016 (Note 16(b)) include prepayment options that are considered to be embedded derivatives. At December 31, 2016, these prepayment options are recorded as other assets (Note 11) on the balance sheet at fair values of $61 million and $78 million for the June 2021 and 2024 notes, respectively, based on current market interest rates for similar instruments and our credit spread. Since the notes were issued in June 2016, the value of the prepayment options increased by $113 million, which has been recorded as a gain in non-operating income (expense) (Note 8).
27. Fair Value Measurements
Certain of our financial assets and liabilities are measured at fair value on a recurring basis and classified in their entirety based on the lowest level of input that is significant to the fair value measurement. Certain non-financial assets and liabilities may also be measured at fair value on a non-recurring basis. There are three levels of the fair value hierarchy that prioritize the inputs to valuation techniques used to measure fair value, with Level 1 inputs having the highest priority. The levels and the valuation techniques used to value our financial assets and liabilities are described below:
Level 1 — Quoted Prices in Active Markets for Identical Assets
Unadjusted quoted prices in active markets that are accessible at the measurement date for identical, unrestricted assets or liabilities.
Cash equivalents and marketable equity securities are valued using quoted market prices in active markets. Accordingly, these items are included in Level 1 of the fair value hierarchy.

Notes to Consolidated Financial Statements Years ended December 31, 2016 and 2015
112 Teck 2016 Annual Report | Every Day
Level 2 — Significant Other Observable Inputs
Quoted prices in markets that are not active, quoted prices for similar assets or liabilities in active markets, or inputs that are observable, either directly or indirectly, for substantially the full term of the asset or liability.
Derivative instruments and embedded derivatives are included in Level 2 of the fair value hierarchy as they are valued using pricing models or discounted cash flow models. These models require a variety of inputs, including, but not limited to, market prices, forward price curves, yield curves, and credit spreads. These inputs are obtained from or corroborated with the market. Also included in Level 2 are settlements receivable and settlements payable from provisional pricing on concentrate sales and purchases because they are valued using quoted market prices for forward curves for copper, zinc and lead.
Level 3 — Significant Unobservable Inputs
Unobservable (supported by little or no market activity) prices.
We include investments in certain debt securities in Level 3 of the fair value hierarchy because they trade infrequently and have little price transparency. We review the fair value of these instruments periodically and estimate an impairment charge based on management’s best estimates, which are unobservable inputs.
The fair values of our financial assets and liabilities measured at fair value on a recurring basis at December 31, 2016 and 2015 are summarized in the following table:
(CAD$ in millions) 2016 2015
Level 1 Level 2 Level 3 Total Level 1 Level 2 Level 3 Total
Financial assets
Cash equivalents $ 1,153 $ – $ – $ 1,153 $ 1,640 $ – $ – $ 1,640
Marketable equity securities 95 – – 95 101 – – 101
Debt securities 68 – 11 79 97 – 12 109
Settlements receivable – 795 – 795 – 684 – 684
Derivative instruments and embedded derivatives – 142 – 142 – 9 – 9
$ 1,316 $ 937 $ 11 $ 2,264 $ 1,838 $ 693 $ 12 $ 2,543
Financial liabilities
Derivative instruments and embedded derivatives $ – $ 27 $ – $ 27 $ – $ 16 $ – $ 16
Settlements payable – 43 – 43 – 25 – 25
$ – $ 70 $ – $ 70 $ – $ 41 $ – $ 41
As at December 31, 2016 and 2015, we measured certain non-financial assets at their recoverable amounts using a FVLCD basis, which is classified as a Level 3 measurement. Refer to Note 13(a) for information about these fair value measurements.
27. Fair Value Measurements (continued)

113Consolidated Financial Statements
28. Capital Management
The capital we manage is the total of equity and debt on our balance sheet. Our capital management objectives are to maintain access to the capital we require to operate and grow our business while minimizing the cost of such capital and providing for returns to our shareholders. Our financial policies have been to maintain, on average over time, a target debt to debt-plus-equity ratio of approximately 30% and a target ratio of debt-to-EBITDA of approximately 2.5. These ratios are expected to vary from their target levels from time to time, reflecting commodity price cycles and corporate activity, including the development of major projects. We may also review and amend such policy targets from time to time. We maintain two committed revolving credit facilities consisting of a core liquidity facility of US$3 billion and a US$1.2 billion facility which is used for financial letters of credit required while our credit rating is non-investment grade. These credit facilities include a financial covenant that requires us to maintain a debt-to-capitalization ratio that does not exceed 50%.
As at December 31, 2016, our debt to debt-plus-equity ratio was 32% (2015 — 37%), our debt-to-EBITDA ratio was 2.5 (2015 — (5.9)) and our debt-to-adjusted-EBITDA ratio, before asset impairments, was 2.3 (2015 — 4.8). We manage the risk of not meeting our financial targets through the issuance and repayment of debt, our dividend policy, the issuance of equity capital, assets sales, as well as through the ongoing management of operations, investments and capital expenditures.
29. Key Management Compensation
The compensation for key management recognized in total comprehensive income (loss) in respect of employee services is summarized in the table below. Key management includes our directors and senior vice presidents.
(CAD$ in millions) 2016 2015
Salaries, bonuses, director fees and other short-term benefits $ 14 $ 14
Post-employment benefits 6 2
Share option compensation expense 8 9
Compensation expense (recovery) related to Units (Note 21(d)) 85 (11)
$ 113 $ 14
30. Subsequent Event
On February 21, 2017, we commenced cash tender offers to purchase up to US$650 million aggregate principal amount of the following series of notes; 3.000% notes due 2019, 8.000% notes due 2021, 4.500% notes due 2021, 4.750% notes due 2022, and 8.500% notes due 2024. In conjunction with the tender offers, we are soliciting consents from holders of certain of the notes to amend the indentures governing those notes to shorten the minimum notice period for optional redemption. The tender offers and consent solicitations are currently scheduled to expire on March 20, 2017, and may expire earlier in certain circumstances. We have reserved the right to amend, extend, terminate and otherwise modify the tender offers and consent solicitations.

114 Teck 2016 Annual Report | Every Day
Board of Directors
Norman B. Keevil (1) Chairman of the Board Director since: 1963
Warren S. R. Seyffert, Q.C. (1) (2) (3) (4) (5) Deputy Chairman and Lead Director Director since: 1989
Donald R. Lindsay (1) President and Chief Executive Officer Director since: 2005
Mayank M. Ashar (3) (5) (6) Director since: 2007
Quan Chong Director since: 2016
Jack L. Cockwell (1) (2) (6) Director since: 2009
Laura L. Dottori-Attanasio (2) (4) (5) Director since: 2014
Edward C. Dowling (1) (3) (4) (6) Director since: 2012
Eiichi Fukuda (6) Director since: 2016
Norman B. Keevil III (5) (6) Director since: 1997
Takeshi Kubota (5) (6) Director since: 2012
Tracey L. McVicar (2) (3) Director since: 2014
Kenneth W. Pickering (5) (6) Director since: 2015
Timothy R. Snider (2) (3) (4) Director since: 2015
Officers listed as at February 23, 2017. More information on our directors and officers can be found in our most recent Annual Information Form or in our Management Proxy Circular, which are available on our website at www.teck.com, on the Canadian Securities Administrators website at www.sedar.com (SEDAR), and on the EDGAR section of the United States Securities and Exchange Commission (SEC) website at www.sec.gov.
Notes: (1) Member of the Executive Committee; (2) Member of the Audit Committee; (3) Member of the Compensation Committee; (4) Member of the Corporate Governance and Nominating Committee; (5) Member of the Safety and Sustainability Committee; (6) Member of the Reserves Committee.
More information on our directors and officers can be found in our most recent Annual Information Form or in our Management Proxy Circular, which are available on our website at www.teck.com, on the Canadian Securities Administrators website at www.sedar.com (SEDAR), and on the EDGAR section of the United States Securities and Exchange Commission (SEC) website at www.sec.gov.
OfficersNorman B. Keevil Chairman of the Board
Warren S. R. Seyffert, Q.C. Deputy Chairman and Lead Director
Donald R. Lindsay President and Chief Executive Officer
Dale E. Andres Senior Vice President, Base Metals
Alex N. Christopher Senior Vice President, Exploration, Projects and Technical Services
Andrew J. Golding Senior Vice President, Corporate Development
Ronald A. Millos Senior Vice President, Finance and Chief Financial Officer
Raymond A. Reipas Senior Vice President, Energy
Peter C. Rozee Senior Vice President, Commercial and Legal Affairs
Robin B. Sheremeta Senior Vice President, Coal
Marcia M. Smith Senior Vice President, Sustainability and External Affairs
Andrew A. Stonkus Senior Vice President, Marketing and Sales
Gregory A. Waller Senior Vice President, Investor Relations and Strategic Analysis
Timothy C. Watson Senior Vice President,
Shehzad Bharmal Vice President, Planning and Development, Base Metals
Anne J. Chalmers Vice President, Risk and Security
Larry M. Davey Vice President, Planning and Development, Coal
Michael P. Davies Vice President, Environment
Christopher J. Dechert Vice President, Copper Operations, Chile
Karen L. Dunfee Corporate Secretary
Mark Edwards Vice President, Community and Government Relations
Réal Foley Vice President, Coal Marketing
John F. Gingell Vice President and Corporate Controller
M. Colin Joudrie Vice President, Business Development
Ralph J. Lutes Vice President, Asia
Douglas J. Powrie Vice President, Tax
Keith G. Stein Vice President, Project Development
Lawrence Watkins Vice President, Health and Safety
Scott R. Wilson Vice President and Treasurer
Dean C. Winsor Vice President, Human Resources

Our BusinessTeck is a diversified resource company committed to responsible mining and mineral development with business units focused on steelmaking coal, copper, zinc and energy. Headquartered in Vancouver, British Columbia (B.C.), Canada, we own or have interests in 12 operating mines, one large metallurgical complex, and several major development projects in Canada, the United States, Chile and Peru. We have expertise across a wide range of activities related to exploration, development, mining and minerals processing, including smelting and refining, safety, environmental protection, materials stewardship, recycling and research.
Our corporate strategy is focused on exploring for, developing, acquiring and operating world-class, long-life assets in stable jurisdictions that operate through multiple price cycles. We maximize productivity and efficiency at our existing operations, maintain a strong balance sheet, and are nimble in recognizing and acting on opportunities. The pursuit of sustainability guides our approach to business, and we recognize that our success depends on our ability to establish safe workplaces for our people and collaborative relationships with communities.
Mineral reserve and resource estimates for our properties are disclosed in our most recent Annual Information Form, which is available on our website at www.teck.com, on the Canadian Securities Administrators website at www.sedar.com (SEDAR), and on the EDGAR section of the United States Securities and Exchange Commission (SEC) website at www.sec.gov.
Forward-Looking StatementsThis annual report contains forward-looking statements. Please refer to the “Cautionary Statement on Forward-Looking Information” on page 49.
All dollar amounts expressed throughout this report are in Canadian dollars unless otherwise noted.
Our Business 1
2016 Highlights 2
Letter from the Chairman 3
Letter from the CEO 5
Responsibility 7
Management’s Discussion and Analysis 9
Steelmaking Coal 12
Copper 16
Zinc 21
Energy 25
Exploration 27
Financial Overview 28
Consolidated Financial Statements 51
Board of Directors 114
Officers 114
Corporate Information 115
In This Report
On the cover: Julia Dick, Utilityperson at Highland Valley Copper Operations. 115Corporate Information
Corporate Information
2016 Share Prices and Trading Volume
Class B subordinate voting shares–TSX–CAD$/share
High Low Close Volume
Q1 $ 11.99 $ 3.65 $ 10.14 386,550,338 Q2 $ 17.09 $ 9.05 $ 16.31 414,279,556 Q3 $ 24.89 $ 16.53 $ 24.59 278,290,368 Q4 $ 35.67 $ 22.38 $ 27.45 226,873,363
1,305,993,625
Class B subordinate voting shares–NYSE–US$/share
High Low Close Volume
Q1 $ 9.25 $ 2.56 $ 7.61 107,412,803 Q2 $ 13.20 $ 6.89 $ 13.17 142,055,779Q3 $ 19.07 $ 12.62 $ 18.03 110,330,313 Q4 $ 26.60 $ 16.95 $ 20.03 87,626,571
447,425,466
Class A common shares–TSX–CAD$/share
High Low Close Volume
Q1 $ 14.51 $ 5.69 $ 13.24 206,884 Q2 $ 18.05 $ 11.90 $ 18.05 167,709 Q3 $ 25.00 $ 17.40 $ 23.59 197,126 Q4 $ 36.49 $ 22.65 $ 31.00 523,450
1,095,169
Stock Exchanges Our Class A common shares and Class B subordinate voting shares are listed on the Toronto Stock Exchange under the symbols TECK.A and TECK.B, respectively.
Our Class B subordinate voting shares are also listed on the New York Stock Exchange under the symbol TECK.
Dividends Declared on Class A and B SharesAmount per share Payment Date $0.05 June 30, 2016 $0.05 December 30, 2016
These dividends are eligible for both the federal and provincial enhanced dividend tax credits.
Shares Outstanding at December 31, 2016Class A common shares 9,353,470 Class B subordinate voting shares 567,546,513
Shareholder RelationsKaren L. Dunfee, Corporate Secretary
Annual MeetingOur annual meeting of shareholders will be held at 11:00 a.m. on Wednesday, April 26, 2017, in the Waterfront Ballroom, Fairmont Waterfront Hotel, 900 Canada Place Way, Vancouver, British Columbia.
Transfer AgentsInquiries regarding change of address, stock transfer, registered shareholdings, dividends or lost certificates should be directed to our Registrar and Transfer Agent:
CST Trust Company 1600 – 1066 West Hastings Street, Vancouver, British Columbia V6E 3X1
CST Trust Company provides an AnswerLine Service for the convenience of shareholders:
Toll-free in Canada and the U.S. +1.800.387.0825Outside Canada and the U.S. +1.416.682.3860 Email: [email protected]
American Stock Transfer & Trust Company, LLC 6201 – 15th Avenue, Brooklyn, New York 11219 +1.800.937.5449 or +1.718.921.8124
Email: [email protected] Website: www.amstock.com TTY: +1.866.703.9077 or +1.718.921.8386
AuditorsPricewaterhouseCoopers LLP Chartered Professional Accountants Suite 700, 250 Howe Street, Vancouver, British Columbia V6C 3S7
Annual Information Form
We prepare an Annual Information Form (AIF) that is filed with the securities commissions or similar bodies in all the provinces of Canada. Copies of our AIF and annual and quarterly reports are available on request or on our website at www.teck.com, on the Canadian Securities Administrators website at www.sedar.com (SEDAR), and on the EDGAR section of the United States Securities and Exchange Commission (SEC) website at www.sec.gov.

Every Day 2016 Annual Report
Every Day
Teck 2016 An
nu
al Rep
ort
Teck Resources Limited Suite 3300, 550 Burrard Street Vancouver, British Columbia, Canada V6C 0B3 +1.604.699.4000 Tel +1.604.699.4750 Fax www.teck.com
Setting Possibilities in Motion