event detection using twitter: a spatio-temporal approach
TRANSCRIPT

Event Detection using Twitter: A Spatio-TemporalApproachTao Cheng*, Thomas Wicks
SpaceTimeLab, Department of Civil, Environmental and Geomatic Engineering, University College London, London, United Kingdom
Abstract
Background: Every day, around 400 million tweets are sent worldwide, which has become a rich source for detecting,monitoring and analysing news stories and special (disaster) events. Existing research within this field follows key wordsattributed to an event, monitoring temporal changes in word usage. However, this method requires prior knowledge of theevent in order to know which words to follow, and does not guarantee that the words chosen will be the most appropriateto monitor.
Methods: This paper suggests an alternative methodology for event detection using space-time scan statistics (STSS). Thistechnique looks for clusters within the dataset across both space and time, regardless of tweet content. It is expected thatclusters of tweets will emerge during spatio-temporally relevant events, as people will tweet more than expected in order todescribe the event and spread information. The special event used as a case study is the 2013 London helicopter crash.
Results and Conclusion: A spatio-temporally significant cluster is found relating to the London helicopter crash. Althoughthe cluster only remains significant for a relatively short time, it is rich in information, such as important key words andphotographs. The method also detects other special events such as football matches, as well as train and flight delays fromTwitter data. These findings demonstrate that STSS is an effective approach to analysing Twitter data for event detection.
Citation: Cheng T, Wicks T (2014) Event Detection using Twitter: A Spatio-Temporal Approach. PLoS ONE 9(6): e97807. doi:10.1371/journal.pone.0097807
Editor: Philip Bejon, Kenya Medical Research Institute (KEMRI), Kenya
Received February 25, 2014; Accepted April 24, 2014; Published June 3, 2014
Copyright: � 2014 Cheng, Wicks. This is an open-access article distributed under the terms of the Creative Commons Attribution License, which permitsunrestricted use, distribution, and reproduction in any medium, provided the original author and source are credited.
Funding: This work was partly supported by UK EPSRC (EP/J004197/1, Crime, Policing and Citizenship (CPC) - Space-Time Interactions of Dynamic Networks). Thefunders had no role in the study design, data analysis, decision to publish, or manuscript preparation and content.
Competing Interests: The authors have declared that no competing interests exist.
* E-mail: [email protected]
Introduction
Since its launch in 2006, Twitter has become one of the
internet’s most popular microblogging sites [1]. Its fundamental
premise relies on users sending messages, known as ‘tweets’, into a
hyper-real digital space, known as the Twittersphere [2,3]. This
concept has proven to be highly successful, with over 400 million
tweets sent worldwide each day [4]. Additionally, the advent of
GPS-enabled mobile platforms has augmented tweets, which were
previously only temporally annotated, with spatial information.
Accordingly, Twitter is emerging as a key resource of free and
open volunteered geographic information (VGI; [5]). While much
of this data is noise, containing non-descript communication and
chatter, some tweets contain attempts at citizen journalism [6],
whereby users describe and provide information about the world
around them.
This data is beginning to be used as a basis for detecting,
monitoring and analysing the characteristics of both natural and
man-made disasters. Currently, the literature relevant to Twitter
and disaster events uses a volumetric method of analysis.
Accordingly, present methodologies choose a selection of words
and hashtags to follow during an event, with tweets containing the
selected words being deemed relevant to the event. For example,
recent papers monitor tweets containing the word ‘‘earthquake’’
and other related words [7,8]. They assume that a spike in
earthquake-related tweets correlates with an earthquake event. In
doing this, 75% of earthquakes are detected by Twitter within two
minutes and, as such, outpace traditional geological survey
detections [8].
Similarly, this methodology of selecting tweets has been applied
within a variety of other disaster events, using the same technique
to select tweets containing key words relevant to the 2009
Oklahoma fires, such as ‘Oklahoma’, ‘grassfire’ and ‘OKfire’, in
order to study retweeting conventions during mass emergencies
[9]. Others utilise tweets containing the hashtag ‘#qldfloods’ to
analyse the 2011 flooding event in Queensland, Australia [10].
Similar studies analyse two separate hurricane events by utilising
tweets containing the word ‘hurricane’ as well as the respective
hurricane names [11].
However, the methodology described generates several issues
which severely hamper the results of these studies. Perhaps most
critically, following tweets containing only a select set of words
means that many other tweets relevant to the disaster event are
missed out entirely from the study. Additionally, the choice of
words to follow is subjective based on the authors’ perception of
the event. Furthermore, it requires some prior knowledge of the
event in question in order to know which words to track,
preventing instantaneous data collection from the very moment of
impact. Moreover, this method assumes that, during disasters,
Twitter users are independent and identically distributed [7]. This
assumption means that if a user tweets about an earthquake, their
followers are no more likely than normal to also tweet about an
PLOS ONE | www.plosone.org 1 June 2014 | Volume 9 | Issue 6 | e97807
earthquake. In reality, this assumption is unlikely to be true, which
may lead to spurious results.
Here the method of space-time scan statistics (STSS) is
introduced as a differing analytical technique which overcomes
some of the challenges faced by existing methodological frame-
works for event detection from Twitter data. This technique looks
for clusters within the dataset across both space and time,
regardless of tweet content. It is expected that clusters of tweets will
emerge during spatio-temporally relevant events, as people will
tweet more than expected in order to describe the event and
spread information.
The STSS technique is applied to a case study of the 2013
London helicopter crash. Its performance in detecting space-time
events is also evaluated for finding other events (including football
games and travel delays) at on an hourly or daily basis. It is shown
in the case study that, by using STSS, tweets can be more
appropriately selected and utilised as a live source of information
on (disaster) events compared to current methods. This is found to
be true, with spatio-temporally significant clusters found to exist
relating to the 2013 London helicopter crash.
Methods
2.1 Space Time Scan StatisticsIn order to achieve a more appropriate method for detecting
disaster events, a technique is required to identify the space-time
locations of tweet clusters. One method that achieves this is a
space-time scan statistic, implemented via the SatScanTM 9.0
software. STSS were first applied to epidemiological settings [12],
but have since been used in a variety of contexts, such as crime
[13,14], forest fires [15] and construction [16].
In principle, STSS views data points, known as incidences,
within a space-time cube. It then goes on to move a cylindrical
window, of varying radius (space) and height (time), across the
study area [17]. This process is repeated until all possible space-
time locations have been visited. Each window is then viewed as a
potential cluster; with the number of incidences within each being
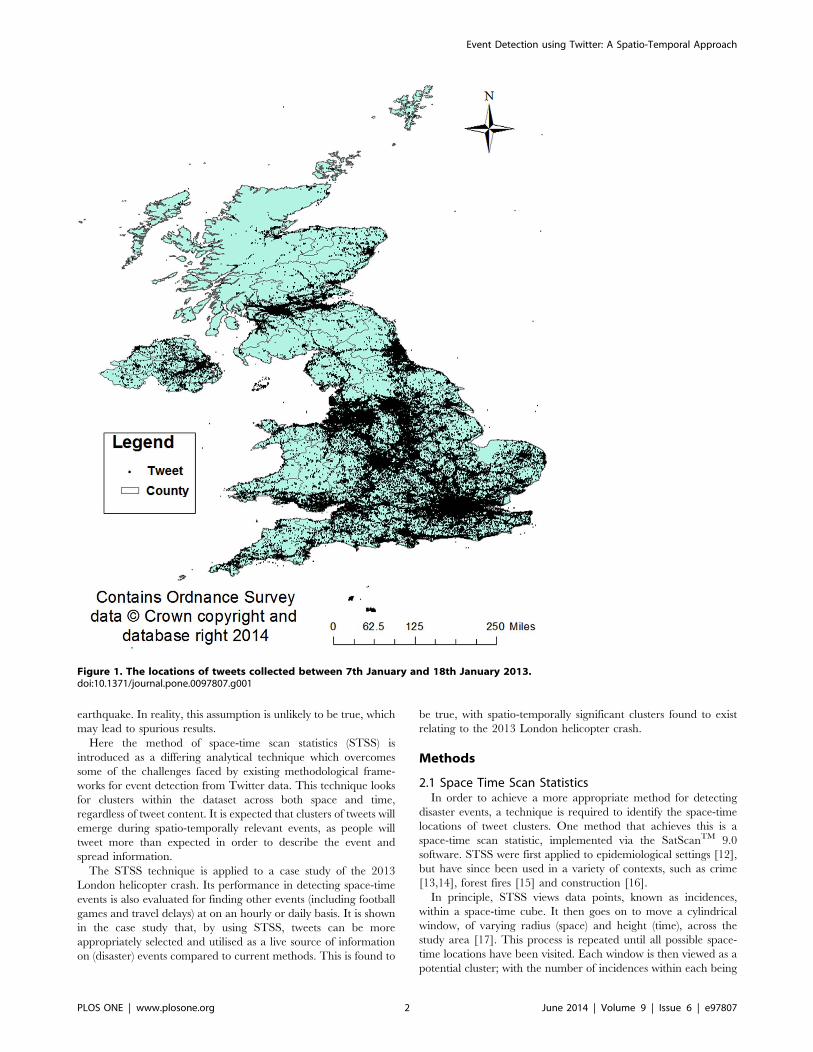
Figure 1. The locations of tweets collected between 7th January and 18th January 2013.doi:10.1371/journal.pone.0097807.g001
Event Detection using Twitter: A Spatio-Temporal Approach
PLOS ONE | www.plosone.org 2 June 2014 | Volume 9 | Issue 6 | e97807

compared to the number of expected incidences for that window.
This identifies cylinders which possess a greater than expected
number of incidences. Each cluster’s significance is then tested,
giving each a p-value, describing the likelihood that it occurred by
chance. For this study, p-values were generated using Gumbel
approximation due to the fact that it requires less processing time
than other methods and can produce small p-values with no lower
limit beyond p.0 [18]. It is thus suited to large datasets such as
those provided by Twitter.
It is important to note that STSS can be used either
retrospectively or prospectively. Retrospective analysis looks for
clusters across all possible time periods [12]. As such a cluster may
have occurred at the very beginning of the data, at the very end or
any period and length in-between. Accordingly, retrospective
analysis discovers historic clusters. On the other hand, prospective
analysis only looks for ‘alive clusters’ [12], meaning a cluster can
last any period of time, but must be ongoing within the most
recent time period. As this paper aims to look at the suitability of
STSS as a methodological tool for Twitter analysis, retrospective
analysis was used, in order to test whether the method can detect
historic disaster events.
Furthermore, a variety of STSS models are available for
analysis, such as the Bernoulli model, the Poisson model and the
permutation model. Each model’s use varies with the context
within which the data is being used. For this analysis, a space-time
permutation model (STPM) was used due to its flexibility when
compared to other models. The model simply requires data to
contain spatial and temporal attributes and requires no further
information, thus matching the attributes collected by each tweet.
Additionally, the STPM automatically allows for purely spatial
and purely temporal variations in a dataset. This is a critical
feature for Twitter data analysis given the large temporal and
spatial variations on the data, as illustrated by figures 1 and 2. A
detailed methodology of the STPM goes beyond the scope of this
paper but is provided in [19].
2.2 Latent Dirichlet AllocationHaving used a STPM for cluster detection, a method is required
to evaluate whether clusters relate to space-time events. In order to
do this, tweets must be classified into groups of topics that describe
their content. This could be undertaken manually, by reading
tweets and classifying them into topics. However, this would be
subjective and take a considerable amount of time.
Instead, it is possible to use unsupervised learning algorithms,
such as Latent Dirichlet Allocation (LDA), to classify tweets into
topics. These topics can then be analysed to see what the general
theme for each cluster is. LDA was first introduced for general text
classification [20] and has subsequently been applied to classifying
Twitter data [21–24]. LDA builds on the ‘‘bag of words’’
approach [25], where each sentence is seen to contain a set of
words. The frequency of these words is then extracted to create a
probability distribution of key terms that are likely to be found in
each topic. This distribution goes on to provide a probabilistic list
of key terms that define each topic [24]. Accordingly, within this
study, clusters are classified by the terms contained within each
cluster’s topics, with those found to represent space-time events
being used for further analysis. Four topics will be searched for
within each significant space-time cluster. This number of topics
has been chosen to align with other research, such as [24], which
also uses four topics during tweet classification. LDA was
conducted using R version 3.0.1 and the ‘‘RTextTools’’ [26]
and ‘‘topicmodels’’ [27] packages.
2.3 Data CollectionData are acquired through the use of the Twitter streaming
application programming interface (API) [28], which offers a live
feed of tweets to be downloaded free of charge [29]. Moreover, it
allows filtering of the live stream using a variety of parameters
[30]. This project only downloads tweets that originate from geo-
enabled users within a bounding box set of coordinates containing
the UK. Each tweet contained attributes such as the latitude and
longitude of where the tweet was sent, the time it was sent, the
tweet content and the tweet originator’s username.
The use of Twitter’s streaming API suffers from some
limitations. The API only allows a maximum of 1% of the
available Twitter stream to be freely downloaded [31]. As such,
the vast majority of tweets are actually never collected with this
method. Moreover, only 1%, of users geo-tag their tweets [32].
This is because this service is ‘opt-in’ rather than set as a default.
Yet, as roughly 1% of tweets are geo-enabled, the vast majority are
downloaded by the 1% allowance of the API when filtering by
location (i.e. the 1% downloaded are the 1% of geo-enabled
Table 1. The two temporal aggregations used during space-time scan statistics.
Time Frame Temporal Aggregation No. of Time Periods Reason for Inclusion
14/01/2013–18/01/2013 Days 5 Includes crash date (16/01/2013) and the two days either side.
16/01/2013–17/01/2013 Hours 48 To look at the hourly significance of the helicopter crash.
doi:10.1371/journal.pone.0097807.t001
Figure 2. The temporal distribution of tweets collectedbetween 7th January and 18th January 2013.doi:10.1371/journal.pone.0097807.g002
Event Detection using Twitter: A Spatio-Temporal Approach
PLOS ONE | www.plosone.org 3 June 2014 | Volume 9 | Issue 6 | e97807

tweets) [31]. As such, a fairly comprehensive sample of geo-tagged
tweets is collected.
Additionally, it is important to remember that Twitter is an
inherently biased data source due to the demographics of its users.
For example, when looking at the age of users, 26% are under 22
years old, while 60% are under 35 [33]. While it is important to
bear this in mind, for the purposes of this research there will be no
impact on the types of events detected if we assume the group of
people share a consistent behaviour of using Twitter to commu-
nicate with their friends or share the news. Furthermore, it is
assumed that disaster events make significant emotional impact on
all people, regardless of their demographics. Accordingly, there
should be minimal bias within the dataset when it comes to
Twitter reporting significant events.
2.4 The CaseAt 7:59 am on the 16th January 2013, a helicopter crashed into
a crane attached to St. George’s Warf Tower, Vauxhall [34].
Freezing fog had drastically reduced visibility levels, causing the
pilot to divert from the planned route and lower his altitude. Upon
hitting the crane, debris was scattered over the surrounding area.
A section of crane fell onto Nine Elms Lane, while the helicopter
crashed onto Wandsworth Road [34]. During the incident, the
pilot was killed, along with a pedestrian [34]. A further 12 people
sustained injuries [35].
In order to study this event, data were collected between the 7th
January 2013 and 18th January 2013. This generated 1,852,700
unique tweets from the UK, with 183,731 originating from
Greater London. This date range was chosen in order to collect
tweets from the week before and two days after the crash. A longer
date range after the crash was not possible due to the Twitter API
server connection failing between 19th January and 21st January
2013 inclusive.
Results
3.1 Exploratory Data AnalysisFigure 1 maps the spatial extent of tweets collected from within
the United Kingdom. As can be seen, tweets are dispersed
throughout the region. However, the majority of tweets are
generated from within major urban conurbations such as London,
Birmingham and Manchester. Additionally, major arterial road
and train lines can be seen as areas which generate high tweet
volumes.
Figure 2 explores the temporal dimensions of the tweets
collected. As can be seen, there are clear daily fluctuations in
tweet volumes generated within the UK. It should be noted that
during the mornings of the 7th January and 10th of January, the
server connection to the Twitter API failed and accordingly no
tweets were collected during this time. Yet, clear patterns can be
seen from this graph. First, the early morning period (between
Table 2. Initial results from the space-time scan statistic model across differing temporal aggregations.
Time Aggregation Total Number of Clusters Reported Number of Significant Clusters (P,0.05)
Days 87 30
Hours 48 33
doi:10.1371/journal.pone.0097807.t002
Figure 3. Significant hourly clusters within London between 16th January and 17th January 2013.doi:10.1371/journal.pone.0097807.g003
Event Detection using Twitter: A Spatio-Temporal Approach
PLOS ONE | www.plosone.org 4 June 2014 | Volume 9 | Issue 6 | e97807

1 AM and 6 AM) consistently sees very few tweets generated.
Secondly, the morning period (7 AM to 12 PM) sees a relatively
high volume of tweets being sent. Next, the afternoon period
(2 PM to 4 PM) sees a fall in the number of tweets generated
within the UK. Lastly, the evening period (5 PM to 11 PM) sees a
large increase in Twitter activity, particularly around 9 PM and
10 PM.
However, two anomalies differ from these patterns. The days of
12th January and 13th January exhibit a substantially different
tweet pattern to the rest of the days sampled. It is likely that this is
due to these days being weekends. These days see an elongated
early morning peak with few tweets sent, with a large volume
during the afternoon. The number of evening tweets is then
considerably lower than other days. Moreover, the morning of the
18th January saw a large increase in the number of tweets sent. It
is likely that this is down to a large overnight snowstorm which hit
much of the UK causing unexpectedly large tweet volumes.
3.2 Space-time Scan Statistic AnalysisDue to the large volume of Twitter data, it is necessary to
aggregate tweets into small periods, such as days and hours. Using
a longer time period, such as days means a larger amount of data
can be used for analysis. Using smaller time periods, such as hours
means smaller datasets must be used to meet memory require-
ments. In this paper we study two different period lengths to assess
which is best applied to Twitter. The search is looking for very
localized and time specific events, so small maximum temporal
and spatial cluster length would seem appropriate. However, it
was not possible to determine ab initio how spatially temporally
localised the event would be. Selecting lower values may artificially
reduce the apparent spatial extent of the clusters. Therefore, the
maximum temporal size was 50% of the period and the maximum
spatial size was 50% of the length of the region considered (these
are the default values of the SatScan software).
Table 1 outlines the different periods used. When analysing the
data with these two varying aggregations, differing numbers of
clusters are found. Table 2 summarises the results generated by
Table 3. Significant clusters identified during daily aggregations using Latent Dirichlet Allocation and their associated topics.
Cluster Event Topic One Topic Two Topic Three Topic Four
Arsenal V Swansea Emirates Swansea Arsenal Good
Chelsea V Southampton Premiership Stamford Good Bridge
London Helicopter Crash Crane Vauxhall Helicopter Thanks
New York Knicks Vs Detroit Pistonsat the 02 Arena
York Knicks Greenwich Pistons
Train Delay A Train C2cRail Away Electricity
Train Delay B Back Hour Thank C2cRail
doi:10.1371/journal.pone.0097807.t003
Figure 4. A top view of significant hourly clusters within London between 16th January and 17th January 2013.doi:10.1371/journal.pone.0097807.g004
Event Detection using Twitter: A Spatio-Temporal Approach
PLOS ONE | www.plosone.org 5 June 2014 | Volume 9 | Issue 6 | e97807

SatScan and reports the number of clusters found. As can be seen,
large numbers of clusters are found for both time frames. It is
expected that the majority of these clusters contain noise, and are
not attributable to any event in particular. However, this theory
cannot be proven until clusters are classified. Interestingly, using
hourly aggregation generated the highest number of significant
clusters, but a substantially lower number of overall clusters when
compared to daily aggregations. This suggests that while fewer
clusters exist using this temporal aggregation, more of those that
do exist are significant than when using daily aggregations.
Figure 3 maps the cluster outputs generated in an oblique view
when using hourly aggregations within a space-time cube. Figure 4
is a top view of Figure 3, which shows the precise location and the
size of these clusters in a 2-dimensional space. As it can be seen,
clusters are spatio-temporally dispersed and display varying spatial
and temporal ranges. However, these maps contain little useful
information when trying to identify clusters related to the case
study disaster event. In order to do this, clusters are classified into
four descriptive topics using LDA. If at least half of the topics
discovered are attributable to a space-time event, then it is
assumed the tweet cluster relates to the real world event. If less
than half of the topics can be attributed to an event, it is assumed
the cluster does not represent a space-time event and is a spurious
result. Table 3 provides the LDA topics generated for clusters
which can be attributed to space-time events for daily aggrega-
tions, while table 4 provides the LDA topics for hourly
aggregations. Terms deemed pertinent to the event are highlighted
in orange while non-pertinent terms are highlighted in blue.
As can be seen, both time aggregations pick up similar events.
The exception to this is that only daily aggregations detect the
Chelsea V Southampton football match, while only hourly
aggregations detect a cluster relating to Heathrow airport.
Crucially, both time aggregations detect a cluster relevant to the
London helicopter crash, suggesting that STSS can be utilised to
detect space-time disaster events using Twitter.
Looking at Table 3, three of the detected clusters represent
sporting events, two represent train delays and one represents the
helicopter crash. Some clusters, such as the NBA game, contain
topics that are all relevant to the event; while others, such as train
delay B, contain some words deemed relevant (‘‘Hour’’ and
Figure 5. Daily cluster events identified within London between 14th January and 18th January 2013.doi:10.1371/journal.pone.0097807.g005
Table 4. Significant clusters identified during hourly aggregations using Latent Dirichlet Allocation and their associated topics.
Cluster Event Topic One Topic Two Topic Three Topic Four
Arsenal V Swansea Arsenal Swansea Emirates Stadium
London Heathrow Airport Amazed Back Day Airport
London Helicopter Crash Vauxhall Crash Helicopter Thanks
New York Knicks Vs Detroit Pistonsat the O2 Arena
Knicks Arena NYKnicks Greenwich
Train Delay A That Announcement Train Electricity
Train Delay B c2crail Ham Limehouse F**k
doi:10.1371/journal.pone.0097807.t004
Event Detection using Twitter: A Spatio-Temporal Approach
PLOS ONE | www.plosone.org 6 June 2014 | Volume 9 | Issue 6 | e97807
‘‘c2cRail’’) and some noise (‘‘Back’’ and ‘‘Thanks’’). Accordingly,
some tweets from this cluster may still be noise.
Studying Table 4, train delay B has two key terms based on
location (‘‘Ham’’, based on West Ham, and ‘‘Limehouse’’).
Interestingly, the key term ‘‘f**k’’ emerges in topic four, suggesting
some tweets within this cluster are less than happy with the train
being delayed. In addition, it is noticeable that three clusters are
found to have all four topics relevant to an event, suggesting these
clusters contain very little noise compared to those found at daily
aggregations.
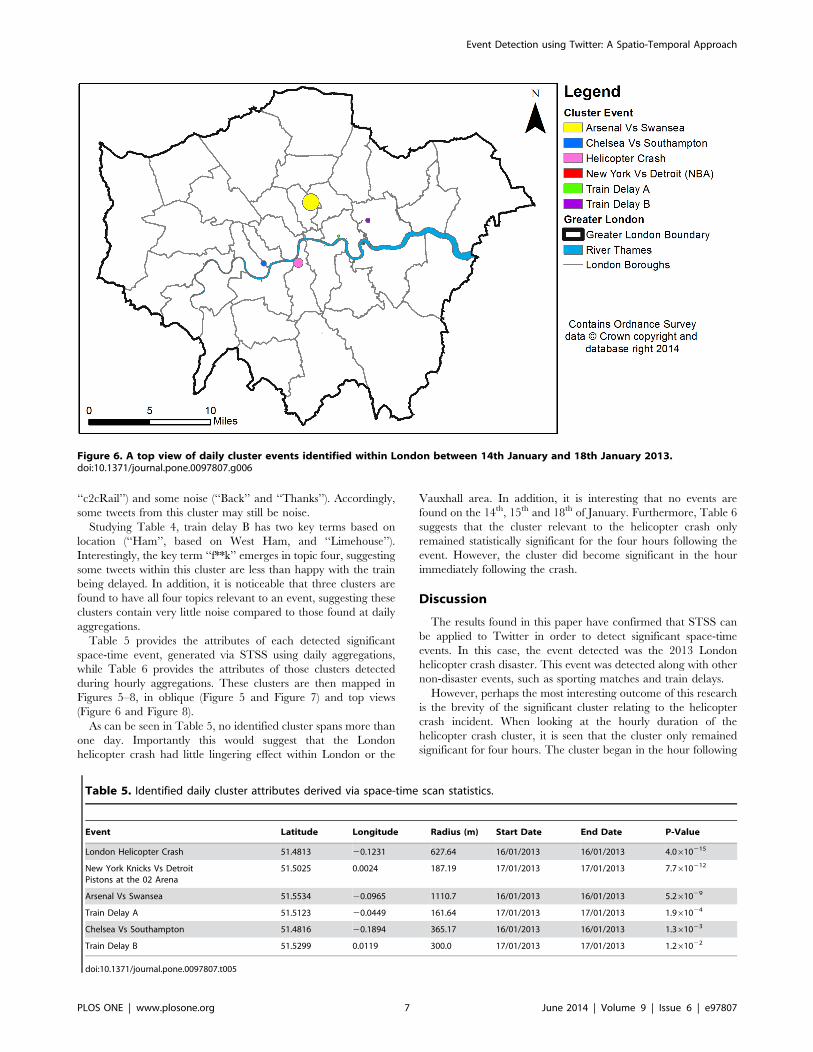
Table 5 provides the attributes of each detected significant
space-time event, generated via STSS using daily aggregations,
while Table 6 provides the attributes of those clusters detected
during hourly aggregations. These clusters are then mapped in
Figures 5–8, in oblique (Figure 5 and Figure 7) and top views
(Figure 6 and Figure 8).
As can be seen in Table 5, no identified cluster spans more than
one day. Importantly this would suggest that the London
helicopter crash had little lingering effect within London or the
Vauxhall area. In addition, it is interesting that no events are
found on the 14th, 15th and 18th of January. Furthermore, Table 6
suggests that the cluster relevant to the helicopter crash only
remained statistically significant for the four hours following the
event. However, the cluster did become significant in the hour
immediately following the crash.
Discussion
The results found in this paper have confirmed that STSS can
be applied to Twitter in order to detect significant space-time
events. In this case, the event detected was the 2013 London
helicopter crash disaster. This event was detected along with other
non-disaster events, such as sporting matches and train delays.
However, perhaps the most interesting outcome of this research
is the brevity of the significant cluster relating to the helicopter
crash incident. When looking at the hourly duration of the
helicopter crash cluster, it is seen that the cluster only remained
significant for four hours. The cluster began in the hour following
Figure 6. A top view of daily cluster events identified within London between 14th January and 18th January 2013.doi:10.1371/journal.pone.0097807.g006
Table 5. Identified daily cluster attributes derived via space-time scan statistics.
Event Latitude Longitude Radius (m) Start Date End Date P-Value
London Helicopter Crash 51.4813 20.1231 627.64 16/01/2013 16/01/2013 4.0610215
New York Knicks Vs DetroitPistons at the 02 Arena
51.5025 0.0024 187.19 17/01/2013 17/01/2013 7.7610212
Arsenal Vs Swansea 51.5534 20.0965 1110.7 16/01/2013 16/01/2013 5.261029
Train Delay A 51.5123 20.0449 161.64 17/01/2013 17/01/2013 1.961024
Chelsea Vs Southampton 51.4816 20.1894 365.17 16/01/2013 16/01/2013 1.361023
Train Delay B 51.5299 0.0119 300.0 17/01/2013 17/01/2013 1.261022
doi:10.1371/journal.pone.0097807.t005
Event Detection using Twitter: A Spatio-Temporal Approach
PLOS ONE | www.plosone.org 7 June 2014 | Volume 9 | Issue 6 | e97807

the crash (8 AM), indicating Twitter’s speed at reporting disaster
events. However, by midday the cluster had lost significance,
suggesting that the crash made little lasting impact on Twitter.
This is surprising giving the magnitude of the crash. However, the
lack of tweets may be explained by the fact that many local travel
amenities such as bus shelters, train stations and roads were closed
because of the crash [36], causing fewer tweets from the Vauxhall
area. Somewhat unexpectedly, the cluster failed to span into the
next day, even though the local area still saw heavy disruption on
the following day [37]. One possible explanation is the presence of
nationwide media reports creating tweets that were uniformly
generated across space. This may have produced a purely
temporal cluster of relevant tweets, which would not be picked
up using the methodology put forward in this paper.
Conclusions
This paper has aimed to identify a new methodology for
identifying disaster events using Twitter data. This has been
successfully achieved using STSS. It has been found that not only
can STSS be applied to Twitter, but that abnormal space time
clusters did exist within Twitter relating to the London helicopter
crash disaster, as well as other space-time events such as sport
fixtures and train delays.
This result means that future disaster events can now be
detected without the issues associated with current event detection
methodologies. Accordingly, future events can be more accurately
detected, followed and responded to. However, further research is
still required to improve upon this technique. Firstly, different
disaster events should be analysed to ensure that STSS could be
applied to varying types of disasters. Secondly, work should be
undertaken exploring the possibility of applying prospective STSS
to real-time surveillance of emerging space-time clusters. If
prospective STSS is found to be applicable to identifying emerging
events from Twitter, then the future of disaster detection and
response could become more efficient, more dynamic and more
powerful.
Acknowledgments
We would like to thanks James Haworth, Ed Manley, Monsuru Adepeju,
Alistair Leak and Gabriel Rosser for the help and support during this
research. We also thank two reviewers for their constructive comments,
which improved the readability of the paper.
Author Contributions
Conceived and designed the experiments: TC TW. Performed the
experiments: TW TC. Analyzed the data: TW TC. Contributed
reagents/materials/analysis tools: TC TW. Wrote the paper: TC TW.
Table 6. Identified hourly cluster attributes derived via space-time scan statistics.
Event Latitude Longitude Radius (m) Start Date End Date P-Value
London Helicopter Crash 51.485 20.1239 806.19 16/01/2013 08:00 16/01/2013 11:00 1.0610217
Train Delay B 51.5247 0.0047 1109.6 17/01/2013 09:00 17/01/2013 09:00 2.3610211
Arsenal Vs Swansea 51.555 20.1084 387.22 16/01/2013 17:00 16/01/2013 20:00 9.961029
New York Knicks Vs Detroit Pistonsat the 02 Arena
51.5035 0.0018 195.25 17/01/2013 19:00 17/01/2013 21:00 1.161028
Train Delay A 51.5123 20.0449 142.84 17/01/2013 08:00 17/01/2013 09:00 1.161027
London Heathrow Airport 51.473 20.4622 1732.9 16/01/2013 05:00 16/01/2013 06:00 8.561024
doi:10.1371/journal.pone.0097807.t006
Figure 7. Hourly cluster events identified within London between 16th January and 17th January 2013.doi:10.1371/journal.pone.0097807.g007
Event Detection using Twitter: A Spatio-Temporal Approach
PLOS ONE | www.plosone.org 8 June 2014 | Volume 9 | Issue 6 | e97807

References
1. Java A, Song X, Finin T, Tseng B (2007) Why we twitter: understanding
microblogging usage and communities, Proc of the 9th WebKDD and 1st SNA-KDD 2007 Workshop on Web Mining and Social Network Analysis: 56–65.
2. Arceneaux N, Weiss A (2010) Seems stupid until you try it: press coverage of
Twitter, 2006–9. New Media and Society 12: 1262–1279.
3. Boyd D, Golder S, Lotan G (2010). Tweet, tweet, retweet: Conversational
aspects of retweeting on twitter. 43rd Hawaii International Conference onSystem Sciences (HICSS): 1–10.
4. Wickre K (2013) Celebrating #Twitter7. Available: https://blog.twitter.com/2013/celebrating-twitter7. Accessed 2013 Jun 10.
5. Goodchild M (2007) Citizens as sensors: the world of volunteered geography.GeoJournal 69: 211–221.
6. De Longueville B, Smith R, Luraschi G (2009) ‘‘OMG, from here I can see the
flames!’’: a use case of mining location based social networks to acquire spatio-temporal data on forest fires. Proc of the 2009 Int Workshop on Location Based
Social Networks: 73–80.
7. Sakaki T, Okazaki M, Matsuo Y (2010) Earthquake shakes Twitter users: real-
time event detection by social sensors. Proc of the 19th Int Conf on the WorldWide Web: 851–860.
8. Earle P, Bowden D, Guy M (2011) Twitter earthquake detection: earthquake
monitoring in a social world. Annals of Geophysics 55: 708–713.
9. Starbird K, Palen L (2010) Pass it on? Retweeting in mass emergency.
Proceedings of the 7th Int Conf of Inf Sys for Crisis Response and Management:1–10.
10. Bruns A, Burgess J, Crawford K, Shaw F (2012) #qldfloods and @QPSMedia:crisis communication on Twitter in the 2011 South East Queensland Floods.
ARC Centre of Excellence for Creative Industries and Innovation (CCI):
Brisbane.
11. Hughes A, Palen L (2009) Twitter adoption and use in mass convergence and
emergency events. Int J of Emergency Management 6: 248–260.
12. Kulldorff M (2010) SatScan user guide for version 9.0. Available: http://www.
s a t s c a n . o r g / c g i - b i n / s a t s c a n / r e g i s t e r . p l /C u r r e n t % 2 0 V e r s i o n : % 2 0 S a T S c a n % 2 0 v 9 . 1 .
1%20released%20March%209%202011.?todo = process_userguide_download.Accessed 2013 Jun 16.
13. Nakaya T, Yaho K (2010) Visualising crime clusters in a space-time cube: an
exploratory data-analysis approach using space-time kernel density estimationand scan statistics. Trans GIS 14: 223–239.
14. Cheng T, Adepeju M (2013) Detecting emerging space-time crime patterns byprospective STSS. Proc of the 12th International Conference on GeoComputa-
tion. Available: http://www.geocomputation.org/2013/papers/77.pdf. Ac-cessed 2014 Jan 31.
15. Vadrevu K (2008) Analysis of fire events and controlling factors in eastern India
using spatial scan and multivariate statistics. Geographiska Annaler 90(4): 315–
328.
16. Stevenson J, Emrich C, Mitchell J, Cutter S (2010) Using building permits to
monitor disaster recovery: a spatio-temporal case study of coastal Mississippi
following Hurricane Katrina. Cartogr Geogr Inf Sci 37: 57–68.
17. Block R (2007) Software review: scanning for clusters in space and time: a
tutorial review of SatScan. Soc Sci Comput Rev 25: 272–278.
18. Abrams A, Kleinman K, Kulldorff M (2010) Gumbel based p-value
approximations for spatial scan statistics. Int J of Health Geographies 9: 61–73.
19. Kulldorff M, Heffernan R, Hartman J, Assuncao R, Mostashari F (2005) A
space-time permutation scan statistic for disease outbreak detection. PloS Med 2:
e59.
20. Blei D, Ng A, Jordan M (2003) Latent Dirichlet Allocation. J Mach Learn Res 3:
993–1022.
21. Ramage D, Dumais S, Liebling D (2010) Characterising microblogs with topic
models. Proc of the 4th Int AAAI Conf on Weblogs and Social Media: 130–137.
22. Ritter A, Cherry C, Dolan B (2010) Unsupervised modelling of Twitter
conversations. The 2010 Annual Conf of the North American Chapter of the
ACL, Human Language Technologies: 172–180.
23. Markman V (2011) Unsupervised discovery of fine-grained topic clusters in
Twitter posts. Papers from the AAAI Workshop on Analysing Microtext: 32–37.
24. Chae J, Thom D, Bosch H, Jang Y, Ebert D, et al. (2012) Spatiotemporal Social
Media Analytics for Abnormal Event Detection and Examination using
Seasonal-Trend Decomposition. 2012 IEEE Conf on Visual Analytics Science
and Technology: 143–152.
25. Hong L, Davison B (2010) Empirical study of topic modelling on Twitter. Proc
of the First Workshop on Social Media Analytics: 80–88.
26. Jurka T, Collingwood L, Boydstun A, Grossman E, Atteveldt W (2012)
RTextTools: Automatic Text Classification via Supervised Learning. R package
version 1.3.9. Available: http://CRAN.R-project.org/package =RTextTools.
27. Gruen B, Hornik K (2011) Topic models: an R package for fitting topic models.
J Stat Softw 40: 1–30.
28. Twitter (2013a) The Streaming APIs. Available: https://dev.twitter.com/docs/
streaming-apis. Accessed 2013 Oct 11.
29. Oussalah M, Bhat F, Challis K, Schnier T (2013). A software architecture for
Twitter collection, search and geolocation services. Knowl Based Sys 37: 105–
120.
30. Twitter (2013b). Streaming API request parameters. Available: https://dev.
twitter.com/docs/streaming-apis/parameters#locations. Accessed 2013 Jul 23.
Figure 8. A top view of hourly cluster events identified within London between 16th January and 17th January 2013.doi:10.1371/journal.pone.0097807.g008
Event Detection using Twitter: A Spatio-Temporal Approach
PLOS ONE | www.plosone.org 9 June 2014 | Volume 9 | Issue 6 | e97807

31. Morstatter F, Pfeffer J, Liu H, Carley K (2013) Is the sample good enough?
Comparing data from Twitter’s streaming API with Twitter’s firehose. Proc ofthe Seventh Int Conf on Weblogs and Social Media.
32. Li L, Goodchild M, Xu B (2013) Spatial, temporal and socioeconomic patterns
in the use of Twitter and Flickr. Cartogr Geogr Inf Sci 40: 61–77.33. Hampton K, Goulet L, Rainie L, Purcell K (2011) Social networking sites and
our lives. Pew Research Center’s Internet & American Life Project, Washington,DC.
34. Air Accident Investigation Branch (2013) Air Accident Investigation Branch
bulletin S1/2013 special. Available: http://www.aaib.gov.uk/cms_resources.cfm?file = /AAIB%20S1-2013%20G-CRST.pdf. Accessed 2013 Jul 29.
35. BBC (2013) London helicopter crash: two die in Vauxhall crane accident.
Available: http://www.bbc.co.uk/news/uk-england-21040410. Accessed 2013
Jul 29.
36. Transport for London (2013) TFL travel advice to road users following
helicopter crash in Vauxhall. Available: http://www.tfl.gov.uk/corporate/
media/newscentre/archive/26791.aspx. Accessed 2013 Aug 13.
37. Greater London Authority (2013) Vauxhall helicopter crash- travel update, 17th
January. Available: http://www.london.gov.uk/mayor-assembly/mayor/
london-resilience/london-prepared-blog/2013/01/vauxhall-helicopter-crash-
travel-update-17-january. Accessed 2013 Aug 13.
Event Detection using Twitter: A Spatio-Temporal Approach
PLOS ONE | www.plosone.org 10 June 2014 | Volume 9 | Issue 6 | e97807