evaluation of maxim module-integrated electronics at the ... · evaluation of maxim...
TRANSCRIPT
NREL is a national laboratory of the U.S. Department of Energy, Office of Energy Efficiency and Renewable Energy, operated by the Alliance for Sustainable Energy, LLC.
Evaluation of Maxim Module-Integrated Electronics at the DOE Regional Test Centers
40th IEEE PVSC, Denver, CO June 10, 2014 Chris Deline, Bill Sekulic, Stephen
Barkaszi, Jeff Yang, Seth Kahn NREL/PR-5J00-62171
2
Agenda
• DOE’s Regional Test Centers • Maxim PV power electronics • Inter-row shading experiment • Diffuse shading results
3
Agenda
• DOE’s Regional Test Centers • Maxim PV power electronics • Inter-row shading experiment • Diffuse shading results
4
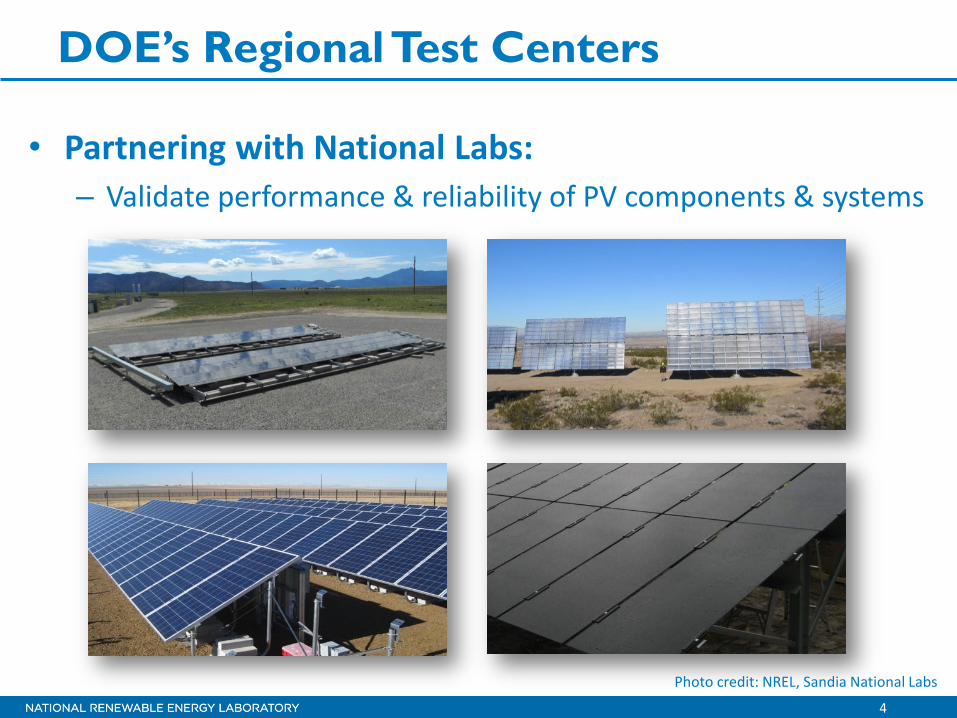
• Partnering with National Labs: – Validate performance & reliability of PV components & systems
DOE’s Regional Test Centers
Photo credit: NREL, Sandia National Labs
5
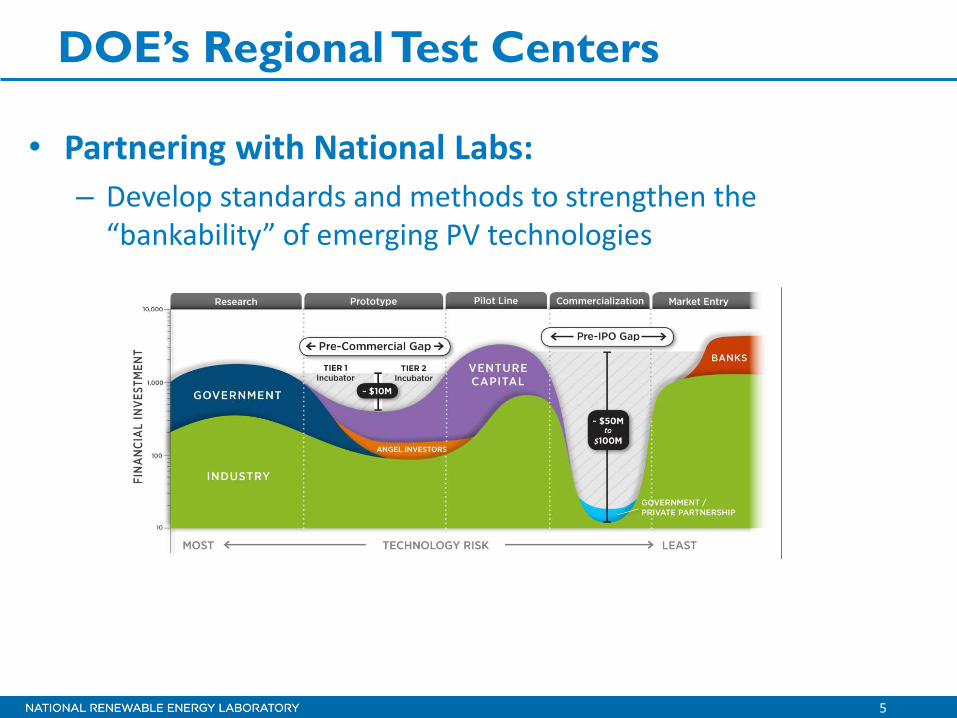
• Partnering with National Labs: – Develop standards and methods to strengthen the
“bankability” of emerging PV technologies
DOE’s Regional Test Centers

6
Five RTC Sites = Climatic Diversity
7
Agenda
• DOE’s Regional Test Centers • Maxim PV power electronics • Inter-row shading experiment • Diffuse shading results
8
Recoverable vs. Non-recoverable loss in PV
0
10
20
Volts
Cur
rent
0 50 100 1500
500
1000
Pow
er
Global max [A]Local max [B]
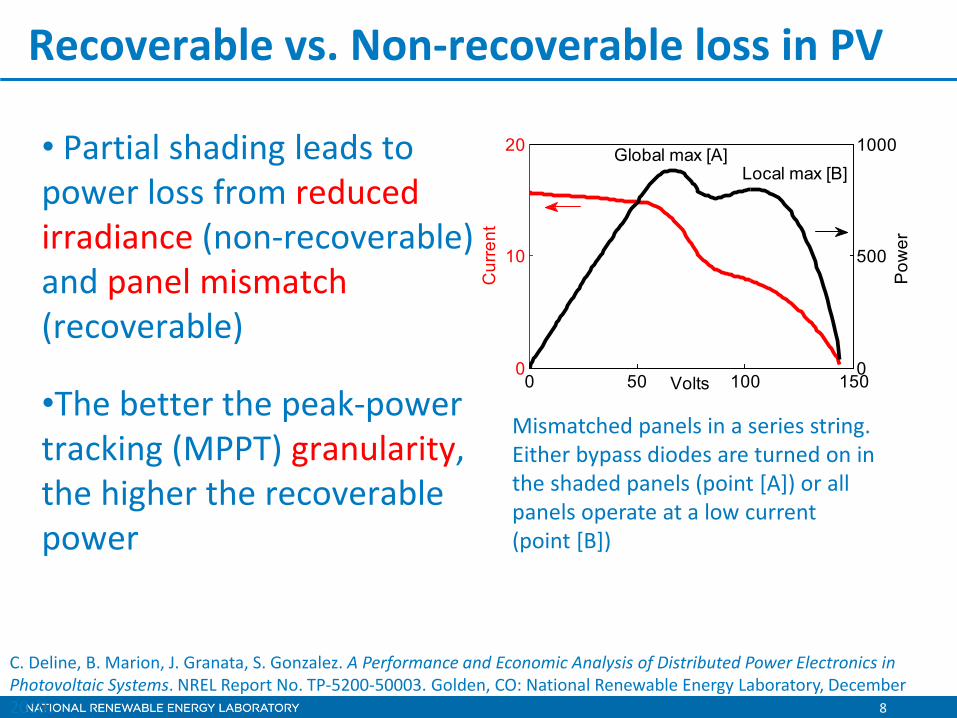
• Partial shading leads to power loss from reduced irradiance (non-recoverable) and panel mismatch (recoverable)
•The better the peak-power tracking (MPPT) granularity, the higher the recoverable power
Mismatched panels in a series string. Either bypass diodes are turned on in the shaded panels (point [A]) or all panels operate at a low current (point [B])
C. Deline, B. Marion, J. Granata, S. Gonzalez. A Performance and Economic Analysis of Distributed Power Electronics in Photovoltaic Systems. NREL Report No. TP-5200-50003. Golden, CO: National Renewable Energy Laboratory, December 2010.
9
2.15 cm
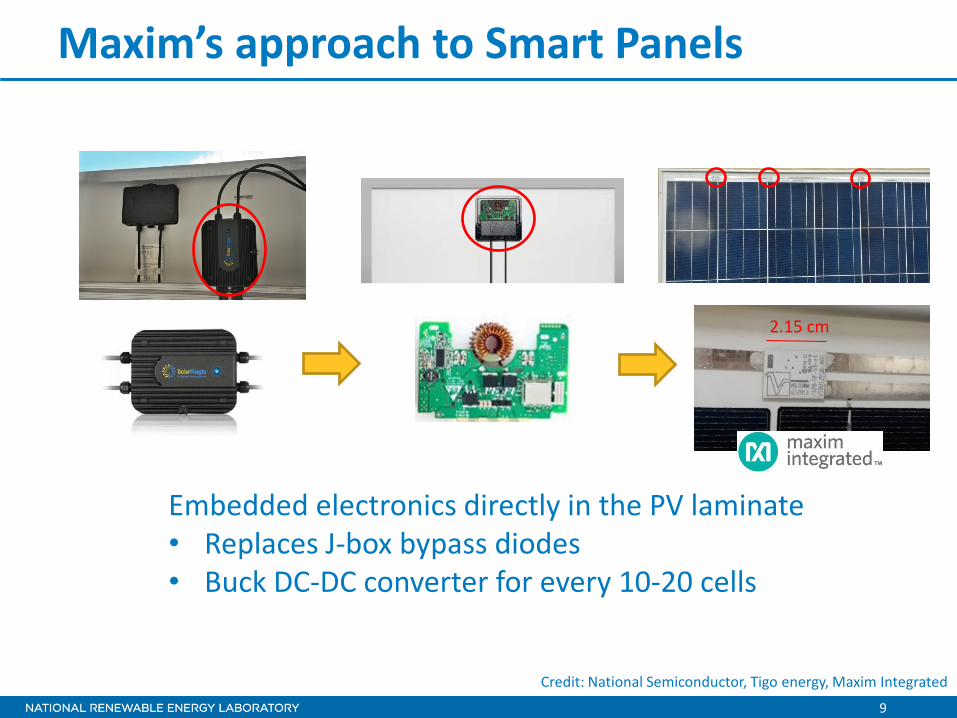
Maxim’s approach to Smart Panels
Embedded electronics directly in the PV laminate • Replaces J-box bypass diodes • Buck DC-DC converter for every 10-20 cells
Credit: National Semiconductor, Tigo energy, Maxim Integrated
10
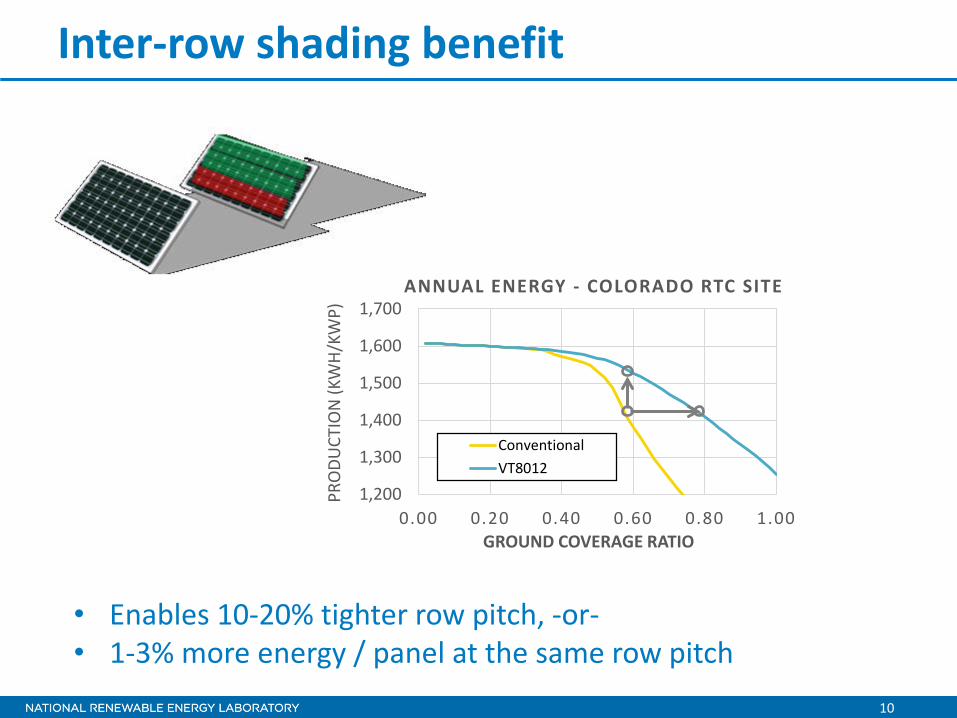
Inter-row shading benefit
1,200
1,300
1,400
1,500
1,600
1,700
0.00 0.20 0.40 0.60 0.80 1.00
PRO
DUCT
ION
(KW
H/KW
P)
GROUND COVERAGE RATIO
ANNUAL ENERGY - COLORADO RTC SITE
ConventionalVT8012
• Enables 10-20% tighter row pitch, -or- • 1-3% more energy / panel at the same row pitch
11
Agenda
• DOE’s Regional Test Centers • Maxim PV power electronics • Inter-row shading experiment • Diffuse shading results
12
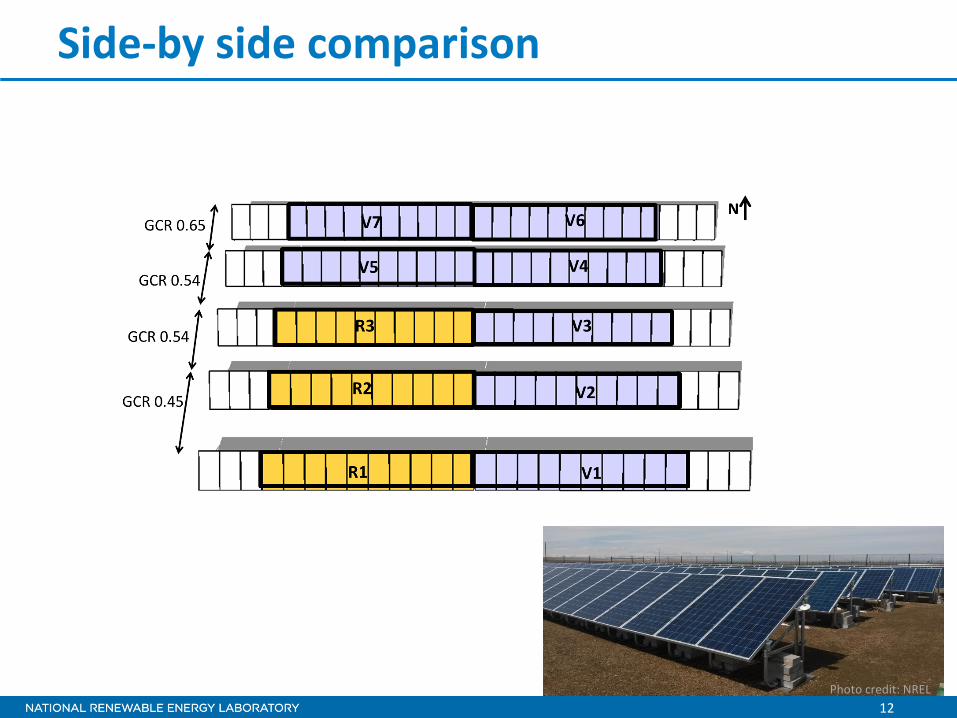
Side-by side comparison
Photo credit: NREL
13
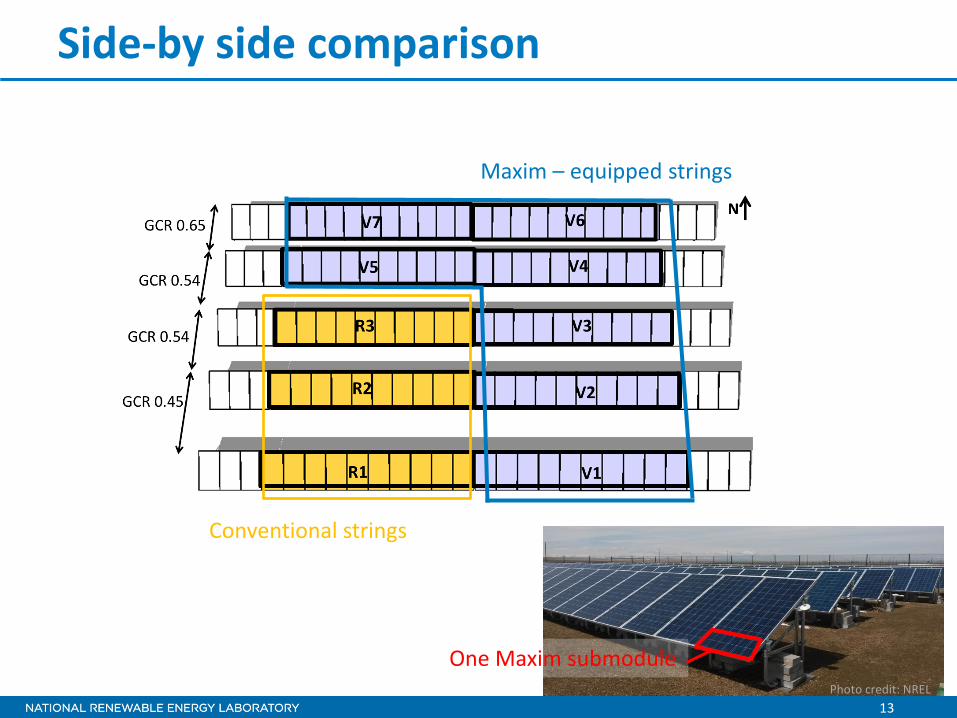
Side-by side comparison
Conventional strings
Maxim – equipped strings
Photo credit: NREL
One Maxim submodule
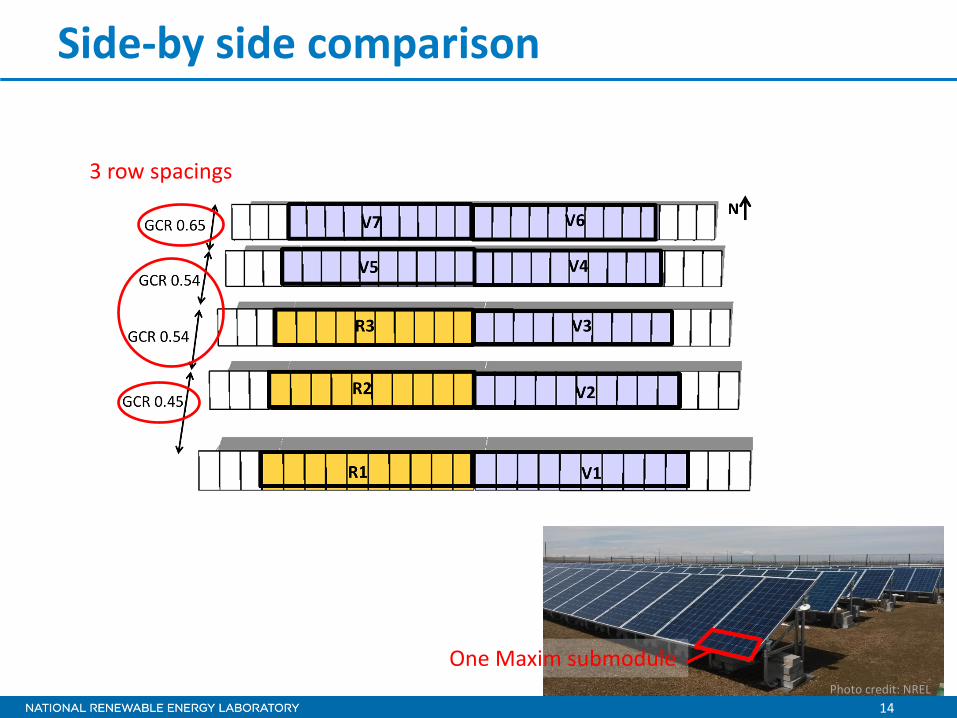
14
Side-by side comparison
3 row spacings
Photo credit: NREL
One Maxim submodule
15
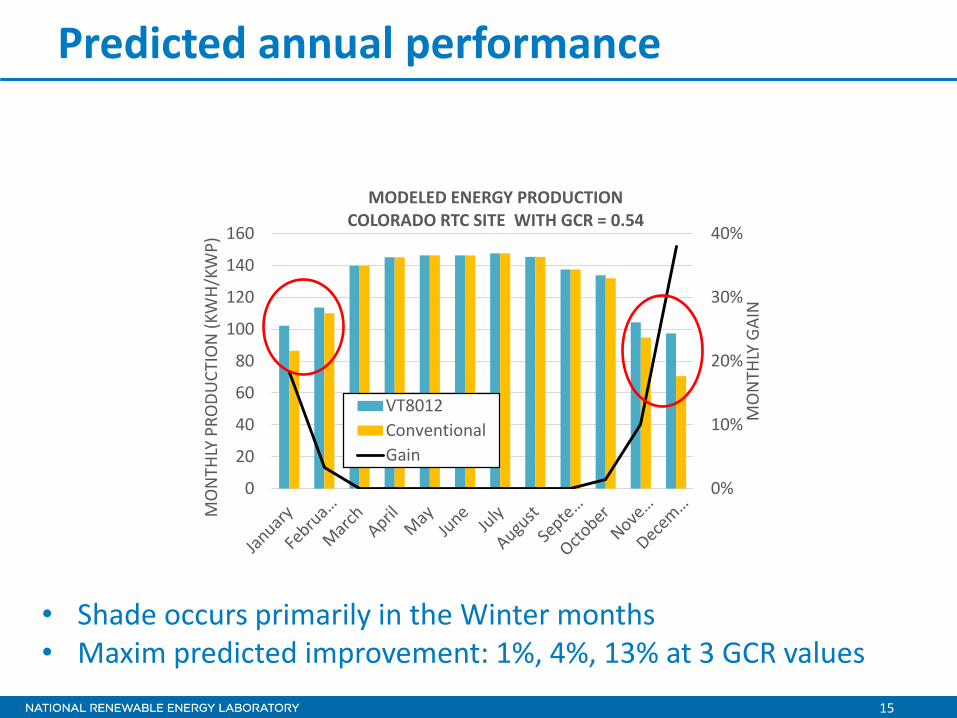
Predicted annual performance
0%
10%
20%
30%
40%
0
20
40
60
80
100
120
140
160
MO
NTH
LY G
AIN
MO
NTH
LY P
RODU
CTIO
N (K
WH/
KWP)
MODELED ENERGY PRODUCTION
COLORADO RTC SITE WITH GCR = 0.54
VT8012ConventionalGain
• Shade occurs primarily in the Winter months • Maxim predicted improvement: 1%, 4%, 13% at 3 GCR values
16
Agenda
• DOE’s Regional Test Centers • Maxim PV power electronics • Inter-row shading experiment • Diffuse shading results
17
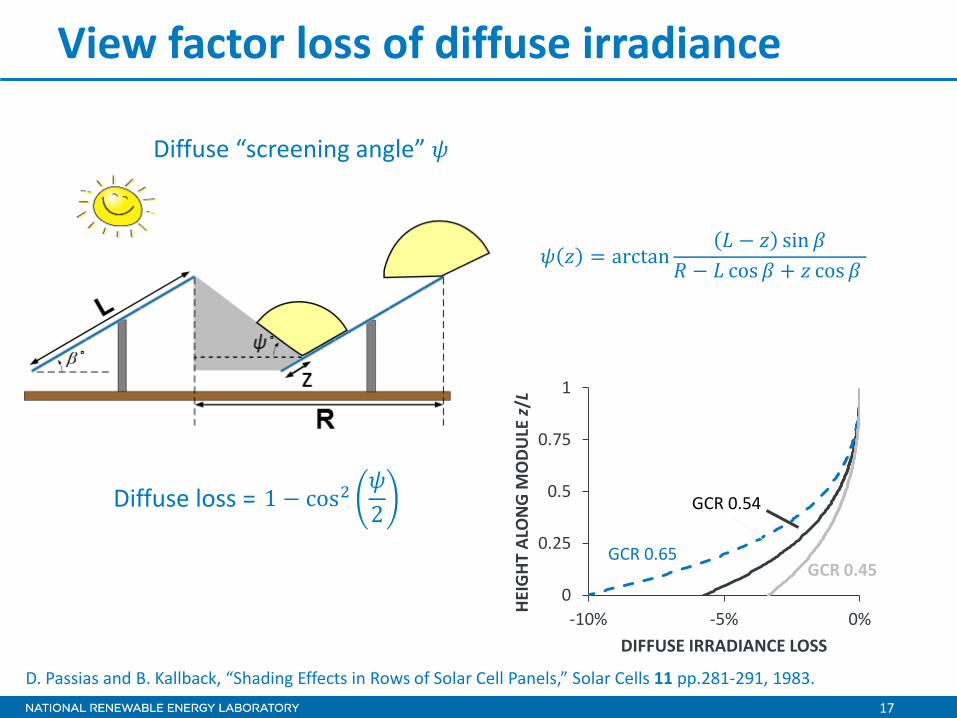
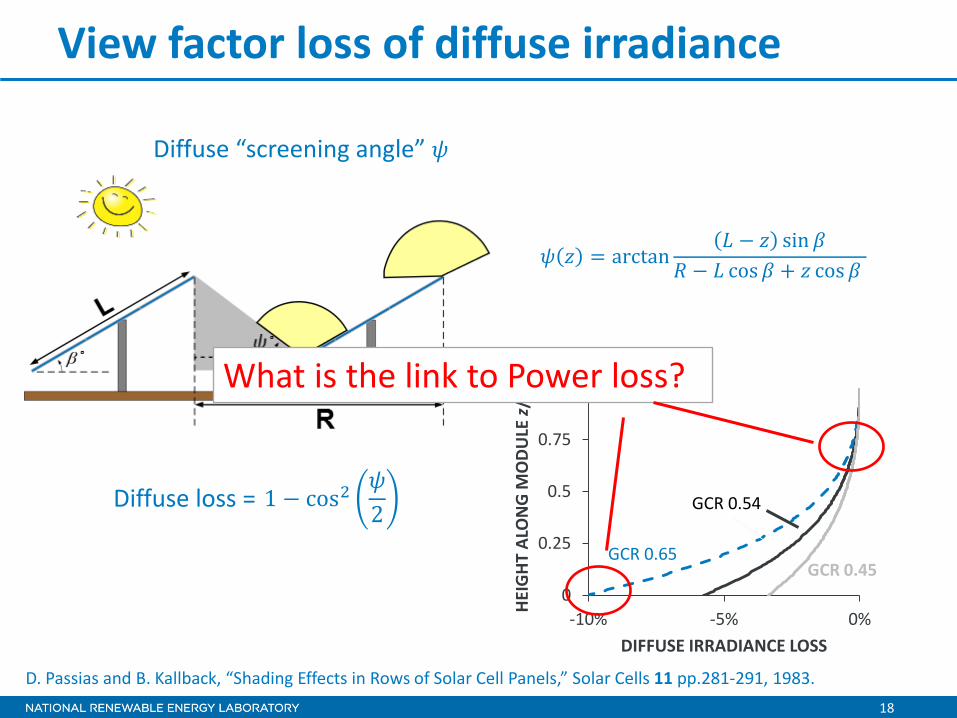
View factor loss of diffuse irradiance
0
0.25
0.5
0.75
1
-10% -5% 0%
HEIG
HT A
LON
G M
ODU
LE z/
L
DIFFUSE IRRADIANCE LOSS
GCR 0.54
GCR 0.65 GCR 0.45
D. Passias and B. Kallback, “Shading Effects in Rows of Solar Cell Panels,” Solar Cells 11 pp.281-291, 1983.
1 − cos2𝜓2 Diffuse loss =
𝜓 𝑧 = arctan𝐿 − 𝑧 sin𝛽
𝑅 − 𝐿 cos𝛽 + 𝑧 cos𝛽
Diffuse “screening angle” 𝜓
18
View factor loss of diffuse irradiance
0
0.25
0.5
0.75
1
-10% -5% 0%
HEIG
HT A
LON
G M
ODU
LE z/
L
DIFFUSE IRRADIANCE LOSS
GCR 0.54
GCR 0.65 GCR 0.45
D. Passias and B. Kallback, “Shading Effects in Rows of Solar Cell Panels,” Solar Cells 11 pp.281-291, 1983.
1 − cos2𝜓2 Diffuse loss =
𝜓 𝑧 = arctan𝐿 − 𝑧 sin𝛽
𝑅 − 𝐿 cos𝛽 + 𝑧 cos𝛽
Diffuse “screening angle” 𝜓
What is the link to Power loss?
19
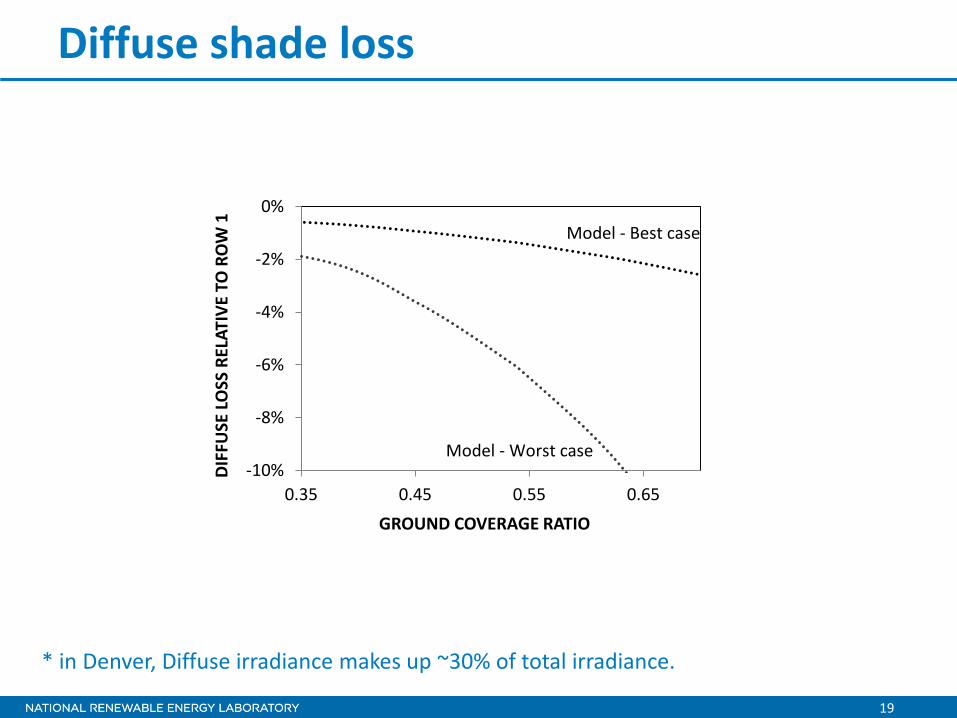
Diffuse shade loss
-10%
-8%
-6%
-4%
-2%
0%
0.35 0.45 0.55 0.65
DIFF
USE
LOSS
REL
ATIV
E TO
RO
W 1
GROUND COVERAGE RATIO
Model - Best case
Model - Worst case
* in Denver, Diffuse irradiance makes up ~30% of total irradiance.
20
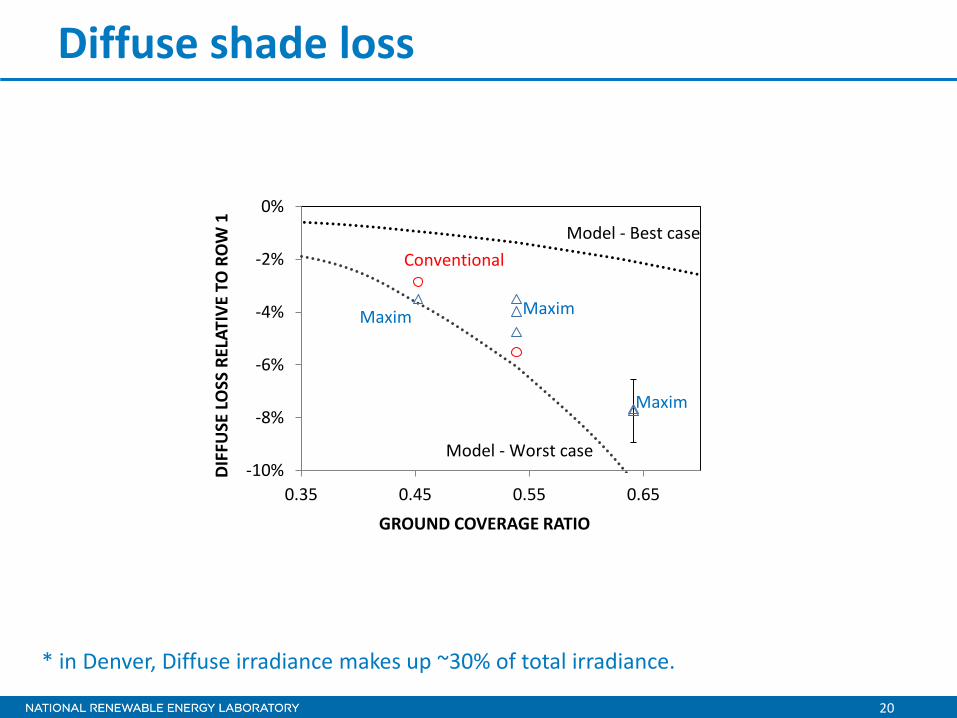
Diffuse shade loss
-10%
-8%
-6%
-4%
-2%
0%
0.35 0.45 0.55 0.65
DIFF
USE
LOSS
REL
ATIV
E TO
RO
W 1
GROUND COVERAGE RATIO
Model - Best case Conventional
Model - Worst case
Maxim
Maxim Maxim
* in Denver, Diffuse irradiance makes up ~30% of total irradiance.
21
Conclusion
• RTC sites provide validation and bankability o Leverage National Labs to provide climate diversity
• Maxim’s embedded DC converters predicted to improve performance at high GCR values o Validation still underway
• Diffuse irradiance losses match model o Match worst-case assumptions for diffuse loss
NATIONAL RENEWABLE ENERGY LABORATORY
Questions?
22
Acknowledgments This work was supported by the U.S. Department of Energy under Contract No. DOE-AC36-08GO28308 with the National Renewable Energy Laboratory and conducted under CRADA CRD-13-531 with Sandia National Laboratory and Volterra Semiconductor Corporation
Chris Deline [email protected] Ph: (303) 384-6359