ieee pvsc-40 highly abrasive resistant ar coating
TRANSCRIPT
7/21/2019 IEEE PVSC-40 Highly Abrasive Resistant AR Coating
http://slidepdf.com/reader/full/ieee-pvsc-40-highly-abrasive-resistant-ar-coating 1/5
A Highly Abrasive-Resistant, Long-Lasting Anti-Reflective
Coating for PV Module Glass
Sergiu C. Pop¹, Venkata Abbaraju¹, Brenor Brophy², Y. Sam Yang², Sina Maghsoodi²,Peter Gonsalves²
¹Yingli Green Energy Americas, San Francisco, CA 94108, USA²Enki Technology, San Jose, CA 95131, USA
Abstract — More than 4% of incident light is reflected fromthe front cover glass of photovoltaic (PV) modules. The industry-wide trend to cost-effectively increase the efficiency of PVmodules has driven the widespread adoption of anti-reflectivecoated (ARC) glass. The most common deposition methods forthese anti-reflective (AR) coatings are wet sol-gel processes, witha small minority of glass manufacturers using vacuum-basedsputtering. Most commercial sol-gel coatings consist of singlelayer porous silica and are highly transmissive across a broadrange of the solar spectrum. The mechanical strength of thesecoatings is generally derived from high temperature treatmentduring the tempering of the glass. However, as the PV industryincreasingly focuses on project levelized cost of electricity(LCOE), PV module manufactures and system owners areseeking ARC glass with increased durability and long-termperformance, particularly for systems operating in medium tohigh soiling environments, where PV modules are subjected toairborne particle abrasion and repeated washing. In this work,we report durability test results for a new, low temperaturecurable sol-gel AR coating from Enki Technology, showingsignificantly improved abrasion-resistance compared to moretraditional AR coatings. The new coating is denser than thetraditional coatings and chemically derives its abrasion-resistance at relatively low process temperatures without
sacrificing the optical performance. The samples under test inthis work were subjected to extensive testing following theindustry-standard abrasion test method in EN1096.2 andaccelerated environmental test procedures in IEC61215. Ourresults show increased coating longevity for the new coating, up
to four times greater than existing coatings with comparableoptical performance. This increased mechanical strength directlytranslates to reduced risk of handling during manufacturing and
installation, lower O&M costs, increased energy yield andreduced warranty costs.
Index Terms — amorphous materials, glass, materials
reliability, photovoltaic cells.
I. I NTRODUCTION
Greater than 4% of normally incident light is lost due to
reflection at the interface of air and PV module glass. As the
industry has driven towards higher efficiencies at ever lower
costs it has widely adopted ARC for PV module front cover
glass. It is estimated that greater than 70% of silicon PV
modules now ship with ARC glass [1].
While a small minority of suppliers still provide vacuum
based AR coatings, the vast majority of traditional coatings
are based on single layer, porous silica, wet sol-gel technology
[2], [3]. These coatings typically derive their mechanical
strength through a high temperature sintering step that occurs
when the PV cover glass is tempered.
As the PV industry has grown PV module manufacturers
and system owners and operators are increasingly focused on
project LCOE. With growing experience in the long-term field
performance of these coatings they are seeking ARC glass
with increased durability and long-term performance, particularly for systems operating in medium to high soiling
environments, where PV modules are subjected to airborne
particle abrasion and repeated washing [4], [5].
II. EXPERIMENTAL DESIGN
We evaluated three traditional AR coatings and the new AR
coating on three different PV module glass substrates (A, B,
and C). The traditional coatings were received as coated from
the manufacturer on tempered 30x30cm glass sheets.
Uncoated samples of the same base glass were coated with the
new coating. For this work the new coating was prepared by
hydrolysis and partial condensation of organo-tri-alkoxy-
silanes and tetra-alkoxy-silanes. The resulting gel-free
homogenous solutions of the high silanol containing co-
polymers of silsesquioxane have long term shelf life stability
at room temperature. The sols were coated on pre-cleaned
substrates by flow coating technique, dried and cured at 300
°C. The resulting thin-film was a homogenous, uniform,
transparent, defect-free, crack-free dense coating with
thickness in the range of 70-120 nm and excellent AR
properties.
Optical reflection was measured on coated sheets using a
Konica Minolta CM-2600d spectrophotometer. Based on the
difference in reflection spectra over 360~780nm between an
uncoated control and the coated sample a percentage increase
in transmission of solar weighted photons is calculated using
the AM1.5 spectrum [6]. This metric is used to measure
optical performance of the samples.
Six substrates (3 traditional, 3 new) were then submitted to
abrasion testing according to specification EN1096.2. This test
consists of 1000 strokes using a Taber linear abrader with a
14.5mm diameter, 10mm thick, medium density felt disk with
4N of force applied, at 30 strokes/minute and a stroke length
7/21/2019 IEEE PVSC-40 Highly Abrasive Resistant AR Coating
http://slidepdf.com/reader/full/ieee-pvsc-40-highly-abrasive-resistant-ar-coating 2/5
of approximately 10cm. The disk is rotated
on every second stroke. Optical reflection
every 200 strokes in the center of the abra
reduction in optical performance is calculated.
To test for reliability, five full size 60-cell
solar panels were tested at Underwriter L
with the three most relevant tests for solar
IEC61215 guidelines: Damp Heat (DH, 100
and 85% relative humidity), Temperaturecycles between -40 °C and +85 °C) and Humi
10 cycles between -40 °C and +85 °C).
uncoated, a second was coated with a traditi
equivalent to the coating on substrate C, and t
coated with the new coating. These reliability
the power fall by no more than 5%, and t
significant visual defects on the glass surface.
III. R ESULTS AND DISCUSSION
A. Optical Performance
A.1. Reflectance
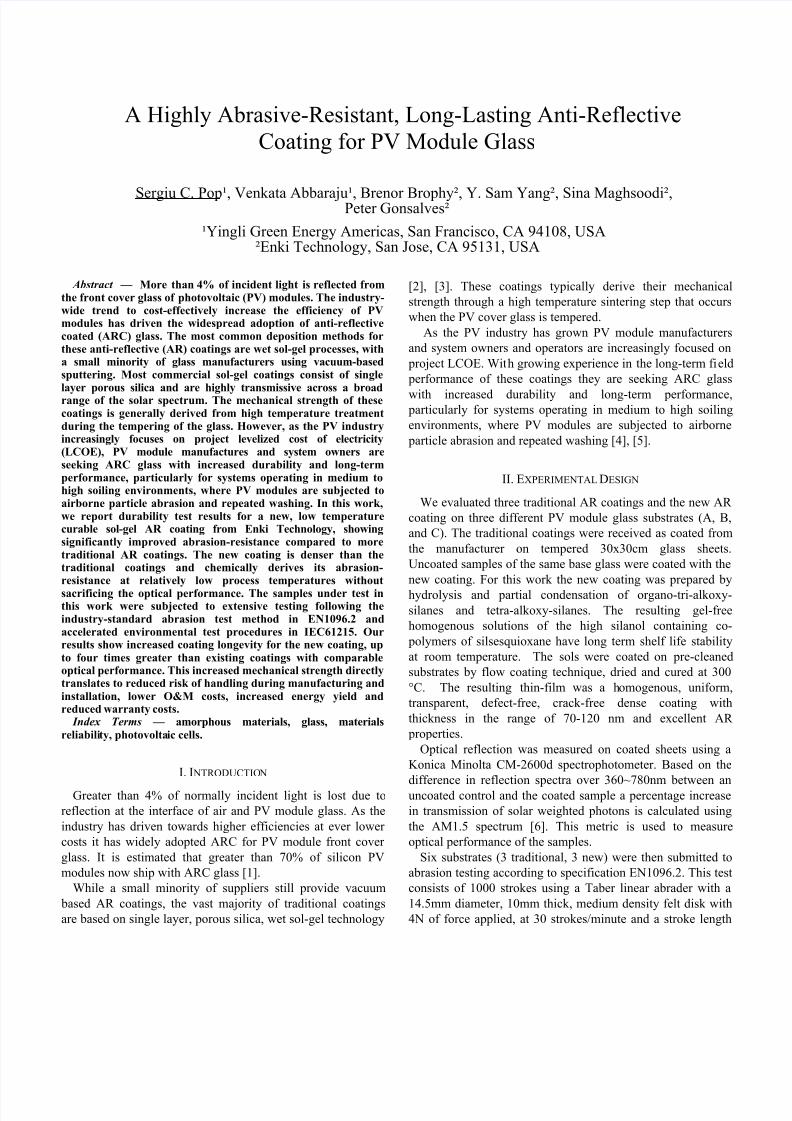
Fig. 1 shows the initial optical performance
percentage increase of transmittance of solar
of the traditional coatings versus the ne
observed that the traditional coating on sub
highest optical performance. In the other
substrates A and B respectively, the opti
recorded for the traditional coatings are
compared to the new coating. As is sh
properties of the new coating does not depen
the substrate type.
Fig. 1. Initial average optical performance expretransmission of solar weighted photons
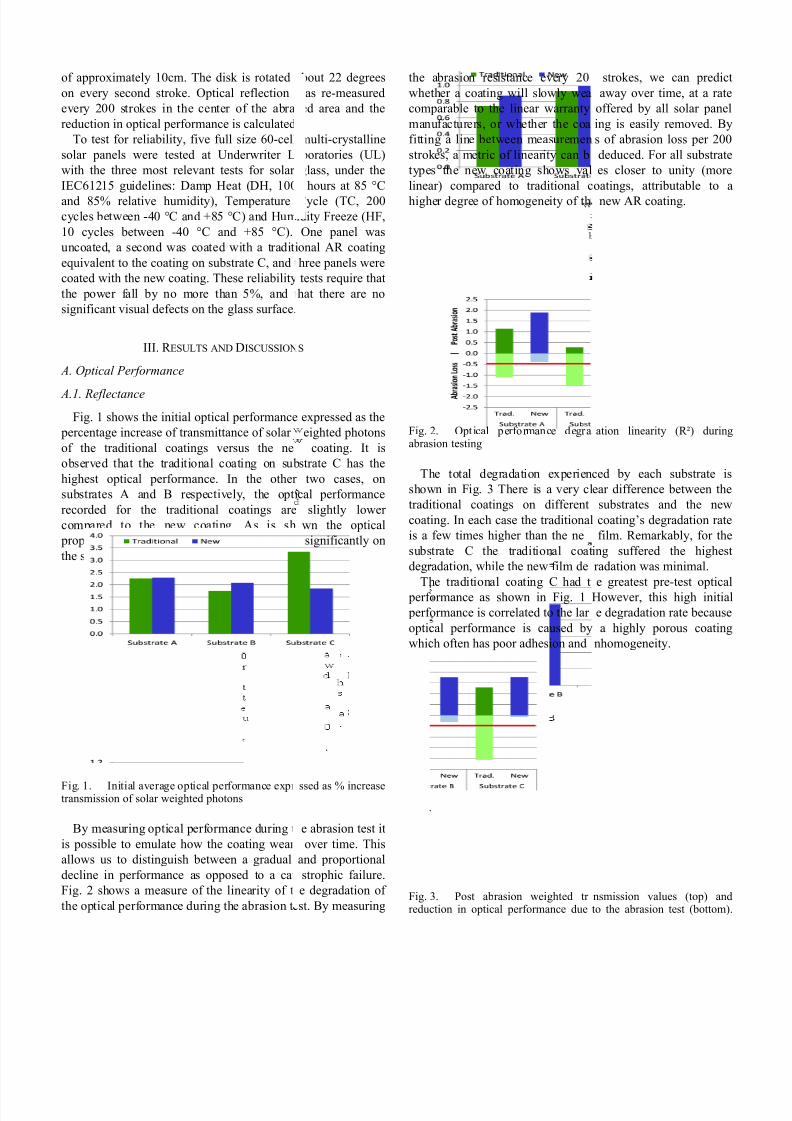
By measuring optical performance during t
is possible to emulate how the coating wear
allows us to distinguish between a gradual
decline in performance as opposed to a cat
Fig. 2 shows a measure of the linearity of th
the optical performance during the abrasion te
bout 22 degrees
as re-measured
ed area and the
.
multi-crystalline
boratories (UL)
glass, under the
hours at 85 °C
Cycle (TC, 200dity Freeze (HF,
One panel was
onal AR coating
hree panels were
tests require that
hat there are no
S
expressed as the
eighted photons
coating. It is
strate C has the
two cases, on
cal performance
slightly lower
wn the optical
significantly on
ssed as % increase
e abrasion test it
over time. This
and proportional
strophic failure.
e degradation of
st. By measuring
the abrasion resistance every 20
whether a coating will slowly wea
comparable to the linear warranty
manufacturers, or whether the coa
fitting a line between measuremen
strokes, a metric of linearity can b
types the new coating shows val
linear) compared to traditional c
higher degree of homogeneity of th
Fig. 2. Optical performance degraabrasion testing
The total degradation experien
shown in Fig. 3 There is a very cl
traditional coatings on different
coating. In each case the traditional
is a few times higher than the ne
substrate C the traditional coat
degradation, while the new film de
The traditional coating C had t
performance as shown in Fig. 1
performance is correlated to the lar
optical performance is caused by
which often has poor adhesion and
Fig. 3. Post abrasion weighted trreduction in optical performance due
strokes, we can predict
away over time, at a rate
offered by all solar panel
ing is easily removed. By
s of abrasion loss per 200
deduced. For all substrate
es closer to unity (more
oatings, attributable to a
new AR coating.
ation linearity (R²) during
ced by each substrate is
ear difference between the
substrates and the new
coating’s degradation rate
film. Remarkably, for the
ing suffered the highest
radation was minimal.
e greatest pre-test optical
However, this high initial
e degradation rate because
a highly porous coating
nhomogeneity.
nsmission values (top) andto the abrasion test (bottom).
7/21/2019 IEEE PVSC-40 Highly Abrasive Resistant AR Coating
http://slidepdf.com/reader/full/ieee-pvsc-40-highly-abrasive-resistant-ar-coating 3/5
The red line is the test fail criteria (-0.5%) showincoatings failed the test
Another interesting observation is the app
been the types of films (traditional and ne
type substrate (Fig. 3). The degradation rate
films increases from substrate A to C while t
the new film decreases, as demonstrated by t
3.TABLE I
ABRASION TEST R ESULTS
Substrate A Substrate B
Trad. New Trad. New
Initial 2.26 2.29 1.75 2.07
Post 1.15 1.89 0.29 1.76
Delta -1.11 -0.40 -1.46 -0.31
Result Fail Pass Fail Pass
R 2 0.75 0.87 0.93 0.99
According to industry specifications, a
optical performance of more than 0.5% is conTable I shows the initial and post-abrasio
experimental samples. As a result, all tra
apparently fail the industry test specification
passes independently of the glass substrate typ
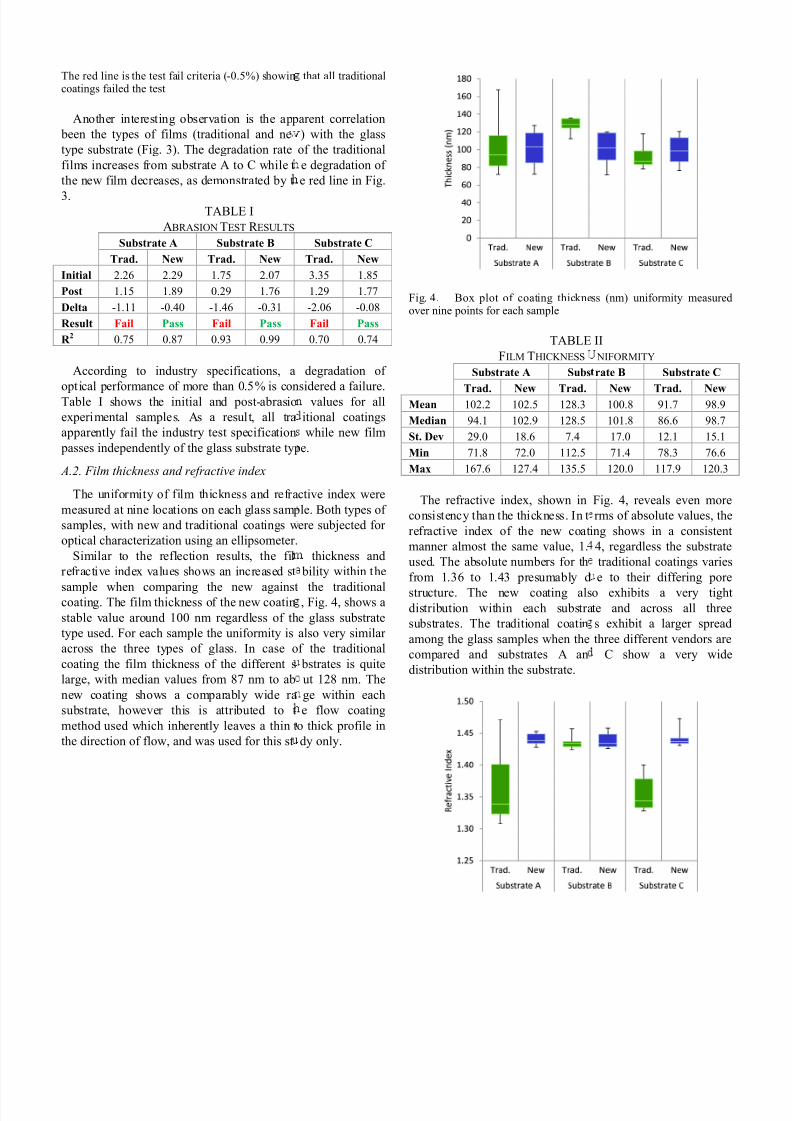
A.2. Film thickness and refractive index
The uniformity of film thickness and refra
measured at nine locations on each glass samp
samples, with new and traditional coatings w
optical characterization using an ellipsometer.
Similar to the reflection results, the fil
refractive index values shows an increased st
sample when comparing the new againstcoating. The film thickness of the new coatin
stable value around 100 nm regardless of th
type used. For each sample the uniformity is
across the three types of glass. In case o
coating the film thickness of the different s
large, with median values from 87 nm to ab
new coating shows a comparably wide ra
substrate, however this is attributed to t
method used which inherently leaves a thin t
the direction of flow, and was used for this st
that all traditional
arent correlation
) with the glass
of the traditional
e degradation of
e red line in Fig.
Substrate C
Trad. New
3.35 1.85
1.29 1.77
-2.06 -0.08
Fail Pass
0.70 0.74
degradation of
sidered a failure.values for all
itional coatings
while new film
e.
ctive index were
le. Both types of
ere subjected for
thickness and
bility within the
the traditional, Fig. 4, shows a
e glass substrate
also very similar
f the traditional
bstrates is quite
ut 128 nm. The
ge within each
e flow coating
o thick profile in
dy only.
Fig. 4. Box plot of coating thickneover nine points for each sample
TABLE
FILM THICKNESS
Substrate A Subs
Trad. New Trad.
Mean 102.2 102.5 128.3
Median 94.1 102.9 128.5
St. Dev 29.0 18.6 7.4
Min 71.8 72.0 112.5
Max 167.6 127.4 135.5
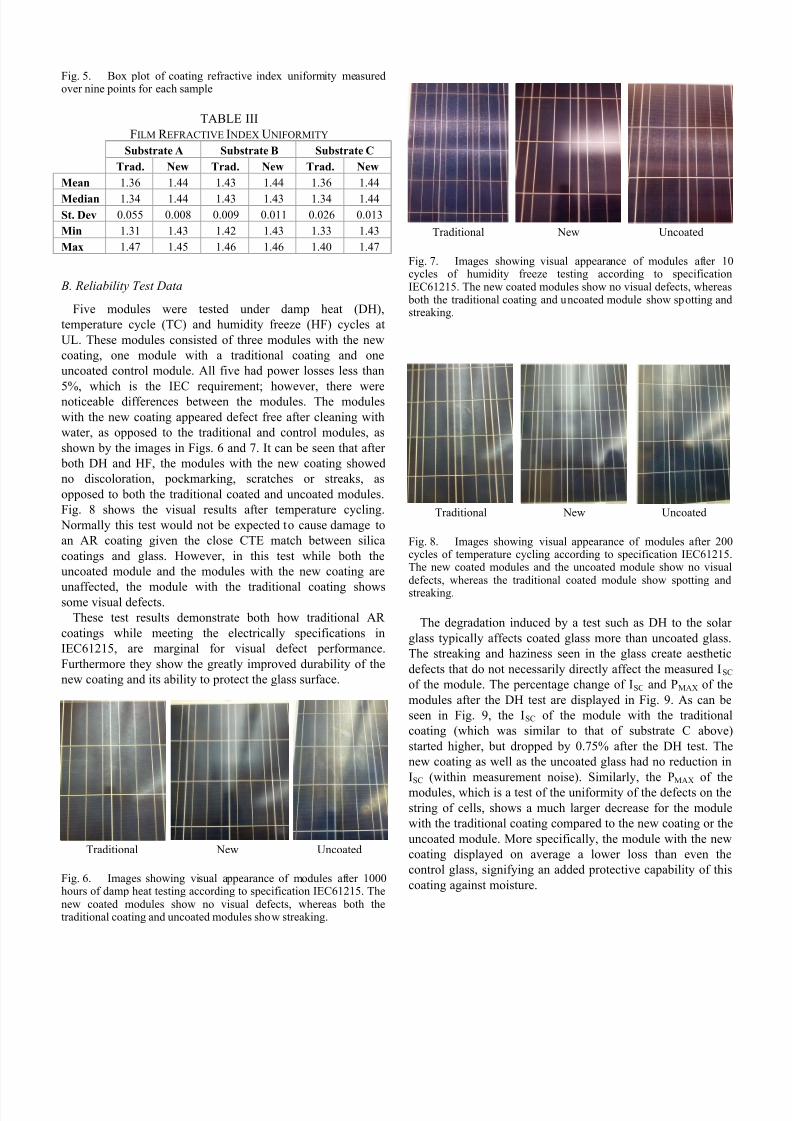
The refractive index, shown in
consistency than the thickness. In t
refractive index of the new coati
manner almost the same value, 1.
used. The absolute numbers for th
from 1.36 to 1.43 presumably d
structure. The new coating alsdistribution within each substra
substrates. The traditional coatin
among the glass samples when the
compared and substrates A an
distribution within the substrate.
ss (nm) uniformity measured
II
NIFORMITY
rate B Substrate C
New Trad. New
100.8 91.7 98.9
101.8 86.6 98.7
17.0 12.1 15.1
71.4 78.3 76.6
120.0 117.9 120.3
Fig. 4, reveals even more
rms of absolute values, the
ng shows in a consistent
4, regardless the substrate
traditional coatings varies
e to their differing pore
o exhibits a very tightte and across all three
s exhibit a larger spread
three different vendors are
C show a very wide
7/21/2019 IEEE PVSC-40 Highly Abrasive Resistant AR Coating
http://slidepdf.com/reader/full/ieee-pvsc-40-highly-abrasive-resistant-ar-coating 4/5
Fig. 5. Box plot of coating refractive index uniformity measuredover nine points for each sample
TABLE III
FILM R EFRACTIVE I NDEX U NIFORMITY
Substrate A Substrate B Substrate C
Trad. New Trad. New Trad. New
Mean 1.36 1.44 1.43 1.44 1.36 1.44
Median 1.34 1.44 1.43 1.43 1.34 1.44
St. Dev 0.055 0.008 0.009 0.011 0.026 0.013
Min 1.31 1.43 1.42 1.43 1.33 1.43
Max 1.47 1.45 1.46 1.46 1.40 1.47
B. Reliability Test Data
Five modules were tested under damp heat (DH),
temperature cycle (TC) and humidity freeze (HF) cycles at
UL. These modules consisted of three modules with the new
coating, one module with a traditional coating and one
uncoated control module. All five had power losses less than
5%, which is the IEC requirement; however, there werenoticeable differences between the modules. The modules
with the new coating appeared defect free after cleaning with
water, as opposed to the traditional and control modules, as
shown by the images in Figs. 6 and 7. It can be seen that after
both DH and HF, the modules with the new coating showed
no discoloration, pockmarking, scratches or streaks, as
opposed to both the traditional coated and uncoated modules.
Fig. 8 shows the visual results after temperature cycling.
Normally this test would not be expected to cause damage to
an AR coating given the close CTE match between silica
coatings and glass. However, in this test while both the
uncoated module and the modules with the new coating are
unaffected, the module with the traditional coating showssome visual defects.
These test results demonstrate both how traditional AR
coatings while meeting the electrically specifications in
IEC61215, are marginal for visual defect performance.
Furthermore they show the greatly improved durability of the
new coating and its ability to protect the glass surface.
Traditional New Uncoated
Fig. 6. Images showing visual appearance of modules after 1000hours of damp heat testing according to specification IEC61215. Thenew coated modules show no visual defects, whereas both thetraditional coating and uncoated modules show streaking.
Traditional New Uncoated
Fig. 7. Images showing visual appearance of modules after 10cycles of humidity freeze testing according to specificationIEC61215. The new coated modules show no visual defects, whereas
both the traditional coating and uncoated module show spotting andstreaking.
Traditional New Uncoated
Fig. 8. Images showing visual appearance of modules after 200cycles of temperature cycling according to specification IEC61215.The new coated modules and the uncoated module show no visualdefects, whereas the traditional coated module show spotting and
streaking.
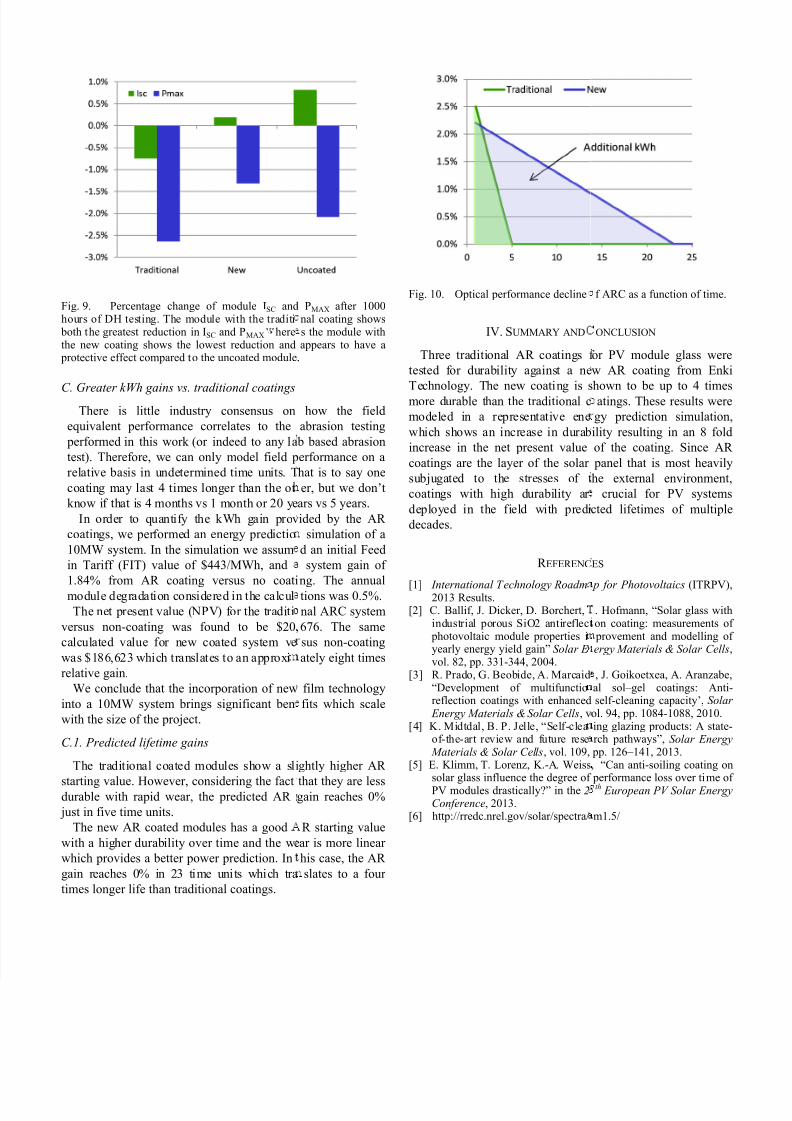
The degradation induced by a test such as DH to the solar
glass typically affects coated glass more than uncoated glass.
The streaking and haziness seen in the glass create aesthetic
defects that do not necessarily directly affect the measured ISC
of the module. The percentage change of ISC and PMAX of the
modules after the DH test are displayed in Fig. 9. As can be
seen in Fig. 9, the ISC of the module with the traditional
coating (which was similar to that of substrate C above)
started higher, but dropped by 0.75% after the DH test. The
new coating as well as the uncoated glass had no reduction in
ISC (within measurement noise). Similarly, the PMAX of the
modules, which is a test of the uniformity of the defects on the
string of cells, shows a much larger decrease for the module
with the traditional coating compared to the new coating or the
uncoated module. More specifically, the module with the new
coating displayed on average a lower loss than even the
control glass, signifying an added protective capability of this
coating against moisture.
7/21/2019 IEEE PVSC-40 Highly Abrasive Resistant AR Coating
http://slidepdf.com/reader/full/ieee-pvsc-40-highly-abrasive-resistant-ar-coating 5/5
Fig. 9. Percentage change of module ISC andhours of DH testing. The module with the traditi
both the greatest reduction in ISC and PMAX herethe new coating shows the lowest reduction and
protective effect compared to the uncoated module.
C. Greater kWh gains vs. traditional coatingsThere is little industry consensus on
equivalent performance correlates to the
performed in this work (or indeed to any la
test). Therefore, we can only model field p
relative basis in undetermined time units. T
coating may last 4 times longer than the ot
know if that is 4 months vs 1 month or 20 ye
In order to quantify the kWh gain prov
coatings, we performed an energy predictio
10MW system. In the simulation we assum
in Tariff (FIT) value of $443/MWh, and
1.84% from AR coating versus no coati
module degradation considered in the calcul
The net present value (NPV) for the traditi
versus non-coating was found to be $20,
calculated value for new coated system ve
was $186,623 which translates to an approxi
relative gain.
We conclude that the incorporation of new
into a 10MW system brings significant ben
with the size of the project.
C.1. Predicted lifetime gains
The traditional coated modules show a sli
starting value. However, considering the factdurable with rapid wear, the predicted AR
just in five time units.
The new AR coated modules has a good
with a higher durability over time and the we
which provides a better power prediction. In
gain reaches 0% in 23 time units which tra
times longer life than traditional coatings.
PMAX after 1000nal coating showss the module withappears to have a
.
how the field
abrasion testing
b based abrasion
erformance on a
hat is to say one
er, but we don’t
ars vs 5 years.
ided by the AR
simulation of a
d an initial Feed
system gain of
ng. The annual
tions was 0.5%.
nal ARC system
676. The same
sus non-coating
ately eight times
film technology
fits which scale
ghtly higher AR
that they are lessgain reaches 0%
R starting value
ar is more linear
his case, the AR
slates to a four
Fig. 10. Optical performance decline
IV. SUMMARY AND
Three traditional AR coatings f
tested for durability against a ne
Technology. The new coating is s
more durable than the traditional c
modeled in a representative ene
which shows an increase in durab
increase in the net present value
coatings are the layer of the solar
subjugated to the stresses of t
coatings with high durability ar
deployed in the field with predi
decades.
R EFERENC
[1] International Technology Roadm2013 Results.[2] C. Ballif, J. Dicker, D. Borchert,
industrial porous SiO2 antireflect photovoltaic module properties iyearly energy yield gain” Solar Evol. 82, pp. 331-344, 2004.
[3] R. Prado, G. Beobide, A. Marcaid“Development of multifunctioreflection coatings with enhanced
Energy Materials & Solar Cells, v[4] K. Midtdal, B. P. Jelle, “Self-clea
of-the-art review and future rese Materials & Solar Cells, vol. 109,
[5] E. Klimm, T. Lorenz, K.-A. Weiss,solar glass influence the degree ofPV modules drastically?” in the 2Conference, 2013.
[6] http://rredc.nrel.gov/solar/spectra/
f ARC as a function of time.
ONCLUSION
or PV module glass were
w AR coating from Enki
hown to be up to 4 times
atings. These results were
gy prediction simulation,
ility resulting in an 8 fold
of the coating. Since AR
panel that is most heavily
he external environment,
crucial for PV systems
cted lifetimes of multiple
ES
p for Photovoltaics (ITRPV),
. Hofmann, “Solar glass withon coating: measurements of provement and modelling ofergy Materials & Solar Cells,
, J. Goikoetxea, A. Aranzabe,al sol–gel coatings: Anti- self-cleaning capacity’, Solarol. 94, pp. 1084-1088, 2010.ing glazing products: A state-rch pathways”, Solar Energy
pp. 126–141, 2013.“Can anti-soiling coating on
performance loss over time ofth European PV Solar Energy
m1.5/