evaluation of bird detection using time-lapse …yoshi/research/ewea2015yoshi.pdfevaluation of bird...
TRANSCRIPT

Evaluation of Bird Detection using Time-lapse Images
around a Wind Farm
Ryota Yoshihashi, Rei Kawakami, Makoto Iida and Takeshi Naemura
The University of Tokyo, Hongo 7-3-1, Bunkyo-ku, Tokyo, 113-8656, Japan
Fig. 1. Appearance of birds in images around a wind farm (left) is significantly different from those in a generic
image-recognition dataset (right).
ABSTRACT
One of the primary environmental concerns of wind
farms is the increase in bird mortality. To assess en-
vironmental risks around wind farms, the demand for
automatic bird monitoring increases rapidly. Consider-
ing recent advancements in object detection methods
in computer vision, automated monitoring based on
images is promising. However, the accuracy of state-
of-the-art methods in a practical environment remains
uncertain due to the significant difference between the
images taken in a practical environment and those used
in generic object detection competitions. This study
evaluates these image-based bird detection and classi-
fication methods. We also introduce a bird monitoring
system with a whole image processing pipeline. For
evaluation in a practical environment, we utilize an
open-access time-lapse image dataset around a wind
farm. As a state-of-the-art method, we include convolu-
tional neural networks, a rising method of deep learning
for image recognition, which shows performance im-
provement.
Index Terms— Image recognition, bird detection,
ecological conservation, social acceptance
1. INTRODUCTION
Environmental concerns in developing wind farms have
been highlighted by both the wind-energy community
and ecological experts [1, 2, 3] as the demand for wind
power energy grows rapidly around the world to meet
public policies for renewable energy. One of the primary
concerns is the increase in bird mortality caused by col-
lision with blades, loss of nesting and feeding grounds,
and interception on migratory routes [3, 4, 5, 6]. Hun-
dreds of annual bird fatalities, including those of charis-
matic species, have been reported at several sites [6].
To assess such risks during the establishment and op-
eration of wind farms, investigation of bird ecology and
assessment of potential risks are necessary. Conven-
tional bird monitoring has been carried out by manual
observation, which is expensive and laborious [7]. Au-
tomation in this task can lower the cost, enable long-
term monitoring, and lead to higher accuracy and repro-
ducibility. However, an automatic system is required to
perform bird detection as well as classification of bird
species, both of which have been non-trivial for ma-
chines to achieve.
Image-based detection using cameras is one of
the promising approaches [8, 9, 7, 10], while radar-
based [11, 12, 13] and acoustic-based [14] detections
have been commonplace in the literature. Rich visual
information with a higher resolution can be utilized, and
the recognition performance has improved dramatically
in the last decade, owing to the availability of big data,
high performance computers, and algorithm improve-
ment in machine learning and computer vision research
fields. Reviewing recent milestones in computer vi-
sion, robust features have been invented [15, 16, 17],
good classifiers have been found [18, 19], good im-
age structures have been proposed [20, 21], huge im-
age datasets have been established [22, 23, 24], and
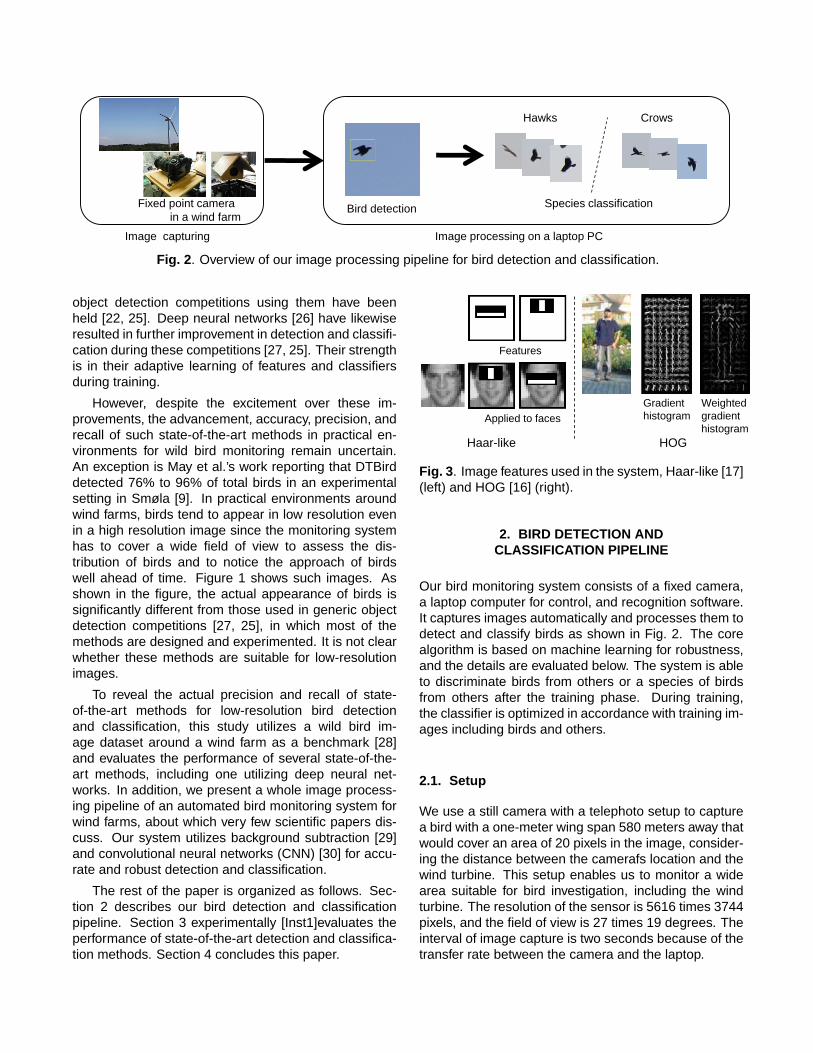
Fixed point camera
in a wind farm Bird detection Species classification
Hawks Crows
Image processing on a laptop PC Image capturing
Fig. 2. Overview of our image processing pipeline for bird detection and classification.
object detection competitions using them have been
held [22, 25]. Deep neural networks [26] have likewise
resulted in further improvement in detection and classifi-
cation during these competitions [27, 25]. Their strength
is in their adaptive learning of features and classifiers
during training.
However, despite the excitement over these im-
provements, the advancement, accuracy, precision, and
recall of such state-of-the-art methods in practical en-
vironments for wild bird monitoring remain uncertain.
An exception is May et al.’s work reporting that DTBird
detected 76% to 96% of total birds in an experimental
setting in Smøla [9]. In practical environments around
wind farms, birds tend to appear in low resolution even
in a high resolution image since the monitoring system
has to cover a wide field of view to assess the dis-
tribution of birds and to notice the approach of birds
well ahead of time. Figure 1 shows such images. As
shown in the figure, the actual appearance of birds is
significantly different from those used in generic object
detection competitions [27, 25], in which most of the
methods are designed and experimented. It is not clear
whether these methods are suitable for low-resolution
images.
To reveal the actual precision and recall of state-
of-the-art methods for low-resolution bird detection
and classification, this study utilizes a wild bird im-
age dataset around a wind farm as a benchmark [28]
and evaluates the performance of several state-of-the-
art methods, including one utilizing deep neural net-
works. In addition, we present a whole image process-
ing pipeline of an automated bird monitoring system for
wind farms, about which very few scientific papers dis-
cuss. Our system utilizes background subtraction [29]
and convolutional neural networks (CNN) [30] for accu-
rate and robust detection and classification.
The rest of the paper is organized as follows. Sec-
tion 2 describes our bird detection and classification
pipeline. Section 3 experimentally [Inst1]evaluates the
performance of state-of-the-art detection and classifica-
tion methods. Section 4 concludes this paper.
Features
Applied to faces
Gradient
histogram
Weighted
gradient
histogram
Haar-like HOG
Fig. 3. Image features used in the system, Haar-like [17]
(left) and HOG [16] (right).
2. BIRD DETECTION AND
CLASSIFICATION PIPELINE
Our bird monitoring system consists of a fixed camera,
a laptop computer for control, and recognition software.
It captures images automatically and processes them to
detect and classify birds as shown in Fig. 2. The core
algorithm is based on machine learning for robustness,
and the details are evaluated below. The system is able
to discriminate birds from others or a species of birds
from others after the training phase. During training,
the classifier is optimized in accordance with training im-
ages including birds and others.
2.1. Setup
We use a still camera with a telephoto setup to capture
a bird with a one-meter wing span 580 meters away that
would cover an area of 20 pixels in the image, consider-
ing the distance between the camerafs location and the
wind turbine. This setup enables us to monitor a wide
area suitable for bird investigation, including the wind
turbine. The resolution of the sensor is 5616 times 3744
pixels, and the field of view is 27 times 19 degrees. The
interval of image capture is two seconds because of the
transfer rate between the camera and the laptop.

2.2. Algorithm
Our algorithm is a combination of background subtrac-
tion [29] and object classification. Background subtrac-
tion is a method for extracting moving objects from fixed
backgrounds and works well with our scenes that are
mostly static. However, regions extracted still include
some background objects, such as parts of the turbine,
trees, or clouds; thus, we utilize machine learning-based
classifiers to filter birds from others.
Specifically, we will compare the following two clas-
sifiers in the next section: First is AdaBoost [18], a
widely used learning algorithm in computer vision. This
algorithm is often combined with image features such
as Haar-like [17] or Histogram of Orientated Gradients
(HOG) [16] for further robustness. The performance of
these methods is known to depend highly on both the
types of targets (faces, people, birds, etc.) and scene
properties (indoor, street, wind farm, etc.).
Second is convolutional neural networks (CNN) [30],
the most successful deep networks for object recog-
nition to date. The strength of CNN is that it learns
features by itself; i.e., it does not need manually de-
signed image features that are not guaranteed to be
optimal. Yet, it is important to reveal whether CNN out-
performs others on low-resolution detection and classi-
fication tasks. Since CNN is unexplored, it is therefore
unclear what types of data and tasks it prefers.
Below, we briefly explain the details of each method.
AdaBoost AdaBoost [18] is a two-class classifier
based on feature selection and weighted majority voting.
A strong classifier is made as a weighted sum of many
weak classifiers, and the resulting classifier is shallow
but robust. The algorithm overview is as follows.[Inst2]
First, we uniformly initialize the weights of the training
samples. Second, we select one weak classifier with
the lowest error rate using the weighted training sam-
ples. Third, the weight of the selected weak classifier is
set on the basis of the error it produces. A larger weight
is set for a smaller error rate, since weak classifiers with
smaller error rates are more reliable. Fourth, we update
the weights of training samples based on the error rate
of the reweighted classifier. Then, we iterate from the
second to the fourth step a fixed number of times.
Haar-like Haar-like [17] is an image feature that uti-
lizes contrasts in images. It extracts the light and the
shade of objects by using black-and-white patterns as
shown in the left figure in Fig. 3. Haar-like first suc-
ceeded in face detection [17] and is used as a fast and
robust feature.
HOG HOG [16] is a feature used for grasping the
approximated shape of objects. A visualized HOG is
shown in the right figure in Fig. 3. First it computes the
spatial gradient of the image and makes a histogram of
the quantized direction of the gradient in each local re-
gion, called a cell in the image. Next it concatenates
the histograms of the cells in the neighboring groups of
the cells, the blocks, and normalizes them by dividing
by their Euclidean norms in each block. HOG was first
used for pedestrian detection and afterwards applied to
various tasks including generic object detection.
CNN CNN [30] is a type of neural network charac-
terized by convolutional layers. Convolution is an oper-
ation which associates an image with a feature map by
using the inner product between each patch in the in-
put image and another fixed patch, called a kernel. In
CNN, each convolutional layer has multiple kernels and
outputs multi-channel feature maps. These kernels in
the convolutional layers are interpreted as connection
weights between neurons and are optimized in training.
Other components of CNN are pooling layers and fully-
connected layers. Pooling layers are placed after con-
volutional layers to downsample feature maps. These
layers output lower-resolution feature maps by taking
the maximum in each local region, e.g., a two-by-two
patch, in input feature maps. Fully-connected layers are
placed at the end of the network. These layers perform
as a classifier, which receives the features from convo-
lutional and pooling layers and outputs the class of the
input image.
Among the variations of CNN architectures, ours
is based on one of the handwriting recognition meth-
ods [30] and refined by utilizing two recent discoveries
for improving performance: Rectified linear units (ReLU)
and dropout from [26]. ReLU is a type of activation func-
tion, that is, the relationship between input and output
in a single neuron. It requires a low computing cost and
is easy to optimize due to its simple derivative. Among
the variety of functions, the effectiveness of ReLU was
discovered recently. ReLU is formulated as follows.
y(x) = max{0,wx+ b}
Here w is weight parameters and b is a bias parameter.
Dropout is a training heuristic for removing neurons se-
lected randomly in each iteration of parameter updates.
Removed neurons are regarded to output zero indepen-
dently from their inputs. The whole network is shown in
Fig. 4.
The training of CNN is to compute the weights and
biases which minimize the classification error rate. For
this purpose, gradient methods are widely used. We use
stochastic gradient descent [31]. This method allows us
to approximately acquire the minimum with a relatively
low computational cost.

Fig. 4. CNN architecture we used. This is based on a handwriting recognition method [30].
Fig. 5. Structure of dataset [28]. It includes time-lapse
images, bounding boxes of birds and other flying ob-
jects, and their class labels.
3. EVALUATION EXPERIMENTS
3.1. Bird Image Dataset for Training and Evaluation
For the performance evaluation of bird detection and
classification methods, we utilize a dataset of birds at
a wind farm [28]. This dataset offers open access and
has preferable attributes; it contains a large amount
of data and presents a detailed specification of birds.
The dataset [28] is a sequence of images of a scene
at a wind farm, and it provides annotations of bird in-
formation appearing in the images as shown in Fig. 5.
Annotations were added to the images by bird experts
who are members of a bird association and have ex-
perience in field surveys. They checked the image
timelines, found birds, and annotated bounding boxes
with class labels for each bird. 32,442 images were
processed and 32,973 birds were found.
3.2. Experimental Procedure
Using the dataset, we conducted two recognition ex-
periments: bird detection and two-class species classi-
fication. Below, detection is defined as a classification
of birds and non-birds, given the candidate regions
suggested from motion information. Classification is
defined as a classification between hawks and crows,
which is a fundamental task in a bird-monitoring system.
They are the most frequent classes of birds in the area,
and we have a sufficient amount of data for accurate
evaluation. This two-class classification is also practi-
cal because many endangered species are included in
hawks.
For any machine learning methods, we need posi-
tive and negative samples for training. In the detection
experiment, positive samples (birds) were collected
from bird regions labeled in the dataset. Negative sam-
ples (non-birds) are background regions clipped by
background subtraction. Examples of the birds and
non-birds are shown in Fig. 6. We used five-fold cross-
validation to efficiently conduct the experiment on this
dataset.
In the classification experiment, hawks labeled in the
dataset are positive samples, and crows are negative
samples. Classification is a more difficult task than de-
tection in this dataset; thus, in order to analyze each
method’s behaviors in detail, we investigated the effect
of image resolution by dividing the positive and negative
images into groups on the basis of resolution. Specif-
ically, images of hawks and crows are divided into the
groups of 15–20, 21–30, and 31–50 pixels, as shown in
Fig. 6. On each group, we conducted holdout validation
using 800 hawks and 150 crows for training data and
others for test data.
In these experiments, we evaluated CNN [30], as
well as AdaBoost [18] combined with three types of fea-
tures, Haar-like [17], Histogram of Orientated Gradients
(HOG) [16] features, and RGB (image pixel values with-
out transformation). For reproducibility, we list the pa-
rameters of each algorithm in the following. As for CNN,
we used the architecture of [30] with the exception of
inputting color images and using more effective non-
linearity from [26]. For the training of CNN, we used
stochastic gradient descent [31], and we set the learn-
ing rate at iteration i to 0.001(1 + 0.0001i)−0.75, momen-
tum to 0.9, and weight decay to 0.0005 as optimization
parameters. In AdaBoost, we set the number of weak
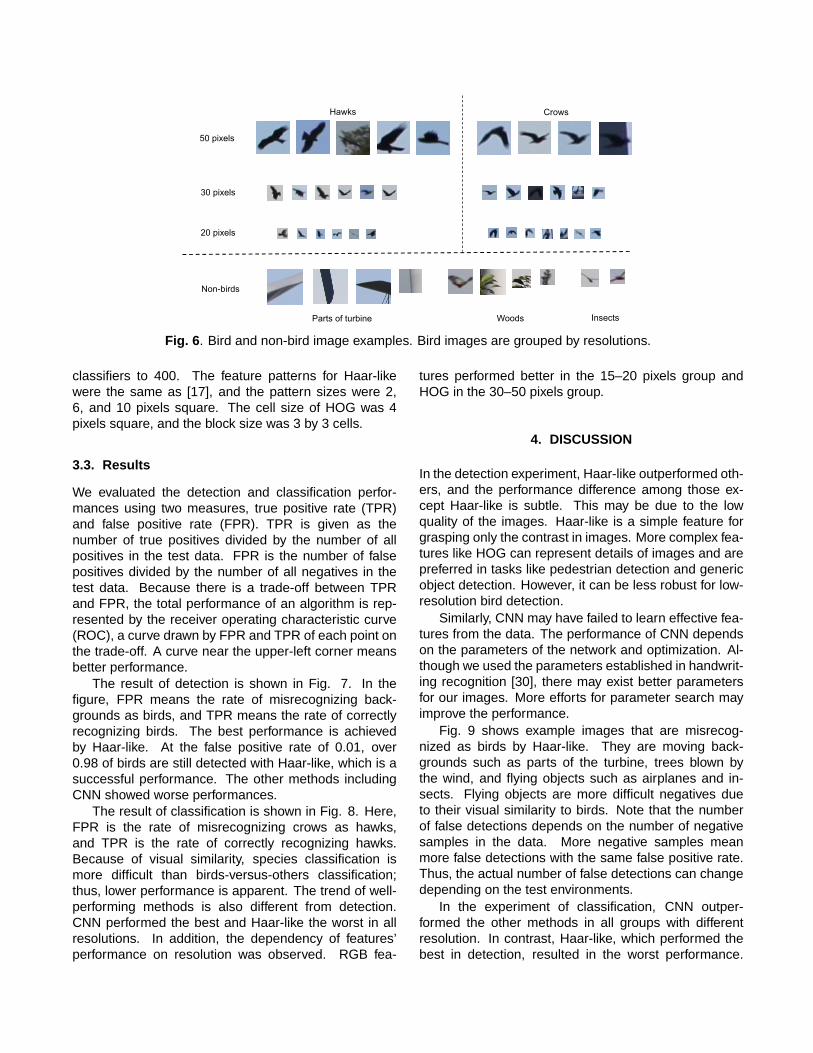
Fig. 6. Bird and non-bird image examples. Bird images are grouped by resolutions.
classifiers to 400. The feature patterns for Haar-like
were the same as [17], and the pattern sizes were 2,
6, and 10 pixels square. The cell size of HOG was 4
pixels square, and the block size was 3 by 3 cells.
3.3. Results
We evaluated the detection and classification perfor-
mances using two measures, true positive rate (TPR)
and false positive rate (FPR). TPR is given as the
number of true positives divided by the number of all
positives in the test data. FPR is the number of false
positives divided by the number of all negatives in the
test data. Because there is a trade-off between TPR
and FPR, the total performance of an algorithm is rep-
resented by the receiver operating characteristic curve
(ROC), a curve drawn by FPR and TPR of each point on
the trade-off. A curve near the upper-left corner means
better performance.
The result of detection is shown in Fig. 7. In the
figure, FPR means the rate of misrecognizing back-
grounds as birds, and TPR means the rate of correctly
recognizing birds. The best performance is achieved
by Haar-like. At the false positive rate of 0.01, over
0.98 of birds are still detected with Haar-like, which is a
successful performance. The other methods including
CNN showed worse performances.
The result of classification is shown in Fig. 8. Here,
FPR is the rate of misrecognizing crows as hawks,
and TPR is the rate of correctly recognizing hawks.
Because of visual similarity, species classification is
more difficult than birds-versus-others classification;
thus, lower performance is apparent. The trend of well-
performing methods is also different from detection.
CNN performed the best and Haar-like the worst in all
resolutions. In addition, the dependency of features’
performance on resolution was observed. RGB fea-
tures performed better in the 15–20 pixels group and
HOG in the 30–50 pixels group.
4. DISCUSSION
In the detection experiment, Haar-like outperformed oth-
ers, and the performance difference among those ex-
cept Haar-like is subtle. This may be due to the low
quality of the images. Haar-like is a simple feature for
grasping only the contrast in images. More complex fea-
tures like HOG can represent details of images and are
preferred in tasks like pedestrian detection and generic
object detection. However, it can be less robust for low-
resolution bird detection.
Similarly, CNN may have failed to learn effective fea-
tures from the data. The performance of CNN depends
on the parameters of the network and optimization. Al-
though we used the parameters established in handwrit-
ing recognition [30], there may exist better parameters
for our images. More efforts for parameter search may
improve the performance.
Fig. 9 shows example images that are misrecog-
nized as birds by Haar-like. They are moving back-
grounds such as parts of the turbine, trees blown by
the wind, and flying objects such as airplanes and in-
sects. Flying objects are more difficult negatives due
to their visual similarity to birds. Note that the number
of false detections depends on the number of negative
samples in the data. More negative samples mean
more false detections with the same false positive rate.
Thus, the actual number of false detections can change
depending on the test environments.
In the experiment of classification, CNN outper-
formed the other methods in all groups with different
resolution. In contrast, Haar-like, which performed the
best in detection, resulted in the worst performance.

Fig. 7. Results of detection (bird-versus-others). Fig. 8. Results of classification (hawk-versus-crow).
Fig. 9. Example images that are misdetected as birds.
The hand-crafted features may be less effective in clas-
sification because of the subtle difference between the
classes. Conversely, the learned features of CNN suc-
ceeded in adapting to the classification task through
training.
Fig. 10 shows examples of correct and wrong classi-
fication with CNN in each resolution group. Visually sim-
ilar images are sometimes correctly classified but some-
times not. Instead of high performance, CNN does not
have explicit trends in its misclassification because of
the black-box process of training.
5. CONCLUSION
To evaluate a bird monitoring system on the basis of
time-lapse images, we have conducted experiments of
bird detection and classification. By using a dataset
from a realistic environment and representative meth-
ods in computer vision, we provided practical results
of recognition performance. We showed successful re-
sults for detection and the possibility of species classi-
fication using image recognition. The effectiveness of
rising CNN in classification is also observed. However,
there is room for performance improvement, especially
in species classification. Improvement of the software
for more accurate bird monitoring is necessary. Our
system is a hopeful solution to bird strikes and can con-
tribute to the social acceptance of wind energy.
ACKNOWLEDGEMENTS
A part of this work is entrusted by the Ministry of the
Environment, JAPAN (MOEJ), the project of which is to
examine effective measures for preventing birds, espe-
cially sea-eagles, from colliding with wind turbines.

Fig. 10. Example images of correct and wrong classification in each resolution group.
6. REFERENCES
[1] B. Snyder and M. J. Kaiser, “Ecological and eco-
nomic cost-benefit analysis of offshore wind en-
ergy,” Renewable Energy, vol. 34, no. 6, pp. 1567–
1578, 2009.
[2] W. P. Kuvlesky, L. A. Brennan, M. L. Morrison,
B. M. Ballard K. K. Boydston, and F. C. Bryant,
“Wind energy development and wildlife conserva-
tion: Challenges and opportunities,” The Journal
of Wildlife Management, vol. 71, no. 8, pp. 2487–
2498, 2007.
[3] K. S. Smallwood, L. Rugge, and M. L. Morrison,
“Influence of behavior on bird mortality in wind en-
ergy developments,” The Journal of Wildlife Man-
agement, vol. 73, no. 7, pp. 1082–1098, 2009.
[4] A. L. Drewitt and R. H. W. Langston, “Assessing
the impacts of wind farms on birds,” Ibis - the In-
ternational Journal of Avian Science, vol. 148, pp.
29–42, 2006.
[5] A. L. Drewitt and R. H. W. Langston, “Collision ef-
fects of wind-power generators and other obstacles
on birds,” Annals of the New York Academy of Sci-
ences, 2008.
[6] A. L. Drewitt and R. H. W. Langston, “Risk evalua-
tion for federally listed (roseate tern, piping plover)
or candidate (red knot) bird species in offshore wa-
ters: A first step for managing the potential impacts
of wind facility development on the atlantic outer
continental shelf,” Renewable Energy, 2011.
[7] S. C. Clough, S. McGovern, D. Campbell, and
M. M. Rehfisch, “Aerial survey techniques for as-
sessing offshore wind farms,” International Council
for the Exploration of the Sea (ICES), Conference
and Meeting (CM) Documents, 2012.
[8] A. Rioperez and M. de la Puente, “Dtbird: A self-
working system to reduce bird mortality in wind
farms,” EWEA Conference, 2010.
[9] R. May, O. Hamre, and T. Nygard R. Vang, “Evalu-
ation of the dtbird videosystem at the smola wind-
power plant: Detection capabilities for capturing
near-turbine avian behaviour,” NINA Report 910,
2012.
[10] S. C. Clough and A. N. Banks, “A 21st century
approach to aerial bird and mammal surveys at off-
shore wind farm sites,” EWEA Conference, 2011.
[11] D. Lack and G. C. Varley, “Detection of birds by
radar,” Nature, vol. 156, pp. 446, 1945.
[12] W. L. Flock, “Monitoring bird movements by radar,”
IEEE spectrum, pp. 62–66, 1968.
[13] N. Huansheng, C. Weishi, M. Xia, and L. Jing,
“Bird-aircraft avoidance radar,” IEEE A&E systems
magazine, 2010.
[14] E. Wiggelinkhuizen, S. Barhorst, L. Rademakers,
H. den Boon, and S. Dirksen, “Wt-bird: Bird col-
lision monitoring system for multi-megawatt wind
turbines,” EWEC, 2007.
[15] David Lowe, “Distinctive image features from
scaleinvariant keypoints,” International Journal of
Computer Vision (IJCV), vol. 60, no. 2, pp. 91–110,
2004.
[16] N. Dalal and B. Triggs, “Histograms of oriented gra-
dients for human detection,” Proc. CVPR, vol. 1,
pp. 886–893, 2005.
[17] P. Viola and M. Jones, “Rapid object detection us-
ing a boosted cascade of simple features,” Proc.
CVPR, vol. 1, pp. I–511–I–518, 2001.
[18] Y. Freund and R. Schapire, “A decision-theoretic
generalization of on-line learing and an application
to boosting,” Computational Learning Theory, vol.
904, pp. 23–37, 1995.
[19] C. Corinna. and V. Vapnik, “Support-vector net-
works,” Machine Learning, vol. 20, no. 3, pp. 421–
436, 1995.
[20] G. Csurka, C. Dance, L. Fan, J. Willamowski, and
C. Bray, “Visual categorization with bags of key-
points,” Workshop on statistical learning in com-
puter vision, European Conference on Computer
Vision, 2004.
[21] P. Felzenszwalb, R. Girshick, D. McAllester, and
D. Ramanan, “Object detection with discrimina-
tively trained part-based models,” IEEE TPAMI,
2010.
[22] M. Everingham, L. Van Gool, C. Williams,
J. Winn, and A. Zisserman, “The PAS-
CAL Visual Object Classes Challenge 2012
(VOC2012) Results,” url: http://www.pascal-
network.org/challenges/VOC/voc2012/workshop/.
[23] J. Xiao, J. Hays, K. Ehinger, A. Oliva, , and A. Tor-
ralba, “Sun database: Large-scale scene recogni-
tion from abbey to zoo,” Proc. CVPR, 2010.
[24] J. Deng, W. Dong, R. Socher, L. J. Li, K. Li, and
L. Fei-Fei, “Imagenet: A large-scale hierarchical
image database,” Proc. CVPR, pp. 248–255, 2009.
[25] O. Russakovsky, J. Deng, H. Su, J. Krause,
S. Satheesh, S. Ma, Z. Huang, A. Karpathy,
A. Khosla, M. Bernstein, A. C. Berg, and L. Fei-
Fei, “Imagenet large scale visual recognition chal-
lenge,,” arXiv:1409.0575, 2014.
[26] A. Krizhevsky, I. Sutskever, and G. Hinton, “Ima-
genet classification with deep convolutional neural
networks,” Anual Conference on Neural Informa-
tion Processing Systems, 2012.
[27] Q. Chen, Z. Song, J. Dong, Z. Huang, Y. Hua, and
S. Yan, “Contextualizing object detection and clas-
sification,” IEEE TPAMI, 2015.
[28] R. Yoshihashi, R. Kawakami, M. Iida, and T. Nae-
mura, “Construction of a bird image dataset for
ecological investigation, ieee international confer-
ence on image processing,” IEEE International
Conference on Image Processing, 2015.
[29] P. Massimo, “Background subtraction techniques:
a a review,” IEEE International Conference on Sys-
tems, Man and Cybernetics, 2004.
[30] Y. LeCun, L. Bottou, Y. Bengio, and P. Haffner,
“Gradient-based learning applied to document
recognition,” Proceedings of the IEEE, 1998.
[31] L. Bottou, “Stochastic gradient descent tricks,”
Neural Networks: Tricks of the Trade, pp. 421–436,
2012.