evaluation of an extraordinary fire ... - gis trec at...
TRANSCRIPT

GIS Center - ISU
Evaluation of an extraordinary fire event in wetland area during 2008: Littoral Complex
of the Paraná River
Pablo Aceñolaza
September 2010
GIS Center - ISU
IntroductionIntroductionObjetivesStudy AreaStudy AreaMaterials and methods
Soil CoverageBurnt areaEmission estimation
Results and discusionResults and discusionConclusions

GIS Center - ISU
Introduction
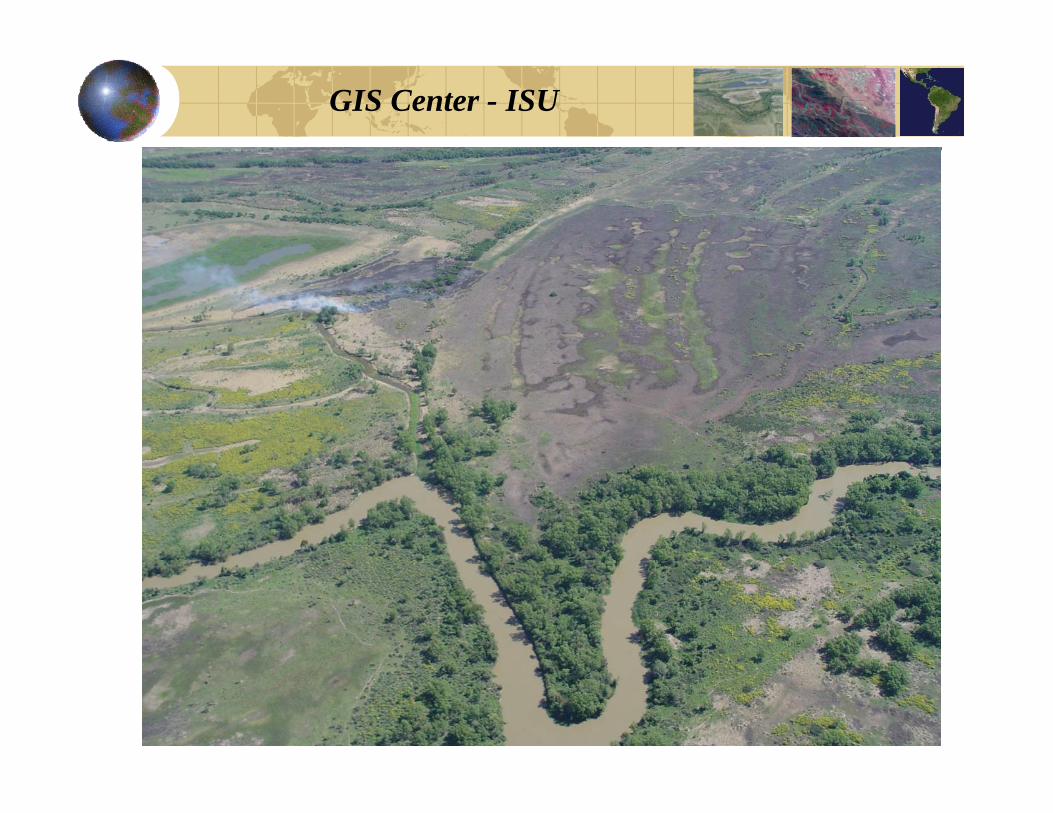
Fires in the island of the Paraná River Littoral Complex environments (R Argentina) present recurrence controlled byenvironments (R. Argentina) present recurrence controlled by anthropogenic, climatic and topographic factors.
They generate local consequences (vegetation degradation, nutrient lost, soil erosion, change in biogeochemical cycles, impacts on human health change in species composition) or globalhuman health, change in species composition) or global consequences (air pollution, climate). This last point could be presented as changes in emissions of greenhouse gases.

GIS Center - ISU
2004/9 Hot spots
In red, studied period, and in green previous and posterior fire events
GIS Center - ISU
At the regional level, particularly in these islands environment is still poor the knowledge that we have about the fire regime p g gand its historical occurrence. Also how it has changed in the present due to the increased usage for livestock grassing and for better accessibility reasons.Th d i i f l d l b d fiThe determination of land coverage classes, burned areas, fire timing and frequently land coverage affected by fires, were almost not studied in the lower portion of the Paraná River. Understanding this will help us to recognize implication that itUnderstanding this will help us to recognize implication that it may have at a regional level, and make a proper assessment of regional and global environmental impact of this phenomenon.

GIS Center - ISU
Objetives
•Generate a land cover map for the region.
•Generate burned area map based on the application of compositesimages of MODIS MOD13Q1.images of MODIS MOD13Q1.
•Estimate the emissions of CO2 that occurred during the periodFebr ar / J ne 2008 d e to the fire in the areaFebruary/ June 2008 due to the fire in the area.
GIS Center - ISU
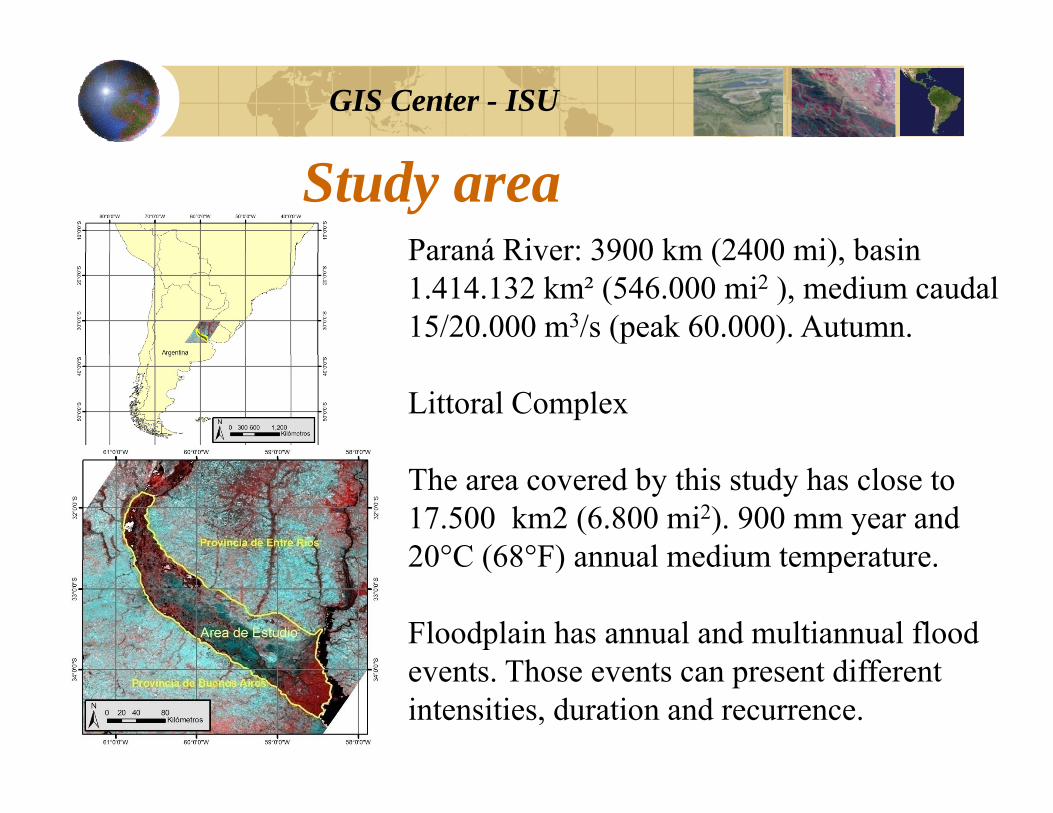
Study areaParaná River: 3900 km (2400 mi) basinParaná River: 3900 km (2400 mi), basin1.414.132 km² (546.000 mi2 ), medium caudal 15/20.000 m3/s (peak 60.000). Autumn.
Littoral Complex
The area covered by this study has close to17.500 km2 (6.800 mi2). 900 mm year and 20°C (68°F) annual medium temperature20 C (68 F) annual medium temperature.
Floodplain has annual and multiannual flood t Th t t diff tevents. Those events can present different
intensities, duration and recurrence.
GIS Center - ISU
GIS Center - ISU
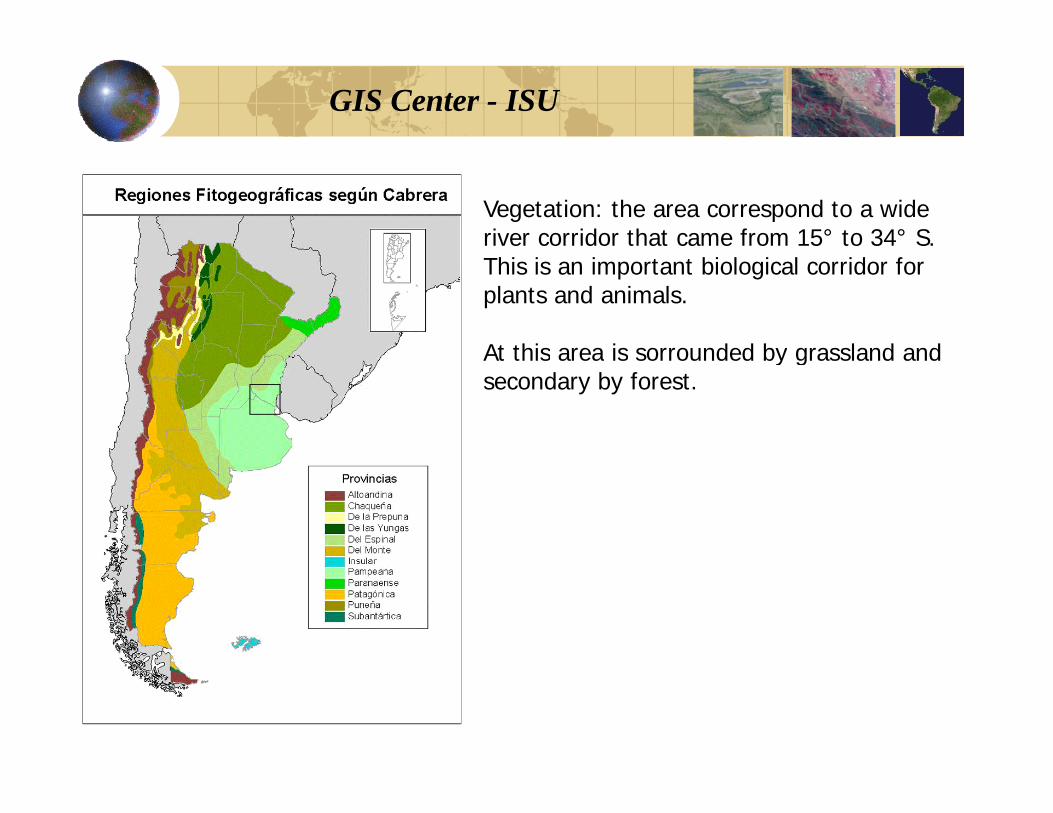
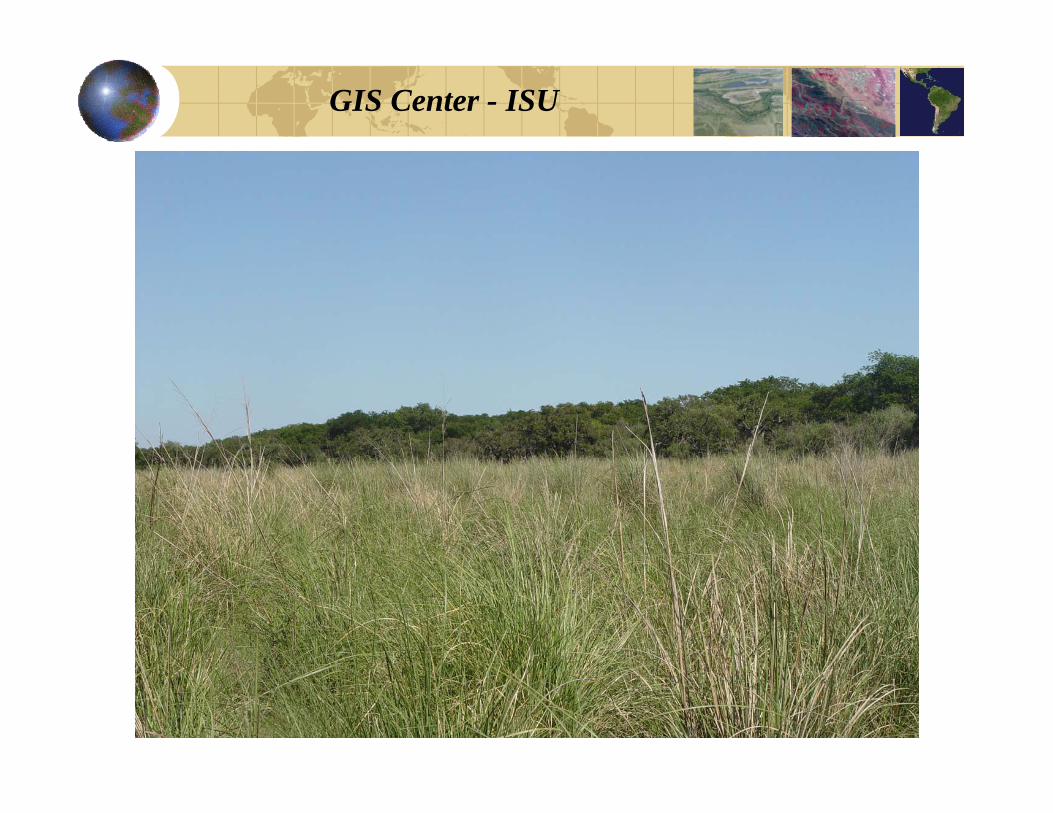
Vegetation: the area correspond to a wideriver corridor that came from 15° to 34° S.This is an important biological corridor forplants and animals.
At this area is sorrounded by grassland andAt this area is sorrounded by grassland and secondary by forest.
GIS Center - ISU
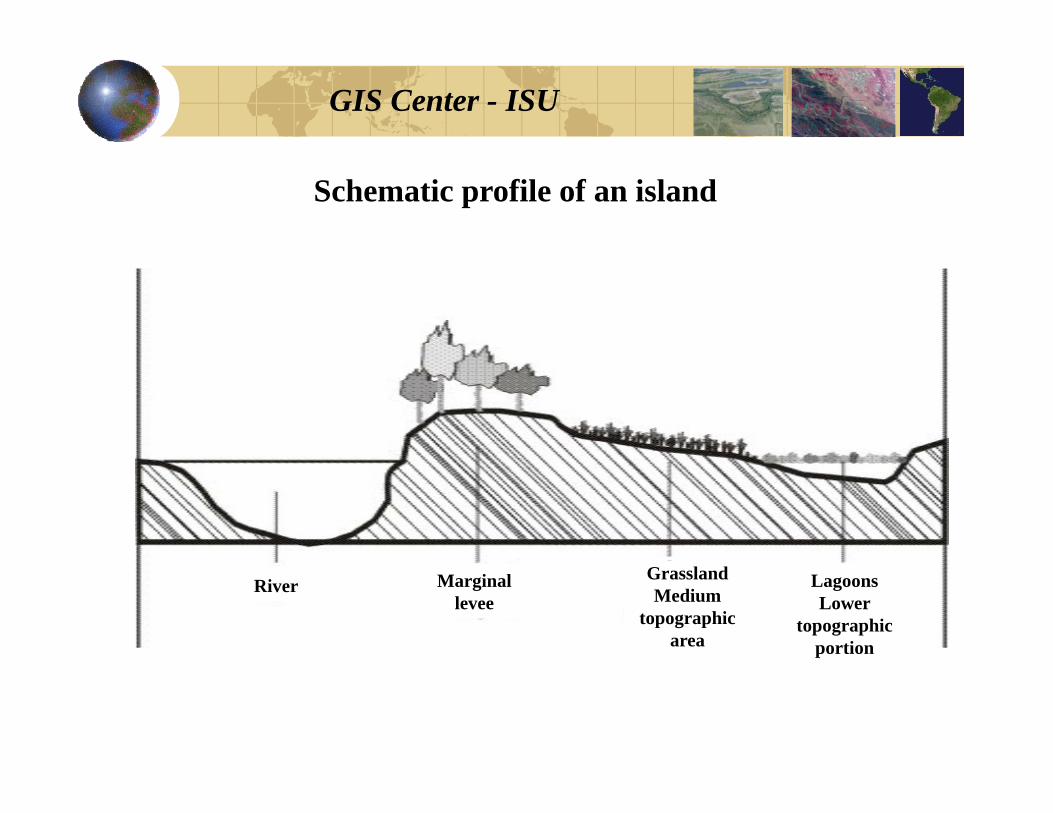
Schematic profile of an island
River Marginal levee
GrasslandMedium
topographic area
LagoonsLower
topographic portion
GIS Center - ISU
GIS Center - ISU
GIS Center - ISU
GIS Center - ISU

Jornadas de tecnologías y métodos para la gestión de territorio
GIS Center - ISU

GIS Center - ISU
GIS Center - ISU
Materials and methodsThe stages of this study were:
•Imagen acquisition •Land cover processing, •Determination of burnt area using index (BAI) •Emission estimation
GIS Center - ISU
A. Imagen acquisition
- We use data from MODIS (Moderate-Resolution ImagingSpectroradiometer) instrument aboard the Terra and AquaSpectroradiometer) instrument aboard the Terra and Aquasatellites. It has the possibility to acquire data every 1-2 days in36 spectral bands located between 0.4 μm and 4.14 μm, and
ith diff t ti l l ti 250 500 d 1000with different spatial resolutions: 250m, 500m and 1000m.
A. Adquisición de imágenes y pre-tratamiento…..

GIS Center - ISU
For land cover classification and estimation of burned area, we used 16 days (MOD13Q1) and 250 m resolution products. These are generated from standard composite reflectivity (MOD09Q1) (MODIS-TERRA), which were provided by EOS Data Gateway (EOS, 2004). These compounds include those pixels with the best observing conditions considering the absence of clouds and
Banda Resolución (mts)
SET DE DATOS(HDF Layers) (12)
UNIDADES
include those pixels with the best observing conditions, considering the absence of clouds and shadows, aerosol, low angle and have wide coverage.
1 250 16 días NDVI NDVI
2 250 16 días EVI EVI
3 250 16 días VI Quality detailed QA Bits
4 250 16 días Reflectancia (Banda del Rojo (Banda 1 de MODIS 620 670 nm))MODIS - 620-670 nm))
5 250 16 días Reflectancia (Banda del Infrarrojo Cercano (Banda 2 de MODIS – 841-876 nm))
6 250 16 días Reflectancia (Banda del Azul (Banda 3 de MODIS - 459-479 nm))
7 250 16 días Reflectancia (Banda del Infrarrojo medio (Banda 7 de MODIS - 2105-2155 nm))
8 250 16 días Grados (ángulo de visión zenital)
9 250 16 días Grados (ángulo solar zenital)
10 250 16 días Grados (ángulo azimutal relativo)
11 250 16 días Dias Julianos del año
12 250 16 días Ranking de calidad
A. Image acquisition and pre-treatment …..
GIS Center - ISU
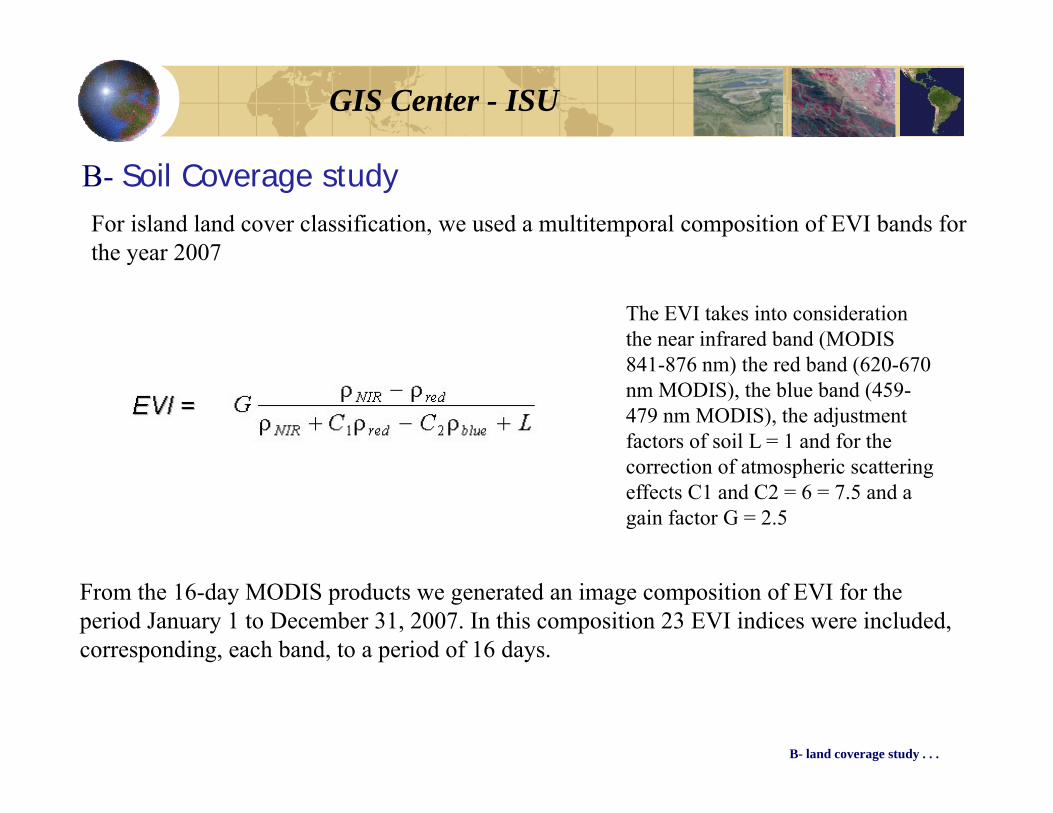
B- Soil Coverage studyFor island land cover classification, we used a multitemporal composition of EVI bands for the year 2007the year 2007
The EVI takes into consideration the near infrared band (MODIS 841-876 nm) the red band (620-670 nm MODIS), the blue band (459-479 nm MODIS), the adjustment factors of soil L = 1 and for the correction of atmospheric scattering effects C1 and C2 = 6 = 7.5 and a gain factor G = 2.5
From the 16-day MODIS products we generated an image composition of EVI for the period January 1 to December 31, 2007. In this composition 23 EVI indices were included, corresponding, each band, to a period of 16 days.
B- land coverage study . . .

GIS Center - ISU
The enhanced vegetation index (EVI) is an 'optimized' index designed to enhance the vegetation signal with improved sensitivity in high biomass regions and improved vegetation monitoring
through a de-coupling of the canopy background signal and a reduction in atmosphere influences. EVI i t d f ll i thi tiEVI is computed following this equation:
: where NIR/red/blue are atmospherically-corrected or partially atmosphere corrected (Rayleigh
and ozone absorption) surface reflectances, L is the canopy background adjustment that addresses non-linear, differential NIR and red radiant transfer through a canopy, and C1, C2 are the , g py, ,coefficients of the aerosol resistance term, which uses the blue band to correct for aerosol
influences in the red band. The coefficients adopted in the MODIS-EVI algorithm are; L=1, C1 = 6, C2 = 7.5, and G (gain factor) = 2.5.
Whereas the Normalized Difference Vegetation Index (NDVI) is chlorophyll sensitive, the EVI is more responsive to canopy structural variations including leaf area index (LAI) canopy typemore responsive to canopy structural variations, including leaf area index (LAI), canopy type,
plant physiognomy, and canopy architecture. The two VIs complement each other in global vegetation studies and improve upon the detection of vegetation changes and extraction of canopy
biophysical parameters. [1]EVI was adopted as a standard product
by NASA and became extremely popular with users due to its ability to eliminate background and atmosphere noises, as well as its non saturation, a typical NDVI problem
B. Estudio de cobertura de suelo …..
GIS Center - ISU
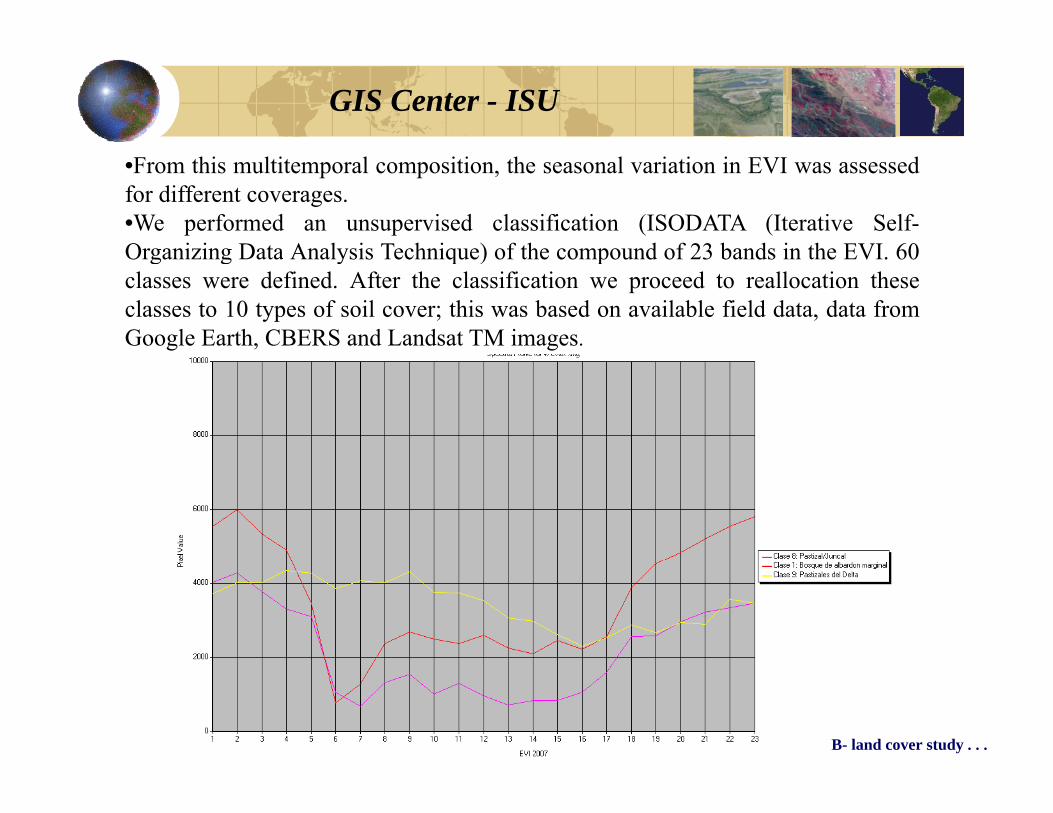
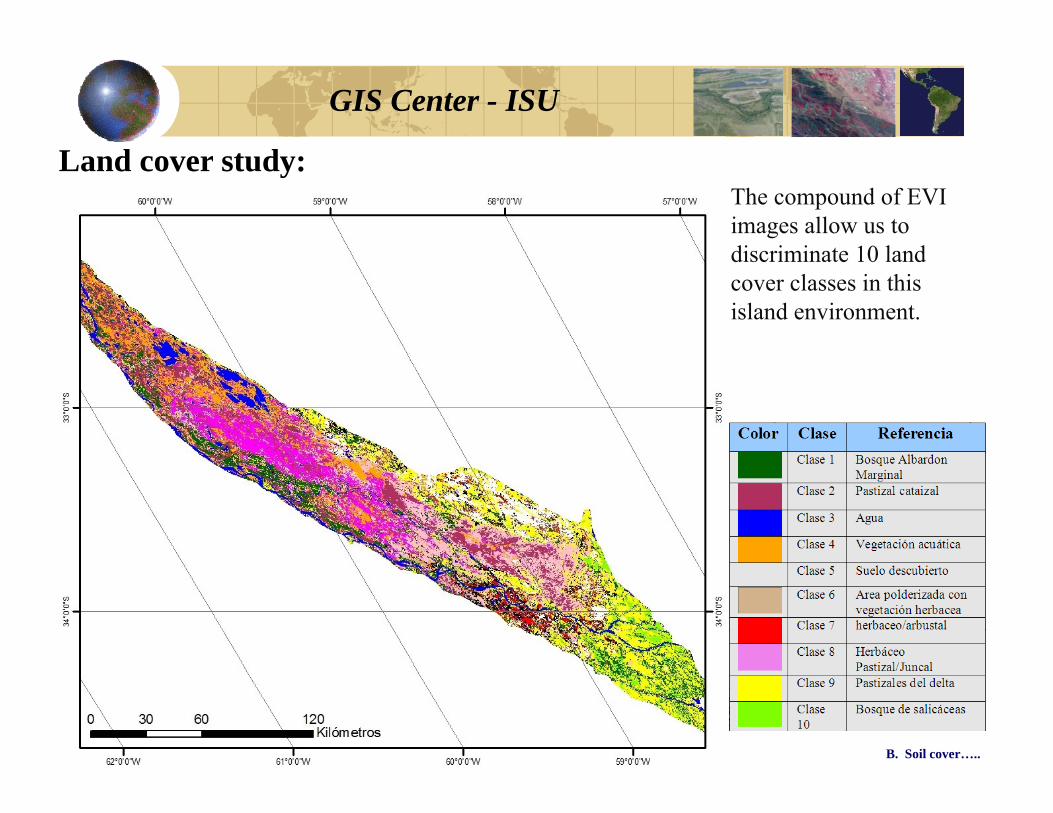
•From this multitemporal composition, the seasonal variation in EVI was assessedfor different coverages.•We performed an unsupervised classification (ISODATA (Iterative Self-Organizing Data Analysis Technique) of the compound of 23 bands in the EVI 60Organizing Data Analysis Technique) of the compound of 23 bands in the EVI. 60classes were defined. After the classification we proceed to reallocation theseclasses to 10 types of soil cover; this was based on available field data, data fromGoogle Earth, CBERS and Landsat TM images.
B- land cover study . . .

GIS Center - ISU
C2: Low grassland (Cataizal)
C4: Aquatic t ti
Shrub/grassland
vegetation
C6: polderizedareas
(grassland)
C7: shrubland
C8: reed beds and other
Coverage Clases
C9 Delta grassland
Marginal levee f t
Forest coverage
forest
Forest plantationsOther
Classes 3 and 5 (water and (
bareground)
B- land cover study . . .
GIS Center - ISU
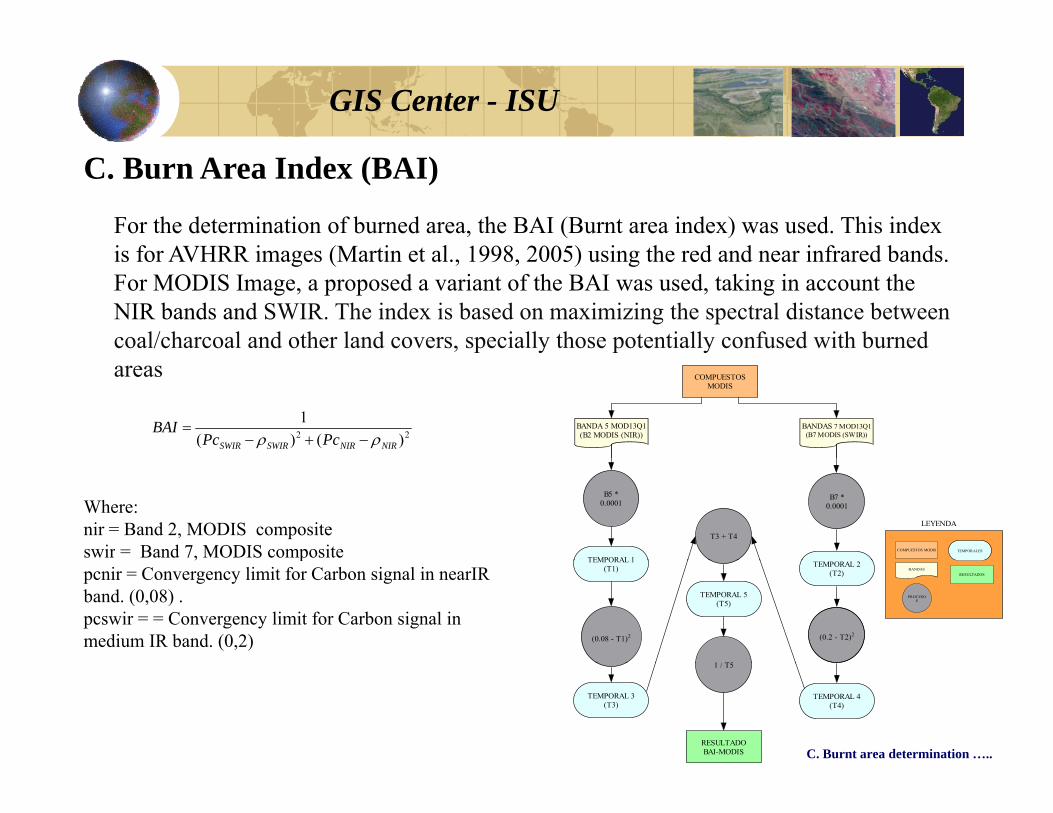
C. Burn Area Index (BAI)
For the determination of burned area, the BAI (Burnt area index) was used. This index is for AVHRR images (Martin et al 1998 2005) using the red and near infrared bandsis for AVHRR images (Martin et al., 1998, 2005) using the red and near infrared bands. For MODIS Image, a proposed a variant of the BAI was used, taking in account the NIR bands and SWIR. The index is based on maximizing the spectral distance between coal/charcoal and other land covers, specially those potentially confused with burned areas
22 )()(1
NIRNIRSWIRSWIR PcPcBAI
COMPUESTOSMODIS
BANDA 5 MOD13Q1(B2 MODIS (NIR))
BANDAS 7 MOD13Q1(B7 MODIS (SWIR))
Where: nir = Band 2, MODIS compositeswir = Band 7, MODIS composite
B5 *0.0001
B7 *0.0001
TEMPORAL 1
T3 + T4
LEYENDA
COMPUESTOS MODIS TEMPORALESppcnir = Convergency limit for Carbon signal in nearIRband. (0,08) .pcswir = = Convergency limit for Carbon signal in medium IR band. (0,2)
TEMPORAL 1(T1) TEMPORAL 2
(T2)
(0.08 - T1)2 (0.2 - T2)2
1 / T5
TEMPORAL 5(T5)
BANDAS
PROCESOS
RESULTADOS
TEMPORAL 3(T3)
TEMPORAL 4(T4)
1 / T5
RESULTADOBAI-MODIS C. Burnt area determination …..
GIS Center - ISU
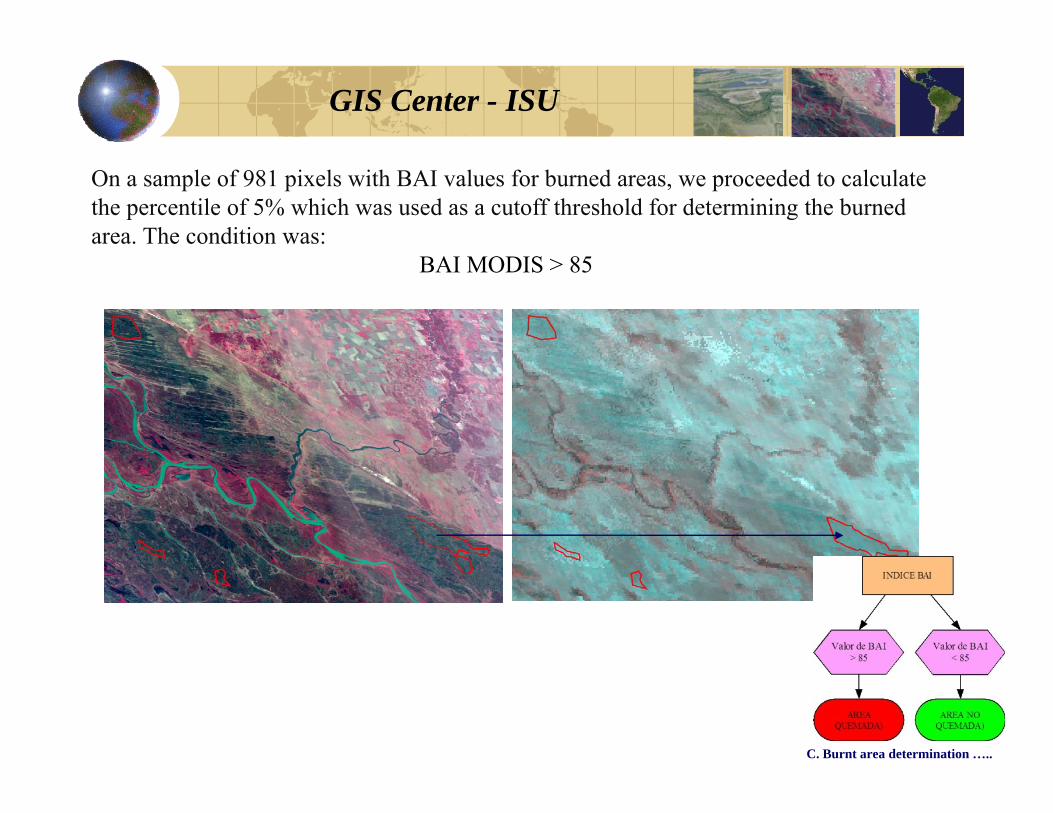
On a sample of 981 pixels with BAI values for burned areas, we proceeded to calculate the percentile of 5% which was used as a cutoff threshold for determining the burned area. The condition was:
BAI MODIS > 85
C. Burnt area determination …..

GIS Center - ISU
Th h d l d b i l f C (M C h 1) f i DM fi ld
D. Estimated emissions
The methodology used to obtain values of C (Mg C ha-1) was from previous DM field data and bibliography data. To this information we apply a conversion factor equal to 1.84 (the values of DM) under the assumption that the content of C is approximately 46% of the DM . One we have the C values (Mg C ha-1), CO2 values was estimated by ( g ), ymultiplying the value of C by 44/12 (3.67) (Bravo et al., 2007).
Due to other data that we obtained before this event, we assume that the proportion of biomass b rned d ring the fire as ass med as 60% of the total biomass in eachbiomass burned during the fire was assumed as 60% of the total biomass in each vegetation unit. Other authors indicate that about 20% of the carbon is part of the biomass is released during the fire (immediate release) essentially as CO2 (Seiler and Crutzen, 1980); while for necromass (litter) the estimated percentage of this emission is close to 60 percent (CORINAIR, 2000).
D. Emission estimations …..

GIS Center - ISU
Some resultsSome results
L d d
GIS Center - ISU
Land cover study:The compound of EVI images allow us to discriminate 10 landdiscriminate 10 land cover classes in this island environment.
B. Soil cover…..
GIS Center - ISU
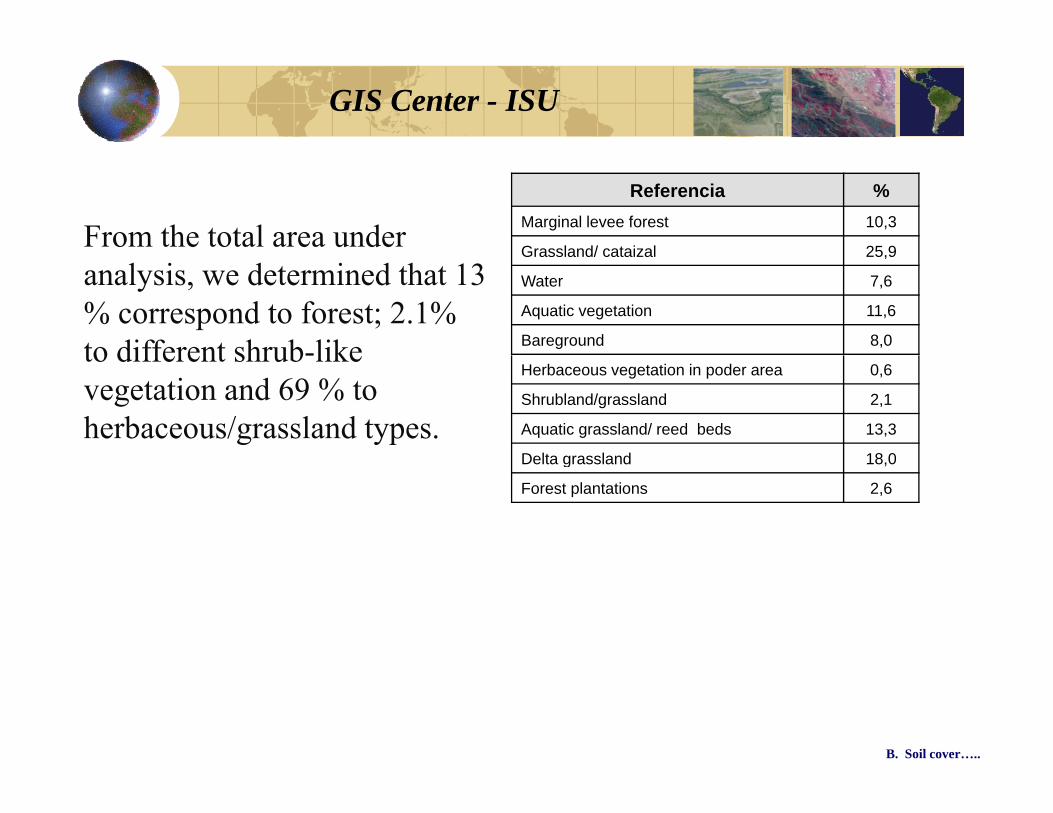
From the total area under Referencia %
Marginal levee forest 10,3
Grassland/ cataizal 25 9
analysis, we determined that 13 % correspond to forest; 2.1% to different shrub-like
Grassland/ cataizal 25,9
Water 7,6
Aquatic vegetation 11,6
Bareground 8,0to different shrub-like vegetation and 69 % to herbaceous/grassland types.
Herbaceous vegetation in poder area 0,6
Shrubland/grassland 2,1
Aquatic grassland/ reed beds 13,3
Delta grassland 18 0Delta grassland 18,0
Forest plantations 2,6
B. Soil cover…..

GIS Center - ISU
It was determined that the area affected by fires since the beginning
Determination of burnt area:
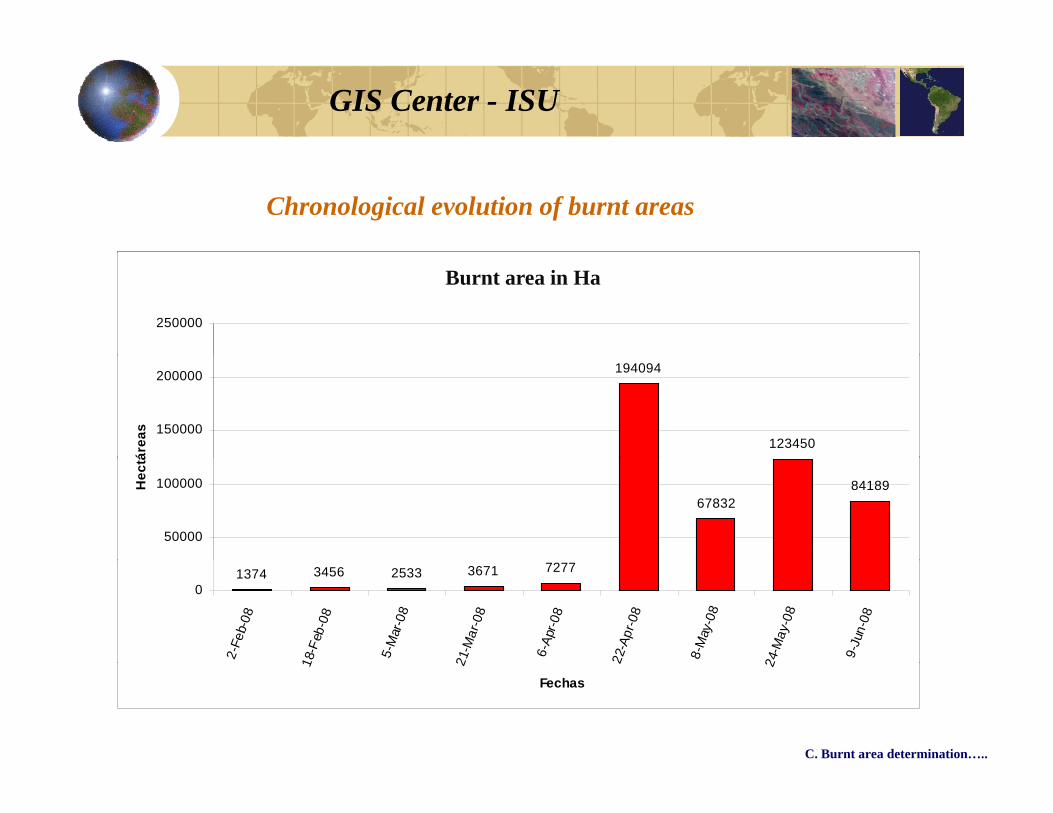
It was determined that the area affected by fires since the beginning of January to June 9, 2008 was 4550 km2 (1124329 acre or 1757 mi2). Coberturas QuemadasBurnt coverages
198710
130770150000
200000
250000
ficie
(ha)
46903
10626 2086545551
1567
32886
0
50000
100000
nal
al acea tal al ta ea do
Sup
erfi
Bosqu
e Alba
rdon M
argin
aPas
tizal
catai
zal
zada
con v
egeta
cion h
erba
che
rbace
o/arb
usta
junca
lpa
stiza
les de
l delt
aBos
que d
e sali
cace
aNo i
denti
ficad
o
area
polde
riza
C. Burnt area determination…..
GIS Center - ISU
Chronological evolution of burnt areas
Area quemada (Ha)
250000
Burnt area in Ha
194094
123450150000
200000
área
s
6783284189
50000
100000Hec
tá
1374 3456 2533 3671 7277
0
2-Fe
b-08
18-F
eb-0
8
5-M
ar-0
8
21-M
ar-0
8
6-Ap
r-08
22-A
pr-0
8
8-M
ay-0
8
24-M
ay-0
8
9-Ju
n-08
1 2 2 2
Fechas
C. Burnt area determination…..
GIS Center - ISU
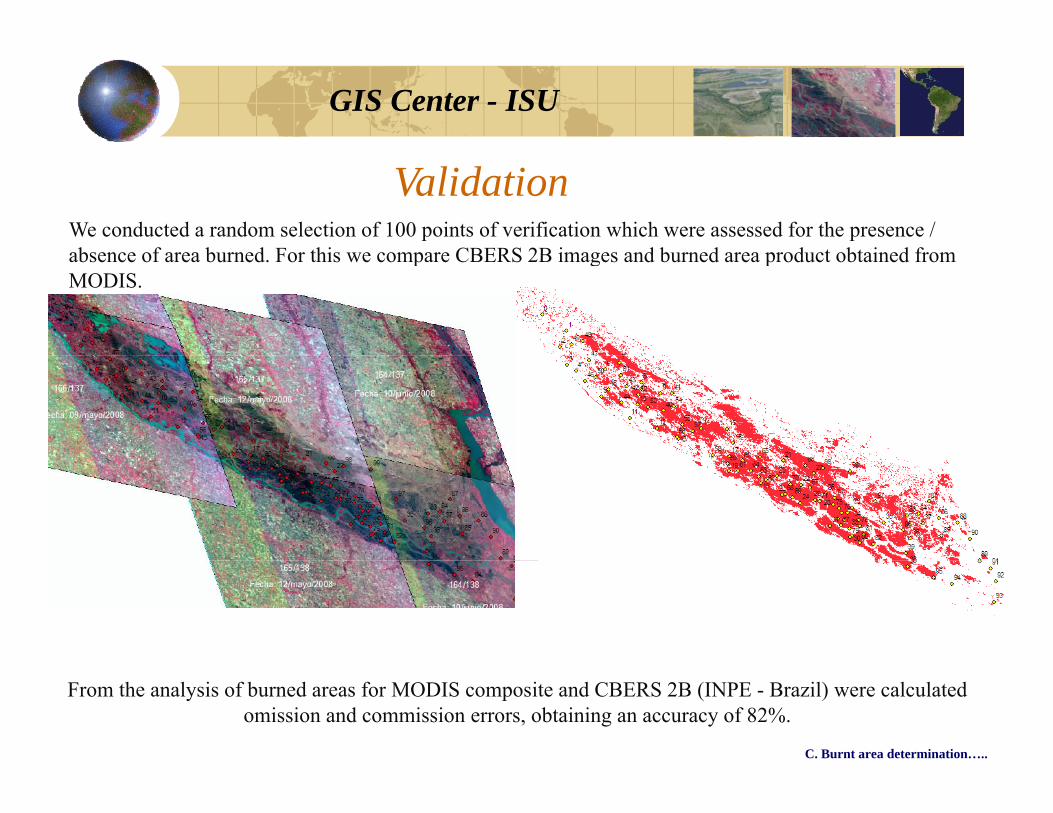
ValidationWe conducted a random selection of 100 points of verification which were assessed for the presence / absence of area burned For this we compare CBERS 2B images and burned area product obtained fromabsence of area burned. For this we compare CBERS 2B images and burned area product obtained from MODIS.
From the analysis of burned areas for MODIS composite and CBERS 2B (INPE - Brazil) were calculated omission and commission errors, obtaining an accuracy of 82%.
C. Burnt area determination…..
GIS Center - ISU
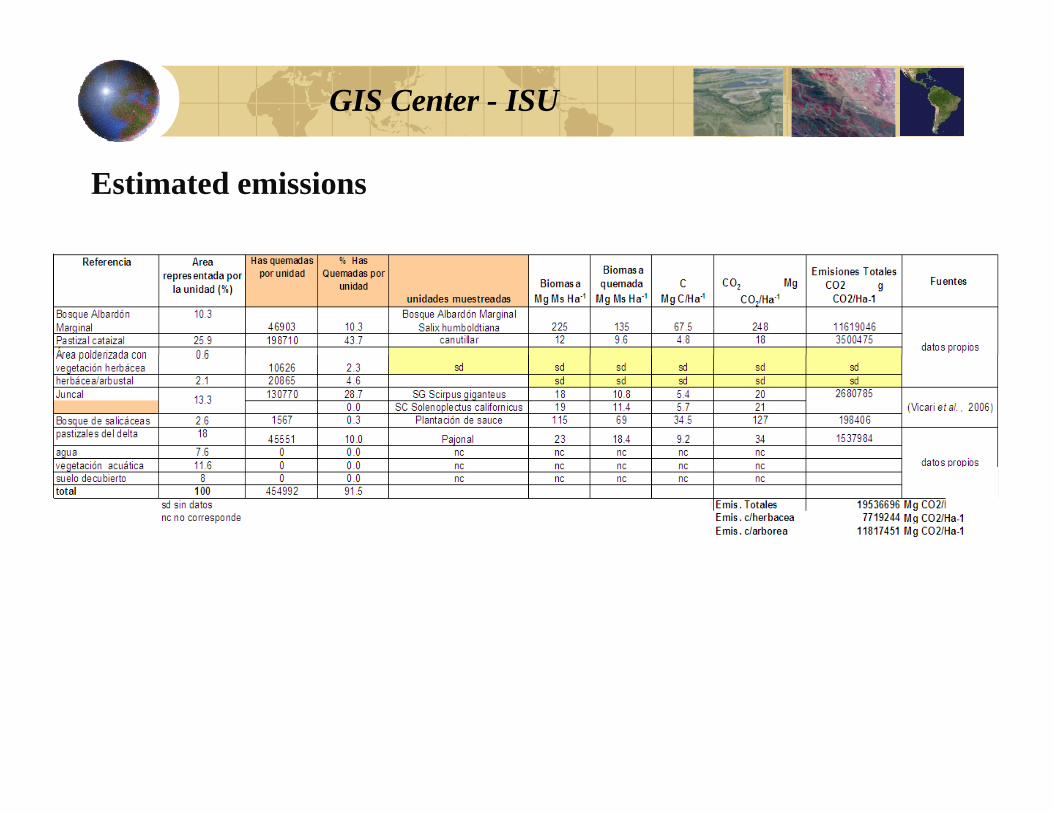
Estimated emissions

GIS Center - ISU
Some conclusions

GIS Center - ISU
•Fires at Paraná River Littoral Complex produced CO2 emissions calculated in 20and 34 Mg C ha-1 depending on the sites and vegetation cover types. Estimated
i i f th i d d id i th t t f b d t ti itemissions for the period, and considering the extent of burned vegetation units,are superior to 7.6 Tg C-CO2, for herbaceous vegetation. If the calculations alsoinclude emissions of tree cover, we have more than 19.5 Tg C-CO2 emitted.
•According to data published by the United Nations 2007, in the MillenniumDevelopment Goals Indicators website, CO2 emissions for Argentina until 2004were approximately 3.7 metric tons per capita and per year.were approximately 3.7 metric tons per capita and per year.
•Only the emission produced during the burning of the herbaceous cover duringthe study period is comparable to annually produced by an Argentina city of abouty p p y p y g y2 million inhabitants. If we also include in this calculation the total emissions(with burnt tree coverage), we estimated emissions higher than those of a city of 5million inhabitants.
D. Esttimación de emisiones…..

GIS Center - ISU
La utilización de compuestos generados a partir del índice EVI para la clasificación de cobertura de suelo a escala regional, permite generar una cartografía fiable para este tipo de ambientes y para esta escala.
Para el área de estudio, es de especial interés continuar con evaluaciones í d t l f t d l t i dpara períodos mas extensos a los efectos de lograr caracterizar de
manera precisa los ciclos a los que está sujeto este ambiente y en base a ello plantear estrategias de aprovechamiento sostenible de los mismos que permitan conservar el recurso.
El producto MOD13Q1 resultó apropiado para la determinación de área p Q p p pquemada a escala regional. El umbral sobre el BAI, estimado para este ambiente, permitió discriminar de manera confiable el área quemada y su evolución para cada período.
Resulta de interés explorar nuevos umbrales de corte sobre el índice BAI, para diferentes ambientes.BAI, para diferentes ambientes.
Las técnicas de teledetección y el trabajo de campo permitieron estimar el CO2 emitido por cada una de las unidades de vegetación identificadas en la región

GIS Center - ISU
G i ióGracias por su atención….
GIS Center - ISU