evaluation of an essential oil blend and a novel soybean
TRANSCRIPT
South Dakota State University South Dakota State University
Open PRAIRIE: Open Public Research Access Institutional Open PRAIRIE: Open Public Research Access Institutional
Repository and Information Exchange Repository and Information Exchange
Electronic Theses and Dissertations
2018
Evaluation of an Essential Oil Blend and a Novel Soybean Variety Evaluation of an Essential Oil Blend and a Novel Soybean Variety
as Alternatives to Preventative Antibiotic Use in Monogastrics as Alternatives to Preventative Antibiotic Use in Monogastrics
Samantha Tauer South Dakota State University
Follow this and additional works at: https://openprairie.sdstate.edu/etd
Part of the Animal Sciences Commons
Recommended Citation Recommended Citation Tauer, Samantha, "Evaluation of an Essential Oil Blend and a Novel Soybean Variety as Alternatives to Preventative Antibiotic Use in Monogastrics" (2018). Electronic Theses and Dissertations. 2424. https://openprairie.sdstate.edu/etd/2424
This Thesis - Open Access is brought to you for free and open access by Open PRAIRIE: Open Public Research Access Institutional Repository and Information Exchange. It has been accepted for inclusion in Electronic Theses and Dissertations by an authorized administrator of Open PRAIRIE: Open Public Research Access Institutional Repository and Information Exchange. For more information, please contact [email protected].

i
EVALUATION OF AN ESSENTIAL OIL BLEND AND A NOVEL SOYBEAN
VARIETY AS ALTERNATIVES TO PREVENTATIVE ANTIBIOTIC USE IN
MONOGASTRICS
BY
SAMANTHA TAUER
A thesis submitted in partial fulfillment of the requirements for the
Master of Science
Major in Animal Science
South Dakota State University
2018


iii
ACKNOWLEDGEMENTS
The completion of this thesis would not have been possible without the help and
encouragement of faculty at SDSU, graduate students, family, and friends.
First and foremost, thank you to my advisor, Dr. Robert Thaler, who not only
advised me in my graduate studies, but undergraduate as well. I appreciate your
willingness to help me finish in a year and half and allowing me to work from home
when possible. Dr. Crystal Levesque, thank you for “adopting” me into your group of
swine students and always encouraging me to do my best. I would also like to thank Dr.
Keith Underwood for being on my committee and helping with meat quality, as well as
Dr. Jeffrey Clapper for assisting with gene expression work. Deon Simon, thank you for
improving my lab techniques and for your help with lab protocols.
Additionally, the completion of the poultry project wouldn’t have been possible
without the support of Ralco, Inc. for the use of their poultry facility and the advising of
Dr. Jon Holt during my undergraduate internship and graduate studies.
Special thanks to my fellow graduate students, especially Ron Navales, Jacob
Koepke, Jamie Ortman, and Casey Zangaro for your assistance with collections and
classes. Also, thank you to Cheyenne Edmundson, a friend from undergrad, who spent
countless hours helping me with TBARS.
To family and friends, but especially my husband, Jon, thank you for supporting
and encouraging me along the way.
Finally, I am forever grateful to God for making what I thought seemed
impossible, possible.

iv
TABLE OF CONTENTS
LIST OF TABLES……………………………………………………………………….………v
LIST OF FIGURES………………………………………………………………….…………vii
ABSTRACT…………………………………………………………………………….…..…..viii
1.0 INTRODUCTION.................................................................................................................... 1
1.1 Feed additives ........................................................................................................................ 2
1.1.1 Growth performance ....................................................................................................... 3
1.1.2 Small intestine health………………………...……………………….………….5
1.1.3 Meat quality……………………………………………………………………………6
1.2 Feedstuffs ............................................................................................................................... 8
1.2.1 Feeding value……………………………………………………………….………….9
1.2.2 Small intestine health………………………………………………………………….11
1.2.3 Immunological response………………………………………………………………12
2.0 HYPOTHESIS and OBJECTIVES ...................................................................................... 15
3.0 EFFECTS OF DIETARY MICROFUSED™ ESSENTIAL OILS TECHNOLOGY ON
GROWTH PERFORMANCE, JEJUNAL HISTOLOGY, AND MEAT QUALITY OF
COCCIDIOSIS-CHALLENGED BROILERS ......................................................................... 16
3.1 Abstract………………………………………………………………………………………………………………….……….16
3.2 Introduction .......................................................................................................................... 17
3.3 Materials and Methods ......................................................................................................... 18
3.4 Results .................................................................................................................................. 23
3.5 Discussion ............................................................................................................................ 26
4.0 IMMUNOLOGICAL RESPONSE AND AMINO ACID DIGESTIBILITY OF A
SOYBEAN VARIETY FREE OF P34 PROTEIN, TRYPSIN INHIBITOR, AND LECTINS
FED TO WEANED PIGS ........................................................................................................... 44
4.1 Abstract………………………………………………………………………………………………………………………..…44
4.2 Introduction .......................................................................................................................... 45
4.3 Materials and Methods ......................................................................................................... 46
4.4 Results .................................................................................................................................. 51
4.5 Discussion ............................................................................................................................ 52
5.0 GENERAL DISCUSSION .................................................................................................... 61
6.0 REERENCES ......................................................................................................................... 64

v
LIST OF TABLES
Table 1. Composition of basal broiler diets for starter, grower, finisher and withdrawal
phases…………………………………………………………………………….29
Table 2. Broiler growth performance results obtained during the starter phase
(d0-16)……………………………………………………………………..…….30
Table 3. Broiler growth performance results obtained during the grower phase
(d16-27)………………………………………………………………………….31
Table 4. Broiler growth performance results obtained during the finisher phase
(d28-34)………………………………………………………………………….32
Table 5. Broiler growth performance results obtained during the withdrawal phase
(d35- 41)………………………………………………………………………….33
Table 6. Broiler growth performance results overall for the entire experimental period
(d0-41)……………………………………………………………………………34
Table 7. Measurements of villus height, crypt depth, and VH:CD ratio of the jejunum
from broilers collected on d14…………………………………………………...35
Table 8. Treatment averages for L*, a*, and b* color values of raw whole chicken breasts
stored in an illuminated refrigerator for seven days……………………………..36
Table 9. Calculated composition of experimental diets fed to weaned pigs that contain
different protein sources……………………………………………...………….56
Table 10. Chemical analyses of experimental diets fed to weaned pigs that contain
different protein sources……………………………………………….………...57
Table 11. Sequences of primers used for analysis of ileal cytokines of weaned pigs fed
different protein sources using RT-PCR…………………………………..…….58

vi
Table 12. Growth performance and small intestine health results of weaned pigs fed
different protein sources for ten days……………………………………….…..59
Table 13. Apparent ileal digestibility of amino acids and fecal energy digestibility
obtained from weaned pigs fed different protein sources for ten days……..…..60

vii
LIST OF FIGURES
Figure 1. L* color value of raw whole chicken breasts stored in an illuminated
refrigerator as an average of all treatments on day 0, 1, 2, 3, 4, 5, 6, and 7…….37
Figure 2. a* color value of raw whole chicken breasts stored in an illuminated
refrigerator as an average of all treatments on day 0, 1, 2, 3, 4, 5, 6, and 7…….38
Figure 3. b* color value of raw whole chicken breasts stored in an illuminated
refrigerator as an average of all treatments on day 0, 1, 2, 3, 4, 5, 6, and 7..…...39
Figure 4. L* color value of raw ground chicken thighs stored in an illuminated
refrigerator on day 0, 1, 2, 3, 4, 5, 6, and 7…………………………..…………40
Figure 5. a* color value of raw ground chicken thighs stored in an illuminated
refrigerator on day 0, 1, 2, 3, 4, 5, 6, and 7……………………………………..41
Figure 6. b* color value of raw ground chicken thighs stored in an illuminated
refrigerator on day 0, 1, 2, 3, 4, 5, 6, and 7……………………………………..42
Figure 7. Measured levels of malondialdehyde (MDA) per kg of wet tissue in raw
chicken breasts stored in an illuminated refrigerator for 7 days (A) and in raw
ground chicken thighs stored in an illuminated refrigerator for 1, 3, 5, or 7 days
(B)………………………………………………………………………………43

viii
ABSTRACT
EVALUATION OF AN ESSENTIAL OIL BLEND AND A NOVEL SOYBEAN
VARIETY AS ALTERNATIVES TO PREVENTATIVE ANTIBIOTIC USE IN
MONOGASTRICS
SAMANTHA TAUER
2018
Increasing consumer pressure to minimize antibiotic use and the implementation
of the Veterinary Feed Directive in 2017 has increased research on alternatives to
preventative antibiotics. This thesis focuses on evaluation of Ralco’s Microfused™
Essential Oils (MEO) fed to broilers and soybean meal from low allergenicity soybeans
fed to weaned pigs and their potential use as alternatives to antibiotics. Essential oils are
known to have antimicrobial, antioxidant, antiparasitic, and digestive stimulant effects.
Low allergenicity (LA) soybeans were bred to contain significantly lower concentrations
of the following anti-nutritional factors and allergenic proteins: Kunitz trypsin inhibitor,
soybean agglutinin (lectin), and P34 (Gly m Bd 28 K; Schmidt et al., 2015).
For the poultry experiment, day old broilers (n = 768) were induced with a
coccidiosis challenge and fed diets containing either MEO, antibiotics, or no additive for
41 days. The following parameters were measured: growth performance, jejunal villus
height, jejunal crypt depth, breast meat pH, and whole breast and ground thigh meat color
and lipid oxidation over seven days. Broilers fed MEO at 250 mg/kg performed similarly
to the antibiotic-fed, but minimal differences were noted for jejunal histology. MEO did
not affect breast pH, but impacted meat color and reduced lipid oxidation levels.

ix
For the swine experiment, weaned pigs (n = 36) were housed in individual
metabolism crates using three blocks of 12 pigs each. Pigs were fed either a high casein-
starch diet (CAS), conventional soybean meal-starch diet (CON), or LA soybean meal-
starch diet (LA) for 10 days and then euthanized. The following parameters were
measured: growth performance, fecal energy digestibility, and ileal villus height, crypt
depth, mast cell number, expression of IL-4 and IL-10 mRNA, and amino acid
digestibility. CAS-fed pigs had significantly higher average daily gain compared to CON
and LA-fed pigs (0.103, -0.008, and 0.36 ± 0.014 g; P < 0.0001). Minimal differences
were noted for ileal villus height and crypt depth. Mast cell, IL-4, and IL-10 were unable
to be quantified. Finally, CAS-fed pigs had greater digestibility of most ileal amino acids
over LA-fed pigs and increased fecal energy digestibility over CON-fed pigs.

1
1.0 INTRODUCTION
There are a variety of environmental, nutritional, and immunological stressors that
can adversely affect animal health and well-being (Proudfoot and Habing, 2015; Li et. al.,
1990). When animals are hatched or weaned, they experience each of these stressors
because there is a change in environment, change in diet, and change in antigen exposure.
In addition to the social stress that can be caused by new pen mates (Proudfoot and
Habing, 2015), animals also face nutritional stress due to a rapid change in the diet (Li et
al. 1990). Prior to weaning when piglets are still consuming milk from the sow, they
produce large amounts of the milk-specific enzyme lactase and low amounts of protease
and amylase due to high lactose content of their diets. When pigs are transitioned to a
corn-soybean meal diet after weaning, the secretion of lactase in the small intestine
decreases and amylase and protease secretion increases to be able to digest the plant-
based nutrients. Furthermore, in young pigs, anti-nutritional factors in soybeans have
been linked to hypersensitivity, which may adversely affect piglet performance (Sun et
al., 2008b; Li et al., 1990). When animals are exposed to stressors, there is an increase in
nutrient demands of the animal to combat stressors, which results in decreased weight
gain and a limited ability to create an immune response because not enough energy is
available to meet the maintenance, growth, and immune system requirements. This is
further exacerbated by lower a feed intake that is typically observed at weaning. This
leaves the animal in an energy deficient state for growth and subsequent performance is
reduced. Therefore, many young animals are administered antibiotics during this time of
high-stress in order to prevent a disease breakout within the herd (Chirila et al., 2017).

2
With increasing consumer pressure for producers to minimize antibiotic use along
with the implementation of the Veterinary Feed Directive by the Food and Drug
Administration in 2017, more research is being conducted to find alternatives to
preventive antibiotics. Some of these alternatives include prebiotics, probiotics,
phytochemicals, organic acids, and resistant starch (Zeng et al., 2015). Antibiotic
alternatives can be categorized into two broad categories: feed additives and feedstuffs.
1.1 Feed additives
Feed additives include, but are not limited to, antibiotics, coccidiostats, enzymes,
buffers, organic acids, pre/pro-biotics, and phytochemicals (Jacela et al., 2009). Among
the most commonly used additives to replace antibiotics and help manage disease stress
are organic acids, pre/pro-biotics, and phytochemicals (Bagal et al., 2016;
Dankowiakowska et al., 2013; Mathlouthi et al., 2011). Generally, feed additives are
added to enhance the growth performance of animals, but some may be added to replace
antibiotics for the prevention of disease in the diet. However, there is a large difference
in the efficacy of feed additives.
Of the alternatives listed, phytochemicals, specifically essential oils (EOs), have
been shown to have the most inconsistent results (Brenes and Roura, 2010). Essential
oils are aromatic oils that can be extracted from plant material, typically by distillation.
There are about 300 EOs that are commercially available and the inconsistency in results
may be due to this wide variety of oils, or the fact that the chemical compounds in the
oils can be affected by species, climatic conditions, harvest time, and plant part (Brenes
and Roura, 2010). Not only is there a wide variety of oils, but each oil can contain
different main components as well, further confounding the issue (Brenes and Roura,
2010).
3
However, EOs have been shown to have an impact on growth performance, gut
health, and meat quality of the animals. According to Zeng et al. (2015), “EOs enhance
the production of digestive secretions and nutrient absorption, reduce pathogenic stress in
the gut, exert antioxidant properties and reinforce the animal’s immune status.” This
wide variety of metabolic effects is supported by the fact that EOs are known to have
antimicrobial, antioxidant, and digestive stimulant effects (Mathlouthi et al., 2012;
Botslogou et al., 2002; Platel and Srinivasan, 2004).
1.1.1 Growth performance
Typically, the common way to assess the value of a feed additive is to analyze the growth
performance of a group of animals fed the feed additive compared to a control group who
have not received it. An increase in growth performance suggests that the feed additive is
effective and has a positive response in the animal. In addition to being compared to a
control group, a feed additive can also be tested against another treatment that is expected
to have similar effects or at graded levels to determine optimal feeding level (Mahmoodi
et al., 2014; Khattak et al., 2014). When comparing a feed additive to an alternative
product, no differences in growth performance between the two products may indicate
that the feed additive could serve as an appropriate alternative (Falaki et al., 2016).
Peng et al. (2016) concluded that oregano oil supplemented to broilers at 300 and
600 mg/kg significantly increased final body weight, ADG, and ADFI on d 42, but did
not affect G:F. Furthermore, broilers fed oregano at 600 mg/kg had significantly
increased ADG and ADFI over the positive control. Mathlouthi et al. (2012) reported
that broilers fed avilamycin (44 mg/kg), rosemary (100 mg/kg), oregano (100 mg/kg), or
a blend of EOs (1,000 mg/kg) had significantly greater weight gain and G:F compared to
control-fed broilers. Additionally, Khattak et al. (2014) reported that broilers fed a blend

4
of EOs at 100, 200, 300, 400, and 500 grams per ton of feed had significantly higher
weight gain and G:F versus those not fed the blend. Alp et al. (2012) concluded that
broilers fed an anticoccidial (100 mg/kg) or oregano essential oil (300 mg/kg) had a
significantly greater G:F over broilers on a control diet, but there were no differences in
the final weight on day 42.
There is some research that indicates EOs having a negative or minimal effect on
growth performance as well. Kirkpinar et al. (2011) fed broilers a control diet, garlic
essential oil at 300 mg/kg, oregano essential oil at 300 mg/kg or a blend of oregano and
garlic EOs at 150 mg/kg each. Broilers fed oregano essential oil had decreased ADG
over control-fed and no differences were reported for ADFI or G:F. Basmacioglu et al.
(2004) reported no differences in growth performance of broilers fed a control diet,
oregano essential oil at 150 mg/kg or 300 mg/kg, rosemary essential oil at 150 mg/kg or
300 mg/kg, or a blend of the two containing 75mg/kg or 150 mg/kg of each oil.
There is also evidence that EOs increase the growth performance of swine,
especially in young nursery pigs. Li et al. (2012) found a 22% increase in ADG and
19% increase in ADFI in nursery pigs fed a diet containing 100 mg/kg thymol and
cinnamaldehyde. Manzilla et al. (2006) reported that EOs increased ADG and ADFI in
nursery pigs, 33% and 26%, respectively. However, reports of enhanced growth
performance are not as common in finisher pig studies. A study by Ranucci et al. (2015)
on finisher pigs fed oregano essential oil and sweet chestnut wood extract for 155 days in
the finisher period showed no differences in ADG. However, the carcass meat of the pigs
fed the oregano essential oil and sweet chestnut wood extract had lower lipid oxidation
levels than the carcass meat of the control-fed pigs. The lack of response to EO in older

5
pigs may be due to the higher stress levels of the animals or the limited ability for a
newly weaned pig to create an immune response (Blecha et al., 1983). Following
weaning, maternal immune protection that was received through the milk is removed.
Therefore, piglets rely on their own immune system to recognize and properly respond to
antigens (Baily et al., 2005). However, the authors also stated, “Despite this initial active
response to fed proteins some form of tolerance is ultimately achieved, although this
transition may take some time.” Lee et al. (2016) stated that as pigs reach five to seven
weeks of age, their immune system has reached adult maturity. This could be the reason
antibiotic use is decreased in finisher pigs (Cromwell, 2006). As previously stated, newly
weaned animals have a limited ability to create an immune response, so there is a greater
opportunity to demonstrate the effects of the EOs.
Although the exact mechanism of EOs enhancing growth performance is
not known, Jang et al. (2007) reported that broilers fed a blend of EOs had increased
pancreatic amylase, trypsin, and maltase activity in the small intestine as compared to
birds not fed EOs. Therefore, it may be a combined effect of the antimicrobial activity of
EOs along with an increase in digestive secretions, which could result in increased
nutrient absorption.
1.1.2 Small Intestine Health
A healthy small intestine is vital to the survival of livestock (Blikslager, 2010).
Impairment of the small intestine leading to decreased resistance to pathogens or a
decrease in nutrient absorption is detrimental to the health, and thus, survival of the
animal. EOs can impact gut health in two major ways: shifts in gut microbiota and
changes in the microscopic anatomy of the small intestine (Brenes and Roura, 2010;

6
Basmacioğlu et al., 2016). The combination of these two effects leads to an increased
ability of the animal to combat disease by pathogenic organisms. However, research on
the impact of EOs on the histology of the small intestine in poultry is limited, especially
research on broilers that are under a coccidiosis disease challenge. Part of an experiment
conducted by Basmacioğlu et al. (2016) looked at the influence of an essential oil blend
on the histology of the ileum. Broilers fed the essential oil blend had increased villus
height and lower crypt depth at 42 days of age over broilers fed a control diet. Oviedo-
Rondón et al. (2006) investigated the impact of feeding EOs to coccidiosis-infected
broilers on intestinal microbial ecology, but did not look at the impact on small intestine
histology. However, they report that the essential oil blend impacted the microbial
community in infected broilers by preventing drastic shifts in the microbial populations
after the infection. Shifts in microbial populations can stimulate an immune response
because new antigens are present (Baily et al., 2005). Furthermore, Evans et al. (2001)
reported a decrease in the oocyst excretion from chicks fed a blend of EOs over those not
fed the blend, but this has not been a consistent response in other trials. Christaki et al.
(2004) found that feeding an essential oil product had no effect on oocyst excretion. The
positive effects of EOs on the small intestine may be attributed to the ability of EOs to
increase the health and integrity of the small intestine, and possibly its effect on gut
microbial populations.
1.1.3 Meat Quality
Essential oils are also known to decrease the lipid oxidation of meat due to their
antioxidant activity (Zeng et al., 2015). Oxidation causes rancidity, or spoiling of meat,
and poultry meat is especially susceptible to lipid oxidation because of its high content of

7
polyunsaturated fatty acids (Al-Hijazeen et al., 2016). Essential oils, particularly
oregano, sage, and rosemary, are known to have a high antioxidant activity (Brenes and
Roura, 2010). Oregano is derived from Origanum vulgare and possesses high
antioxidant activity due to its content of carvacrol and thymol (Economou et al., 1991;
Yanishlieva and Marinova, 1995). Luna et al. (2010) found no differences in levels of
lipid oxidation in poultry meat stored for 10 days from broilers fed butylated
hydroxytoluene (BHT), carvacrol, or thymol. This suggests that carvacrol and thymol
have the same antioxidant capacity as BHT, a commonly used synthetic antioxidant.
Furthermore, the effects of essential oils on lipid oxidation have been studied as
both a feed additive and a direct additive through incorporation in meat products.
Despite how EOs are used, the extent of lipid oxidation in the meat is generally measured
using 2-thiobarbituric acid reactive substances (TBARS). 2-Thiobarbituric acid reactive
substances measure the levels of malondialdehyde (MDA) in the meat, a secondary
oxidation product (Salih et al., 1987), by creating a pink color complex with the MDA
and 2-thiobarbituric acid. Besides measuring the extent of oxidation itself, undesirable
changes in color, odor, and flavor are also indicators of oxidation, and subsequently,
decreased shelf-life (Maraschiello et al., 1998). Therefore, these indicators of lipid
oxidation can also be measured to understand the effects of lipid oxidation. While color
is an objective analysis, measurement of odor and flavor can be subjective, even with
well-trained taste panelists. The L* color value is a measure of the lightness of meat, a* is
a measure of redness, and b* is a measure of yellowness (Al-Hijazeen et al, 2016). Al-
Hijazeen et al. (2016) found that oregano oil infusion into chicken meat at 100, 300, and
400 ppm decreased lipid oxidation in both cooked and raw meat versus a control. Their

8
results showed a significant increase in the L* value in meat from the broilers fed the
oregano treatments over control on day 7, but no differences in a*. Also, an increase in
the b* value in the meat of broilers fed oregano at 300 and 400 ppm over control was
observed on day 7. Meat from the broilers fed the EOs was lighter and yellower than
meat from broilers fed the control diet. Botsoglou et al. (2002) found that dietary
oregano essential oil addition in broiler diets decreased the level of lipid oxidation in both
thigh and breast meat for both raw and cooked meat over the control birds. The authors
concluded that the thighs had a greater extent of lipid oxidation compared to the breasts
because of the higher fat content of thighs, and the cooked meat had a greater level of
lipid oxidation versus the raw meat due to the cooking process. These results are
supported by Tichivangana and Morrissey (1985), who stated that both cooking and
mincing can increase the lipid oxidation potential of the meat.
1.2 Feedstuffs
Choice of dietary feedstuffs is also an option for maintaining or improving the
health of animals. Good quality feedstuffs should always be used to prevent reduced
performance or health issues from nutrient deficiencies or over-consumption of toxins
(Greco et al., 2014). However, specialty feedstuffs can also be used as a replacement for
similar types of feedstuffs, such as fermented or enzymatically treated soybean meal for
traditional soybean meal, or a different type of feedstuff, such as fishmeal, for soybean
meal. Generally, feedstuffs used for increasing pig health alter the digestive mechanisms
in the animal. For example, resistant starch is added to diets because it is indigestible in
the stomach and small intestine. However, it is fermented in the colon and produces
short chain fatty acids that are known to increase satiety and prevent overgrowth of

9
pathogenic bacteria in the colon (Haenen et al., 2013). Not only is an allergic response to
soybeans apparent in pigs, but it has been studied extensively in humans as soybean is
one of the eight major foods that are known to be responsible for 90% of food allergies
(L’Hocine and Boye, 2007). Glycinin, β-conglycinin, and Gly m Bd 28 K (P34) are soy
proteins that have the potential to cause an allergenic effect, that can be identified by an
abnormal immune reaction to the soy antigens (L’Hocine and Boye, 2007). In addition to
allergenic proteins, soybeans also contain anti-nutritional factors, such as trypsin
inhibitor, tannins, and phytate that cause decreased digestibility by rendering other
nutrients indigestible (Zhou et al., 2010; Adeyemo and Onilude, 2013). Soybeans that
have not been heat treated are especially high in trypsin inhibitor, which inhibits the
activity of trypsin, a protease in the small intestine responsible for protein breakdown
(Lei et al., 1981). Even though they are not present in large quantities, tannins can
inactivate digestive enzymes and phytate can bind to minerals, reducing their
bioavailability (Adeyemo and Onilude, 2013). The effect of anti-nutritional factors in
soybean meal is especially evident in nursery pigs, and is one of the main reasons why
alternate amino acid sources like porcine plasma and fishmeal are added to nursery diets.
1.2.1 Feeding Value
Fermentation or enzymatic treatment of soybean meal is shown to increase the
digestibility of the soybean meal. These treatments increase the feeding value of soybean
meal by improving protein utilization and reducing anti-nutritional factors (Zhou et al.,
2010). The actual total levels of nutrients in the feed can be analyzed, but it may not be
representative of the actual digestibility of those nutrients. This is important because pigs
require available nutrients, not total nutrients, and nutritionists need to know the available

10
level of nutrients to ensure that the animal is receiving all of its required nutrients on a
daily basis. Amino acid bioavailability of an assay feedstuff can be analyzed using the
slope ratio assay by feeding graded levels of the test feedstuff versus a reference feedstuff
that is nearly 100% digestible in the nutrient of interest. The ratio of the slope of the test
ingredient versus the reference ingredient is used to determine the bioavailability (Stein et
al., 2007).
Digestibility of nutrients can be reported as apparent ileal digestibility (AID),
standardized ileal digestibility (SID), true ileal digestibility (TID), or total tract
digestibility and can be determined by using an indigestible marker such as titanium
dioxide (Stein et al., 2007). Zhou et al. (2010) studied the impact of feeding an
enzymolytic soybean meal (ESBM) to weaned pigs by feeding increasing levels of
ESBM from 5 to 15% of the total soybean meal content of the diet. As levels of ESBM
increased, final weight, ADG, and G:F of the animals were improved. In addition to
affecting growth performance, the authors also found that inclusion of ESBM at the 15%
of total soybean meal level increased the digestibility of crude protein, digestible energy,
calcium, and phosphorous. Song et al. (2010) fed graded levels of a fermented soybean
meal (FSBM) as partial replacement for conventional soybean meal to weaned pigs.
Results of the study demonstrated that pigs fed increased levels of FSBM had decreased
diarrhea incidence compared to pigs fed conventional soybean meal. Reducing diarrhea
would result in increased nutrient digestibility since the feed is spending a longer time in
the small intestine, and there is more time for the enzymes to break down the feedstuffs
(Song et al., 2010).

11
Additionally, Cervantes-Pahm and Stein (2010) analyzed the feeding value of
fermented (FSBM), conventional, and enzyme-treated (ESBM) soybean meal as well as
soy protein isolate, fish meal, and casein by determining amino acid digestibilities of
each feedstuff. The feedstuffs were fed in six different diets along with a N-free diet to
ileal cannulated pigs (10.9 ± 2.3 kg) to determine endogenous loss for AID calculation.
The authors concluded that, with a few exceptions, the AID and SID of most amino acids
(AA) in the conventional soybean meal, FSBM, and ESBM were not different from each
other. They also concluded that the casein diet had the greatest SID of AA followed by
soy protein isolate, and the lowest SID in the conventional SBM diet, fish meal, FSBM,
and ESBM.
1.2.2 Small Intestine Health
The impact of feedstuffs on gut health can be determined through similar methods
as feed additives: small intestine histology, microbial populations, and gut permeability
(Li et al., 1990; Bakker et al., 1998; Ewaschuk et al., 2012). The method used depends
upon the feedstuff of interest or question to be answered. Small intestine histology is a
common method to assess gut health when feeding soybean meal because of the
hypersentivity reaction soybean meal causes in the small intestine (Li et al., 1990). Zhou
et al. (2010) stated, “Soybean meal high in protein-derived antinutritional factors, such as
trypsin inhibitors, urease, and allergenic proteins, can cause gastrointestinal disturbances,
intestinal damage, increased disease susceptibility, and reduced performances of piglets.”
Li et al. (1990) orally infused early weaned piglets with either dried skim milk or soybean
meal from 7 to 14 days after birth. Following weaning at 21 days of age, the piglets were
then fed either the dried skim milk or soybean meal again. The piglets fed the soybean

12
meal had decreased villus height but no differences in crypt depth. Dunsford et al. (1989)
concluded that feeding either a soybean meal diet or corn-soybean meal based diet
compared to a casein diet to pigs weaned at 21 days resulted in decreased villus height
and deformed villi. The authors stated that increased villus height and decreased crypt
depth are beneficial in the small intestine of pigs because decreased villus height and
increased crypt depth can result in reduced absorption.
1.2.3 Immunological Response
It is well documented that the soy proteins in soybean meal cause a
hypersensitivity reaction in the small intestine as well as a systemic allergic reaction (Li
et al., 1990; Sun et al., 2008b). There are many compounds in the soybean that are
known to cause an allergic response in humans and pigs, but the allergenic proteins found
in greatest quantity are glycinin and β-conglycinin (Zhou et al., 2010). In addition to
glycinin and β-conglycinin proteins, P34 (a soybean vacuolar protein) and lectins are also
known to cause allergenic effects (L’Hocine and Boye, 2007).
According to L’Hocine and Boye (2007), there have been a few successful
attempts to genetically alter soybeans to reduce allergenic compounds. Two examples are
the Kunitz soybean which lacks trypsin inhibitor and the Tohuku 124 soybean which
“lack[s] three of the known allergenic soybean proteins, the α and α’ subunits of β-
conglycinin, and the Gly m Bd 28 K” (L’Hocine and Boye, 2007). L’Hocine and Boye
(2007) also stated that the allergenic capacity of lectins is unknown, but it does act as a
carbohydrate binding protein.
The allergenic compounds in soybeans that affect the health and growth
performance of weaned pigs transitioning to a corn-soybean meal diet have been well

13
researched. Friesen et al. (2014) concluded that even if pigs are fed a diet devoid of
soybean meal at weaning and then transitioned to a corn-soybean meal diet 14 days after
weaning, they will still exhibit similar loss in performance as compared to piglets fed
soybean meal at weaning. The authors demonstrated that the pig’s immune system has
the capability to develop a tolerance to the soy protein.
The allergenic effect of soybean meal during this time of transition can be both
local and systemic. Intestinal expression of inflammatory and anti-inflammatory
cytokines and intestinal levels of IgE and IgA can be used to determine local allergenic
effects. Sun et al. (2008b) found that weaned piglets fed 2-8% glycinin had increased
levels of IgA, IL-4 (anti-inflammatory), and IL-6 (pro-inflammatory) in the jejunum as
compared to the control piglets. However, no differences were noted in the levels of
jejunal IgG and IgM between treatments. In another study by Sun et al. (2008a), IgE
levels in the duodenum, jejunum, and ileum were increased with increasing glycinin
inclusion levels. IgA is a mucosal antibody that plays a role in food allergies, IgE is an
allergy-related antibody, and IgG is an antibody that can be specific to soy antigens.
Unlike IgA, small quantities of IgG are secreted in the mucosa (Sun et al., 2008a; 2008b).
Serum expression of inflammatory and anti-inflammatory cytokines, serum levels
of IgG and IgE, skin fold thickness after intradermal injection, and CD4+ and CD8+
subsets in the plasma can be used to determine systemic allergenic effects. Li et al.
(1990) concluded that the piglets fed soybean meal had increased serum IgG titers to
soybean protein, but no differences were noted in skin fold thickness after intradermal
injection with saline, soy protein, or milk protein. Similar results were observed by
Friesen et al. (2014) who fed weaned pigs either a corn-soybean meal or a corn-dried

14
skim milk-dried whey diet. The pigs fed the corn-soybean meal diet had increased serum
IgG titers to soy protein, but no differences were found in skin fold thickness after
intradermal injection of soy protein or casein on day 7 after weaning. Overall, both Sun
et al. (2008a) and Sun et al. (2008b) concluded that the glycinin-induced allergenic
response is predominantly a Th2-type immune response due to an increase in the CD4+
subsets in plasma, increased detection of IL-4, IL-6, IL-10 in serum, and increased
number of intestinal mast cell numbers.

15
2.0 HYPOTHESIS and OBJECTIVES
Two studies were performed to determine the effects of a feed additive and novel
feedstuff when fed during a time of high-stress to monogastrics. The objective of the
feed additive study was to determine the effects of Ralco’s Microfused™ Essential Oils
(MEO) on growth performance, jejunal histology, and meat quality of coccidiosis-
challenged broilers. The objective of the feedstuff study was to evaluate the feeding value
of a soybean variety that is low in trypsin inhibitor, P34, and lectins for weaned pigs, and
to determine its impact on the pig’s small intestine and immune system.
The parameters investigated in the broiler trial were as follows:
(1) Broiler growth performance as measured by weight, average daily gain,
average daily feed intake, and gain:feed in the starter (d0-16), grower (d17-
27), finisher (d28-34), withdrawal (d35-41) and overall (d0-41) periods
(2) Jejunal histology as a measure of gut health using villus height, crypt depth,
and villus height:crypt depth ratio during peak infection
(3) Meat quality as measured by pH, color, and the level of lipid oxidation using
thiobarbituric reactive substances
The parameters investigated in the weaned pig trial were as follows:
(1) Feeding value as measured by feed nutrient analysis and energy and amino
acid digestibilities.
(2) Small intestinal health as measured by villus height, crypt depth, and villus
height:crypt depth ratio in the ileum
(3) Immunological response as measured by inflammatory cytokines and mast
cell counts in the ileum.

16
3.0 EFFECTS OF DIETARY MICROFUSED™ ESSENTIAL OILS
TECHNOLOGY ON GROWTH PERFORMANCE, JEJUNAL HISTOLOGY,
AND MEAT QUALITY OF COCCIDIOSIS-CHALLENGED BROILERS
3.1 Abstract
An experiment was conducted to determine the effects of Ralco’s Microfused™ Essential
Oils (MEO) on growth, jejunal histology, and meat quality of coccidiosis-challenged
broilers. Day old broilers (n = 768; 64 pens; 12 broilers/pen) were randomly allotted to
one of 5 dietary treatments fed in four phases: starter (d0-16), grower (d17-27), finisher
(d28-34), and withdrawal (d35-41). Diets were a corn-soybean meal basal diet (CON),
CON+BMD®50/Coban®90 at 55/121, 250/550, 250/495 and 0 mg/kg (ANTI),
CON+MEO at 375, 250, 125, and 100 mg/kg (MEOD), CON+MEO at constant 500
mg/kg (MEO500), and CON+MEO at constant 250 mg/kg (MEO250). Broilers were
offered a 10X dose of a coccidiosis vaccine on d 3, 15, 22, and 29. On d 14, jejunal
histology was measured. Two broilers per pen were harvested on day 41 and breast pH
was measured at d 7 postmortem. Rancidity compounds (TBARS) were measured on
whole breasts at d 7 postmortem and ground thighs on d 0, 3, 5, and 7 postmortem.
ANTI- and MEO250-fed broilers had increased gain compared to the CON-fed broilers in
the starter phase (P < 0.01) and ANTI-fed broilers had greater gain than CON-fed
broilers (P < 0.03) in the grower phase. Overall, MEO250-fed broilers had a tendency
for greater gain over CON-fed (63.6 vs 61.3 ± 0.87 g; P < 0.08). MEOD-fed broilers
tended to have greater villus height compared to MEO500-fed (806.6 vs 716.3 ± 27.7 μm;
P = 0.09. No differences were observed for pH or TBARS of breasts. There were
differences in L*, a*, and b* color values of breasts and there was an interaction for color
values of thighs. ANTI, MEO500, and MEO250 had decreased TBARS values for thighs

17
compared to CON at day 7 postmortem (P ≤ 0.05). Overall, growth performance of
MEO250 was similar to ANTI during peak challenge. MEO250 could improve growth
performance and meat quality when broilers are subjected to a coccidiosis challenge.
3.2 Introduction
Consumer pressure for antibiotic-free meat products has led to increased research
in the area of antibiotic alternatives, including essential oils. Essential oils have a wide
variety of effects including antimicrobial, antioxidant, and digestive stimulant activities
(Mathlouthi et al., 2012; Botslogou et al., 2002; Platel and Srinivasan, 2004). Essential
oils have been demonstrated to positively impact growth performance, gut health, and
meat quality, but the responses are inconsistent. The inconsistencies have been related to
the species/subspecies of the plant, geographical location, harvest time, and plant part
used that can affect the chemical composition of the oils (Brenes and Roura, 2010).
Microfused™ Essential Oils is a blend of oils, but is comprised mainly of
oregano. The oils undergo a patented microfusion process that creates a surface area of
oil droplets that is 20 times greater than other commercially available oils, increasing the
stability and effectiveness of the oils. Due to its oregano content, MEO has a high
antioxidant activity, which is attributed to its two main phenols, carvacrol and thymol
(Economou et al., 1991; Yanishlieva and Marinova, 1995). Lipid oxidation affects meat
quality by negatively impacting color, odor, flavor, and shelf-life (Maraschiello et al.,
1998). Poultry meat is especially sensitive to lipid oxidation due to the high content of
polyunsaturated fatty acids (Al-Hijazeen et al., 2016). Additionally, processes such as
mincing and cooking can increase the oxidation potential of the meat (Tichivangana and
Morrissey, 1985).

18
The objective of this experiment was to determine the effects of Ralco’s
Microfused™ Essential Oils (MEO) on growth performance, jejunal histology, and meat
quality of coccidiosis-challenged broilers.
3.3 Materials and Methods
Experimental Design, Diets, and Animal Housing
Day old broiler cockerels (n = 768 + 20 for replacements) were transported from
Cobb-Vantress Inc. in Siloam Springs, AK to Ralco’s Poultry Research Facility in Lynd,
MN. Chicks were left in shipping crates in the facility overnight with barn temperature
maintained at 33°C. The following morning, chicks were wing banded, weighed, and
randomly allotted to treatment. Treatments consisted of five diets that were fed as
follows: a corn-soybean meal basal diet (CON), the CON diet with
BMD®50/Coban®90 added at 500/605, 250/550, 250/495 and 0 mg/kg in the starter,
grower, finisher, and withdrawal phase, respectively (ANTI), CON+MEO at 375, 250,
125, and 100 mg/kg added in the starter grower, finisher, and withdrawal phase,
respectively (MEOD), CON+MEO added at 500 mg/kg in all phases (MEO500), and
CON+MEO added at 250 mg/kg in all phases (MEO250). The MEO was supplied by
Ralco Nutrition, Inc, in Marshall, MN. All diets were fed in mash form in four phases:
starter (d0-16), grower (d17-27), finisher (d28-34), and withdrawal (d35-41) (Table 1).
Samples of all experimental diets and the vitamin trace mineral premix were sent to
Dairyland Laboratories, Inc. in Arcadia, WI for nutrient analysis.
The broilers (n = 12 per pen) were housed in two side-by-side battery brooders
with four stacked rows and 32 pens (0.91 x 0.61 x 0.61 m) per brooder. There were 12
replications for the CON treatment and 13 replications for the remaining treatments.

19
Any mortality that occurred within the first five days was replaced with extra chicks that
had been fed the CON diet. Prior to the removal of one broiler per pen for histological
assessment on day 14, feeder space was 7.6 cm per broiler and stocking density was
0.028 square meters per broiler. After removal of one broiler, feeder space was 8.3 cm
per broiler and stocking density was 0.031 square meters per broiler. Each pen was
equipped with 3 nipple waterers.
Coccidiosis Challenge
A coccidiosis challenge was induced in order to stimulate the conditions of a
disease stress. Broilers, including replacements on day 3, were offered a commercial
coccidiosis vaccine containing viable oocysts of E. acervulina, E. maxima, and E. tenella
at 10 times the dose on top of the feed in a gel carrier dyed green on days 3, 15, 22, and
29 to ensure a challenge was maintained. In order to determine when peak infection
occurred, fecal samples were collected on days 6, 8, 13, 15, 20, 22, 28, 34, and 36 from
each pen and pooled by treatment. Samples were immediately placed on ice and sent to
Best Veterinary Solutions, Inc in Willmar, MN for analysis of oocyst counts.
Growth Performance
Individual bird weights were taken on day 0, 15, 26, 35, and 41 and a pen mean
was calculated for statistical analysis. Pen feed disappearance was measured on days 15,
26, 35, and 42 at the end of each feeding phase. All feeders were emptied on the
previously mentioned days and the new diet phase wasadded. Pens were checked daily
for mortality or those needing to be euthanized due to leg or health problems. Any
broilers that showed signs of disease and did not maintain or improve health over time
were euthanized.

20
Jejunal Histology
On day 14, a randomly selected broiler from each pen was removed and
euthanized using a CO2 chamber. A 5 cm section of the jejunum, beginning 5 cm
proximal to Meckel’s diverticulum, was collected and placed into 10% formalin for
histological assessment. Slides were prepared and stained with haematoxylin and eosin
at a commercial pathology diagnostics lab (Animal Disease Research and Diagnostic
Laboratory, Brookings, SD). Villus height and crypt depth was measured using a Nikon
microscope (Tokyo, Japan) equipped with a DS2MV Nikon camera (Tokyo, Japan) and
NIS Elements software (Tokyo, Japan). Due to an unexpected amount of damaged villi,
measurements were taken on all viable villus and the crypt associated with each villi. The
villus height:crypt depth ratio was calculated.
Carcass Fabrication and Color
On day 41, two broilers were randomly selected from each pen, leg banded, and
transported to a small harvest facility in Pipestone, MN for harvest the following
morning. Seventeen hours after removal from pens, broilers were stunned, eviscerated,
and butchered. Individually bagged whole chickens were transported to the meat lab at
South Dakota State University, Brookings, SD in a refrigerated trailer. The carcasses
were placed in a cooler (1-3°C) overnight and fabricated the following morning. Breasts
were removed, deskinned, deboned, and placed on a foam tray and overwrapped. Thigh
meat was deskinned, deboned, and ground twice with a 3.18 mm die. Two pens (four
carcasses) were pooled and utilized as one replication for color analysis and shelf life of
thigh meat. The grinder was rinsed between replications. Each replication was split into
four 113.4 g patties, placed on a black foam tray, overwrapped, and labeled as day 1, 3, 5,

21
or 7. Following tray overwrapping, both breasts and thighs were placed with one sample
of each treatment per column on tables in an illuminated refrigerator at 4°C and rotated
from front to back daily. Measurement of color using a Minolta colorimeter (CR-400;
Minolta Corp., Ramsey, NJ; equipped with a 50 mm diameter measuring space and D65
illuminant) was taken on both breasts and thighs on day 0, 1, 2, 3, 4, 5, 6, and 7.
Lipid Oxidation
Rancidity compounds were measured using 2-thiobarbituric reactive substances
(TBARS) on 2 broilers per pen on whole breasts at d 7 postmortem, and on ground thigh
meat on d 0, 3, 5, and 7 postmortem. Thighs were removed from the refrigerator,
vacuum sealed, and frozen (-80°C) as labeled on day 1, 3, 5, or 7. Breasts were removed,
vacuum sealed, and frozen (-80°C) on day 7. In order to create a homogenous sample,
breasts and thighs were powdered by placing small cubes of meat into liquid nitrogen.
Once frozen, the cubes were placed into a chilled Waring blender and blended until it was
powered. The powder was then placed into a Whirl-Pak® bag, vacuum sealed, and stored
at -80°C. All samples for TBARS were run in duplicate and one spiked sample using
TEP (97% 1,1,3,3, tetraethoxypropane, Sigma-Adlrich T9889) was used per plate to
determine percent recovery. For each sample, 1 mL of 0.2 mg/mL butylated hydroxyl
toluene (BHT; MP Biomedicals, LLC, cat# 101162) and 45.5 mL 10% trichloroacetic
acid (TCA) were added to 5 g of sample. TCA was prepared using 96.26 g of o-
phosphoric acid (Acros Organics, 389025000) and 400 g of trichloroacetic acid (Fischer
Scientific, A322-500) into a total volume of 4000 mL with double distilled water. The
spiked sample was prepared by weighing 5 g of sample, adding 1 mL BHT, 35.5 mL
TCA, and 10 mL of 10 µM TEP. Each sample was homogenized using a IKA® T25

22
Digital Ultra-Turrax® (IKA® Works, Inc, Willmington, NC) for 1 minute and filtered
through Whatman No1 filter paper into a 100 mL glass sample bottle. A clean culture
tube was then used to mix 5 mL of filtrate with 5 mL of 0.02 M thiobarbituric acid (TBA;
2-thiobarbituric acid, Sigma Aldrich T5500). A standard curve was also prepared using
25 µM TEP, TCA, and TBA. The tubes were inverted five times and placed in a shaker
at room temperature for 15-20 hours and then plated (250 µL) in duplicate and read using
a plate reader (Molecular Devices SpectraMax 190, Molecular Devices, Sunnyvale, CA)
at 530 nm (Witte et al., 1970). The procedure used by Tarladgis et al. (1960) was used
for calculation of malondialdehyde (MDA) content using the percent recovery and
absorbance values obtained.
pH
Two frozen, powdered, homogenous breast samples from each pen were used to
determine pH. A volume of 90 mL of distilled water was added to 10 g of sample. The
solution was then homogenized and read for pH, where pH 7 solution (Fischer Scientific,
SB107-500) was used for a standard. The pH values were obtained using a Thermo
Scientific Orion 370 Advanced PerpHecT® LogR® Meter (Chelmsford, MA). Samples
were averaged for each pen and pen was considered the experimental unit.
Statistical Analysis
All statistical analysis was performed using the PROC MIXED procedure of SAS
(Version 9.3, SAS Inst. Inc., Cary, NC). A completely randomized design was used with
pen as the experimental unit for the performance and meat quality and bird was used as
the experimental unit for histology. The control treatment had 12 replications for all
results, except n = 5 for thigh TBARS and color. All remaining treatments had 13

23
replications for all results, except n = 6 for thigh TBARS and color. Repeated measures
analysis was used for color and thigh TBARS and Tukey’s adjustment for means
separation was used where main effect of treatment was significant. Differences were
considered significant when the P-value ≤ 0.05 and a tendency for significance when the
P-value ≤ 0.10.
3.4 Results
In-feed antibiotics were intended to be included at manufacturers recommended levels;
however, due to a mixing error, the levels of antibiotics in the starter phase were
approximately 10% of the recommended inclusion rate. During transport to the harvest
facility, one broiler fed the CON diet died, so no meat quality data was collected from
that broiler.
Growth Performance
Growth performance results were divided by phases as follows: starter, grower,
finisher, withdrawal, and overall. The ANTI and MEO250 supplemented broilers were
heavier than CON at day 17, 28, and 35, respectively (P < 0.02; Tables 2-4). On day 41,
MEO250-fed broilers had a tendency for increased weight over the CON (P ˂ 0.08; Table
5). The ANTI- and MEO250-fed broilers had increased daily gain compared to CON-fed
in the starter phase (P < 0.01; Table 2) and ANTI-fed had significantly greater daily gain
compared to CON-fed (P < 0.03) in the grower phase (Table 3). Overall, ME250-fed
broilers had a tendency for greater daily gain compared to CON-fed (P ˂ 0.08; Table 6).
There were no differences in ADFI, except in the grower phase, where MEO250-fed
broilers had a tendency for increased intake over CON-fed (P ˂ 0.06; Table 3). There
were differences among treatments in the FCR in both the starter and grower phase

24
(Tables 2 and 3). In the starter phase, ANTI-, MEO500- and MEO250-fed broilers had
decreased F:G over CON-fed (P ˂ 0.04; Table 2), while ANTI-fed broilers had decreased
F:G over MEO250 in the grower phase (P ˂ 0.02; Table 3). For performance parameters
where treatments were different (P ≥ 0.05) MEOD and MEO500 performed intermediate
to MEO250, ANTI, and CON.
Jejunal Histology
Jejunal collections were performed on day 14 and peak infection appeared to have
occurred on day 15 according to both the pooled oocyst counts and visual signs of
lethargy, fever, and weakness. Pooled fecal oocyst counts were 0, 14,053, 13,467,
1,052,533, 5,227, 1,734, 133, 0 and 0 on days 6, 8, 13, 15, 20, 22, 28, 34, and 36,
respectively. The MEOD-fed broilers had a tendency for higher villus height than
MEO500 (P = 0.09) and there were no differences in crypt depth or VH:CD ratio among
treatments (Table 7).
Meat Quality
In order to determine meat quality from broilers, pH, color, and lipid oxidation
were measured. There were no differences in pH among treatments for breasts at day 7
of retail display (Table 8). There were no treatment by day interactions for breast meat
color. Therefore, main effects of treatment and day are reported in Table 8, Figure 1,
Figure 2, and Figure 3. For analysis of color, there were differences observed for L*
(lightness), a* (redness), and b* (yellowness) of breasts. The CON and MEOD
treatments exhibited a lower L* value (overall average across all 7 days) compared to
ANTI, MEO500, and MEO250 for breasts, while the ANTI group had a higher L* value
over CON, MEOD, and MEO500 (P ˂ 0.0008; Table 8). The value for L* of breasts did

25
not change from day 0 to 1, but decreased from day 1 to 7, with the exception of
increases in L* value on day 4 and 6 (P ˂ 0.04; Figure 1). During the seven day retail
display period, the ANTI treatment exhibited a lower a* value compared to other
treatments, while MEOD exhibited a higher a* value compared to CON, ANTI, and
MEO250 (P < 0.02; Table 8). Breast a* values increased from day 0 to 1, did not change
from day 1 to 4, decreased from day 4 to 5, and then plateaued from day 5 to 7 (P ˂ 0.03;
Figure 2). As an average value over all seven days, the ANTI and MEO250 treatments
exhibited the lowest b* value, the CON treatment exhibited the highest b* value, and
MEOD and MEO500 were intermediate (P ˂ 0.05; Table 8). The b* value increased
from day 0 to 4 and then plateaued from day 4 to 7 (P ˂ 0.0001; Figure 3). Overall,
breast meat decreased in lightness, decreased in redness after day 3, and increased in
yellowness.
For thigh color, there was an interaction of treatment*day for L*, a*, and b*. The
two treatments that did not change in L* value over time were MEOD and MEO250.
The CON and ANTI treatments performed similarly in their L* values over time. Both
treatments did not change from day 0 to 1, increased from day 1 to 3, and plateaued from
day 3 to 7 (P ≤ 0.007; Figure 4). MEO500 did not change in L* value from day 0 to 1,
increased from day 1 to 2, did not change again from day 2 to 3, decreased from day 3 to
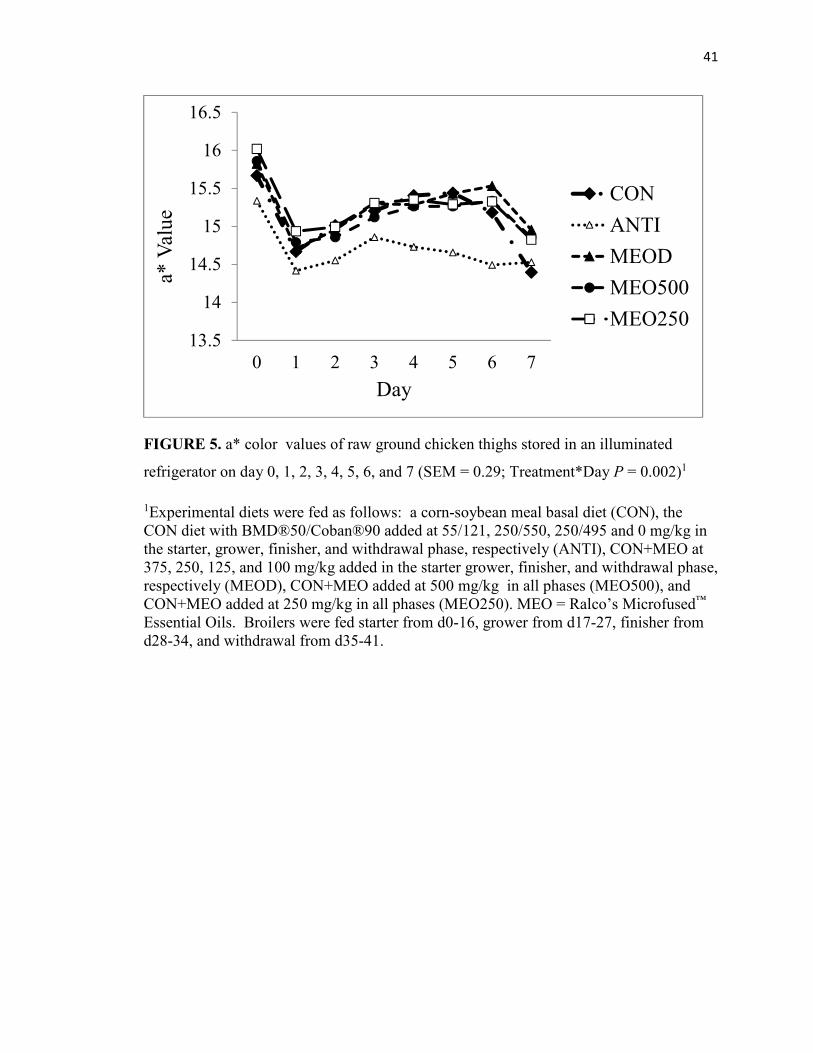
4, and then plateaued again from day 4 to 7 (P ≤ 0.05). All treatments decreased in a*
value from day 0 to 1 and increased from day 1 to 3 (P ˂ 0.02; Figure 5). Following day
3, ANTI, MEO500, and MEO250 performed similarly, plateauing from day 3 to 7, while
CON and MEOD a* value did not change from day 3 to 6 and then decreased from day 6
to 7 (P ˂ 0.03). For b* of thighs, all treatments increased from day 0 to 2 (P ≤ 0.0001;

26
Figure 6). The CON, MEOD, and MEO500 treatments did not change in b* value from
day 2 to 7, while the ANTI and MEO250 treatments did not change from day 2 to 6 and
then decreased from day 6 to 7 (P ˂ 0.0001).
Differences among treatments were also noted for TBARS of thighs, but not
breasts (Figure 7). All treatments had decreased levels of MDA per kg of wet tissue for
ground thighs compared to CON on day 5 (P ≤ 0.05). The ANTI, MEO500, and
MEO250 treatments had decreased levels of MDA per kg of wet tissue for ground thighs
compared to CON on day 7 (P ≤ 0.05) indicating decreased levels of lipid oxidation.
3.5 Discussion
The objective of this experiment was to determine the effects of MEO on growth
performance, jejunal histology, and meat quality of coccidiosis-challenged broilers.
Furthermore, it was of interest to determine if MEO could be a suitable replacement for
antibiotics in commercial poultry facilities. If the antibiotics would have been included at
the appropriate inclusion rate in the starter, it would have been expected for the ANTI-fed
broilers to have better performance than what was observed.
Based on performance measures, it is evident that MEO fed at a constant 250
mg/kg was the most effective method of combatting the negative effects of the
coccidiosis challenge. One reason for these results could be that MEO at 500 mg/kg is
too high, especially in the starter phase. Once the normal microbiota composition is
altered, pathogens may be able to proliferate in the small intestine (Li et al., 2017).
Therefore, with the strong antimicrobial potential of MEO, it is possible that MEO at 500
mg/kg negatively impacts the normal microflora of the gut. However, it can be noted that
neither level of MEO nor the ANTI treatment significantly impacted ADFI. The effects

27
of MEO250 and ANTI treatments were most apparent during the starter and grower
phases, and the differences started to diminish as the broilers started gaining immunity to
the coccidiosis. However, the effects of these treatments on broiler weight were still
present during the finisher and withdrawal phases. The ANTI- and MEO250-fed broilers
had higher weights over CON-fed broilers at the end of the starter, grower, and finisher,
but only the MEO250-fed broilers had a tendency for increased weight over CON-fed
broilers at the end of the withdrawal phase. More than likely, this is due to the fact that
the antibiotics were removed from the ANTI treatment in the withdrawal phase, so the
increase in weight advantage was not maintained.
While there were positive effects on growth performance of MEO250-fed
broilers, there was no effect of this treatment on jejunal histology. However, MEOD had
a tendency for increased villus height over MEO500. Although MEO was fed at
diminishing levels for the MEOD treatment, the only level the broilers received prior to
histological assessment was 375 mg/kg.
The beneficial effects of MEO fed at 250 mg/kg were also shown in the meat
quality data. There were no differences among treatments for pH of breasts, which
suggests that no treatment has an impact on this meat quality measure. This is consistent
with research performed by Simitzis et al. (2010) and Young et al. (2003), which found
no impact on the pH of meat from finishing pigs fed oregano essential oil. In regards to
color, the L* value of breasts decreased over time. Al-Hijazeen et al. (2016) also found
that broilers fed oregano essential oil had decreased L* values for breast meat over time.
The a* value of breasts peaked on day 2 and then decreased until day 7 and the b* value
increased from day 0 to 7. However, Al-Hijazeen et al. (2016) found that both the a* and

28
b* value decreased from day 0 to 7. Moreover, the lower fat content of the breasts as
compared to the thighs could be the reason there were no differences in the level of lipid
oxidation among treatments for breasts, but there were differences in lipid oxidation of
ground thighs. Not only is breast meat lower in fat content, but the breasts were analyzed
whole and the thighs were ground (Kirkpinar et al., 2014). Processing such as mincing,
grinding, and cooking of the meat will increase the lipid oxidation potential of the meat
(Tichivangana and Morrissey, 1985). Furthermore, it was not expected for the antibiotic
treatment to decrease the level of lipid oxidation in the meat to the same extent as the
essential oil treatments. However, research performed by Knarreborg et al. (2004) found
that supplementation of antibiotics (salinomycin, 40 mg/kg feed and avilamycin, 10
mg/kg feed) in broiler diets results in significantly increased plasma concentration of α-
tocopherol, which is an antioxidant.
The objectives of the experiment were met and effects of MEO were quantified.
Overall, MEOD- and MEO500-fed broilers performed intermediate to CON- and ANTI-
fed broilers and MEO250-fed broilers performed similarly to ANTI-fed broilers. Based
on this study, it appears that MEO250 is the optimal level to feed MEO. Microfused™
Essential Oils fed at 250 mg/kg has the potential to improve growth performance when
broilers are experiencing a coccidiosis disease challenge and decrease lipid oxidation of
ground thigh meat during illuminated storage.

29
Table 1. Composition of basal broiler diets for starter, grower, finisher, and withdrawal
phases1
Ingredient, % Starter Grower Finisher Withdrawal
Corn 59.0 65.1 68.8 70.2 Soybean Meal, 46% 36.6 30.3 25.4 24.6 Limestone 1.25 1.28 1.30 1.30 Soy Oil 0.50 1.00 1.25 1.75 Monocal. Phosphate 1.35 1.18 1.10 1.13 Sodium Bicarbonate 0.30 0.30 0.29 0.29 DL-Methionine 0.28 0.26 0.27 0.21 Salt 0.24 0.23 0.24 0.24 L-Lysine 0.17 0.17 0.16 0.14 Choline 60 (dry) 0.08 0.07 0.06 0.06 L-Threonine 0.04 0.03 0.05 0.05 VTM Premix2 0.20 0.17 0.14 0.14 Phytase 0.01 0.01 0.01 0.01 Total 100 100 100 100 1Broilers were fed starter from d0-16, grower from d17-27, finisher from d28-34, and withdrawal from d35-41. 2Vitamin/trace mineral premix was formulated to contain the following: 42,047 KIU/kg vitamin A, 8,190 KIU/kg vitamin D, 275, 579 IU/kg vitamin E, 24, 683 mg/kg vitamin K, 10,441 mg/kg biotin, 7,976 mg/kg folic acid, 195,778 mg/kg niacin, 130,827 mg/kg D-pantothenic acid, 40,281 mg/kg riboflavin, 6,614 mg/kg thiamine, 6,612 mg/kg vitamin B6, 198.4 mg/kg vitamin B12, 1,667,000 mg/kg manganese, and 9,900 mg/kg selenium.

30
Table 2. Broiler growth performance results obtained during the starter phase (d0-16)1
CON ANTI MEOD MEO500 MEO250 Pooled SEM
P-value
Weight (g)
Day 0 38.4 38.3 38.3 38.2 38.2 0.30 0.99
Day 17 494b 543
a 525
a,b 521
a,b 545
a 8.40 0.0003
ADG (g) 26.8b 29.7
a 28.6
a,b 28.4
a,b 29.8
a 0.50 0.0003
ADFI (g) 38.3 38.7 39.3 38.2 39.5 0.69 0.34
F:G 1.42a 1.30
b 1.37
a,b 1.34
b 1.31
b 0.02 0.0001
1Experimental diets were fed in the starter phase as follows: corn-soybean meal basal diet (CON), CON diet with BMD®50/Coban®90 added at 55/121 mg/kg (ANTI), CON+MEO added at 375 mg/kg (MEOD), CON+MEO added at 500 mg/kg (MEO500), and CON+MEO added at 250 mg/kg (MEO250). MEO = Ralco’s Microfused™ Essential Oils. a,b Values with different superscripts indicate a significant difference within rows (P ≤ 0.05).

31
Table 3. Broiler growth performance results obtained during the grower phase (d17-27)1
CON ANTI MEOD MEO500 MEO250
Pooled SEM
P-value
Weight d28 (g) 1400
b 1486
a 1441
a,b 1440
a,b 1476
a 18.74 0.001
ADG (g) 82.0b 85.4
a 83.0
a,b 83.2
a,b 84.3
a,b 0.99 0.04
ADFI (g) 120y 124
x,y 123
x,y 123
x,y 125
x 1.65 0.09
F:G 1.46a,b
1.46b 1.49
a,b 1.49
a,b 1.50
a 0.01 0.01
1 Experimental diets were fed in the grower phase as follows: corn-soybean meal basal diet (CON), CON+BMD®50/Coban®90 at 250/550 mg/kg (ANTI), CON+MEO added at 250 mg/kg (MEOD), CON+MEO at 500 mg/kg (MEO500), and CON+MEO at 250 mg/kg (MEO250). MEO = Ralco’s Microfused™ Essential Oils a,b Values with different superscripts indicate a significant difference within rows (P ≤ 0.05). x,y Values with different superscripts indicate a tendency to be significantly different within rows (P ≤ 0.1).

32
Table 4. Broiler growth performance results obtained during the finisher phase (d28-34)1
CON ANTI MEOD MEO500 MEO250 Pooled SEM
P-value
Weight d35 (g) 1966
b 2071
a 2023
a,b 2011
a,b 2055
a 19.75 0.003
ADG (g) 82.0 84.8 84.3 82.8 83.9 1.81 0.66
ADFI (g) 165 170 174 169 178 3.86 0.14
F:G 2.00 2.01 2.05 2.03 2.12 0.05 0.27
1 Experimental diets were fed in the finisher phase as follows: corn-soybean meal basal diet (CON), CON+BMD®50/Coban®90 at 250/495 mg/kg (ANTI), CON+MEO at 125 mg/kg (MEOD), CON+MEO at 500 mg/kg (MEO500), and CON+MEO at 250 mg/kg (MEO250). MEO = Ralco’s Microfused™ Essential Oils a,b Values with different superscripts indicate a significant difference within rows (P ≤ 0.05).

33
Table 5. Broiler growth performance results obtained during the withdrawal phase (d35-
41)1
CON ANTI MEOD MEO500 MEO250 Pooled SEM
P-value
Weight d41 (g) 2552
y 2617
x,y 2591
x,y 2572
x,y 2646
x 26.05 0.08
ADG (g) 96.7 90.4 94.9 93.4 97.3 2.41 0.20
ADFI (g) 179 180 179 183 183 2.87 0.74
F:G 1.87 1.98 1.86 1.98 1.86 0.03 0.02
1Experimental diets were fed in the withdrawal phase as follows: corn-soybean meal basal diet (CON), CON+BMD®50/Coban®90 at 0 mg/kg (ANTI), CON+MEO at 100 mg/kg (MEOD), CON+MEO at 500 mg/kg (MEO500), and CON+MEO at 250 mg/kg (MEO250). MEO = Ralco’s Microfused™ Essential Oils. x,y Values with different superscripts indicate a tendency to be significantly different within rows (P ≤ 0.1).

34
Table 6. Broiler growth performance results overall for the entire experimental period
(d0-41)1
CON ANTI MEOD MEO500 MEO250 Pooled SEM
P-value
ADG (g) 61.3y 62.9
x,y 62.2
x,y 61.8
x,y 63.6
x 0.63 0.08
ADFI (g) 98.9 102 102 101 103 1.33 0.13
F:G 1.61 1.62 1.65 1.64 1.63 0.02 0.69
1Experimental diets were fed as follows: a corn-soybean meal basal diet (CON), the CON diet with BMD®50/Coban®90 added at 55/121, 250/550, 250/495 and 0 mg/kg in the starter, grower, finisher, and withdrawal phase, respectively (ANTI), CON+MEO at 375, 250, 125, and 100 mg/kg added in the starter grower, finisher, and withdrawal phase, respectively (MEOD), CON+MEO added at 500 mg/kg in all phases (MEO500), and CON+MEO added at 250 mg/kg in all phases (MEO250). MEO = Ralco’s Microfused™ Essential Oils. Broilers were fed starter from d0-16, grower from d17-27, finisher from d28-34, and withdrawal from d35-41. x,y Values with different superscripts indicate a tendency to be significantly different within rows (P ≤ 0.1).

35
Table 7. Measurements of villus height, crypt depth, and VH:CD1 ratio of the jejunum
from broilers collected on d142
CON ANTI MEOD MEO500 MEO250
Pooled SEM
P-value
Villus Height (µm)
774.4x,y
752.1x,y
806.6x 716.4
y 800.6
x,y 27.7 0.09
Crypt Depth (µm)
103.0 100.7 111.8 108.7 103.4 4.9 0.42
VH:CD2 8.01 7.93 7.95 7.07 8.27 0.36 0.12
1Experimental diets were fed in the starter phase as follows (d0-16): corn-soybean meal basal diet (CON), CON diet with BMD®50/Coban®90 added at 55/121 mg/kg (ANTI), CON+MEO added at 375 mg/kg (MEOD), CON+MEO added at 500 mg/kg (MEO500), and CON+MEO added at 250 mg/kg (MEO250). MEO = Ralco’s Microfused™ Essential Oils 2VH=villus height; CD=crypt depth x,y Values with different superscripts indicate a tendency to be significantly different within rows (P ≤ 0.1).

36
Table 8. Treatment averages for pH, L*, a*, and b* color values of raw whole chicken
breasts stored in an illuminated refrigerator for seven days1
CON ANTI MEOD MEO500 MEO250 Pooled SEM
P-value
pH 6.08 6.04 6.04 6.07 6.08 0.027 0.54
L* 60.17c 61.97
a 59.96
c 61.32
b 61.72
a,b 0.12 < 0.0001
a* 9.97b,c 9.19d 10.44a 10.09c 9.67b 0.079 < 0.0001
b* 12.60a 11.82c,d 12.23b 12.10c,b 11.74d 0.094 < 0.0001 1Experimental diets were fed as follows: a corn-soybean meal basal diet (CON), the CON diet with BMD®50/Coban®90 added at 55/121, 250/550, 250/495 and 0 mg/kg in the starter, grower, finisher, and withdrawal phase, respectively (ANTI), CON+MEO at 375, 250, 125, and 100 mg/kg added in the starter grower, finisher, and withdrawal phase, respectively (MEOD), CON+MEO added at 500 mg/kg in all phases (MEO500), and CON+MEO added at 250 mg/kg in all phases (MEO250). MEO = Ralco’s Microfused™ Essential Oils. Broilers were fed starter from d0-16, grower from d17-27, finisher from d28-34, and withdrawal from d35-41. a,b,c,d Values with different superscripts indicate a significant difference within rows (P ≤ 0.05).

37
FIGURE 1. L* color value of raw whole chicken breasts stored in an illuminated
refrigerator as an average of all treatments on day 0, 1, 2, 3, 4, 5, 6, and 7 (P < 0.0001)1
1Experimental diets were fed as follows: a corn-soybean meal basal diet (CON), the CON diet with BMD®50/Coban®90 added at 55/121, 250/550, 250/495 and 0 mg/kg in the starter, grower, finisher, and withdrawal phase, respectively (ANTI), CON+MEO at 375, 250, 125, and 100 mg/kg added in the starter grower, finisher, and withdrawal phase, respectively (MEOD), CON+MEO added at 500 mg/kg in all phases (MEO500), and CON+MEO added at 250 mg/kg in all phases (MEO250). MEO = Ralco’s Microfused™ Essential Oils. Broilers were fed starter from d0-16, grower from d17-27, finisher from d28-34, and withdrawal from d35-41. a,b,c Values with different superscripts indicate a significant difference (P ≤ 0.05).
58
58.5
59
59.5
60
60.5
61
61.5
62
62.5
0 1 2 3 4 5 6 7
L*
Val
ue
Day
a a
b
c
b
c c
b

38
FIGURE 2. a*color values of raw whole chicken breasts stored in an illuminated
refrigerator as an average of all treatments on day 0, 1, 2, 3, 4, 5, 6, and 7 (P < 0.0001)1
1Experimental diets were fed as follows: a corn-soybean meal basal diet (CON), the CON diet with BMD®50/Coban®90 added at 55/121, 250/550, 250/495 and 0 mg/kg in the starter, grower, finisher, and withdrawal phase, respectively (ANTI), CON+MEO at 375, 250, 125, and 100 mg/kg added in the starter grower, finisher, and withdrawal phase, respectively (MEOD), CON+MEO added at 500 mg/kg in all phases (MEO500), and CON+MEO added at 250 mg/kg in all phases (MEO250). MEO = Ralco’s Microfused™ Essential Oils. Broilers were fed starter from d0-16, grower from d17-27, finisher from d28-34, and withdrawal from d35-41. a,b,c,d,e,f Values with different superscripts indicate a significant difference (P ≤ 0.05).
8
8.5
9
9.5
10
10.5
11
0 1 2 3 4 5 6 7
a* V
alue
Day
d,e
a,b,c
a
a,b,c,d a,b,c,d
e,f
e,f
f

39
FIGURE 3. b*color values of raw whole chicken breasts stored in an illuminated
refrigerator as an average of all treatments on day 0, 1, 2, 3, 4, 5, 6, and 7 (P ˂ 0.0001)1
1Experimental diets were fed as follows: a corn-soybean meal basal diet (CON), the CON diet with BMD®50/Coban®90 added at 55/121, 250/550, 250/495 and 0 mg/kg in the starter, grower, finisher, and withdrawal phase, respectively (ANTI), CON+MEO at 375, 250, 125, and 100 mg/kg added in the starter grower, finisher, and withdrawal phase, respectively (MEOD), CON+MEO added at 500 mg/kg in all phases (MEO500), and CON+MEO added at 250 mg/kg in all phases (MEO250). MEO = Ralco’s Microfused™ Essential Oils. Broilers were fed starter from d0-16, grower from d17-27, finisher from d28-34, and withdrawal from d35-41. a,b,c,d,e,f Values with different superscripts indicate a significant difference (P ≤ 0.05).
9
9.5
10
10.5
11
11.5
12
12.5
13
13.5
0 1 2 3 4 5 6 7
b* V
alue
Day
a a,b a,b a,b,c
b,c c,d
e
f

40
FIGURE 4. L*color values of raw ground chicken thighs stored in an illuminated
refrigerator on day 0, 1, 2, 3, 4, 5, 6, and 7 (SEM = 0.52; Treatment*Day P = 0.046)1
1Experimental diets were fed as follows: a corn-soybean meal basal diet (CON), the CON diet with BMD®50/Coban®90 added at 55/121, 250/550, 250/495 and 0 mg/kg in the starter, grower, finisher, and withdrawal phase, respectively (ANTI), CON+MEO at 375, 250, 125, and 100 mg/kg added in the starter grower, finisher, and withdrawal phase, respectively (MEOD), CON+MEO added at 500 mg/kg in all phases (MEO500), and CON+MEO added at 250 mg/kg in all phases (MEO250). MEO = Ralco’s Microfused™ Essential Oils. Broilers were fed starter from d0-16, grower from d17-27, finisher from d28-34, and withdrawal from d35-41.
58.5
59
59.5
60
60.5
61
61.5
0 1 2 3 4 5 6 7
L*
Val
ue
Day
CON
ANTI
MEOD
MEO500
MEO250
41
FIGURE 5. a* color values of raw ground chicken thighs stored in an illuminated
refrigerator on day 0, 1, 2, 3, 4, 5, 6, and 7 (SEM = 0.29; Treatment*Day P = 0.002)1
1Experimental diets were fed as follows: a corn-soybean meal basal diet (CON), the CON diet with BMD®50/Coban®90 added at 55/121, 250/550, 250/495 and 0 mg/kg in the starter, grower, finisher, and withdrawal phase, respectively (ANTI), CON+MEO at 375, 250, 125, and 100 mg/kg added in the starter grower, finisher, and withdrawal phase, respectively (MEOD), CON+MEO added at 500 mg/kg in all phases (MEO500), and CON+MEO added at 250 mg/kg in all phases (MEO250). MEO = Ralco’s Microfused™ Essential Oils. Broilers were fed starter from d0-16, grower from d17-27, finisher from d28-34, and withdrawal from d35-41.
13.5
14
14.5
15
15.5
16
16.5
0 1 2 3 4 5 6 7
a* V
alue
Day
CON
ANTI
MEOD
MEO500
MEO250

42
FIGURE 6. b* color values of raw ground chicken thighs stored in an illuminated
refrigerator on day 0, 1, 2, 3, 4, 5, 6, and 7 (SEM = 0.29; Treatment*Day P = 0.0006)1
1Experimental diets were fed as follows: a corn-soybean meal basal diet (CON), the CON diet with BMD®50/Coban®90 added at 55/121, 250/550, 250/495 and 0 mg/kg in the starter, grower, finisher, and withdrawal phase, respectively (ANTI), CON+MEO at 375, 250, 125, and 100 mg/kg added in the starter grower, finisher, and withdrawal phase, respectively (MEOD), CON+MEO added at 500 mg/kg in all phases (MEO500), and CON+MEO added at 250 mg/kg in all phases (MEO250). MEO = Ralco’s Microfused™ Essential Oils. Broilers were fed starter from d0-16, grower from d17-27, finisher from d28-34, and withdrawal from d35-41.
10
10.5
11
11.5
12
12.5
13
13.5
14
14.5
0 1 2 3 4 5 6 7
b* V
alue
Day
CON
ANTI
MEOD
MEO500
MEO250

43
FIGURE 7. Measured levels of malondialdehyde (MDA) per kg of wet tissue in raw
chicken breasts stored in an illuminated refrigerator for 7 days (A; SEM=0.08, P ˃ 0.05)
and in raw ground chicken thighs stored in an illuminated refrigerator for 1, 3, 5, or 7
days (B; SEM=0.06, Treatment*Day P = 0.01)1
1Experimental diets were fed as follows: a corn-soybean meal basal diet (CON), the CON diet with BMD®50/Coban®90 added at 55/121, 250/550, 250/495 and 0 mg/kg in the starter, grower, finisher, and withdrawal phase, respectively (ANTI), CON+MEO at 375, 250, 125, and 100 mg/kg added in the starter grower, finisher, and withdrawal phase, respectively (MEOD), CON+MEO added at 500 mg/kg in all phases (MEO500), and CON+MEO added at 250 mg/kg in all phases (MEO250). MEO = Ralco’s Microfused™ Essential Oils. Broilers were fed starter from d0-16, grower from d17-27, finisher from d28-34, and withdrawal from d35-41.
0
0.2
0.4
0.6
0.8
1
1.2
CON ANTI MEOD MEO500 MEO250
mg
MD
A/k
g T
issu
e
Treatment
0.3
0.5
0.7
0.9
1.1
1.3
1.5
1 3 5 7
mg
MD
A/k
g T
issu
e
Day
CON
ANTI
MEOD
MEO500
MEO250
A
B

44
4.0 IMMUNOLOGICAL RESPONSE AND AMINO ACID DIGESTIBILITY OF A
NOVEL SOYBEAN VARIETY LOW IN P34 PROTEIN, TRYPSIN INHIBITOR,
AND LECTINS FED TO WEANED PIGS
4.1 Abstract
An experiment was conducted to evaluate the feeding value of a soybean variety low in
trypsin inhibitor, P34, and lectins for weaned pigs and determine its effect on the pig’s
small intestine and immune system. A completely randomized block design with weaned
pigs housed in individual metabolism crates was used (n = 12 pigs/block; n = 3 blocks).
Pigs were randomly assigned to one of three diets: high casein-starch diet (CAS),
conventional soybean meal processed from locally grown soybeans-starch diet (CON),
and soybean meal processed from low allergenicity soybeans-starch diet (LA). Fecal
samples were collected on day 8 and 9 for analysis of total tract energy digestibility. On
day 10, pigs were euthanized and ileal segments were collected for measurement of villus
height, crypt depth, mast cell number, and expression of IL-4 and IL-10 mRNA. Ileal
digesta was collected to determine AID of amino acids using titanium dioxide as a
marker. There was no difference between weights on day 0 or 10, but CAS-fed pigs had
higher average daily gain compared to CON- and LA-fed pigs (0.103, -0.008, and 0.36 ±
0.014 g, respectively; P < 0.008). Additionally, CAS-fed pigs had higher ADFI over
CON-fed pigs (189.0 vs 127.7 ± 13.9 g; P ˂ 0.02) and LA-fed pigs performed
intermediate. CAS-fed pigs had a tendency for higher villus height than CON-fed (323.3
vs 278.0 ± 14.4 μm; P ˂ 0.08) and there were no differences in crypt depth or VH:CD.
Mast cells, IL-4, and IL-10 were unable to be quantified. CAS-fed pigs had greater
digestibility of ASP, THR, SER, GLU, PRO, ALA, VAL, MET, ILE, LEU, PHE, LYS,
HIS, ARG, and TYR (P < 0.03) versus LA-fed pigs and a tendency for increased total

45
tract energy digestibility (87.76 vs 82.98 ± 1.27%; P ˂ 0.07) versus the CON-fed pigs.
CON-fed pigs had AA digestibilities intermediate to CAS- and LA-fed pigs and LA-fed
pigs had fecal energy digestibility intermediate to CAS- and CON-fed pigs. The feeding
value of low allergenicity soybean meal is equivalent to conventional. No conclusion can
be made on the effect low allergenicity soybean meal on the immune system.
4.2 Introduction
Soybeans serve as an excellent source of amino acids for pigs and are therefore
commonly incorporated into swine diets as soybean meal. However, when fed to weaned
pigs that have not been exposed to soybean meal as a main component of the diet, it
causes a hypersensitivity reaction in the small intestine, a systemic allergic reaction, and
reduced growth performance (Li et al., 1990; Sun et al., 2008b). Friesen et al. (2014)
demonstrated that the pig’s immune system has the capability to develop a tolerance to
the soy protein; therefore, feeding soybean meal to finisher pigs does not have a negative
impact.
Not only is an allergic response apparent in pigs, but it has been studied
extensively in humans as soybean is one of the eight major foods that are known to be
responsible for 90% of food allergies (L’Hocine and Boye, 2007). In addition to
allergenic components, soybeans also contain antinutritional factors, such as trypsin
inhibitor, tannins, and phytate that cause decreased digestibility by rendering other
nutrients indigestible (Zhou et al., 2010; Adeyemo and Onilude, 2013).
A novel soybean was recently bred to contain significantly reduced levels of
Kunitz trypsin inhibitor, soybean agglutinin (lectin), and Gly m Bd 28 K (P34) through
the use of recessive alleles (Schmidt et al., 2015). Removal of the trypsin inhibitor and

46
P34 could potentially result in increased digestibility of the soybean meal, especially
amino acids since trypsin inhibitor inhibits protein breakdown. Furthermore, P34 is a
major allergenic protein known to cause soybean sensitivity in humans, especially
neonates (L’Hocine and Boye, 2007; Schmidt et al., 2015). Therefore, the objective of
the study was to determine amino acid digestibilities, gut health, and immunological
response of weaned pigs fed a diet containing soybean meal processed from low
allergenicity soybeans.
4.3 Materials and Methods
Experimental Design, Diets, and Animal Housing
The experiment was a Completely Randomized Block design using 12 metabolism crates
and three replications with a total of 36 weaned pigs used. Maternal line gilts (6.98 ±
0.24 kg) weaned at 19 days of age were used. On the morning of day 0 for each block,
12 weaned pigs were transported 150 km to the research facility and weighed prior to
being placed into individual metabolism pens. Pigs were randomly assigned to treatment
and each placed in a raised pen equipped with an individual feeder, nipple drinker, visual
access to another pig, 0.77 square meters per pig, and an individual heat lamp. Room
temperature was maintained at 28.5°C. Block 1 pigs required metaphylactic treatment
with Baytril® due to coughing upon arrival. The three dietary treatments (Table 9)
consisted of different sources of protein: a high casein-starch diet (CAS), conventional
soybean meal processed from locally grown soybeans-starch diet (CON), and LA
soybean meal processed from low allergenicity soybeans-starch diet (LA; Schmidt et al.,
2015). Pigs were fed their respective diets twice a day until the evening of day 9, when
all feed was removed. During each feeding, pigs were fed slightly more than they were

47
expected to eat to try and achieve ad libitum feed intake. Intake as measured by
disappearance of feed was determined daily. Four hours prior to being weighed and
humanely euthanized using a captive bolt gun on the morning of day 10, each pig was
offered 150g of feed to ensure appearance of digesta in the ileum during collection. Feed
offerings were staggered to ensure that every pig had access to feed exactly four hours
prior to being euthanized.
Soybeans were processed at the Northern Crops Institute in Fargo, ND in a micro-
solvent extraction plant. Following cracking, the soybeans were heated to 79°C for 20
minutes and then flaked. Soy oil was removed from the flakes via hexane extraction.
Following oil extraction, the defatted flakes were held at 110°C for 15 minutes to
evaporate off the solvent and the hulls were added back prior to the final grinding process
to obtain 46.5% crude protein. Once processing was complete, the soybean meals were
used in the mixing of experimental diets (Table 9). All diets were formulated to be at
90% or greater than nutrient requirements according to the NRC (2012), with the
exception of cysteine because it was not added as a synthetic amino acid. Cysteine was
included at 60% of the requirement in the soybean meal diets and 23% of the requirement
in the casein diet. Diets also contained 0.3% titanium oxide as a marker for analysis of
digestibility. Samples of all experimental diets were sent to the University of Missouri
(Columbia, MO) for analysis of amino acids (AOAC Official Method 982.30), crude
protein (Combustion Analysis (LECO) AOAC Official Method 990.03), crude fat (By
Ether Extraction, AOAC Official Method 920.39), crude fiber (AOAC Official Method
978.10), and ash (AOAC Official Method 942.05; Table 10). A Parr 1261 bomb
calorimeter was used to measure the gross energy content of the diets using the protocol

48
recommended in the Parr manual (Parr Instrument Company, Moline, IL; Table 10).
Additionally, all diets were sent to Eurofins Nutrition Analysis Center in Des Moines, IA
for analysis of trypsin inhibitor, urease activity, and potassium hydroxide solubility
(Table 10).
Histology
Following euthanasia, a 5 cm section of the ileum from each pig beginning 5 cm
proximal to the ileocecal junction was collected and placed into 10% formalin for
histological assessment. Slides were prepared and stained with haematoxylin and eosin
at a commercial pathology diagnostics lab (Animal Disease Research and Diagnostic
Laboratory (ADRDL), Brookings, SD). Villus height and crypt depth was measured
using a Nikon microscope (Tokyo, Japan) equipped with a DS2MV Nikon camera
(Tokyo, Japan) and NIS Elements software (Tokyo, Japan). Twenty five (5 sections of 5
villi each) villi and crypt measurements were planned to be taken for each slide, but due
to unexpected damaged, villi measurements were taken on all viable villus and the crypt
associated with each villi. The villus height:crypt depth ratio was calculated. Another
set of slides were also prepared by ADRDL and stained using toluidine blue for mast cell
counts (Sun et al., 2008a).
Gene Expression
A 10 cm section of the ileum was collected for analysis of gene expression starting at 10
cm proximal to the ileocecal junction. Samples were immediately placed in a tin foil
pack and placed in liquid nitrogen. Following collections, the ileal samples were stored at
-80°C. RNA was extracted using the protocol from Molecular Research Center, Inc.
(MRC) for TRI Reagent® (TR 118). Bromochloropropane (MRC, BP-100) was used to

49
separate the homogenate into phases, and nuclease-free water was used to solubilize the
RNA. Following RNA extraction, 260/280 ratio and concentration of RNA was
determined using a Nano Drop 2000 spectrophotometer (Thermo Scientific). The RNA
underwent DNAse treatment using the TURBO DNA-free™ protocol from Ambion®
(AM1907). cDNA was then created from the RNA using a 100µL reaction as prepared
by the protocol provided by Applied Biosystems® (4368813) and the MyCycler™ thermal
cycler from Bio-Rad. Prior to plating, primers (Table 11) were used to create individual
SYBR® Green master mixes containing a 300 nm concentration of forward and reverse
primer (Qiagen, 204145). Also, 15 µL from each sample was pooled to create a cDNA
master mix to ensure proper amplification of primer sets. Each plate well contained 4 µL
of cDNA master mix and 21 µL of SYBR® Green master mix. Dilutions of cDNA of
16X, 8X, 4X, 2X, and 1X were used as standards. Plates were read and underwent 40
thermal cycles of 30 seconds at 95°C, 1 minute at 55°C, and 1 min at 72°C using Agilent
Technologies Stratagene Mx300SP.
Digestibility
Fecal matter was collected on days 8 and 9 by collection of all freshly voided
feces from the pen or rectal palpation where required. Some pigs were unable to be
collected due to diarrhea. All samples were stored away from light and freeze dried in
the Dura-Dry™ MP Microprocessor Control Corrosion Resistant Freeze Dryer by FTS
Systems. Additionally, digesta contents from the small intestine were collected
immediately after euthanasia on day 10 from 92 cm of the small intestine beginning at 20
cm proximal from the ileocecal junction. Digesta contents were placed into 20 mL glass
jars and stored at -20°C. Prior to freeze drying, contents were transferred into a plastic

50
specimen cup. Once dried, samples were stored away from light in plastic specimen cups
at room temperature. Ileal digesta, fecal matter, and diets were analyzed for titanium
concentration.
Additionally, ileal digesta and diets were sent to the University of Missouri
(Columbia, MO) for analysis of total amino acids (AOAC Official Method 982.30). The
apparent ileal digestibility of amino acids and total tract energy digestibility was
calculated using the indigestible marker method as reported by Stein et al. (2007). Energy
content of fecal matter was obtained using bomb calorimetry (Parr 1261).
For analysis of titanium dioxide, 0.5 g of ileal sample, 0.3 g of fecal sample, and 5
g of feed sample were used. Samples were ashed in the Isotemp™ Programmable Muffle
Furnace by Fischer Scientific at 525°C for 10 hours, rising 5°C per minute. Feed samples
were sub-sampled into 0.04 g of ash in duplicates. Ash residue was acid digested with 0.8
g anhydrous sodium sulphate and 5 ml concentrated sulphuric acid for 24.5 hours at
120°C (Fischer Chemical, 5421-1; UN1830). Samples were diluted to 100 ml with
double distilled water, inverted 11 times, and filtered using Whatman No.1 filter paper.
For the color reaction, 5 ml of filtered sample was mixed with 0.2 ml of 30% hydrogen
peroxide (Fischer Chemical, H325-500). Standards were used at concentrations of 0,
0.06, 0.12, 0.18, 0.24, and 0.3 mg/ml titanium dioxide and plates were read at least 15
minutes after the addition of hydrogen peroxide at 408 nm using the Molecular Devices
SpectraMAX 190.
Statistical Analysis
All statistical analysis was performed using the PROC MIXED procedure of SAS
(Version 9.3, SAS Inst. Inc., Cary, NC). A completely randomized block design was

51
used with pig as the experimental unit. Pig nested within block and treatment was the
random variable. Tukey’s adjustment for means separation was used where main effect of
treatment was significant. Differences were considered significant when the P-value ≤
0.05 and a tendency for significance when the P-value ≤ 0.10.
4.4 Results
Diets
Urease activity was negligible in the CAS diet and the soybean meal diets had similar
activity (Table 10). Protein solubility was close to 100% for all diets. As expected, the
CAS diet had minimal trypsin inhibitor and the LA diet had 61% lower trypsin inhibitor
than the CON diet.
Growth Performance
All growth performance parameters are shown in Table 12. There were no differences
among weights on day 0 or 10. However, CAS-fed pigs had significantly higher average
daily gain compared to CON and LA-fed pigs (P < 0.008). The CON-fed pigs gained no
weight over the experimental period. Additionally, the CAS-fed pigs had significantly
higher ADFI over CON-fed pigs (P ˂ 0.02) and LA-fed pigs performed intermediate to
CAS- and CON-fed.
Histology
The CAS-fed pigs had a tendency for higher villus height than CON-fed (P ˂ 0.08) and
LA-fed pigs performed intermediate to CAS- and CON-fed. There were no differences in
crypt depth or VH:CD among treatments (Table 12). Unfortunately, minimal to no mast
cells were located in the ileum, so an assessment of mast cell numbers was not possible.
Gene Expression

52
Expression of the house keeping gene β-actin was successful as shown by appropriate
amplification and an acceptable dissociation curve. However, minimal to no expression
and an unacceptable dissociation curve was obtained for HPRT, IL-4, and IL-10. More
than one set of primers as well as different concentrations and volumes of cDNA were
used to try and obtain expression for IL-4 and IL-10, but attempts were unsuccessful.
Therefore, we were unable to evaluate cytokine gene expression.
Digestibility
CAS-fed pigs had greater AA digestibility than LA-fed pigs for ASP, THR, SER, GLU,
PRO, GLY, ALA, CYS, VAL, MET, ILE, LEU, PHE, LYS, HIS, ARG, and TYR (P ˂
0.03; Table 13). CAS-fed pigs had a tendency for greater glycine digestibility over LA-
fed (P ˂ 0.09; Table 13). There were no differences in the digestibility of cysteine among
treatments. Additionally, there were no differences in ileal amino acid digestibilities
between CON-fed and LA-fed pigs. A simple T-test was performed to determine if there
was a difference in the content of apparent ileal digestible amino acids (g/kg) in CON
soybean meal as compared to LA soybean meal. There were no differences for any
amino acids except methionine and arginine. LA soybean meal was higher in digestible
methionine and had a tendency to be higher in digestible arginine. Finally, CAS-fed pigs
had a tendency for greater fecal energy digestibility over CON-fed pigs (P ˂ 0.07) with
LA pigs being intermediate (Table 13).
4.5 Discussion
The objective of the experiment was to determine amino acid digestibility, gut health,
and immunological response of weaned pigs fed a diet containing soybean meal
processed from low allergenicity soybeans. Analysis of the CAS, CON, and LA diets
indicated that CAS should have the greatest quality protein and CON should have the

53
lowest protein quality with LA intermediate in quality based on trypsin inhibitor
concentrations and protein solubility (Table 10). Trypsin inhibitor is an antinutritional
factor that inhibits protein breakdown, so the lower levels of LA in the diet should result
in increased digestibility of amino acids. Parsons et al. (1991) concluded that increased in
vitro protein solubility can be linked to increased in vivo protein quality. Therefore, this
suggests that LA soybean meal was of greater quality than CON soybean meal. There
was minimal difference in the urease activity between the soybean meals.
For growth performance, there was no difference observed in pig weights at day 0
and 10. However, there was a difference in ADG, with CAS-fed pigs having increased
gain compared the soybean meal treatments (Table 12). Furthermore, the CON-fed pigs,
on average, did not gain weight throughout the experimental period of 10 days. This is
more than likely due to the decreased ADFI as compared to the other treatments
throughout the experimental period. Furthermore, the CON-fed pigs were the most
difficult to get to consume feed after weaning. Furthermore, the increase in villus height
of the CAS-fed pigs compared to the CON-fed indicates that CAS-fed pigs had superior
gut health and greater villus surface area for nutrient absorption (Shen et al., 2014).
Although it was expected to see a fair amount of mast cells, there were very few found
per slide. Sun et al. (2008a) reported to have found anywhere from 12 to 47 mast
cells/mm2 in all segments of the small intestine with the number of mast cells increasing
with increased glycinin intake. The results of the RT-PCR on IL-4 and IL-10 showed
minimal to no expression of the mRNA for the interleukins in the small intestine. Sun et
al. (2008b) were able to measure concentrations of IL-4 and IL-6 in the jejunum mucosa
of pigs, but they did not analyze the expression of the mRNA for these interleukins, as

54
performed in this experiment. Sun et al. (2008a) were also able to quantify levels of IL-4
and IL-10 in the blood serum of pigs.
CAS-fed pigs had significantly greater AID of almost all amino acids than the
LA-fed pigs. No differences were noted between CAS and CON-fed pigs, although
digestibility values were numerically greater for CAS-fed pigs than CON-fed for all
amino acids. An increase in the AID of amino acids was expected for the LA-fed pigs as
compared to the CON-fed pigs; however, this was not observed in this trial. Although
there was no statistical difference between the two soybean meal treatments, the LA-fed
were numerically lower in digestibility of all amino acids. However, it is also important
to note that digestibility is not equivalent to the bioavailability of the amino acids to the
animal (Stein et al., 2007). Furthermore, there are many factors such as feed intake,
amino acid content of feedstuff, and presence of antinutritional factors that can affect
endogenous loss of amino acids, which in turn, affects AID values (Stein et al., 2007).
With respect to fecal energy digestibility, the tendency for an increase in total tract
energy digestibility of the CAS-fed pigs over CON-fed could be because the energy
contained in the diet was more digestible or because the increase in villus height resulted
in greater absorption of energetic compounds, therefore, resulting in greater digestibility.
Overall, the feeding value of low allergenicity soybean meal is equivalent to
conventional and there were no differences in growth performance between the soybean
meal treatments. No conclusion can be made on the effect of low allergenicity soybean
meal on the immune system.

55
Table 9. Calculated composition of experimental diets fed to weaned pigs that contain
different protein sources1
Ingredient, % CAS CON LA
Starch 35.73 30.94 30.94
Sugar 35.72 30.94 30.94
Solka-Floc® 5 0 0
Soybean Oil 1 1 1
Casein 17.8 5 5
TiO2 0.3 0.3 0.3
CON Soybean Meal 0 28 0
LA Soybean Meal 0 0 28
Lysine 0 0.13 0.13
Methionine 0.16 0.16 0.16
Threonine 0.04 0.03 0.03
Vitamin premix2 0.05 0.05 0.05
Mineral premix3 0.15 0.15 0.15
Dicalcium Phosphate 1.4 1.4 1.4
Limestone 0.85 0.9 0.9
MgSO4 0.1 0 0
NaHCO3 0.35 0.4 0.4
NaCl 0.65 0.6 0.6
KHCO3 0.7 0 0
Total 100 100 100 1Dietary treatments consisted of the following: a high casein-starch diet (CAS), conventional soybean meal processed from locally grown soybeans-starch diet (CON), and LA soybean meal processed from low allergenicity soybeans-starch diet (LA; Schmidt et al., 2015). 2Provided per kg of complete diet: 11,002 IU vitamin A supplement, 1651 IU vitamin D3 supplement, 55.1 IU vitamin E supplement, 0.044 mg vitamin B12 supplement, 4.4 mg menadione as menadione dimethylpyrimidinol bisulfite, 9.91 mg riboflavin supplement, 60.6 mg D-pantothenic acid as D-calcium, 55.1 mg niacin supplement, 1.1 mg folic acid, 3.3 mg pyridoxine as pyridoxine hydrochloride, 3.3 mg thiamine as thiamine mononitrate and 0.171 mg biotin. 3Provided per kg of the complete diet: 165 mg Zn as zinc sulfate, 165 mg Fe as ferrous sulfate, 43.5 mg Mn as manganese sulfate, 16.5 mg Cu as basic copper chloride, 0.36 mg I as ethylene diamine dihydriodide and 0.3 mg of Se as sodium selenite.

56
Table 10. Chemical analyses of experimental diets fed to weaned pigs and feedstuffs
used in the diets1
Experimental Diets Feedstuffs
Analysis CAS CON LA CAS CON LA
Crude Protein (%) 16.76 17.24 17.76 89.65 45.58 47.69
Crude Fat (%) 3.29 1.46 1.76 7.41 1.69 2.92
Crude Fiber (%) 2.17 1.61 1.57 0.12 5.77 6.38
Ash (%) 4.36 5.05 4.66 4.09 6.09 6.53
Aspartic Acid (%) 1.22 1.80 1.86 6.53 5.03 5.30
Threonine (%) 0.71 0.69 0.70 3.81 1.73 1.79
Serine (%) 0.84 0.80 0.82 4.49 2.02 2.10
Glutamic Acid (%) 3.64 3.32 3.55 19.53 7.98 8.69
Proline (%) 1.81 1.24 1.26 9.10 2.39 2.52
Glycine (%) 0.34 0.66 0.69 1.78 2.00 2.04
Alanine (%) 0.55 0.72 0.74 2.93 1.97 2.03
Cysteine (%) 0.10 0.21 0.22 0.47 0.68 0.69
Valine (%) 1.11 0.96 0.98 6.10 2.28 2.35
Methionine (%) 0.58 0.41 0.45 2.54 0.64 0.67
Isoleucine (%) 0.94 0.89 0.93 4.93 2.19 2.27
Leucine (%) 1.61 1.44 1.51 8.59 3.43 3.69
Phenylalanine (%) 0.80 0.90 0.94 4.52 2.29 2.46
Lysine (%) 1.37 1.36 1.33 7.33 2.97 3.06
Histidine (%) 0.47 0.47 0.49 2.60 1.17 1.25
Arginine (%) 0.59 1.06 1.12 3.34 3.16 3.46
Tyrosine (%) 0.78 0.65 0.66 5.00 1.61 1.61
Gross Energy (Cal/g) 4011 4038 4026
Urease Activity (pH rise)
0.02 1.79 1.82
Protein Solubility KOH (%)
100 96.73 98.75
Trypsin Inhibitor (TIU/g)
<1000 16,700 6,500
1Dietary treatments consisted of the following: a high casein-starch diet (CAS), conventional soybean meal processed from locally grown soybeans-starch diet (CON), and LA soybean meal processed from low allergenicity soybeans-starch diet (LA; Schmidt et al., 2015).

57
Table 11. Sequences of primers used for analysis of ileal cytokines of weaned pigs fed
different protein sources using RT-PCR.
Primer Sequence (5’ to 3’)
IL-4 Forward Set 2 CAACCCTGGTCTGCTTACTG
IL-4 Reverse Set 2 CTCCATGCACGAGTTCTTTCT
IL-4 Forward Set 3 AACACGACGGAGAAGGAAAC
IL-4 Reverse Set 3 TGGCTTCATGCACAGAACA
IL-4 Forward Set 4 TTCGGCACATCTACAGACAC
IL-4 Reverse Set 4 AGTGCTCTTCTTGGCTTCAT
IL-10 Forward Set 4 CTGATACCTCAGCTCCCATTTC
IL-10 Reverse Set 4 TTGAACACCATAGGGCACAC
β-Actin Forward TCGCCGACAGGATGCAGAAGGA
β-Actin Reverse AGGTGGACAGCGAGGCCAGGAT
HPRT Forward AATGGGACTCCAGATGTTTCC
HPRT Reverse GGCTATGCCCTTGACTACAAT

58
Table 12. Growth performance and small intestine health results of weaned pigs fed
different protein sources for ten days1
CAS CON LA
Pooled SEM
P-value
Weight d0 (kg) 6.78 7.17 6.99 0.24 0.54
Weight d10 (kg) 7.64 7.10 7.34 0.28 0.40
ADG (g) 0.103a -0.008b 0.036b 0.014 ˂0.0001
ADFI (g) 189.0a 127.7b 155.0a,b 13.9 0.01
Villus Height (µm) 323.3x 278.0y 298.3x,y 14.4 0.09
Crypt Depth (µm) 78.4 71.0 73.0 3.1 0.24
VH:CD 4.33 4.17 4.37 0.19 0.71 1Dietary treatments consisted of the following: a high casein-starch diet (CAS), conventional soybean meal processed from locally grown soybeans-starch diet (CON), and LA soybean meal processed from low allergenicity soybeans-starch diet (LA; Schmidt et al., 2015). 2VH=villus height; CD=crypt depth a,b Values with different superscripts of this type indicate a significant difference (P ≤ 0.05).

59
Table 13. Apparent ileal digestibility of amino acids and total tract energy digestibility
obtained from weaned pigs fed different protein sources for ten days1
% CAS CON LA Pooled SEM P-value
Asparagine 97.37a 91.17a,b 86.60b 2.60 0.02
Threonine 97.25a 90.44a,b 86.59b 2.74 0.03
Serine 97.70a 90.75a,b 86.44b 2.60 0.02
Glutamine 97.80a 92.60a,b 88.41b 2.25 0.02
Proline 98.44a 91.08a,b 85.01b 2.60 .005
Glycine 93.55x 86.32x,y 80.54y 4.13 0.10
Alanine 97.13a 90.50a,b 86.84b 2.52 0.02
Cysteine 93.53 86.02 79.89 4.59 0.12
Valine 98.27a 91.28a,b 87.69b 2.38 0.01
Methionine 99.34a 95.54a,b 94.15b 1.16 0.01
Isoleucine 98.49a 91.85a,b 88.27b 2.26 0.01
Leucine 98.76a 91.81a,b 88.18b 2.26 0.009
Phenylalanine 98.63a 91.96a,b 88.21b 2.17 0.008
Lysine 98.62a 93.37a,b 90.76b 1.61 0.006
Histidine 98.79a 92.43a,b 88.90b 2.12 0.009
Arginine 98.03a 91.43a,b 88.12b 2.19 0.01
Tyrosine 98.99a 92.61a,b 89.03b 2.16 0.01
Energy 87.76x 82.98y 83.56x,y 1.27 0.05 1Dietary treatments consisted of the following: a high casein-starch diet (CAS), conventional soybean meal processed from locally grown soybeans-starch diet (CON), and LA soybean meal processed from low allergenicity soybeans-starch diet (LA; Schmidt et al., 2015). a,b Values with different superscripts of this type indicate a significant difference (P ≤ 0.05). x,y Values with different superscripts of this type indicate a tendency to be significantly different (P ≤ 0.1).

60
5.0 GENERAL DISCUSSION
The overall objective of these two experiments was to determine if either a blend
of EOs that underwent a patented microfusion process or a novel soybean meal low in
allergenic compounds and anti-nutritional factors could serve as an alternative to
antibiotic use for the prevention of disease during times of high stress for monogastrics,
such as disease or weaning.
The MEO were compared directly against antibiotics in broilers that were under a
disease challenge. Parameters measured to determine if MEO could serve as an
alternative to the antibiotics were: effects on growth performance, jejunal histology, and
meat quality. It was observed that the MEO at 250 mg/kg was the most effective feeding
rate based on the results of the study. MEO250-fed broilers performed similarly to
ANTI-fed in regards to both feed and growth performance. However, the experiment
should be completed with the proper level of antibiotics in the starter phase in order to
obtain results that are more applicable to commercial production. If the antibiotics would
have been included at the appropriate inclusion rate in the starter, it would have been
expected for the ANTI-fed broilers to have better performance than what was observed.
In order to obtain a better understanding of the mechanism of the EOs, more research
should be performed on oocyst counts. The oocyst counts accurately reflected the
intensity of the disease challenge, but not enough individual pen samples were obtained
to determine differences in oocyst counts between treatments. This may lead us to
understand if this blend of EOs has an anticoccidial effect. Furthermore, it was expected
that if a treatment had increased gut health, they in turn, would also have increased
growth performance due to increases in nutrient absorption. However, there were no

61
differences in villus height or crypt depth. Since this is a subjective measurement, the
tendency for MEOD-fed to have increased villus height over MEO500-fed could be
negligible. Finally, the effect of the EOs post mortem was apparent in the meat quality
results. Although they did not have an impact on pH, MEO lowered lipid oxidation in the
ground thighs on day 5 and 7 of storage and had an impact on the color over time. This
also meets the objective of the experiment because MEO250-fed performed similarly to
ANTI-fed broilers. However, to further ensure customer satisfaction of meat products
from broilers fed MEO, a trained panel should be used to determine if there are any
differences in odor or flavor. Further research is also warranted to determine how EOs
have the ability to affect meat quality when fed through the diet; whether it is a direct
effect of the essential oils or an increase in the compounds that combat oxidation, such as
vitamin E.
The results of the novel soybean study were not as concise and clear as the MEO
study, but that could be due difficultly getting piglets to eat the feed and individual
housing. Another larger scale study should be performed on group housed pigs with
either the same or increased number of replications in order to determine if significant
differences between the two soybean meals would occur. Individually housed pigs are not
in a “normal” environment as pigs like to socialize with each other. It is difficult to
determine if the LA soybean meal could serve an alternative to antibiotics because there
were no differences between soybean meal treatments and there were no pigs that
received in-feed antibiotics. Furthermore, more research needs to be performed to
determine if the numerically increased amino acid digestibilities for CON-fed pigs over
LA-fed pigs would be consistent. Finally, the effect of LA soybeans on immune response

62
is also difficult to determine due to difficulties in methodologies. Once accurate immune
response results are obtained, they may be able to be extrapolated into the human health
sector. A positive impact on the immune system would suggest that the LA soybean meal
could serve as an alternative to antibiotics. Additionally, serum IgG should also be
analyzed to determine if there is a systemic response to the soybean meals.
Overall, the feed additive was more effective at serving as an alternative to
preventative antibiotics in the feed. With further research, it may be possible to prove
that LA soybean meal in weaned pigs diets could serve as an alternative to antibiotics by
increasing the health of the animal during a time of increased stress and imminent disease
threat.

63
6.0 REERENCES
Adeyemo, S., and A. Onilude. 2013. Enzymatic reduction of anti-nutritional factors in
fermenting soybeans by Lactobacillus plantarum isolates from fermenting
cereals. Nigerian Food Journal 31:84–90.
Al-Hijazeen, M., E. Lee, A. Mendonca, and D. Ahn. 2016. Effect of oregano essential oil
(Origanum vulgare subsp. hirtum) on the storage stability and quality parameters
of ground chicken breast meat. Antioxidants 5:18.
Alp, M., M. Midilli, N. Kocaba L , H. Y Lmaz, N. Turan, A. Garg L , and N. Acar. 2012.
The effects of dietary oregano essential oil on live performance, carcass yield,
serum immunoglobulin G level, and oocyst count in broilers. The Journal of
Applied Poultry Research 21:630–636.
Bagal, V. L., V. K. Khatta, B. S. Tewatia, S. K. Sangwan, and S. S. Raut. 2016. Relative
efficacy of organic acids and antibiotics as growth promoters in broiler chicken.
Veterinary World 9:377–382.
Bailey, M., K. Haverson, C. Inman, C. Harris, P. Jones, G. Corfield, B. Miller, and C.
Stokes. 2005. The development of the mucosal immune system pre- and post-
weaning: balancing regulatory and effector function. Proceedings of the Nutrition
Society 64:451–457.
Bakker, G., R. Dekker, R. Jongbloed, and A. Jongbloed. 1998. Non‐starch
polysaccharides in pig feeding. Veterinary Quarterly 20:59–64.
Basmacioglu, H., Ö. Tokuşoǧlu, and M. Ergul. (2004). The effect of oregano and
rosemary essential oils or alpha-tocopheryl acetate on performance and lipid
oxidation of meat enriched with n-3 PUFA'S in broilers. South African Journal Of
Animal Science 34:197-210.

64
Basmacioğlu-Malayoğlu, H., O. Özdemir, and H. Bağriyanik. 2016. Influence of an
organic acid blend and essential oil blend, individually or in combination, on
growth performance, carcass parameters, apparent digestibility, intestinal
microflora and intestinal morphology of broilers. British Poultry Science
57(2):227-34.
Blecha, F., D. S. Pollman, and D. A. Nichols. 1983. Weaning pigs at an early age
decreases cellular immunity. Journal of Animal Science 56:396.
Blikslager, A. (2010). Mucosal epithelial barrier repair to maintain pig health. Livestock
Science 133(1):194-199.
Brenes, A., and E. Roura. 2010. Essential oils in poultry nutrition: Main effects and
modes of action. Animal Feed Science and Technology 158:1–14.
Botsoglou, N., E. Christaki, D. Fletouris, P. Florou-Paneri, and A. Spais. 2002. The effect
of dietary oregano essential oil on lipid oxidation in raw and cooked chicken
during refrigerated storage. Meat Science 62:259–265.
Cervantes-Pahm, S., and H. Stein (2010). Ileal digestibility of amino acids in
conventional, fermented, and enzyme-treated soybean meal and in soy protein
isolate, fish meal, and casein fed to weanling pigs. Journal of Animal Science.
88(8):2674-83.
Chirila, F., A. Tabaran, N. Fit, G. Nadas, M. Mihaiu, F. Tabaran, C. Cătoi, O. L. Reget,
and S. D. Dan. 2017. Concerning increase in antimicrobial resistance in shiga
toxin-producing Escherichia coli isolated from young animals during 1980–2016.
Microbes and Environments Microbes and environments 32:252–259.

65
Christaki, E., P. Florou-Paneri, I. Giannenas, M. Papazahariadou, N. Botsoglou, and A.B.
Spais. 2004. Effect of a mixture of herbal extracts on broiler chickens infected
with Eimeria tenella. Animal Res. 53:137-144.
Cromwell, G. L. 2002. Why And how antibiotics are used in swine production. Animal
Biotechnology 13:7–27.
Dankowiakowska, A., I. Kozlowska, and M. Bednarczyk. 2013. Probiotics, prebiotics
and synbiotics in poultry mode of action, limitation, and achievements. Journal of
Central European Agriculture 14:467–478.
Dunsford, B. R., D. A. Knabe, and W. E. Haensly. 1989. Effect of dietary soybean meal
on the microscopic anatomy of the small intestine in the early-weaned pig.
Journal of Animal Science 67:1855.
Economou, K.D., V. Oreopoulou, and C.D. Thomopoulos. 1991. Antioxidant properties
of some plant extracts of the Labiatae family. J. AM. Oil Chem. Soc. 68:109-
113.
Evans, J.W., M.S. Plunkett, and M.J. Bandfield. 2001. Effect of an essential oil blend on
coccidiosis in broiler chicks. Poultry Science 80:258 (abstract).
Ewaschuk, J. B., I. R. Johnson, K. L. Madsen, T. Vasanthan, R. Ball, and C. J. Field.
2012. Barley-derived beta-glucans increases gut permeability, ex vivo epithelial
cell binding to E. coli, and naive T-cell proportions in weanling pigs. Journal of
Animal Science 90:2652–2662.
Falaki, M., M. Shams Shargh, B. Dastar, S.R. Hashemi, and A.R. Sadeghi Mahoonak.
(2016). Growth performance, carcass characteristics and intestinal microflora of

66
broiler chickens fed diets containing Carum copticum essential oil. Poultry
Science Journal 4(1):37-46.
Friesen, K. G., R. D. Goodband, J. L. Nelssen, F. Blecha, D. N. Reddy, P. G. Reddy, and
L. J. Kats. 1993. The effect of pre- and postweaning exposure to soybean meal on
growth performance and on the immune response in the early-weaned pig. Journal
of Animal Science 71:2089.
Greco, M. V., M. L. Franchi, S. L. R. Golba, A. G. Pardo, and G. N. Pose. 2014.
Mycotoxins and mycotoxigenic fungi in poultry feed for food-producing animals.
The Scientific World Journal 2014:1–9.
Haenen, D., J. Zhang, C. S. D. Silva, G. Bosch, I. M. V. D. Meer, J. V. Arkel, J. J. G. C.
Van Den Borne, O. P. Gutierrez, H. Smidt, B. Kemp, M. Muller, and G. J. E. J.
Hooiveld. 2013. A diet high in resistant starch modulates microbiota composition,
SCFA concentrations, and gene expression in pig intestine. Journal of Nutrition
143:274–283.
Jacela, J. Y., J. M. Derouchey, M. D. Tokach, R. D. Goodband, J. L. Nelssen, D. G.
Renter, and S. S. Dritz. 2009. Feed additives for swine: Fact sheets – acidifiers
and antibiotics. Kansas Agricultural Experiment Station Research Reports:270–
275.
Jang, I.S., H.Y. Ko, S.Y. Kang, and C.Y. Lee. 2007. Effect of commercial essential oils
on growth performance, digestive enzyme activity and intestinal microflora
population in broiler chickens. Animal Feed Science Technology 134:305-315.

67
Khattak, F., Ronchi, A., Castelli, P., and Sparks, N. (2014). Effects of natural blend of
essential oil on growth performance, blood biochemistry, cecal morphology, and
carcass quality of broiler chickens. Poultry Science 93(1):132-137.
Kırkpınar, F., H. B. Ünlü, and G. Özdemir. 2011. Effects of oregano and garlic essential
oils on performance, carcase, organ and blood characteristics and intestinal
microflora of broilers. Livestock Science 137:219–225.
Kirkpinar, F., H. Ünlü, M. Serdaroğlu, and G. Turp. 2014. Effects of dietary oregano and
garlic essential oils on carcass characteristics, meat composition, colour, pH and
sensory quality of broiler meat. British Poultry Science 55:157–166.
Knarreborg, A., C. Lauridsen, R.M. Engberg, and S.K. Jensen. 2004. Dietary antibiotic
growth promoters enhance the bioavailability of α-tocopheryl acetate in broilers
by altering lipid absorption. Journal of Nutrition 134:1487-1492.
Lee, I. K., Y.C. Kye, G. Kim, H.W. Kim, M.J. Gu, J. Umboh, K. Maaruf, S.W. Kim, and
C.H. Yun. 2016. Stress, nutrition, and intestinal immune responses in pigs — a
review. Asian-Australasian Journal of Animal Sciences 29(8):1075–1082.
Lei M.G., R. Bassette, and G.R. Reeck. 1981. Effect of cysteine on heat inactivation of
soybean trypsin inhibitors [Retention of protein solubility]. Journal of
Agricultural and Food Chemistry 29(6):1196-1199.
L’Hocine, L., and J. I. Boye. 2007. Allergenicity of soybean: new developments in
identification of allergenic proteins, cross-reactivities and hypoallergenization
technologies. Critical Reviews in Food Science and Nutrition 47:127–143.

68
Li, D. F., J. L. Nelssen, P. G. Reddy, F. Blecha, J. D. Hancock, G. L. Allee, R. D.
Goodband, and R. D. Klemm. 1990. Transient hypersensitivity to soybean meal
in the early-weaned pig. Journal of Animal Science 68:1790.
Li, J., H. Hao, G. Cheng, C. Liu, S. Ahmed, M. A. B. Shabbir, H. I. Hussain, M. Dai, and
Z. Yuan. 2017. Microbial shifts in the intestinal microbiota of salmonella infected
chickens in response to Enrofloxacin. Frontiers in Microbiology 8:1711.
Li, S.Y., Y.J. Ru, M. Liu, B. Xu, A. Peron, and X.G. Shi. 2012. The effect of essential
oils on performance, immunity and gut microbial population in weaner pigs.
Livestock Science 145:119-23.
Luna, A., M. C. Labaque, J. A. Zygadlo, and R. H. Marin. 2010. Effects of thymol and
carvacrol feed supplementation on lipid oxidation in broiler meat. Poultry Science
89:366–370.
Mahmoodi Bardzardi, M., S. Ghazanfari, and S.D. Sharifi. 2014. Growth performance,
carcass characteristics, antibody titer and blood parameters in broiler chickens fed
dietary myrtle (Myrtus communis) essential oil as an alternative to antibiotic
growth promoter. Poultry Science Journal 2(1):37-49.
Manzanilla, E. G., M. Nofrarías, M. Anguita, M. Castillo, J. F. Perez, S. M. Martín-Orúe,
C. Kamel, and J. Gasa. 2006. Effects of butyrate, avilamycin, and a plant extract
combination on the intestinal equilibrium of early-weaned pigs. Journal of Animal
Science 84:2743.
Maraschiello, C., E. Esteve, and J.A. Garcia-Regueiro. 1998. Cholesterol oxidation in
meat from chicken fed alpha-tocopherol and beta-carotene-supplemented diets
with different unsaturation grades. Lipids 33:705-713.

69
Mathlouthi, N., T. Bouzaienne, I. Oueslati, F. Recoquillay, M. Hamdi, M. Urdaci, and R.
Bergaoui. 2011. Use of rosemary, oregano, and a commercial blend of essential
oils in broiler chickens: In vitro antimicrobial activities and effects on growth
performance. Journal of Animal Science 90:813–823.
Nutrient Requirements of Swine: 11th Revised Edition. 2012.
Oviedo-Rondón, E.O, M. E. Hume, C. Hernández, and S. Clemente-Hernández. 2006.
Intestinal microbial ecology of broilers vaccinated and challenged with
mixed Eimeria species, and supplemented with essential oil blends. Poultry
Science 85(5):854–860.
Parsons, C. M., K. Hashimoto, K. J. Wedekind, and D. H. Baker. 1991. Soybean protein
solubility in potassium hydroxide: an in vitro test of in vivo protein quality.
Journal of Animal Science 69:2918.
Peng, Q.Y., J.D. Li, Z. Li, Z.Y. Duan, and Y.P. Wu. 2016. Effects of dietary
supplementation with oregano essential oil on growth performance, carcass traits
and jejunal morphology in broiler chickens. Animal Feed Science and
Technology 214:148-153.
Platel, K., and Srinivasan, K. 2014. Digestive stimulant action of spices: a myth or
reality? Indian J. Med. Res. 119(5):167-79.
Proudfoot, K., and G. Habing. 2015. Social stress as a cause of diseases in farm animals:
Current knowledge and future directions. The Veterinary Journal 206:15–21.
Ranucci, D., D. Beghelli, M. Trabalza-Marinucci, R. Branciari, C. Forte, O. Olivieri, G.
B. Pazmay, C. Cavallucci, and G. Acuti. 2015. Dietary effects of a mix derived
from oregano (Origanum vulgare L.) essential oil and sweet chestnut (Castanea

70
sativa Mill.) wood extract on pig performance, oxidative status and pork quality
traits. Meat Science 100:319–326.
Salih, A. M., D. M. Smith, J. F. Price, and L. E. Dawson. 1987. Modified extraction 2-
thiobarbituric acid method for measuring lipid oxidation in poultry. Poultry
Science 66:1483–1488.
Schmidt, A. M., T. Hymowitz, and E. M. Herman. 2015. Breeding and characterization
of soybean Triple Null; a stack of recessive alleles of Kunitz trypsin inhibitor,
soybean agglutinin, and P34 allergen nulls. Plant Breeding 134:310-315.
Shen, Y. B., A. C. Weaver, and S. W. Kim. 2014. Effect of feed grade L-methionine on
growth performance and gut health in nursery pigs compared with conventional
DL-methionine. Journal of Animal Science 92:5530–5539.
Simitzis, P., G. Symeon, M. Charismiadou, J. Bizelis, and S. Deligeorgis. 2010. The
effects of dietary oregano oil supplementation on pig meat characteristics. Meat
Science 84:670–676.
Song, Y., V. Pérez, J. Pettigrew, C. Martinez-Villaluenga, and E. G. D. Mejia. 2010.
Fermentation of soybean meal and its inclusion in diets for newly weaned pigs
reduced diarrhea and measures of immunoreactivity in the plasma. Animal Feed
Science and Technology 159:41–49.
Stein, H.H., B. Seve, M.F. Fuller, P.J. Moughan, and C.F.M. de Lange. 2007. Invited
review: Amino acid bioavailability and digestibility in pig feed ingredients:
Terminology and application. Journal of Animal Science 85:172-180.

71
Sun, P., D. Li, Z. Li, B. Dong, and F. Wang. 2008a. Effects of glycinin on IgE-mediated
increase of mast cell numbers and histamine release in the small intestine. The
Journal of Nutritional Biochemistry 19:627–633.
Sun, P., D. Li, B. Dong, S. Qiao, and Z. Ma. 2008b. Effects of soybean glycinin on
performance and immune function in early weaned pigs. Archives of Animal
Nutrition 62(4):313-321.
Tarladgis, B.G., B.M. Watts, M.T. Younathan, and L.R. Dugan, Jr., 1960. A distillation
method for the quantitative determination of malondialdehyde in rancid flavor. J.
Am. Oil Chem. Soc. 37:44-48.
Tichivangana, J.Z. and P.A. Morrissey. 1985. Metmyoglobin and inorganic metals as pro-
oxidants in raw and cooked muscle systems. Meat Sci. 15:107-116.
Witte, V. C., G. F. Krause, and M. E. Bailey. 1970. A new extraction method for
determining 2-thiobarbituric acid values of pork and beef during storage. Journal
of Food Science 35:582–585.
Yanishlieva, V., and M. Marinova. 1995. Antioxidant activity of selected species of the
family Lamiaceae grown in Bulgaria. Nahrung 39:458-463.
Young, J., J. Stagsted, S. Jensen, A. Karlsson, and P. Henckel. 2003. Ascorbic acid,
alpha-tocopherol, and oregano supplements reduce stress-induced deterioration of
chicken meat quality. Poultry Science 82(8):1343-51.
Zeng, Z., S. Zhang, H. Wang, and X. Piao. 2015. Essential oil and aromatic plants as feed
additives in non-ruminant nutrition: a review. Journal of Animal Science and
Biotechnology 6:7.

72
Zhou, S. F., Z. W. Sun, L. Z. Ma, J. Y. Yu, C. S. Ma, and Y. J. Ru. 2010. Effect of
feeding enzymolytic soybean meal on performance, digestion and immunity of
weaned pigs. Asian-Australasian Journal of Animal Sciences. 24:103–109.