evaluating the phylogenetic structure an microstructural evolution...
TRANSCRIPT

Evaluating the phylogenetic structure and microstructural evolution of organellar
markers from both compartments in the reconstruction of a carboniferous
radiation (mosses)
Dissertation
zur
Erlangung des Doktorgrades (Dr. rer nat.)
der
Mathematisch-Naturwissenschaftlichen Fakultät
der
Rheinischen Friedrich-Wilhelms-Universität zu Bonn
vorgelegt von
Michael Krug
aus Rheinbach
Bonn 2017

Angefertigt mit Genehmigung der Mathematisch-Naturwissenschaftlichen
Fakultät der Rheinischen Friedrich-Wilhelms-Universität Bonn
1. Gutachter: Prof. Dr. Dietmar Quandt
2. Gutachter: Prof. Dr. Kai Müller
Tag der Promotion: 20.07.2017
Erscheinungsjahr: 2017

“The chicken is only an egg’s way for making another egg.”
- Richard Dawkins

Table of Contents
Chapter 1:..........................................................................................................................1
Cytoplasmic noncoding DNA: characteristics and utility in phylogenetics......................1Characteristics of the three genomes in plant cells.......................................................3
Nuclear DNA...........................................................................................................4Plastid DNA.............................................................................................................5Mitochondrial DNA.................................................................................................8
Moss phylogeny and the peristome.............................................................................11Phylogenetic structure measure..................................................................................15Insertions, Deletions, simple sequence repeats and inversions in organellar DNA....16
Chapter 2:........................................................................................................................19
Timing the branching order and radiation shifts of the major moss lineages..................19Resolving the backbone phylogeny of mosses: an organellar perspective.................191. Introduction.............................................................................................................202. Materials and Methods............................................................................................24
2.1 Taxon sampling and marker selection..............................................................242.2. DNA Isolation, Amplification & Sequencing.................................................252.3 Contig Assembly, Sequence Alignment & Indel Coding.................................252.4 Phylogenetic Inference.....................................................................................262.5 Topology testing...............................................................................................272.6 ILD, LRT: topology vs branch length congruence...........................................272.7 Tree editing and visualization..........................................................................282.8 Divergence dating with r8s and BEAST..........................................................282.9 Modelling speciation rate heterogeneity..........................................................29
3. Results.....................................................................................................................303.1.0 Alignments....................................................................................................303.1.1 Backbone phylogeny of mosses....................................................................313.1.2 Testing the congruence of plastid and mitochondrial data............................343.1.3. Topology tests..............................................................................................343.2 Divergence Dating............................................................................................353.3 BAMM Analyses..............................................................................................36
4. Discussion...............................................................................................................39Note on the controversy upon BAMM...................................................................45
Chapter 3: Phylogenetic structure (RC, RC,fix, RC,fix(S)) of organellar markers.................46Introduction.................................................................................................................46Material and Methods.................................................................................................49Results.........................................................................................................................53
Contrasting cp and mt markers..............................................................................54Contrasting noncoding and coding data from plastids and mitochondria and matK................................................................................................................................54Contrasting all three types of noncoding data from plastids and mitochondria:....56
Discussion...................................................................................................................59Conclusions:................................................................................................................61
I

Chapter 4: Microstructural evolution of organellar markers...........................................63Introduction.................................................................................................................64Material and Methods.................................................................................................68Results.........................................................................................................................70Discussion...................................................................................................................77
Summary..........................................................................................................................80
Acknowledgements.........................................................................................................86
References.......................................................................................................................87
Index to Figures.............................................................................................................112
Index of tables................................................................................................................115
Appendix........................................................................................................................117
II

Chapter 1:
Cytoplasmic noncoding DNA: characteristics and utility in
phylogenetics
Noncoding DNA represents a large fraction of genomes interspersed between
(intergenic spacers) and within (introns) coding DNA. Their function: largely
unknown. Speculations about properties of noncoding DNA range from
nucleoskeletal functions (Cavalier-Smith, 1978), gene regulation and other
essential functions (Zuckerkandl, 1976), parasite or selfish DNA (Doolittle and
Sapienza, 1980; Orgel and Crick, 1980; Östergren, 1945) to junk DNA (Ohno,
1972). Each of these theories may reflect only an aspect of the true evolutionary
function of noncoding DNA, which is still not thoroughly understood. However,
considering noncoding DNA as junk might be exaggerated as it is often packed
with transcription and translation factors, such as promoters or
regulatory/stabilizing elements (Ludwig 2002; Siepel et al. 2005; Bird et al.
2006; Drake et al. 2006).
In molecular phylogenetics, however, plastid noncoding DNA, i.e. the trnT-F
region composed of two intergenic spacers (IGS) and a group I intron was soon
established as a standard marker for phylogenetic analyses (Taberlet et al.,
1991). Since then, the reliability of fast evolving genomic regions markers, i.e.
noncoding regions and genes with high levels of variability has been
controversially discussed.
During the last decades of the last century, scientists avoided using fast
evolving regions due to high levels of homoplasy and an assumed saturation
effect that would superimpose the phylogenetic signal. Moreover,
microstructural evolution of DNA, i.e. frequent insertion and deletion of DNA
stretches and inversions (compare Quandt et al. 2003) require extensive
alignment work and even exclusion of stretches with uncertain homology,
referred to as hotspots. More generally, the conventional wisdom on marker
selection was that variability and substitution rates of a marker should match the
level of phylogenetic profundity of relationship between the taxa contained in
1
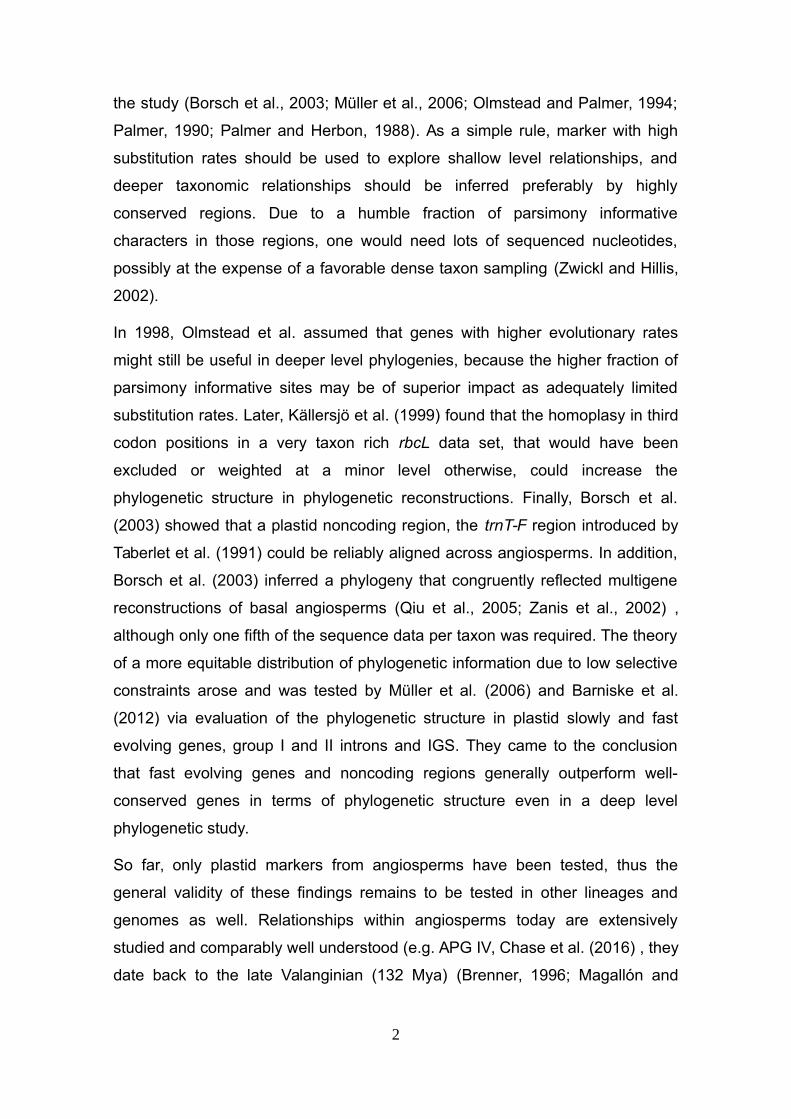
the study (Borsch et al., 2003; Müller et al., 2006; Olmstead and Palmer, 1994;
Palmer, 1990; Palmer and Herbon, 1988). As a simple rule, marker with high
substitution rates should be used to explore shallow level relationships, and
deeper taxonomic relationships should be inferred preferably by highly
conserved regions. Due to a humble fraction of parsimony informative
characters in those regions, one would need lots of sequenced nucleotides,
possibly at the expense of a favorable dense taxon sampling (Zwickl and Hillis,
2002).
In 1998, Olmstead et al. assumed that genes with higher evolutionary rates
might still be useful in deeper level phylogenies, because the higher fraction of
parsimony informative sites may be of superior impact as adequately limited
substitution rates. Later, Källersjö et al. (1999) found that the homoplasy in third
codon positions in a very taxon rich rbcL data set, that would have been
excluded or weighted at a minor level otherwise, could increase the
phylogenetic structure in phylogenetic reconstructions. Finally, Borsch et al.
(2003) showed that a plastid noncoding region, the trnT-F region introduced by
Taberlet et al. (1991) could be reliably aligned across angiosperms. In addition,
Borsch et al. (2003) inferred a phylogeny that congruently reflected multigene
reconstructions of basal angiosperms (Qiu et al., 2005; Zanis et al., 2002) ,
although only one fifth of the sequence data per taxon was required. The theory
of a more equitable distribution of phylogenetic information due to low selective
constraints arose and was tested by Müller et al. (2006) and Barniske et al.
(2012) via evaluation of the phylogenetic structure in plastid slowly and fast
evolving genes, group I and II introns and IGS. They came to the conclusion
that fast evolving genes and noncoding regions generally outperform well-
conserved genes in terms of phylogenetic structure even in a deep level
phylogenetic study.
So far, only plastid markers from angiosperms have been tested, thus the
general validity of these findings remains to be tested in other lineages and
genomes as well. Relationships within angiosperms today are extensively
studied and comparably well understood (e.g. APG IV, Chase et al. (2016) , they
date back to the late Valanginian (132 Mya) (Brenner, 1996; Magallón and
2

Sanderson, 2001). Relationships among and within all other land plant lineages,
which are still controversially discussed, are considerably older (Hedges et al.
2015, www.timetree.org), and the markers used to elucidate their pedigree
possibly need to have a higher level of conservation in order to provide the
required low levels of homoplasy or saturation. Genes with higher conservation
can be found in mitochondria, but the frequent recombination and
rearrangement of the mitochondrial genome, described in the next segment,
prevented the establishment of efficient phylogenetic marker in land plants,
although some studies employing multiple mitochondrial marker revealed a land
plant phylogeny largely congruent to a phylogeny inferred by plastid and nuclear
marker (Qiu et al., 2010). Within two early diverging land pant lineages, i.e.
mosses and liverworts, however, genome organization and configuration of
introns remains stable. Mosses date back to the lower Devonian (414 Mya ±
18.2, chapter 2; Laenen et al. (2014), and established phylogenetic marker from
both organellar genomes are available. In this study, we do not employ marker
from genomic approaches, but sanger sequenced data from established
common markers to address questions whether
1. phylogenetic studies on relationships that are much older than those in
angiosperms demand for marker with a higher degree of conservedness,
2. mitochondrial marker provide sufficient phylogenetic structure to resolve
relationships that span 400 mya.
3. phylogenetic signal from plastid marker and mitochondrial marker is
significantly congruent.
4. noncoding marker in this study outperform coding markers independent
of the cytoplasmic origin.
Characteristics of the three genomes in plant cells
As mentioned above, noncoding DNA represents a large fraction of genomes
intermingled with coding parts. This is true for all three players of the overall
plant genome, i.e. nuclear, plastid and mitochondrial DNA. However, due to the
evolutionary history, inheritance and uncoupled molecular evolution the
3

genomes of each compartment differ drastically in their molecular evolution with
respect to large scale reorganization, recombination, gene transfer,
microstructural evolution and substitution rate.
Nuclear DNA
Plant nuclear marker provide high levels of variability and thus informative sites,
but they also bear the risk of paralogue and pseudogene inclusion. Rates of
silent substitutions in nucleotide genes were found to be roughly twice as high
as in plastids, which in turn have a threefold substitution rate compared to
mitochondrial genes (Wolfe et al. 1987). But although exhibiting more variability
and much more characters than marker from organelles, nuclear marker have
been used to a lesser extent due to intricate sequencing efforts, e.g. the need to
clone polyploid species. Advances in next generation sequencing techniques
however are thought to increase the usage of nuclear DNA (nDNA) in
phylogenetic studies in the future (Soltis et al. 2013; Zimmer and Wen 2015).
Considering noncoding regions of the nDNA in plants, currently only the spacers
of the cistronic nuclear ribosomal DNA (internal transcribed spacer, ITS) are
used for phylogenetics, which provide a valuable source for phylogenetic
reconstructions within land plant lineages (Álvarez and Wendel, 2003; Baldwin
et al., 1995). The use of noncoding DNA in animal phylogenomics however has
been discussed by Bird et al. (2006). Although the region is used on family and
ordinal level among angiosperms or bryophytes (Álvarez and Wendel, 2003;
Samigullin et al., 1998), it is impossible to align this region across angiosperms
or mosses, due to the high rate of substitutions and microstructural evolution.
In comparison to the linear nDNA, cytoplasmic or organellar DNA is normally
uniparentally inherited and are generally represented as a circular structure, as
they descend from bacterial ancestors (Hagemann, 2004; Martin et al., 2012;
Mereschkowsky, 1905). Exceptions to that rule have arisen multiple times
during evolution (Bock, 2007). Although organelles depend on nuclear gene
products and control, both organelles differ significantly in evolutionary tempo
and mode (Palmer, 1990).
4

Plastid DNA
Plastid DNA (cpDNA) is a unique, abundant high-copy molecule with ample
substitution rates. Its size ranges between 100 and 200 genes (Y. Wang et al.,
2012) on a 100 to 160 kb long molecule (Bock, 2007; Sugiura, 1992; Wicke et
al., 2011). Although it is a small genome compared to nDNA, plastid DNA
makes up a significant proportion of total cellular DNA of up to 20% (Boffey and
Leech, 1982). Unlike mtDNA, cpDNA is often associated with proteins, RNAs
and other cpDNA molecules referred to as nucleoids, which are attached to the
envelope membrane or the thylakoids (Sato et al., 2003). In most lineages the
plastome maps to a circle with a large and a small single copy region (LSC,
SSC), interrupted by two identical inverted repeat (IR) regions. In living cells,
cpDNA exists in a circular, linear, branched or concatenated form of multiple
plastomes (Bendich, 2004; Bock, 2007; Lilly, 2001; Oldenburg and Bendich,
2004).
Except for some parasitic plants (Wicke et al., 2013; Wickett et al., 2008; Wolfe
et al., 1992), plastomes exhibit a similar configuration of genes. Some genes
are lost independently multiple times during the land plant evolution, other gene
losses are apparently clade specific (Campagna and Downie, 1998). All mosses
and hornworts lack e.g. rps16, which is present in seed plants and liverworts
except for gymnosperms (Tsudzuki et al., 1992).
Isolation, amplification and sequencing of plastid marker is comparatively
inexpensive. Consequently, most phylogenetic studies on plants employ
cpDNA, often several markers or combinations of cpDNA, nDNA and/or mtDNA
(Chang and Graham, 2011; Cox et al., 2000; Graham and Wilcox, 2000;
Kelchner, 2000; Qiu et al., 2005; Soltis et al., 1997; Worberg et al., 2007).
Plastid marker: In this study, six different plastid markers were used, one group
I intron, one spacer, two group II introns and two genes. The tRNALys(UUU)
intron (trnK, Hilu and Liang 1997) is a class IIA1 group II intron (Hausner et al.,
2006; Michel et al., 1989), its length in mosses averages in 2313 nucleotides
5

including the 3'exon sequence. Within the intron sequence resides the highly
variable matK-ORF with an average length of 1,548 nucleotides. Its encoded
protein is a degenerate type of RT-Protein with reduced mobility function. The
maturase activity and the conservation of this gene in all land plants suggest
that matK codes for a generalized and also essential maturase enzyme that
catalyzes splicing of all plastid group II introns (Hausner et al., 2006; Mohr et
al., 1993; Neuhaus and Link, 1987; Sugita et al., 1985).
The second marker containing an intron is rpl16 (Jordan et al., 1996), it is a IIB2
group II intron. Given the fact that most sequences lack the first 40-50
nucleotides due to primer positioning at the 3' site, the average length of this
intron could only be estimated to 760 nucleotides in this dataset. Its utility in
seed plants has been proven frequently, e.g. in bamboos (Kelchner and Clark
6
Figure 1: Synteny of land plant plastid chromosomes. The plastid chromosomes are shown in linearized form illustrating relative gene synteny. Genes are depicted by boxes colored according to their relevant functional class (see legend). Genes encoded by the leading strand (strand) or by the lagging strand (- strand) are shown above or below the grey chromosome bar, respectively. Lines from selected genes/ gene-regions mentioned above the first chromosome bar roughly indicate genes clusters that have been reorganizated during land plant evolution.(from Wicke et al., 2011)

1997), and in bryophytes as well (Hedenäs and Eldenäs, 2007; Huttunen et al.,
2012a; Olsson et al., 2009; Stech et al., 2012).
The third intron containing marker trnL-F contains the sole plastid group I intron
inserted in the anticodon site of tRNALEU(UAA) along with an intergenic spacer
(IGS) between tRNALEU(UAA) and tRNAPHE(GAA) (Gielly and Taberlet 1994).
Just as in angiosperms, this marker is extensively used in all three bryophyte
lineages (Stech et al., 2003a; Quandt & Stech 2005).
7
Figure 2: Graphical representation of the plastid genome of the moss Sanionia uncinata (Park et al. 2015, Accession KM111545, plotted with OGDRAW v1.1 (Lohse et al. 2013)) Reading direction indicated by arrows, genes belonging to functional complexes are color coded and listed in the legend.

Finally, for a balanced comparison and owing to the availability of a large data
pool, the rbcL gene (Chase et al., 1993; Hasebe et al., 1994), the rps4 gene
(Nadot et al., 1994) and the atpB – rbcL IGS (Chiang et al., 1998; Shaw et al.,
2005) have been included.
Mitochondrial DNA
Mitochondrial DNA as phylogenetic marker are extensively used in eukaryotic
lineages without plastids, e.g. metazoa and fungi (Avise et al., 1987; Moritz et
al., 1987), and mtDNA is thought to have similar properties in these groups as
cpDNA in plants. In animals, mtDNA is a small molecule of less than 20kb,
typically containing 37 genes, of which 22 code for tRNAs, 13 for proteins and
only two for rRNAs (Boore, 1999). As rearrangements of the genes are found to
be unique and rare events, they serve to infer deep level relationships. Introns
in metazoan mitochondria are more exception than rule, they only appear in
very basal metazoan lineages; group I introns in cnidaria, placozoa and porifera
(Beagley et al., 1998; Burger et al., 2009; Rot et al., 2006), a group II intron is
also reported from the bilaterian Nephtys sp. (Vallès et al., 2008) in the CoxI
gene, which is a mitochondrial marker used for DNA barcoding in animals.
In contrast, plant mitochondrial DNA (mtDNA) molecules range in size between
58 kb in Isoetes engelmannii A.Braun (Grewe et al., 2009) and up to 2.000 kb in
Cucumis melo L. (Ward et al., 1981) Due to horizontal gene transfer, the size
can even increase further, e.g. the Amborella trichopoda mt genome, which
acquired almost four entire genomes from three algae and one moss during its
evolution reaches more than 3.900 kb (Bergthorsson et al., 2003; Rice et al.,
2013; Taylor et al., 2015). Thus, the size disparity between the lineages is
caused by a growth of the spacer regions rather than the gain of functional
genes or new introns. In fact, mtDNA seems to tend to decrease in number of
coding genes, but increase in genome size (Groth-Malonek et al. 2007). For
example, the liverwort genus Marchantia possesses 94 possible genes on a
184 kb molecule, 29 of these code for tRNAs, three rRNAs and 41 code for
8
proteins, the remaining 11 open reading frames are hypothetical proteins (Oda
et al., 1992).
The angiosperm Brassica napus L. has 54 mitochondrial genes on a 222 kb
molecule, of which 34 are protein coding genes, three rRNAs, 17 tRNAs and
one hypothetical protein (Handa, 2003).
In plants, mtDNA has very low substitution rates on one hand, but frequent
recombinations and rearrangements on the other, which leads to notorious
lability and complexity and heteroplasmy (Kubo and Mikami, 2007; Palmer and
Herbon, 1988), a co-existence of multiple DNA arrangements in the same tissue
and even within the same cell. Uptake of foreign DNA from plastids and the
nucleus, continuous endosymbiotic gene transfer (EGT), RNA editing and
disruption of genes that necessitates trans-splicing has been reported (compare
Knoop 2012). A few chondromes have been shown to include foreign DNA from
other distantly related taxa, acquired via horizontal gene transfer (HGT)
(Bergthorsson et al., 2003; Won and Renner, 2003). Recombination in mtDNA is
9
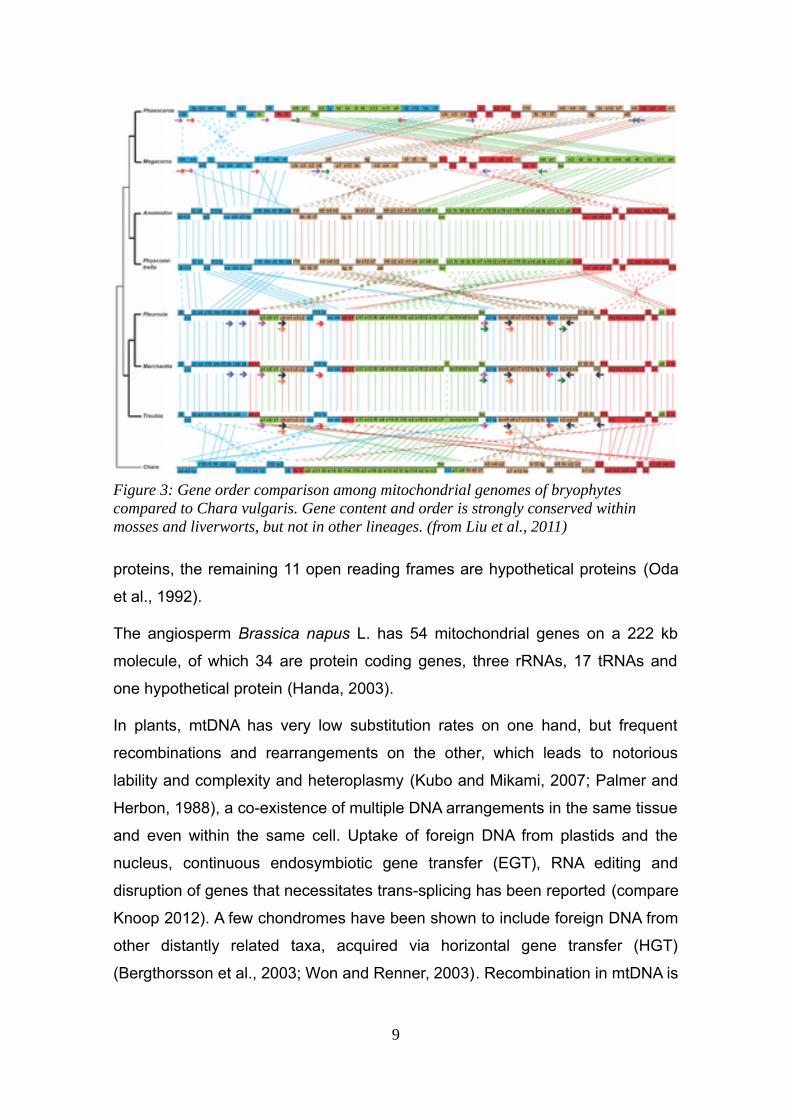
Figure 3: Gene order comparison among mitochondrial genomes of bryophytes compared to Chara vulgaris. Gene content and order is strongly conserved within mosses and liverworts, but not in other lineages. (from Liu et al., 2011)

the contributing factor to cytoplasmic male sterility (CMS), which is a valuable
tool in plant breeding (Schnable, 1998).
The mitochondria in the early diverging bryophytes, the liverworts and mosses ,
however show different properties than in vascular plants. Within each lineage,
liverworts and mosses, the mtDNA underwent almost no recombination during
their radiation since the Devonian (Li et al., 2009; Liu et al., 2014b, 2011; Xue et
al., 2010)(see Figure 3). The distribution of introns is a characteristic trait of
each of the three bryophyte lineages (liverworts, mosses, hornworts), each of
10
Figure 4: Graphical representation of the Mitochondrial genome of the moss Sanionia uncinata (Park et al. 2015, Accession KP984757, plotted with OGDRAW v1.1 (Lohse et al. 2013). Reading direction indicated by arrows, genes belonging to functional complexes are color coded and itemized in the legend.

which has an individual set of introns that are not shared between the lineages
(Knoop, 2010). In fact, the monophyly of liverworts as sister to all other
embryophytes is strongly supported by the lack of three mitochondrial introns
that consistently occur in other lineages (Palmer et al., 1998).
Mitochondrial marker: Due to the instable and complex nature of the
chondrome in flowering plants the use of mtDNA in plant systematics has been
avoided (Kubo and Mikami, 2007). In mosses however, favorable characteristics
of the chondrome1 like high conservation and stable localization of introns and
spacer indicated mt marker as a promising tool for deep level phylogenies (Liu
et al., 2014a; Palmer and Herbon, 1988), e.g. cox3-complex in land plants
(Hiesel et al., 1989; Malek et al., 1996) and mt 19S rRNA (Duff and Nickrent,
1999; Kenrick, 2000). The nad5i753 group I intron (Beckert et al. 1999) that is
unique for mosses soon became a valuable marker in moss phylogenetics as
an alternative source for sequence data outside the plastome. This study on
mosses employs noncoding marker, such as the nad2i156 group II intron
(Beckert et al., 2001), the two group I introns nad5i753 (Beckert et al.,
1999) and cobi420 (Wahrmund et al., 2010), and the nad5-nad4 IGS (Groth-
Malonek et al., 2007) as well as the flanking genes themselves (nad2, nad5,
nad4, cobI, all partial).
Moss phylogeny and the peristome
The current view on the colonization of land by phototrophic organisms sees
nonvascular plants, traditionally referred to as the ancestors of bryophytes, as
the first extant group of embryophytes to successfully form vegetation on earth
(Mishler and Churchill, 1985; Shaw and Renzaglia, 2004). The three bryophyte
lineages, the Marchantiophytina, Bryophytina and Anthocerotophytina, form a
paraphyletic group basal to the rest of all extant land plants, the tracheophytes
1 Note, that the term “chondriome” has previously been used ambiguously to describe either the mitochondrial genome of a species or the entirety of the dynamic population of all mitochondria in a cell (Logan 2010 ) . This issue of confusion was recently addressed, suggesting that “chondriome” is now restricted to the latter sense whereas chondrome (without i) is used equivalently to mitochondrial genome (Knoop et al. 2010 ) (from Bock and Knoop, 2012)
11

(Qiu et al. 2006; for a more detailed discussion see chapter 2; Figure 23
(appendix)).
The sporophyte and the spores themselves are among the most important key
innovations to facilitate land colonization (Gray et al., 1985; Shaw and
Renzaglia, 2004). While in vascular plants (tracheophytes) the sporophyte has
evolved to become the dominant stage during life cycle with a progressively
reduced gametophyte, in bryophytes, the dominant, long-lived and nutritionally
independent stage is still the gametophyte. Despite being dependent on the
gametophyte, the moss sporophyte has developed high levels of complexity,
and even exhibits stomata and performs photosynthesis. In fact, the function of
a sporophyte is to produce and disperse the diaspores effectively (Vitt, 1981),
and adaptations in the sporophyte and its organs are related primarily to this
purpose.
In non-vascular land plants, dispersal of the diaspores depends chiefly on air.
Spores develop in a capsule, often at the tip of a stalk (seta). At maturity, this
capsule disintegrates, splits or opens at a well-defined mouth, usually by a
desiccation-induced process, finally releasing the spores. While disintegration
or splitting is common to liverworts, hornworts and a few basal mosses like the
Andreaeidae, the capsule in the majority of mosses is more complex. Under dry
conditions, the calyptra, a cap-like structure that originates from gametophytic
tissue, drops off, the operculum, a flap-like structure, is shed, the peristome
teeth bend outwards and the spores are exposed to the environment.
These peristomes are thus parts of the mechanism regulating the rate of
dispersal and it is thought that they are under weak environmental constraint.
They are remarkably well conserved and preferentially used in moss taxonomy
12

as an identifying characteristic at class or ordinal level (e.g. Brotherus 1924; Vitt
1981; Vitt 1984).
Extant aperistomate mosses represent the first four out of five monogeneric
classes (Sphagnopsida, Takakiopsida, Andreaeopsida and Andreaeobryopsida),
and were early identified as the basal moss clades. The peristomate mosses
(Bryopsida) include some clades that most likely lost the peristome again, like
the Gigaspermidae, the Diphysciidae and the Buxbaumiidae. The relationships
among the early branching peristomate clades are delicate to delineate
confidently (Cox et al., 2004; Newton et al., 2000; Wahrmund et al., 2010). The
monophyly of the two nematodontous clades, whose peristome consists of
whole cells, the Tetraphidopsida and the Polytrichopsida, could only be inferred
with weak confidence when employing the mitochondrial nad2 and nad5 genes
(Beckert et al., 2001) Even when adding the mitochondrial cobI locus and the
nad5-nad4 IGS plus the plastid rbcL and rps4 genes (Wahrmund et al., 2010),
the support for this node could not be raised to significance. When employing
plastid and/or nuclear marker, the nematodontous mosses appear to be
paraphyletic (see chapter 2; Magombo 2003; Cox et al. 2004). This question
however is important to explain the evolution of the peristome, i.e. a
monophyletic relation of these two groups would imply an independent origin of
the nematodontous and the arthrodontous peristome, whereas a paraphyly
would strongly suggest the arthrodontous peristome being derived form the
nematodontous peristome.
13
Figure 6: SEM picture and peristome diagram of Hypnum imponens, a diplolepideous-alternating moss.

Within the arthrodontous lineages, the Buxbaumiidae, followed by the
Diphysciidae, are established as the basal bryopsid clades (Cox et al., 2010).
The relationships of the following classes are still not confidently solved. The
Gigaspermales, Funariales and the Encalyptales are sometimes resolved as a
monophyletic group with weak support, referred to as Funariidae (Cox et al.,
2010; Goffinet and Cox, 2000). The monophyly of the Encalyptales and the
Funariales is also strongly supported by a shared 71kb inversion in the SSC of
the cpDNA (Goffinet et al., 2007). Additionally, both share a unique peristome
type, the diplolepideous-opposite peristome. Other analyses employing
predominantly mtDNA find the Gigaspermales as the sister clade of the Bryidae
(Wahrmund et al., 2010). The Timmiales in turn are sometimes inferred as sister
to the clade uniting Dicranidae and Bryidae (Wahrmund et al., 2010),
sometimes as sister to the Funariidae (Cox et al., 2004). The peristome of the
Timmiales is unique, but shares crucial developmental features with the
peristome of Funaria (Budke et al., 2007), which speaks for a higher probability
of a closer relationship to Funariidae than to Bryidae or Dicranidae. The
Dicranidae again are resolved as a monophyletic group that posses the unique
haplolepideous peristome with only one ring of teeth. The Bryidae finally are
also found to be unambiguously monophyletic (e.g. Cox et al. 2010, Wahrmund
et al. 2010). This group is characterized by the diplolepideous-alternate
peristome.
Although there is budding recent progress in moss phylogeny, the difficulties in
resolving the relationship between the subclasses of the Bryopsida remain, and
they seem to be related to a quick and concurrent early radiation during the
evolution of the major moss lineages, as indicated by very short branches
between unresolved nodes (Wahrmund et al., 2010) . As long as this question
remains unanswered, no speculations about the ancestral architecture of the
arthrodontous peristome type can be made (Crosby, 1980; Vitt, 1984). Because
the peristome type is unique in clades that otherwise have very different levels
of species diversity, hypotheses about the correlation between a certain
peristome type and species richness need to be tested, and an unambiguously
14

resolved phylogeny would be – together with developmental studies – a crucial
step towards the understanding of the evolution of mosses.
While bryophytes were often considered as a group of model organisms that
reveal “windows into the early evolution of land plants” (A. J. Shaw et al., 2011),
this group itself has been considered rather an evolutionary dead end (Mishler,
1988). Their haplobiontic life form and the fragmentary fossil record gives the
impression of very limited progression and innovation in these basal land plants,
which is explained by the haploid vegetative state that conditions mutations to
be under permanent selective pressure (Anderson, 1963; Mishler, 1988). But
considering the highly uneven distribution of the approximately 12000 moss
species among the divisions and subdivisions and their divergence times, it
becomes clear that mosses just like many other plant and animal groups have
had several diversification bursts (Bateman et al., 1998; Jablonski, 2005;
Laenen et al., 2014; Schneider et al., 2004; Shaw and Renzaglia, 2004). These
past diversification events are elucidated by novel Bayesian methods in chapter
2.
Phylogenetic structure measure
The term “phylogenetic structure”, sometimes also used for significance tests
for departure from randomness (Archie, 1989; Hillis, 1991; Huelsenbeck, 1991),
describes a quantitative measure of contribution to a phylogenetic hypothesis.
One possible way to obtain this measure is to sum all jackknife or Bremer
support values from resolved nodes (Källersjö et al., 1999, 1992). Based on this
concept of phylogenetic structure, Müller et al. (2006) developed the
phylogenetic structure R as a generalized sum of support values at resolved
nodes by arbitrary reconstruction methods (e.g. parsimony, Bayesian inference,
maximum likelihood). The key to quantify the phylogenetic structure of markers
with different length is a resampling strategy, that evaluates phylogenetic
structure based on equal proportions of alignment positions (sensu Müller et al.
2006) or total count of nucleotides in pairwise comparisons (RC, sensu Barniske
et al. 2012). In chapter 3, this concept is advanced to address additional
questions concerning the phylogenetic structure on a constraint topology
15

(phylogenetic RC,fix) and on distinct node partitions (RC,fix(S)), with the latter allow
testing for a temporal gradient in phylogenetic structure as a discrimination to
resolve a specific temporal level of nodes more than other levels.
The downside of a constraint topology is the possibility of introducing a
circularity problem, as the original definition of phylogenetic R by Müller et al.
(2006) was independent from a topology as a prior assumption. The circularity
problem accrues from the premise that a topology inferred by the complete data
set is used as the criterion to prove the contribution from fractions of the data
set to the whole topology. On the upside, provided that the topology is
trustworthy, one can estimate the source of phylogenetic signal for a certain
subgroup of nodes and quantify incongruence between trees from individual
datasets and the constraint topology.
Insertions, Deletions, simple sequence repeats and inversions in organellar DNA
Knowledge about the course of microstructural evolution in a genomic region
designated as phylogenetic marker is crucial in for planning a phylogenetic
analysis, even in times of ever-increasing availability of whole genomes in a
broad selection of species in all major lineages of plants. To circumvent artifacts
an alignment taking into account mechanisms of molecular evolution is
fundamental, therefore rules need to be applied that integrate our knowledge on
microstructural evolution (compare Kelchner 2000, Borsch & Quandt 2009).
While protein coding regions only rarely show any length variations, spacer and
introns often accumulate insertions and deletions, especially in stretches with
low evolutionary constraint (e.g. loops of hairpin structures). Intron sequences
need to fold into a secondary structure in order to excise from the exon
sequence (Cech, 1990, 1986; Kruger et al., 1982; Michel, 1995; Michel et al.,
1989). This secondary structure requires areas with different degrees of
constraints and thus a characteristic mosaic pattern of conserved or variable
stretches. Like a scaffold, highly conserved (constrained) stretches guide the
alignment of noncoding sequences, but correctly aligning the highly variable
loop regions requires a deep understanding of the biology microstructural
changes (Borsch and Quandt, 2009). Especially indels and the derivation of
16

their homology are crucial in phylogenetic reconstructions using highly variable
noncoding marker. Until now, no automated alignment editor is capable of
generating alignments from marker of high variability satisfactorily, incorporating
all available knowledge about microstructural evolution. Manual alignments are
challenging but rewarding considering the advantageous proportions of
phylogenetic structure (sensu Müller et al. 2006) per sequenced nucleotide
compared to most other genes (Barniske et al. 2012).
Numerous authors have drafted rules of good alignment practice (Borsch and
Quandt, 2009; Kelchner, 2000; Löhne and Borsch, 2005; Morrison, 2009;
Ochoterena, 2009), but the reliability and homoplasy of coded indels as
phylogenetic characters have been questioned, most notably in simple
sequence repeats (SSR) and inversions (Bruford and Wayne, 1993; Goldstein
and Pollock, 1997). SSRs are generally explained by slipped strand mispairing,
a processing defect during replication in specific regions of the genome that
leads to considerably high numbers of copies of a short sequence (Kelchner
and Clark, 1997; Levinson and Gutman, 1987; Tachida and Iizuka, 1992).
17
Figure 7: Frequency of inserted simple sequence repeat elements of the chloroplast genome across lineages and genomic regions. Black: trnL group I intron of the asterids (K. Solomon et al., unpublished data). Dark gray: petD group II intron of the asterids (K. Solomon et al., unpublished data). Light gray: introns and spacers of the chloroplast IR of early branching angiosperms (Graham et al. 2000). White: spacers and group I intron of the trnT–trnF region in Nymphaea (Borsch et al. 2007) (from Borsch and Quandt, 2009)

These loci are referred to as microsatellites, and their mutation rates are
considered high enough to be successfully employed inferring relationships in
very closely related species and even in population genetics. SSRs occur in
seemingly random sites and in low numbers of copies as well. In a review paper
on phylogenetic utility of noncoding marker, Borsch & Quandt (2009)
summarized the frequency of SSRs in dependency of their repeat length across
different studies employing different noncoding plastid marker and found a
surprisingly high fraction of pentanucleotide and hexanucleotide SSRs in the
alignments (Figure 7). The overall length variability is generally not as one
would expect reckoned on a complete random process, the frequency of SSRs
should rapidly drop with their repeat length.
As this study employs a high fraction of noncoding regions, i.e. spacers and
introns the acquired data provides a unique chance to evaluate the absolute
frequency of independent origination events of simple sequence repeats at the
same sites, the gain and loss of SSRs and inversions along a given phylogeny
via ancestral state reconstruction. An ensuing evaluation of the phylogenetic
structure and phylogenetic signal shall elucidate the utility of SSRs and
inversions in a phylogenetic context (chapter 4).
18

Chapter 2:
Timing the branching order and radiation shifts of the major
moss lineages
Resolving the backbone phylogeny of mosses: an organellar perspective
Abstract. Uncovering the branching order of major moss lineages is central to
reconstruct the transformation of morphological traits during their evolution. This
is particularly critical for understanding the order in which major peristome types
arose. Current reconstructions either using chondrome data and/or coding
regions from the plastome are inconclusive, as the short deep backbone nodes
splitting the major clades receive inconsistent support. Here, a new hypothesis
on the evolution of peristomate mosses is presented in a novel study based on
a combined dataset from the plastome and chondrome spanning 15,922
characters of noncoding (spacers, group I & II introns) as well as coding regions
(plastome: 8,663 char.; chondrome 7,259 char.) plus 1,813 indels generated by
simple indel coding.
Phylogenetic analyses (Bayes & RAxML) yielded a highly supported backbone
phylogeny of mosses that revealed the nematodontous lineages
(Polytrichopsida & Tetraphidopsida) as a grade leading towards the
arthrodontous mosses (Bryopsida). Among arthrodontous mosses the two first
branching lineages contain mosses characterized by a unique endostome
architecture (Buxbaumiidae & Diphysciidae) followed by the gymnostomous or
cleistocarpous Gigaspermidae. Gigaspermidae are followed by the Funariidae
indicating the diplolepideous-opposite peristome as the ancestral peristome
type of which the haplolepideous (Dicranidae) and diplolepideous-alternate
(Bryidae) peristome as well as the Timmia-type was derived.
19

According to the BEAST analyses these major peristomes types were already
established 300-350 MYA, indicating that the Carboniferous set the stage for
the split of the major moss lineages (subclass) known today. Overall four
independent rate shifts were detected, of which two affect the two biggest moss
lineages, i.e. the haplolepideous (~ 4000 species) and the pleurocarpous
mosses (~ 5000 species), that experience rate shifts at different stages of earth
history. Both lineages are not only characterized by different peristome types
(haplolepideous versus diplolepideous-alternate) but also by their different
growth form (i.e. acrocarpy versus pleurocapy). The BEAST analyses based on
an extended data set including a representative sampling of all other major land
plant lineages indicate that the rate shift at the pleurocarpous branch in the
Cretaceous can be associated with the radiation of angiosperms, i.e. new
habitats, especially epiphytic habitats. Most likely the exploitation of the new
habitats was aided by the invention of pleurocarpy. In contrast, the
haplolepideous lineages represent a much older radiation experiencing a rate
shift already in the middle/upper Jurassic that leads to a diversification in the
Cretaceous. This finding goes in line with the increase in origination of spore
bearing plants in the recovery phase of the late Permian mass extinction.
Whether the evolution of the haplolepideous peristome that facilitates spore
distribution enabled a higher colonization and origination rate needs to be
shown.
Keywords: Bryophytina, peristomial evolution, diversification patterns,
divergence times, Cretaceous, arthrodontous mosses
1. Introduction
Mosses, together with liverworts and hornworts, i.e. bryophytes are accepted to
be among the oldest extant lineages of green plants that successfully colonized
terrestrial niches (Graham, 1993; Mishler and Churchill, 1985). While the
traditional view considers bryophytes monophyletic, recent phylogenetic
analyses revealed that liverworts are sister to all other extant land plant
20

lineages and hornworts sister to all vascular plants (Groth-Malonek et al., 2005;
Palmer et al., 1998; Qiu et al., 2006), which conditions mosses to be sister to
hornworts and vascular plants. This view is supported by the appearance of
stomata at the branch leading to mosses, hornworts and tracheophytes
(Kuhlbrodt, 1922; Porsch, 1905), and the pattern of intron gains and losses in
the chondrome (Groth-Malonek et al., 2005; Knoop, 2010). However, recent
analyses using genomic data sets or transcriptome data (Wickett et al., 2014)
also find support for alternative branching orders, even the traditional view of
monophyletic bryophytes appears again, albeit being identified as an artifact
(Cox et al., 2014; Liu et al., 2014a).
Bryophytes lack true vascular tissues with lignin and show a unique diplobiontic
alternation of generations with a dominant, complex and perennial
gametophyte, either thalloid or foliose, and a dependent, matrotrophic and
monosporangiate sporophyte (Graham and Wilcox, 2000; Niklas and Kutschera,
2010). Beside asexual proliferation, sexual reproduction relies on motile male
gametes that navigate to the female reproductive organs through water. Upon
fertilization the nutritionally dependent sporophyte grows from the embryo. In
the sporangium, it produces meiospores with sporopollenin-impregnated spore
walls that are highly resistant against degradation and therefore often petrified,
giving us the oldest reliable fossils to date the land plant tree (Rubinstein et al.,
2010).
A unique invention of the moss sporangium that is not found in other bryophyte
lineages are teeth like structures (peristomes) that surround the stomium of a
sporangium. Depending on the development of the teeth, peristomes are
divided into nematodont or arthrodont. Nematodont peristomes are generally
formed by layers of whole cells, arthrodont peristomes are remains of thickened
cell walls (Edwards, 1984). Nemathodontous peristomes are typical to
Tetraphidopsida and Polytrichopsida, the former comprises four teeth from 16
cells, the latter 16, 32 or 64 teeth, united by their tips to a circular membrane,
the epiphragm closing the capsule. Subtle changes in the epiphragm shape
possibly influence spore release that escape through the gaps between the
peristome teeth (Bell and Hyvönen, 2010). In arthrodontous mosses the
scenario is completely different as the peristome teeth are generally composed
21

of hygroscopic tissue offering the ability to perform humidity dependent
movements in order to control spore dispersal (Edwards, 1984).
Arthrodontous peristomes are remnants of three innermost amphitecial cell
layers; the outer, primary and inner peristomial (amphitecial) layer (OPL, PPL,
IPL respectively; named by Blomquist and Robertson, 1941), and are
characteristic to the vast majority of extant mosses. The peristome configuration
is described by a formula introduced by (Edwards, 1979). Here, the ratios of cell
quantity in an eighth of an amphitecium in each peristomial layer is given. The
OPL generally comprises 32 cells and the PPL 16 cells, thus most formula
begin with 4:2:x (OPL:PPL:IPL). The IPL is variable and shows a characteristic
anticlinal cell division pattern depending on taxa, genera or families. At maturity,
haplolepideous mosses comprise only one row of teeth that can be traced back
to the cell walls of the PPL and IPL. Diplolepideous mosses have a peristome
that consists of two rows of teeth, the inner endostome, formed by PPL and IPL
and the outer exostome formed by cell wall fragments from OPL and PPL.
The lack of knowledge on the moss life cycle and adequate optical equipment
impeded the rise of a reliable classification of mosses prior to the first
microscopic classifications of moss diversity by Johann Hedwig (1730-1799),
who described 35 moss genera focusing on differences of the capsule and
peristome architecture (Species Muscorum, Hedwig, 1801). Other
classifications, e.g. by Bridel-Brideri (Bryologica Universa, 1826-1827)
described 122 genera and included the position of the perichaetium as a major
distinguishing factor. Two major types were distinguished: i) acrocarpous
lineages where gametangia terminate the vegetative axis and ii) pleurocarpous
taxa with gametangia are situated on the tip of reduced specialized lateral
branches. The importance of the sporophytic characters, either its position on
the gametophore or the architecture of the peristome and overall capsule are
also reflected in the dominant classifications by Fleischer (1904-1923) and
subsequently Brotherus (Moose in Die Natürlichen Pflanzenfamilien, 1924-
1925). In principle both again focus on the peristomial features and their
development explored by Philibert (1884-1902) (in Taylor, 1962). These traits
are used to sort major bryophyte lineages ever since, as persitomial characters
22

were thought to be less effected by selection pressure, due to the fact that the
moss sporophyte is nutritional depended on the gametophyte (Browning and
Gunning, 1979; Proctor, 1977; Renault et al., 1992; Uzawa and Higuchi, 2010),
only short-lived, and with low environmental interactions (Vitt, 1981). Thus,
modern classifications are based on sporophytic, and specifically peristomial
traits like count and formation of teeth and their development (Braithwaite,
1887; Brotherus, 1924; Crosby, 1980; Crum and Anderson, 1981; de Bridel-
Brideri, 1827; Dixon, 1924; Fleischer, 1908; Grout, 1903; Taylor, 1962; Vitt,
1981, 1984) and a few on gametophytic characteristics (Buck and Crum, 1990;
Crundwell, 1979; Mitten, 1859; Saito, 1975; Schimper, 1855).
Recent molecular studies (Cox et al., 2014, 2004; Newton et al., 2000;
Wahrmund et al., 2010) found arthrodontous mosses to be monophyletic, thus
being addressed as the class Bryopsida. Buxbaumiales and Diphysciales were
resolved as the early branching taxa with high support, just like the species rich
subclasses Dicranidae (all haplolepideous mosses) and Bryidae (the
diplolepideous-alternate mosses). The phylogenetic position of the remaining
subclasses on the other hand, have not been resolved satisfactorily, moreover
the position of these groups differ respective to the markers used. As the
branching order is of outermost importance to interpret the evolution of the
sporophyte in mosses, a novel approach was chosen based on a balanced set
of markers from both organellar genomes. Thus, this study aims to resolve the
branching order of the major moss clades with high confidence, which is, in
conjunction with further studies on the peristome development, preliminary to
derive a sound hypothesis on the peristome evolution. Furthermore, we fathom
the divergence times and the speciation rates in the represented moss clades
and identify evolutionary shifts in speciation rate over time in order to link the
evolution of mosses with the radiation patterns of the remaining land plants
through time.
23

2. Materials and Methods
2.1 Taxon sampling and marker selection.
Backbone mosses dataset (BM): Initiated by an earlier study by Wahrmund et
al. (2010) we composed an enlarged taxonomic and molecular data set
summarized in Table 1 (appendix). On the one hand we included important
lineages lacking such as the Oedipodiopsida, as well as the second genus of
the Tetraphidopsida (Tetrodontium). On the other hand some genera were
added to cut long branches such as Alophosia or Atrichopsis. In addition,
available data from diplolepideous-alternate mosses such as Tetraplodon
fuegianus, Bryum argenteum, Orthotrichum rogeri. Nyholmiella obtusifolia,
Ptychomnion cygnisetum, Lopidium concinnum, Plagiothecium laetum,
Sanionia uncinata, Hypnum cupressiforme and Brachythecium rivulare was
added. The molecular markers were enriched by adding the trnK(matK) region
(trnK(matK)) containing the complete trnK group II intron and matK coding for
the sole plastid maturase in land plants as well as the rpl16 group II intron and
the trnL group I intron (trnLg1). Moreover, the atpB – rbcL intergenic spacer
(IGS) has been included, either downloaded from genbank or newly sequenced.
Thus, in contrast to previous studies (Cox et al., 2010, 2004; Newton et al.,
2000; Wahrmund et al., 2010), this study predicates on a more balanced and
character rich organellar dataset, i.e. an almost equal amount of plastid and
mitochondrial data as well as lacking representatives from various groups.
Land plant outgroup data set (LP): Reconstructing the chronological evolution
of mosses is a challenging task, since fossils with reliable assignments for
calibration are scarce. Four calibration points from the literature were applicable
to our (moss) taxon sampling, one derived from cryptospores from the Himatian
(Sporogonites spp., Halle, 1916; Kenrick and Crane, 1997; Rubinstein et al.,
2010, and three from fossilized plant organs (Campimirinus riopretensis,
Christiano De Souza et al., 2012; Krassiloviella limbelloides, Shelton et al.,
2016; Merceria augustica, Smoot and Taylor, 1986). To overcome this poor
fossil record, we rooted our dataset with a comprehensive outgroup containing
24

a representative sampling of all streptophyte lineages. We included 8
streptophyte algae, 15 liverwort, 69 moss (~BM dataset), 3 hornwort, 3
lycophyte, 25 fern, 29 gymnosperm and 48 angiosperm species (see Table 2,
appendix). In addition to the six plastid and five chondrome markers in the BM
dataset, we added an outgroup set of four additional plastid markers (psaA,
psbB, rrn23S, rrn16S) and completed three markers already used to provide
overlap. The sequences were mostly harvested from whole plastid genomes
deposited at GenBank, few were downloaded as single marker sequences. The
whole concatenated set had an overall length of 28,464 aligned positions.
2.2. DNA Isolation, Amplification & Sequencing
DNA extraction from fresh or silica dried plant tissue was either done using the
NucleoSpin® plant DNA kit (Macherey-Nagel, Düren, Germany). DNA
amplification was carried out by PCR using published primer sets and
amplification protocols. Amplification of the mitochondrial regions followed
Wahrmund et al. (2010, 2009), for rpl16 Olsson et al. (2009), for trnLF Quandt
and Stech (2004), for atpB–rbcL Chiang et al. (1998), Stech and Wagner
(2005), for rbcL (Cox et al., 2000; Hasebe et al., 1994) and for trnK(matK)
Wicke and Quandt (2009). In the case of trnK(matK) we substituted the reverse
primer trnK-R4 with psbARbryo. Due to the length of trnK(matK)-psbA and the
high sequence variation of the region lineage specific internal sequencing
primers were designed (Table 03, appendix). Amplicons were separated on
1.2% agarose gels and subsequently purified with Macherey-Nagel's
NucleoSpin Extract II kit. Sequencing was carried out at MacroGen (Seoul,
South Korea).
2.3 Contig Assembly, Sequence Alignment & Indel Coding
Sequences assembly and alignment was done in PhyDE (Müller et al., 2005),
using the already existing scaffold alignments for the different markers
(Wahrmund et al., 2010) Manual alignment followed the motif alignment rules by
Kelchner (2000).
25

Simple sequence repeats were isolated based on strict motif recognition, thus
overlapping motifs that superficially contained identical motifs but deviated in
length were considered non-homologous if the motifs could be derived
independently from the adjacent region (compare tab. 4 in Quandt & Stech
2005; Kelchner 2000). Following the approach in (Quandt and Stech, 2003) and
(Quandt and Stech, 2005, 2004), the data matrix was screened for inversions
using secondary structure models calculated with RNAstructure 5.8.1 (Reuter
and Mathews, 2010). Detected inversions were positionally separated in the
alignment. As discussed in (Quandt and Stech, 2004, 2003), presence or
absence of detected inversions was not coded for the phylogenetic analyses.
However, in order to gain information from substitutions within detected
inversions, a second alignment file for the phylogenetic analyses was generated
with the inversions included as reversed and complemented sequences.
Regions of ambiguous alignment (hotspots) were excluded from phylogenetic
analyses. Hotspots definitions follow Olsson et al. (2009). Alignments are
available from the authors on request.
2.4 Phylogenetic Inference
In tentative analyses we compared the effect of different partitioning schemes
and did not observe any significant difference in topology and support, thus we
partitioned both datasets by marker in all analyses.
A series of rapid bootstrap inferences with 10,000 replicates and subsequent
ML search was conducted in the PThreads version of RAxML-HPC 8.2.7
(Stamatakis, 2014), compiled with the AVX extension on a 64bit linux server.
The bootstrap inference used the GTRCAT approximation of rate heterogeneity
with 25 distinct rate categories for nucleotide data and the accordant BINCAT
model for binary data. In the final tree search, the tree scores and optimizations
were evaluated under the GTRGAMMA model for nucleotides and the
BINGAMMA model for binary characters. Bayesian Inference was conducted in
the MPI version of MrBayes 3.2.6 (Ronquist et al., 2012) using the GTR model
with gamma distributed substitution sites and a proportion of invariant sites for
26

10 Mio. generations and 4 runs with 4 metropolis-coupled markov chains each.
The heating parameter were set to a default value of 0.1, results from the cold
chain was sampled every 1000th state. Convergence of all four runs was
checked with tracer v1.6 (Rambaut et al., 2014). The consensus tree was
calculated discarding the first 25% as a burn-in fraction.
2.5 Topology testing
Recent studies using different markers from other cellular compartments found
different topologies with considerable support. The most striking incongruence
occurred, when topologies from analyses using mitochondrial markers are
compared to those inferred from plastid markers. Topology testing of alternative
phylogenetic hypotheses were performed based on the per-site log likelihood
scores for each topology with model parameters re-estimated for each tree
obtained in RAxML. To indicate the significance of the alternative tree
topologies at an α=0.05 level against the background of the whole concatenated
nucleotide matrix, the P-values of the approximately unbiased test (au-test,
Shimodaira, 2002) and the Shimodeira-Hasegawa test (sh-test) were calculated
in CONSEL v0.20 (Shimodaira and Hasegawa, 2001). We inferred the
significance of alternative topologies (tests 2-6) and for comparison the
unaltered topology (test 1) from combined analyses in figure 10.
2.6 ILD, LRT: topology vs branch length congruence
Congruence of the plastid markers partition against the mitochondrial markers
partition is tested via the incongruence-length difference test (ILD, Farris et al.
1995) implemented in PAUP 4.0a152 (Swofford, 2003) and the likelihood-ratio
test (LRT) based hierarchical clustering method implemented in Concaterpillar
(Leigh et al., 2008). In both, the ILD and LRT test, the resulting p-values are an
indicator, that we can reject the hypothesis of homogeneity at a given α=0.05.
The implementation of the LRT test in Concaterpillar allows testing the
27

congruence of the topology and the compatibility of branch length in the tree
separately.
2.7 Tree editing and visualization
Phylogenetic trees were compiled and visualized in TreeGraph 2.3.0-425 beta.
Nodes with less than 0.5 posterior probability resp. 50% bootstrap support are
collapsed. Chronograms and phylorate plots were visualized using the R-
packages phyloch (Heibl, 2013) and BAMMtools (Rabosky, 2014). A tanglegram
comparing the topologies obtained by the mitochondrial or plastid data sets was
plotted using the R package dendextend (Galili, 2015).
2.8 Divergence dating with r8s and BEAST
All markers in the LP dataset were concatenated to obtain a supermatrix that
was used to infer a topology with sufficient node support in RAxML and
MrBayes (Figure 25, appendix). The topology from ML - congruent with BI - was
used to estimate divergence times in relaxed clock node dating in r8s
(Sanderson, 2003) and as a constraint topology in BEAST 1.8.3 (Drummond et
al., 2012). To overcome convergence issues and to increase the compatibility of
the data sets, all (highly) incompletely represented markers were excluded prior
to starting the BEAST sampling runs. This resulted in a limited set of 4 markers
– matK, rbcL, rps4 and trnL core – in total 5620 aligned positions.
In both Analyses, we used the same set of calibration points spanning 43
reliable fossils from all included groups and one estimated calibration point
concerning the putative split of streptophyte and the chlorophyte algae, in this
analysis this point defines the age of the root node (Hackett et al., 2007).
r8s: We used a relaxed clock approach implemented in r8s 1.80 (Sanderson,
2003). The ML topology with substitution rates was used to infer absolute rates
and ages of nodes using the semiparametric penalized likelihood method, the
optimal values of the smoothing parameter was determined via cross-validation.
To get substitution rates for the root node, the outgroup (streptophyte algae)
was pruned. All fossil calibrations were implemented as a minimum constraint in
28
r8s, only the age of the angiosperm crown group was implemented as a
maximum.
BEAST: As in MrBayes, we implemented the GTR model for nucleotide
substitution rates with a proportion of invariant sites and gamma distributed site
rate variation with four distinct gamma categories. The clock model was an
uncorrelated relaxed clock with log-normal distribution of rate variation. The tree
prior was a birth-death speciation model (Gernhard, 2008) with a constrained
topology. Clock model and tree priors were linked across the four sites,
parameters of the substitution model were estimated for each marker
separately. Node calibrations were modeled as lognormal distributed constraints
with a standard deviation of 0.5 in most cases or 1 in case of the estimated age
of the root. (Table 4 in appendix)
2.9 Modelling speciation rate heterogeneity
To test the level of heterogeneity in diversification rates at class/ordinal level in
the tree, a speciation analysis was performed on the pruned mosses
chronogram from the BEAST analysis using BAMM 2.5.0 (Bayesian Analysis of
Macroevolutinary Mixtures) and BAMMtools 2.1.4 (Rabosky, 2014). To account
for incomplete taxon sampling, we compiled a summary of known species per
clade and used this data as an estimator for clade specific sampling
probabilities. (Table 5 appendix) The global sampling fraction was set to one
assuming monophyly of the moss lineages and having approximately all taxa of
extant mosses enlisted. The initial priors were proposed by the function
“setBAMMpriors” in BAMMtools.
The aim is to find the best distinct rate shift configuration from a landscape of
possible shift configurations that differ in count and position of shifts. BAMM
samples such sets of rate shift configurations with the help of a Markov chain in
a Bayesian framework and computes the joint probability of a configuration of
possible rate shifts. After the best rate shift configuration is found, we calculate
the clade specific speciation rate and its corresponding background rate – that
is the speciation rate of the tree excluding the respective clade – for each
identified rate shift position. Additionally, the frequencies of shift counts for all
29

samples in this run were summarized and their posterior probability calculated.
Four independent runs with four Markov chains each were conducted for 10
Mio. generations and sampling every 10.000th state. After checking for
convergence of the runs via the R-package “coda” (Plummer et al., 2006), we
analyzed and plotted the results from the BAMM runs in BAMMtools. To check
for hypersensitivity of the γ-prior (expected number of frame shifts), we
conducted a series of runs with increasing γ values; 2, 5, 10, 100. We tested the
significance of differences of the resulting posterior distribution via a one way
analysis of variance (ANOVA).
3. Results
3.1.0 Alignments
BM: The final concatenated alignment comprises 69 Taxa and 15922 characters
after exclusion of hotspots and reverting of inversions, 42.5% of which are
variable, 27% sites are parsimony informative (pi). Overall GC-content is 32.8%.
The mitochondrial markers partition covers 7,259 characters, with a mean
sequence length of 5,926 nucleotides per taxon (SD 370.941). 39.9% of the
aligned positions are variable, 22.9% are parsimonious informative. The GC-
content was 38.5%. The combined plastid markers alignment has a length of
8,663 characters and a mean sequence length of 5,473 nucleotides (SD
126.25). 45.1% of the aligned positions are variable, 32.3% are parsimonious
informative. The GC-content was 26.7%
LP: The bigger dataset included total 200 taxa from all known Streptophyte
plant lineages. The supermatrix comprised 28,760 character positions, the
mean sequence length 11,898 (SD 2,705). The reduced LP dataset (rbcL,
matK, rps4, trnL(core)) comprised 5677 character positions, a mean sequence
length of 3,338 nucleotides (SD 453.63).
30

3.1.1 Backbone phylogeny of mosses
We obtained an unequivocally resolved and well-supported backbone tree, only
a few nodes are not fully supported by more than 95%. The outgroup phylogeny
obtained by LP data resolved all major land plant clades with sufficient support
with liverworts being the first branching lineage, sister to all other land plants.
Mosses branch next, followed by hornworts and vascular plants. Figure 8 shows
the phylogeny with ML and BI support values plotted at each node, including
indelcoding (above) or excluding indelcoding (below) each branch.
31
1 100
1 100
1 100
1 100
1 100
1 100
1 91
0.9 70
1 100
1 100
1 100
1 100
1 100
1 100
1 100
1 92
1 100
1 100
1 85
1 85
1 100
1 100
0.91 50
0.88 44
0.97 [43]
0.94 [50]
1 91
1 76
1 100
1 100
1 99
1 99
1 100
1 100
1 100
1 100
1 100
1 100
1 100
1 100
0.55 60
0.67 82
1 99
1 98
0.75 89
0.76 84
1 96
1 95
1 99
1 99
Pterogonium gracileThamnobryum alopecurumHypnum jutlandicumBrachythecium rivulare
1 100
1 100
1 100
1 100
1 99
1 97
Hygrohypnum ochraceumSanionia uncinataScorpidium scorpioidesTomentypnum nitens
1 98
1 96
Herzogiella seligeriPlagiothecium laetumFontinalis antipyreticaLopidium concinnumPtychomnion cygnisetumAulacomnium androgynumOrthodontium lineare
1 100
1 100
1 96
1 99
Orthotrichum rogeriNyholmiella obtusifoliaUlota crispa
1 100
1 100
1 100
1 100
Mnium hornumPohlia nutansBryum argenteum
1 100
1 100
Bartramia hallerianaPlagiopus oederi
1 100
1 100
Hedwigia ciliataRhacocarpus purpurascens
1 100
1 100
Tetraplodon fuegianusSplachnum ampullaceum
1 100
1 100
1 96
0.99 91
1 99
1 97
1 100
1 100
0.99 63
0.96 58
1 100
1 100
1 97
1 91
1 100
1 100
1 99
1 97
1 100
1 100
1 98
1 94
Tortula latifoliaPottia truncataCinclidotus ripariusCeratodon purpureusDitrichum cylindricumSchistostega pennata
1 98
1 92
Orthodicranum montanumFissidens cristatusLeucobryum glaucum
1 100
1 100
1 100
1 100
1 100
1 100
Coscinodon cribrosusGrimmia donnianaRacomitrium lanuginosumBlindia acutaDrummondia prorepensTimmiella specCatoscopium nigritum
1 100
1 100
1 100
1 100
Timmia norvegicaTimmia austriacaTimmia bavarica
1 100
1 100
1 94
1 90
1 100
1 100
Encalypta streptocarpaBryobrittonia longipesDiscelium nudum
1 100
1 100
1 100
1 100
Physcomitrella patensPhyscomitrium pyriformeFunaria hygrometrica
1 100
1 100
1 100
1 100
Chamaebryum pottioidesOedipodiella australisGigaspermum repensDiphyscium sessileBuxbaumia aphylla
1 100
1 100
Tetraphis pellucidaTetrodontium brownianum
1 100
1 100
1 100
1 100
1 86
1 85
1 100
1 100
0.97 64
0.7 55
Pogonatum urnigerumOligotrichum hercynicumAtrichum undulatumAtrichopsis compressusDawsonia specAlophosia specOedipodium griffithianumAndreaea nivalisSphagnum capillifoliumTakakia lepidozioides
Polytrichopsida
Tetraphidopsida
Dicranidae
Bryidae
Timmiidae
Funariidae
Gigaspermidae
OedipodiopsidaAndreaeopsidaSphagnopsidaTakakiopsida
DiphysciidaeBuxbaumiidae
Bry
opsi
da
Figure 8: Phylogeny of all extant moss lineages with BI (left values) and ML (right values) support. Values above the branch are inferred by the datasets with indel coding (Simmons and Ochoterena, 2009), those below the branch are inferred without indel coding.

LP-Data identified with confidence via BI and ML analyses that Sphagnum and
Takakia constitute the first branching lineages, sister to all other mosses. A
sister relationship between these two is only significantly supported by Bayesian
inference. The next branching taxon is Andreaea, followed by Oedipodium and
the peristomate mosses. Among peristomate mosses, the Polytrichopsida
branch first followed by Tetraphidopsida, which are sister to the arthrodontous
mosses and render the nematodontous mosses paraphyletic.
The arthrodontous mosses form a well-supported clade with the aperistomate
Buxbaumiidae and Diphyscidae as the first branching lineages. The
Gigaspermidae are sister to the diplolepideous-opposite Funariidae, which in
turn are sister to the Timmiidae. The Timmiidae finally are sister to the
haplolepideous Dicranidae and the diplolepideous-alternate Bryidae.
The position of the Tetraphidopsida in relation to the Polytrichopsida varies
depending on the organellar origin of the data. When using mitochondrial
sequences only, Tetraphidopsida together with the Polytrichopsida form a
significantly supported clade that is sister to the Bryopsida. When using plastid
markers or a (balanced) combination of mitochondrial and plastid sequences,
the Tetraphidopsida resolve as sister to the Bryopsida with high support in BI
and medium support in ML analyses.
While in analyses based on the plastid or the combined data set, the
aperistomate Gigaspermidae form a clade sister to Funariidae, Timiidae and the
remaining Bryopsida with maximum support, in mitochondrial analyses we find
the Timmiidae sister to the Gigaspermidae which in turn are sister to the
Bryidae. The latter topology has only insignificant support.
As expected, the first branching Taxa in the Bryopsida are the Buxbaumiidae
followed by the Diphysciidae with high support in all analyses.
32


3.1.2 Testing the congruence of plastid and mitochondrial data
In direct comparison, topologies obtained from each organellar compartment,
i.e. plastid versus mitochondrial data are clearly incongruent in some important
nodes. The most striking difference concerns the position of the Timmiidae, the
Gigaspermidae and Tetraphidae (see Figure 9) . When testing the congruence
of the plastid and mitochondrial data via ILD test, the calculated p-value was
p=0.001, indicating that at α=0.05 level, we should reject the congruence
assumption. At the same time, the LRT test found a raw p-value of 0.58 and a
Weibull-smoothed p-value of 0.592125 in the topological congruence test, but
p=0.0000 in the branch length compatibility assessment.
3.1.3. Topology tests
Topology testing suggests that only the alternative hypotheses c)
Gigaspermidae sister to Bryidae and d) Timiidae sister to Gigaspermidae and
these sister to Bryidae can be rejected at the confidence level of α=0.05.
Hypothesis b) however Timmiidae sister to Bryidae is favored by a strong
phylogenetic signal from the mitochondria and cannot be rejected.
Table : Topology tests comparing original and alternative topologies against the concatenated alignment
No. description of the topology AU SH
1 original Topology 0.695 0.936
2 Timmiidae sister to Bryidae 0.247 0.649
3 Gigaspermidae sister to Bryidae 0 0
4 Timmiidae sister to a Gigaspermidae and Bryidae 0 0
5 nemantodontous monophyly; i.e. Polytrichopsida sister to Tetraphidopsida,
both sister to arthrodont mosses
0.499 0.778
6 Tetraphidopsida branching first, i.e. Tetraphidopsida sister to Polytrichopsida & Bryopsida
0.051 0.565
34

3.2 Divergence Dating
Divergence times estimations are presented as a chronograms in figures 23
(BEAST) and 24 (r8s), a pruned chronogram obtained from BEAST analyses
that includes only the mosses, is a component of the phylorate plot in figure 11.
The crown node of the Bryophytina is dated at a mean age of 414 [395.8 –
433.5 95% HPD] mya. Diversification of all Bryopsida classes happen within the
Carboniferous (358.9 – 298.9), all other classes originate in the Devonian
(358.9 – 419.2). The Pybus Harvey (Pybus & Harvey, 2008) gamma statistic
calculated from this chronogram is -0.99. A two tailed test on the null
hypothesis, that the tree exhibits a constant rate of diversification yielded a
value of p=0.32, clearly rejecting the constant rate of diversification at the
α=0.05 (for one sided tests) and the α=0.10 (for two-sided tests).
35
SphagnopsidaTakakiopsidaAndreaeopsidaOedipodiopsidaPolytrichopsidaTetraphidopsidaBuxbaumiidaeDiphysciidaeGigaspermidaeFunariidaeTimmiidaeDicranidaeBryidae
SphagnopsidaTakakiopsidaAndreaeopsidaOedipodiopsidaPolytrichopsidaTetraphidopsidaBuxbaumiidaeDiphysciidaeGigaspermidaeFunariidaeDicranidaeTimmiidaeBryidae
SphagnopsidaTakakiopsidaAndreaeopsidaOedipodiopsidaPolytrichopsidaTetraphidopsidaBuxbaumiidaeDiphysciidae
Gigaspermidae
Funariidae
DicranidaeTimmiidae
BryidaeTest 1 (original) au: 0.695 sh: 0.936
Test 2 au: 0.247 sh: 0.649
Test 3 au: 3e-73 sh: 0
SphagnopsidaTakakiopsidaAndreaeopsidaOedipodiopsidaPolytrichopsidaTetraphidopsidaBuxbaumiidaeDiphysciidaeFunariidaeDicranidaeTimmiidaeGigaspermidaeBryidae
SphagnopsidaTakakiopsidaAndreaeopsidaOedipodiopsidaPolytrichopsidaTetraphidopsidaBuxbaumiidaeDiphysciidaeGigaspermidaeFunariidaeTimmiidaeDicranidaeBryidae
SphagnopsidaTakakiopsidaAndreaeopsidaOedipodiopsidaTetraphidopsidaPolytrichopsidaBuxbaumiidaeDiphysciidaeGigaspermidaeFunariidaeTimmiidaeDicranidaeBryidae
Test 4 au: 3e-129 sh: 0
Test 5 au: 0.499 sh: 0.778
Test 6 au: 0.051 sh: 0.565
Figure 10: Topology tests, results from these tests are presented in table 1 and below each tree. Altered branches are indicated in red. Result

3.3 BAMM Analyses
All chains converged quickly within the first 10 mio. generations, so 25% were
discarded as a burn-in, effective sampling sizes exceeded 1000 for the log-
likelihood and number of shift events in each sample.
The 95% credible set of rate shift configuration contains 191 distinct
configurations, the frequency of each rate shift count observed during the
simulation posterior is shown in table 2.
Table 1: Posterior probability of each rate shift count observed during the runs.
No. of Shifts 2 3 4 5 6 7 8 9
Posterior probability 0.037 0.082 0.230 0.160 0.180 0.150 0.086 0.041
Table 3 shows the nine shift configurations with the highest posterior probability.
The core shifts are distinguished by the marginal odd ratio from the non-core
shifts. The marginal odds provide an estimated rate shift density on a given
branch rather than the marginal probability for one or more shift events on that
branch. In this analysis, the shift configuration with the highest posterior
probability has 4 core shifts. The first shift occurred at a branch within the
Dicranidae in the end of the lower Jurassic (~174 mya). The second shift
occurred at the branch leading to the Hypnales after the split Hookeriales –
Hypnales during the late lower Cretaceous. The third shift occurred within the
Polytrichales in the early upper Cretaceous, after the split of Alophosia and the
rest of the Polytrichales. The last shift of this set lies on the branch leading to
the Orthotrichiales, dating back to the late upper Cretaceous. Figure 20
(appendix) depicts the estimated speciation rate through time and the relative
difference in speciation rate between the clade specific rates and the
background rate, which is the speciation rate of the tree lacking the respective
clade.
36

Table 2: List of the nine shift configurations with the highest posterior probability. In Figure 19 (appendix) the corresponding 3x3 plot of these shift configurations on their respective phylorate plots are presented.
rank Probability Cumulative # core shifts
1 0.235435275 0.2354353 4
2 0.125983202 0.3614185 5
3 0.118917478 0.480336 5
4 0.095853886 0.5761898 4
5 0.066657779 0.6428476 4
6 0.047327023 0.6901746 4
7 0.041594454 0.7317691 3
8 0.035195307 0.7669644 3
9 0.024930009 0.7918944 3
Table 3: The mean speciation rate for all clades with an estimated core shift event and their background speciation rate. A corresponding graphical presentation is in figure 20 (appendix)
Core shifts at clade
Clade specific diversification rate
5% quantile
95% quantile
Background rate
5% quantile
95% quantile
Bryophytina 0.0511 0.0352 0.0730 - - -
Hypnales (core) 0.1901 0.0973 0.3458 0.0399 0.0265 0.0597
Dicranidae 0.1125 0.05711 0.19939 0.0423 0.0278 0.0644
Polytrichopsida 0.0764 0.0165 0.1646 0.0502 0.0342 0.0726
Orthotrichiales 0.0636 0.01760 0.1310 0.0507 0.03451 0.0731
37


4. Discussion◄
The results from the two congruence tests seem to be contradictory at first
sight, but the failing ILD and branch length compatibility test on the one hand
and the significant topological congruence in Leigh's LRT test on the other both
strongly suggest a decoupled profile in changes of substitution rates in both
organelles during the early evolution of mosses. The topological congruence
however is evident. As figured out in simulations by Barker and Lutzoni 2002,
the ILD test can be – under certain biologically realistic conditions such as
heterotachy (disparate substitution rates in a site between taxa) – rejected as
an unbiased measure of phylogenetic congruence (Darlu and Lecointre, 2002;
Dolphin et al., 2000; Graham et al., 1998; Yoder et al., 2001). Especially
heterogeneity in substitution rates among taxa and clades, such as those found
in our BAMM analyses and the significant p-value of the Pybus gamma test,
seem to be not detectable by ILD. Therefore, prediction of compatibility based
on ILD tests alone may be inappropriate in this study, but may serve as an
indicator of incongruent evolutionary dynamics in or inheritance of plastids and
mitochondria during the evolution of mosses (compare Liu et al., 2011).
At the deep level nodes, we find all the monogeneric classes that do not - and
probably never did – posses a peristome, hence the peristome is again
identified as a secondary (derived) characteristic of peristomate mosses,
achieved in one event before the split of the Polytrichopsida and the
Tetraphidopsida during the upper Devonian approximately 358 to 382 mya.
◄Figure 11: Pruned Chrongram of the bryophytina clade colored by the rate of speciation, estimated in BAMM. Legend of the speciation rates corresponding to the branch colors in the lower right. Error bars showing the 95% HPD interval drawn in red. Placement of rate shift configuration with the highest probability of 0.13: 4 core rate shifts, depicted by red circles. Bars on the right hand side show species richness in each clade, refer to table 15 for details. Takakio. = Takaiopsida, Sphagn. = Sphagnopsida, Andrea. = Andreaeopsida, Oedipod. = Oedipodiopsida, Polytrich. = Polytrichales, Tetraphid. = Tetraphidales, Buxbau. = Buxbaumiidae, Diphysc. = Diphysciidae, Gigasperm. = Gigaspermales, Catoscop. = Catoscopiales, Timiell. = Timiellales, Scouler. = Scouleriales, MADP = Mitteniales+Archidiales+Dicranales+Pottiales (nested in Dicranales), Splachn. = Splachnales, Hedwig. = Hedwigiales, HeBa. = Helicophyllales+Bartramiales, Bry. = Bryales, Ortho. = Orthotrichales, Orthod. = Orthodontiales, Aula. = Aulacomniales, Ptych. = Ptychomniales, Hooker. = Hookeria.
39
Takakiopsida and Sphagnopsida share little morphologic similarities, but most
analyses from all three genomes (Cox et al., 2004; Newton et al., 2000; Qiu et
al., 2006) are resolved as a sister relationship of these two classes, or are at
least presented as such, when no outgroup is present (Beckert et al., 2001).
Our dating analysis is generously rooted by a representative phylogeny of all
streptophyte groups and shows this clade as well with maximum support in BI
but low support in ML analyses, which may reflect a common phylogenetic
artifact (Goffinet and Buck, 2004).
The paraphyly of the nematodontous mosses, the Polytrichopsida and the
Tetraphidopsida renders the nematodont peristome a paraphyletic feature which
is likely to be the plesiomorphic state for all peristomate mosses (sensu Mishler
and Churchill, 1985). However, the alternative assumption of monophyly among
nematodontous mosses cannot be rejected via topology tests. Additionally, the
support for the node placing the Tetraphidopsida sister to the Bryopsida is only
significant in the BI analysis including indel coding.
Peristome teeth from haplolepideous mosses are homologous to the
endostome of diplolepideous mosses (Magombo, 2003). The peristomes in
Buxbaumiidae and Diphysciidae are clearly arthrodontous, since they are cell
wall remnants. But as their endostome is not divided into teeth, segments or
cilia, and in Buxbaumiidae, the peristome (->exostome) is associated to a
structure called pseudoannulus (Grout, 1903) or parastome (Edwards, 1984)
lying exterior to the exostome, their homology to the diplolepideous peristome
has been controversially discussed (Edwards, 1984; Magombo, 2003; Shaw et
al., 1987; Taylor, 1962; Vitt, 1984). Additionally, the peristome in Diphysciidae is
lacking a parastome and if present, the exostome is only rudimentary (Shaw et
al., 1987). Diphysciidae and Buxbaumidae have been considered to be closely
related (Brotherus, 1924; Crosby, 1980; Vitt, 1984), and developmental studies
in Diphyscium foliosum suggest a closer relationship to haplolepideous rather
than nematodontous mosses (Shaw et al. 1987). In fact, it is now considered as
an intermediate type between these two groups (Shaw et al., 2011; requires
more studies) which is nicely reflected in the phylogenetic reconstructions.
40

All speciation shifts occurred during the Cretaceous except for the shift in the
Dicranidae which occurred considerably earlier in the upper Jurassic. The
placement of the shifts at a certain time point om a branch should be carefully
interpreted due to uncertainties arising from the complexity of evolutionary
41
dynamics. However, we can not observe any correlation between the rise of a
clade with a unique peristome type and the presence of speciation rate shift.
The most influential speciation rate shift is located on the branch leading to the
so called core pleurocarpous mosses (Hypnales, Figure 11), the most species
rich moss lineage that diversified quite late in the upper Cretaceous. In this
lineage, the speciation rate trebled during the cretaceous, which supports the
assumption of rapid radiation in pleurocarpous mosses also found in Shaw et al.
(2003).
Pleurocarpous mosses contain many species that grow epiphytically, e.g. as
mats on branches and patches on tree trunks. The speciation rate over time plot
of the core pleurocarps (Figure 11) shows an important shift in speciation rate at
the boundary of the lower to the upper Cretaceous (100 Mya), while significantly
lowering the background speciation rate without that clade (Figure 20). Earlier
and weaker, the second core shift in the Dicranidae occurs in middle Jurassic
(174 -164 Mya) and has a considerably lower influence on the background
speciation rate. The core speciation shift in the hypnalean clade resembles
findings from recent studies by Fiz-Palacios et al. (2011) and Laenen et al.
(2014). Species richness in the core pleurocarpous mosses as a result of either
increased speciation rate or decreased extinction rate (Silvestro et al., 2015) is
found to be dependent on the diversification of the angiosperms in the
Cretaceous (Schneider et al., 2004).
Rather than simply supersede other lineages that were previously dominating
the ecosystems (sensu “sequential replacement hypothesis”, (Kenrick and
Crane, 1997; Laenen et al., 2014; Niklas et al., 1983), the Angiosperms, after
evolving from specialists in wet and disturbed habitats to dominant arborescent
species by the end of the Cretaceous (Feild et al., 2004), created new nutrition
rich ecosystems by changing their environment and the local climate itself
(Boyce et al., 2010, 2009). These new habitats in complex angiosperm woods
were then colonized by certain moss species and polypod ferns (Schneider et
al., 2004; Shaw et al., 2003). This hypothesis is referred to as shadow of
angiosperms hypothesis (Laenen et al., 2014; Schneider et al., 2004;
Schuettpelz and Pryer, 2009), which is a likely explanation in the case of the
42

pleurocarpous mosses and coincides with a shift in life form from terrestrial to
epiphytic (compare Huttunen et al., 2012).
Considerably earlier, at the lower to Jurassic (201 – 174 Mya), the second core
frame shift occurred within the Dicranidae after the split of Drummondia and
before the split of Grimmiales and the rest of the Dicranales. This might be an
effect of increased radiation in the Triassic-Jurassic in the recovery phase of the
late Triassic mass extinction event (Tr-J; ~200 mya) (Jablonski, 2005; Niklas et
al., 1983; Raup and Sepkoski, 1982). Four of the five major extinction events
have been reported to significantly influence plant species divergence during
Paleozoic and Mesozoic (Jablonski, 2005). In a study on ancient vascular plant
species diversity by Silvestro et al. (2005), based on mining fossil databases,
rates of origination and extinction before and after such events were compared.
It was found that the origination of gymnosperms decreased significantly, while
spore bearing plants had a decent increase in origination.
Diversification studies on plant fossil tend to suffer from uncertainties such as
unclear or uncertain species identification, fossil record from different plant
organs of the presumably same species or general effects that would bias such
studies (Silvestro et al., 2015). There is also a known discrepancy between the
record of macrofossils and sporomorph fossils during the Triassic-Jurassic
mass extinction event that was explained by an extinction emphasis on plant
species with specialized reproductive biology, e.g. insect pollinated plants. Mass
extinction events with negative effect on the pollinator directly affects the
diversity of the pollinated species, but may have a positive effect on the
diversity of pollinator independent species (Mander et al., 2010). However,
since mosses have a quantitatively negligible fossil record that was not
considered in that study, these conclusions are based solely on early vascular
plants but should be alienable on mosses.
Speciation rate shifts seem to be independent from the occurrence of the major
peristome types. The evolution of a new peristome type could not be identified
as a key innovation that would significantly increase the speciation of the
descendants. In fact, all peristome types evolved in a narrow time scale, but the
relevance of their benefits if any, e.g. in regulation of spore dispersal, should
43
turn out to be important much later. We found evidence for four speciation rate
shifts, but in a temporal context, these shifts do not correlate with the rise of the
peristomial types, which indicates the importance of peristomes as an
environmentally somehow unaffected character for phylogenetic classifications.
More influential than the peristome is the occurrence of pleurocarpy that might
be a beneficial trait in the evolution of the Hypnales which contain a high
percentage of epiphytic species, especially in the tropical cloud forests.
This study yields an outstandingly supported tree hypothesis resolving the
backbone phylogeny of all extant moss lineages with significance. Divergence
time dating indicates an early evolution of all extant peristome types during the
Carboniferous. Shifts in diversification however occurred much later in the
Jurassic and Cretaceous.
Combining nucleotide data from different organelles or the nucleus may
sometimes bear the risk of combining incongruent data. Reasons for incongruity
can be horizontal gene transfer, incomplete lineage sorting or early hybridization
events during the radiation of early moss clades in the Devonian and
Carboniferous (419.2 to 298.9 mya). Preceding studies already revealed very
short branches especially in the earliest divergences within the bryopsida
(Volkmar and Knoop, 2010; Wahrmund et al., 2010). In this study, the
congruence of topology is tested via the LRT (Leigh et al., 2008) and it is found
significant at the α=0.05 level. The ILD test and the branch length assessment
via the LRT, however, revealed significant incongruence between both
partitions. Rather than a true incongruence resulting from different history of
plastids and mitochondria, this points to a high level of disparity in plastid and
mitochondrial substitution rates in the early evolution of mosses. This can be
observed by eye when looking at the ratograms of the mt and the cp trees
(Figures 21 & 22, APPENDIX). Here, we do not only observe overall higher
substitution rates in the cp tree, but also proportionally longer branches at basal
splits within the Bryopsida in the cp tree that have almost no branch length in
the mt tree and scarce support as well.
44

Note on the controversy upon BAMM
The author(s) are aware of the debate on the reliability of BAMM (Moore et al.,
2016), that came up shortly after completion of this paper. Two issues were
addressed by Moore et al., firstly concerning the negligence of the possibility of
diversification rate shifts in extinct lineages and thereby an incorrect likelihood
calculation and secondly the extreme sensibility to arbitrary prior assumption of
the cpp prior model. In a response to these objections, Rabosky et al.
(2017) clarified these points as either irrelevant for empirical studies, or the
result of using undocumented functions of the program. On submission of this
paper, no alternative method with approximately the same functionality like the
ability to account for the number of species per clade that are not sampled. This
feature enables inference of speciation and extinction rates on data sets like the
one used in this study at all. As we do not have alternative methods to compare
the results, we consider this method as useful and carefully interpret the output
as tendencies with an associated probability.
To test for the disproportionate influence of the expectedNumberOfRates prior,
we repeated the analyses with a range of different priors [1,2,5,10,100]. The
most influential frame shifts were always recovered, furthermore the same three
highest ranking rate shift configurations were always recovered (see table 16,
appendix). So far, we assume that results from our dataset are correct.
45

Chapter 3: Phylogenetic structure (RC, RC,fix, RC,fix(S)) of
organellar markers
Abstract. A quantitative measure for effective phylogenetic signal is crucial for
selecting the right set of markers for phylogenetic reconstructions. Even in times
of ever-increasing availability of whole genome data from flourishing next
generation sequencing on a few representative taxa, knowledge about the
performance of each marker employed in a phylogenetic study in a
comprehensive rich taxon sampling remains important. Constitutive on a
method proposed by Müller et al. 2006, which allows to directly compare
phylogenetic structure between markers by a re-sampling strategy, we expand
the concept of phylogenetic structure R to address additional questions about
the distribution and congruency of phylogenetic structure in a marker or partition
and a given tree. If the input tree is a chronogram we can also test for temporal
gradients in phylogenetic structure of a marker as a trend to resolve preferably
either deep level or shallow level relationships. This widened concept was
applied in a study that directly contrasts the performance of mitochondrial
markers against plastid markers from 69 representative species from all classes
of extant moss species.
Keywords: Phylogenetic structure; phylogenetic gradient analysis;
Introduction
The increasing availability of genomic data derived by continuously improving
sequencing techniques offers enthralling insights into the evolution of genomes
and their organization (Eisen, 1998). More than just a spin-off, phylogenetics
can now use genome wide surveys to resolve species trees, spawning the new
area of phylogenomics. The benefits from genome wide data assemblies are at
46

hand, as statistical precision in multi locus studies should increase with
accumulated data, although increasing precision through sample size does not
inevitably increase accuracy (e.g. Rannala and Yang 2008). Nevertheless, a
glut of whole genomes derived via diverse next generation sequencing
technologies and faster computers, lead scientist to compile phylogenomic data
sets with dozens or hundreds of easy to align genes (Betancur et al., 2014;
Blaimer et al., 2015; Philippe et al., 2011; Zhong et al., 2015). What is usually
left out in these approaches are the noncoding and fast evolving regions of the
genomes, as scientists avoid them due to theoretically high levels of homoplasy,
an assumed saturation effect that would superimpose the phylogenetic signal
and the rather time-consuming homology assessment (alignment) caused by
extensive microstructural evolution of noncoding DNA (Bird et al., 2006; Blaimer
et al., 2015). In line with this background the conventional wisdom on marker
selection in the early days of phylogenetics was that variability and substitution
rates of a marker should match the level of phylogenetic profundity of
relationship between the taxa contained in the study. As a simple rule, marker
with high substitution rates should be used to explore shallow level relationships
only, and deeper taxonomic relationships should only be inferred by highly
conserved regions. Due to a humble fraction of parsimony informative
characters in those regions, one would need lots of sequenced nucleotides,
possibly at the expense of a favorable dense taxon sampling (Zwickl and Hillis,
2002).
In 1998, Olmstead et al. assumed that genes with higher evolutionary rates
might still be useful in deeper level phylogenies, because the higher fraction of
parsimony informative sites may be of superior impact as adequately limited
substitution rates. Later, Källersjö et al. (1999) found that the homoplasy in third
codon positions in a very taxon rich rbcL data set, that would have been
excluded or weighted at a minor level otherwise, could increase the
phylogenetic structure in phylogenetic reconstructions. Finally, Borsch et al.
(2003) showed that a plastid noncoding region, i.e. trnT-F composed of two
intergenic spacers (IGS) and a group I intron could be reliably aligned across
angiosperms. In addition, Borsch et al. (2003) inferred a phylogeny that
congruently reflected multigene reconstructions of basal angiosperms (Graham
47

et al., 2000; Qiu et al., 2005), although only fifth of the sequence data per taxon
was required. The theory of a more equitable distribution of phylogenetic
information due to low selective constraints arose and was tested by Müller et
al. (2006) and Barniske et al. (2012). In the quantitative comparative study on
the backbone phylogeny of Eudicots, Barniske et al. (2012), showed that the
plastid phylogenetic markers used in their study differed significantly in quality
and amount of phylogenetic structure. While markers with conserved genes
performed rather poorly even at deep levels of phylogenetic relationship,
markers including noncoding DNA like group I introns (GI) / group II introns (GII)
and inter genetic spacer (IGS) yielded significantly more phylogenetic structure.
In this study, we aim to investigate the portability of these findings to
a) the second organellar genome of plants: the chondrome and
b) a different and considerably older land plant lineage.
Phylogenies from mitochondrial marker in higher plant groups are rather
uncommon, as an increasing degree of recombination precludes the
establishment of universal phylogenetic markers from orthologs across all
lineages (Grewe et al., 2009; Guo et al., 2016). In contrast to the plastome,
where recombination among angiosperms is rather rare (compare Wicke et al.
2011) the chondrome might even display a highly divergent linear structure
among closely related angiosperm lineages (compare Wang et al., 2012). Since
noncoding regions from the chondrome are not stably present, they are not
targeted at in land plant phylogenetics. And only few studies include mt coding
regions, such as a study by (Qiu et al., 2010) on angiosperms that employed 4
mitochondrial genes. Within early land plant lineages, however, such as
liverworts and mosses, recombination of the chondrome is less frequent, and so
far published genomes are congruent (compare Liu et al. 2011). Another unique
feature of mosses (just like in hornworts) is the availability of established
mitochondrial phylogenetic markers with positionally stable introns and spacer
(Knoop, 2010; Stech and Quandt, 2010), offering the chance to directly evaluate
the phylogenetic structure of selected coding and noncoding markers from both
organellar compartments at the same time in one of the oldest land plant
48

lineages, i.e. mosses. This would extend the power of phylogenetic
reconstructions using noncoding DNA to almost 450 MY.
Additionally, we calculate the phylogenetic structure in each marker or partition
against a given topology to test the agreement of the marker and the inferred
species tree. Finally, we test for a temporal gradient of phylogenetic structure on
a chronogram as a correlation between node support and divergence times.
Material and Methods
Dataset: In this study, the dataset from chapter 2 was used comprising a multi-
marker alignment containing 4 mitochondrial and 5 plastid markers from 69
moss taxa representing all major lineages of the Bryophyta. The mitochondrial
markers contained one group I intron (nad2i156), two group II introns (nad5i753
and cobi420) and one intergenic spacer (nad5-nad4 IGS), all along with their
flanking genes. The plastid dataset contained the sole group I intron residing in
trnL, two group II introns (rpl16 and trnK), one spacer (atpB-rbcL IGS), the
genes rps4, rbcL and matK).
The estimated divergence times from chapter 1, were also used to integrate the
age of the nodes of the constraint phylogeny into the analysis. The ranges of
the markers are defined in a partition file, from which individual exclusion files
are obtained during re-sampling of the compared markers.
Phylogenetic structure RC and RC,fix: Phylogenetic structure of a marker is
identified based on the definition given in Müller et al. (2006). Here, the term
refers to the sum of support across resolved nodes in a tree. The most
characteristic property of this measure is that it is 1 in a completely resolved
and maximally supported tree and 0 on a tree with no support higher than 50%
bootstrap or 0.5 posterior probability, respectively.
The perl pipeline used in this study is an extension of the pipeline used in Müller
et al. 2006 (MBH). Calculation of the statistic phylogenetic structure RC is based
entirely on the definition outlined in MBH, the only exception is the dimension
criterion to which the sizes of the partitions are compared. While MBH
49

compares the number of aligned positions in each marker alignment and
inferred phylogenetic structure per aligned site, we compare the total count of
nucleotides per marker or partition obtaining the phylogenetic structure per
sequenced nucleotide (Barniske et al., 2012)
To compare the phylogenetic structure per sequenced nucleotide (RC) in each
partition, the data from each partition has to be normalized via a re-sampling
process. To achieve this, the total amount of nucleotides in each partition is
calculated first. Then, replicates that match the nucleotide count of the shorter
set are randomly generated from the longer partition in each comparison. The
difference of the mean phylogenetic structure across the replicates and the
phylogenetic structure in the smaller partition is then calculated and presented
for each marker pair, which finally allows to compare the amount of
phylogenetic structure.
Re-sampling and calculations are processed in a perl pipeline that iteratively
calls RaxML-v8 (Stamatakis, 2014) to compute the bootstrap samples and to
calculate the bipartition frequencies on either the replicate's best-scoring ML
tree to obtain the measure RC or the constraint topology, thus obtaining RC,fix.
Calculations of these two different variants of the phylogenetic structure
measure are carried out simultaneously:
RC: Node frequencies from bootstrap samples are computed on the
tree with the highest likelihood derived from each replicate, thus not
requiring a priori knowledge about the topology,
RC,fix Node frequencies from bootstrap sample are plotted against a
user provided tree (constraint tree. Additional analyses on the relation
between node ages and phylogenetic structure can be carried out, if the
tree is a time calibrated ultrametric chronogram.
Phylogenetic gradient G: When the phylogenetic structure RC, fix is calculated
separately for subsets of nodes, divided by their node age, we can test for a
difference of node support in dependency to the node age. We define:
RC,fix(S) phylogenetic structure on a fixed topology within a
subgroup S of nodes inferred by each data partition
50

Statistic RC,fix(S) is calculated as follows:
RC , fix ( S )=X S− 1 ∑
N∈S ;U ( N )>50
U ( N )
with
S = subgroup of nodes,
XS= number of nodes in that subgroup
U(N) = support value of node N.
The property of this statistic is such that it approaches 1 in a fully resolved
subgroup and 0, when this subgroup does not contain nodes with more than
50% bootstrap support.
The gradient G is the difference between RC,fix(S2) and RC,fix(S1) with S2 =
subgroup of nodes younger than the median node and S1 = all other nodes
including the median node itself.
A flowchart in Figure 13 shows a simple representation of steps involved in the
calculation of the three statistics. The user input to this analysis is the complete
concatenated multi gene alignment in the phylip format, the chronogram
obtained by divergence dating in Beast 1.8 (Drummond et al., 2012) and a
command file with specifications for the analysis (see appendix, p. 1 for an
example). In this command file, options and parameters like the number of
resampled replicates drawn from the respective larger partition in each
comparison and the number of bootstrap replicates in each RAxML run are
given.
The Pybus Harvey gamma (Pybus and Harvey, 2000) based on this
chronogram was calculated and a lineage though time plot is presented in figure
26 (appendix). Nodes in the input chronogram were split into subgroups by their
respective divergence time. Although the tree is rooted, the root node itself is
always excluded from calculations. In a first test for a simple gradient of
phylogenetic structure, we divided the nodes into two bins (regimes) of equal
51

proportions, from the root node to the median node and from the median node
to all shallow nodes.
Since the study in chapter 1 revealed an early divergence of critical nodes
defining the divergences of all major moss lineages within the Carboniferous
(see figures 11 & 25), we also divided all nodes into three bins; from root to the
end of the Devonian, all nodes that have a mean divergence time within the
Carboniferous and all younger nodes.
Test procedure: To characterize each type of markers from each compartment
and the difference between plastid and mitochondrial markers in general, we
conducted three analyses: we compared the phylogenetic structure and the
corresponding support gradient between
plastid and mitochondrial DNA (1 comparison),
52
MSA, chronogram, partition file
divide into partitions, count nucleotides
perform data resampling
calculate BS replicates for each sample
each bigger set
calculate BS replicates for this partition
Generate Bootstraps from combined data
calculate pearson cc between sets of BS replicates
calculate R Cfree
calculate R Cfix
calculate G
evaluate
the smaller set
topology, divergence times
Figure 13: Flow diagram of the analysis steps involved in the calculation of phylogenetic structure and its variants.

noncoding and coding regions from plastids and mitochondria and plastid
matK (10 comparisons),
group I introns (G1), group II introns (G2) and intergenic spacer (IGS)
from plastids and mitochondria. (15 comparisons).
Trees from each shorter marker were inferred using 1000 bootstrap replicates,
each larger marker was re-sampled to 100 samples and trees were inferred with
25 bootstrap replicates from each sample. Trees with bipartition frequencies
from each sample were used to calculate RC and Rc,fix. The assessment of
significance is based on the 95% confidence intervals calculated from the
standard deviation of RC and Rc,fix within the samples.
To calculate the phylogenetic gradient G, only the samples from the comparison
to the shortest partition in each analysis was used. Here, the node frequencies
of each bipartition tree from each sample were computed based on the
constraint topology. For each node, the divergence date and the node
frequency along with the 95% confidence interval based on the deviation of the
mean per node support is then written to a spreadsheet file for further
evaluation.
Results
The lineage through time plot (ltt plot, figure 26) includes the chronogram and
the boundaries of the Carboniferous. The calculated Pybus-Harvey gamma is
-0.99, indicating an early radiation of the lineages.
Phylogenetic structure comparisons are given in tables 5, 6 and 8 along with the
number of character positions per partition, the percentage of distinct alignment
patterns, the number of nucleotides and the ratio of nucleotides and character
positions as a measure of the alignment's gappiness. Each column comprises
the name of the marker with a significantly higher phylogenetic structure and the
upper and lower bounds of the 95% confidence interval. The upper row shows
per marker comparisons of RC, the lower left part shows comparisons under the
fixed topology RC,fix.
53

Contrasting cp and mt markers
Although the alignment partition of plastid sequences contain 47% of the total
number of nucleotides in the alignment, it has more character positions and
more distinct alignment patterns (see Table 5). Thus, the plastid markers used
in this study exhibit much higher variability and length variation than the
mitochondrial markers. The phylogenetic structure in plastids is significantly
higher in the partition of plastid markers. The difference between phylogenetic
structure RC and RC,fix is also significant.
The phylogenetic gradient G appears to be insignificantly low in both partitions,
but the distribution of phylogenetic structure in the tripartite analysis is
apparently uneven distributed; the mean bootstrap support in cp data for nodes
diverging in the Carboniferous is maximally supported, while in mt data the
mean support in this period is 60%.
Table 4: Differences in phylogenetic structure between all plastid and all mitochondrial markers
Rc cp mt
RC,fix
No. char 8662 7260
% patterns 49.08% [4251] 43.43% [3155]
No. nucleotides 380127 423656
ratio nuc/charpos 43.88 58.35
cp better inRc,fix
95% CI[+-]
cp0.10110.09870.1035
mt cp0.15440.15240.1564
Contrasting noncoding and coding data from plastids and mitochondria and matK
The smallest partition in this comparison is matK, it also has the highest
phylogenetic structure followed by plastid noncoding markers, then
mitochondrial noncoding markers, plastid genes and finally mitochondrial genes
54

(Table 6). Except for the direct comparison between plastid and mitochondrial
genes, all other comparisons differ significantly.
Table 5: Difference in phylogenetic structure between matK and coding, noncoding plastid or mitochondrial partitions.
RC matK noncoding mt noncoding cp CDS mt CDS
RC,fix
No. char 1685 5115 4382 1863 2877
% patterns 73% [1230] 44.9% [2296] 54.24%[2377] 45.84%[854] 29.51%[849]
No. nucleotides 106801 146187 225075 127207 198513
ratio nuc/charpos
63.4 28.6 51.4 68.3 69 (= #taxa)
matK better inRc,fix
95% CI[+-]
matK0.05240.04920.0557
matK0.05240.04920.0557
matK0.19820.19510.2014
matK0.23780.23150.2440
cp noncoding matK0.05860.05530.0619
cp noncoding0.02390.02000.0279
cp noncoding−0.1243−0.127−0.1216
cp noncoding0.05140.04640.0563
mt noncoding matK0.14220.13770.1467
cp noncoding0.07120.06730.0750
cp noncoding−0.1243−0.1270−0.1216
mt noncoding−0.1250−0.1281−0.1219
cp CDS matK0.24430.00170.2475
cp noncoding−0.2193−0.2216−0.2170
mt noncoding−0.1371−0.1414−0.1328
cp CDS0.08190.07590.0879
mt CDS matK0.29040.28440.2964
cp noncoding0.19100.18690.1952
mt noncoding−0.1270−0.1302−0.1237
Insignificant0.002−0.00320.0073
Cells contain (from top to bottom) the partition with the higher structure, the difference in R statistic, the lower and upper bound of the 95% confidence interval. Values on the right-hand side show R differences under a unconstrained topology. The left-hand values show R differences under a fixed tree topology. The extent of differences in phylogenetic structure in both cases is matK > cp noncoding > mt noncoding > cp CDS > mt CDS. All differences are significant except RC,fix for the comparison between mt CDS and cp CDS.
The difference between RC and RC,fix is not significant in noncoding data from
plastids, but significant in all other comparisons (figure 14). The gradient G in
phylogenetic structure between the shallow and deep level nodes is negative
55

only in the plastid noncoding markers partition (figure 14). All other gradients
are positive with mitochondrial coding DNA comprising the highest differences.
Table 6: Gradient G = RC,fix(S2) – RC,fix(S1) in coding and noncoding markers from plastid and mitochondria and matK
cp noncoding
mt noncoding
cp CDS mt CDS matK
statistic Gdiff -6.41 2.42 1.34 6.51 1.82
95% CI root-median 1.55 1.53 0.80 2.41 -
95% CI median-present 1.26 2.32 0.44 1.88 -
significance no yes yes yes
When parting up into three temporal bins, we see a significantly uneven
distribution of Rc,fix(S) in all plastid partitions and in mitochondrial coding
regions. Especially matK and plastid noncoding marker contain high amounts of
phylogenetic structure for nodes diverging in the Carboniferous (360 to 300
mya) while coding markers from mitochondria exhibit noticeable less structure
in this period compared to the other time frames. Differences in noncoding
mitochondrial marker are insignificant.
Contrasting all three types of noncoding data from plastids and mitochondria:
In this data set, the highest amount of phylogenetic structure is detected in the
plastid spacer region, followed by the plastid group II introns, the plastid group I
intron, the mitochondrial group I intron, the mitochondrial spacer and finally the
two group II introns from mitochondria on the low end. The differences between
RC and RC,fix are significant in all comparisons except for the group I introns from
both organelles. The difference between RC and RC,fix is notably high in
mitochondrial spacer. It is even positive in comparisons between plastid spacer
and plastid group II introns.
For the computation of RC, RC,fix, RC,fix(S), all partitions were re-sampled to the
size of the plastid group I intron. In the bipartite test, none of the noncoding
partitions exhibit a negative gradient. In the tripartite test, nodes with a
divergence time in the Carboniferous were preferentially supported by group I
56
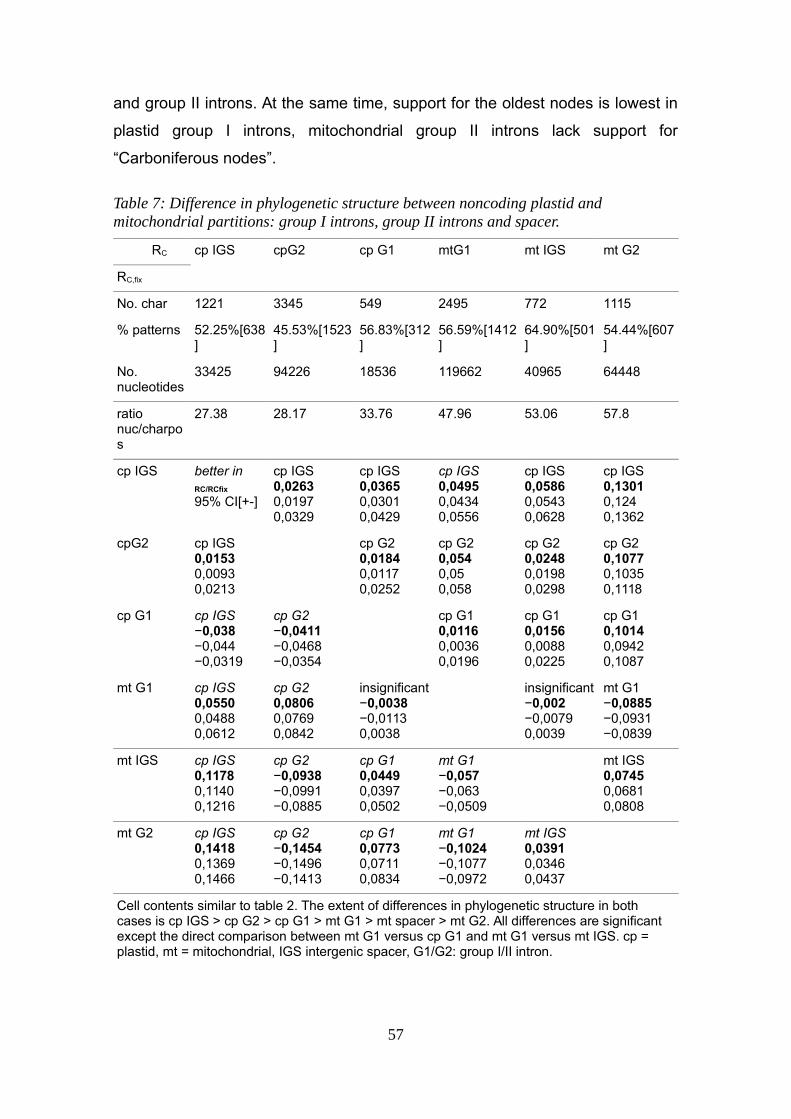
and group II introns. At the same time, support for the oldest nodes is lowest in
plastid group I introns, mitochondrial group II introns lack support for
“Carboniferous nodes”.
Table 7: Difference in phylogenetic structure between noncoding plastid and mitochondrial partitions: group I introns, group II introns and spacer.
RC cp IGS cpG2 cp G1 mtG1 mt IGS mt G2
RC,fix
No. char 1221 3345 549 2495 772 1115
% patterns 52.25%[638]
45.53%[1523]
56.83%[312]
56.59%[1412]
64.90%[501]
54.44%[607]
No. nucleotides
33425 94226 18536 119662 40965 64448
ratio nuc/charpos
27.38 28.17 33.76 47.96 53.06 57.8
cp IGS better inRC/RCfix
95% CI[+-]
cp IGS0,02630,01970,0329
cp IGS0,03650,03010,0429
cp IGS0,04950,04340,0556
cp IGS0,05860,05430,0628
cp IGS0,13010,1240,1362
cpG2 cp IGS0,01530,00930,0213
cp G20,01840,01170,0252
cp G20,0540,050,058
cp G20,02480,01980,0298
cp G20,10770,10350,1118
cp G1 cp IGS−0,038−0,044−0,0319
cp G2−0,0411−0,0468−0,0354
cp G10,01160,00360,0196
cp G10,01560,00880,0225
cp G10,10140,09420,1087
mt G1 cp IGS0,05500,04880,0612
cp G20,08060,07690,0842
insignificant−0,0038−0,01130,0038
insignificant−0,002−0,00790,0039
mt G1−0,0885−0,0931−0,0839
mt IGS cp IGS0,11780,11400,1216
cp G2−0,0938−0,0991−0,0885
cp G10,04490,03970,0502
mt G1−0,057−0,063−0,0509
mt IGS0,07450,06810,0808
mt G2 cp IGS0,14180,13690,1466
cp G2−0,1454−0,1496−0,1413
cp G10,07730,07110,0834
mt G1−0,1024−0,1077−0,0972
mt IGS0,03910,03460,0437
Cell contents similar to table 2. The extent of differences in phylogenetic structure in both cases is cp IGS > cp G2 > cp G1 > mt G1 > mt spacer > mt G2. All differences are significant except the direct comparison between mt G1 versus cp G1 and mt G1 versus mt IGS. cp = plastid, mt = mitochondrial, IGS intergenic spacer, G1/G2: group I/II intron.
57

58
Discussion
Methods. In this study we present a method to quantitatively compare marker
performance in a phylogenetic context, expressed in the parameter
phylogenetic structure RC. As an extension to a framework introduced by Müller
et al. (2006), a check for congruency of phylogenetic structure (difference
between RC and RC,fix) and a check for a gradient G based on the phylogenetic
structure within a subgroup of nodes RC,fix(S). Coarsely, one can infer from sign
and amount of the statistic G and the distribution of RC,fix(S) in general, if the
phylogenetic signal is evenly distributed or if a phylogenetic marker tends to
perform better at a specific node level. If the subgroups are defined accordingly
and the levels of overlap are low, one might find evidence for the source of
specific phylogenetic signal.
This study relies on a number of preconditions, may be disputed in general. But
as this study aims to post process results from a preceding study (chapter 2),
we need to accept these assumptions and discuss them as a possible source of
error. Firstly, we need to trust in the inferred topology and divergence time
estimation as the single true reconstructed phylogeny. As discussed in chapter
2, the used markers from mitochondria and plastids favor slightly different
topologies especially in deeper levels of the phylogeny (Volkmar and Knoop,
2010; Wahrmund et al., 2010). As a consequence, this lowers the phylogenetic
structure in this subgroup, as a conflict in topology leads a to lack of support on
a fixed topology. Nevertheless, we assume a common history (through
concerted evolution) of plastid and mitochondrial DNA, documented by a
hierarchical likelihood ratio test in chapter 2 and the current view of a constantly
coherent history of both compartments since the emergence of land plants
(Cavalier-Smith, 1992; Gray, 1989).
Phylogenetic structure RC, RC,fix and phylogenetic gradient G
The dilution of phylogenetic signal through homoplasy and site specific
substitution rates in highly variable markers like matK and noncoding regions,
as discussed in Barniske et al. 2012, cannot be found in this data set as well.
The best source of phylogenetic structure especially at deep level relationships
are the noncoding markers from plastids and matK, a gene that evolves close to
59

neutrality, similar to noncoding regions. Furthermore, noncoding markers are
the only partition that show a negative gradient G, indicating more power
towards resolving deep level relationships than higher levels. The tripartite
analysis (Fig. 14) shows that plastid noncoding markers tend to support nodes
diverging not later than in the Carboniferous, and matK supports this subset of
nodes on a similarly high level. On the other end of the spectrum, conserved
genes from mitochondria exhibit the least support for this subgroup of nodes.
The by far highest phylogenetic structure for the deepest level subgroup of
nodes can also be found in plastid noncoding markers.
When dividing the dataset into even smaller partitions, we will certainly hit the
lower end of resolution power, as the absolute levels of phylogenetic structure
decrease. As we compared the three different types of phylogenetic structure,
group I/II introns and IGS from plastids and mitochondria against each other, all
markers were re-sampled to the size of trnL-intron, which comprises a mean
length of about 300 nucleotides and an alignment length of 549 character
positions only (after exclusion of hotspots). Results from these comparisons do
not exhibit the characteristic strength in the deeper level subgroup of nodes
found in the results from the whole plastid noncoding partition in the bipartite
test. In the tripartite test however, we observe strong phylogenetic structure in
the Carboniferous subset of nodes in the plastid group II introns and even more
in plastid group I introns. The comparisons in phylogenetic structure however
reveal a top ranking plastid IGS partition, followed (in decreasing order) by
plastid group II and group I introns, mitochondrial group I introns, IGS and group
II introns. Differences between RC and RC,fix are comparatively small, but
significant except for both group I introns. One remarkable exception is the
mitochondrial IGS with a strong deviation between RC and RC,fix, possibly caused
by severe incongruence of phylogenetic structure in the mt IGS and the fixed
topology.
Phylogenetic marker with high variability became widely accepted, and many
studies on aspects of deep level relationships successfully integrated noncoding
marker (compare Barniske et al., 2012; Borsch et al., 2003). Why is the
controversy on that topic still ongoing? During the last decade, next generation
60

sequencing (NGS) methods found their way into molecular phylogenetics. The
increasing availability of genomic data derived by continuously improving
techniques offers enthralling insight into the evolution of genomes and their
organization (e.g. Eisen, 1998). More than just a spin-off, taxonomists can now
use genome wide surveys to resolve species trees, spawning the new area of
phylogenomics. Genome wide data assemblies are expected to revolutionize
molecular phylogenetics, as statistical precision in multi locus studies should
increase with accumulated data. These studies however typically use
conserved orthologous genes, which may have a cryptic history with changing
functions and thus changing constraints. Especially when using transcriptomic
methods, noncoding DNA is never used, although . This has the advantage that
laborious alignments can be omitted, but recent studies show that high levels of
incongruence between gene trees from different loci may lead to a decrease of
accuracy in phylogenetic studies (Betancur et al., 2014; Philippe et al., 2011).
Three different studies on the early branching metazoa that sampled similar
taxa but used different marker from phylogenomic data sets, inferred three
different trees with significance (Dunn et al., 2008; Philippe et al., 2009;
Schierwater et al., 2009). Philippe et al. (2011) discussed the differences
between these three studies and concluded that phylogenomics is sensitive to
“non-phylogenetic signal”, which stems in the incorrect inference of multiple
substitutions. The best method to overcome these artifacts is the selection of
orthologous genes with low amounts of non-phylogenetic signal and improved
bioinformatic tools that can handle such large data sets.
noncoding marker are still a valuable source of phylogenetic information, and
studies that quantify the supremacy of phylogenomic methods over
phylogenetic practice, are still pending.
Conclusions:
In-line with a number of studies that address deep level phylogenetic
questions, this study again confirms the modern notion on highly variable
markers; noncoding DNA and variable genes perform eminently well
61
when properly aligned, a suspected saturation effect remains
unconfirmed.
High functional constraints correlates with low phylogenetic structure.
Thus noncoding DNA from plastids and mitochondria generally yield
more phylogenetic structure than slow-evolving organellar genes with the
exception of the unique fast evolving matK.
Homoplasy resulting from high substitution rates does not necessarily
lead to weak phylogenetic power. In this study, the six plastid
phylogenetic markers generally yielded more phylogenetic structure on a
per nucleotide basis compared to the four mitochondrial markers.
Differences in phylogenetic structure under a constrained topology
(RC,fix), - which is inferred by the concatenated data set - and without
such a constraint (RC) correlate with the total amount of phylogenetic
structure. In this data set, the dominant source of phylogenetic structure
is matK and plastid noncoding markers.
The gradient in phylogenetic structure G =RC,fix(S2) - RC,fix(S1) often
appears low, but tripartite analyses show more intricacies in structure
distribution among partitions. Small gradients in phylogenetic structure
are not necessarily a sign of a uniform distribution; in the tripartite
analyses, we often find significant differences.
Tendencies in a marker or partition to either resolve older or younger
nodes, do not reflect common notions on marker performance; in
mosses, noncoding markers from plastids show a significant negative
gradient distribution, while mitochondrial coding and noncoding marker
provide better information in younger nodes.
Unsurprisingly, re-sampling of the data into very small replicates lowers
the amount of deduced phylogenetic structure, but still allows significant
differences in each comparison to be detected.
62
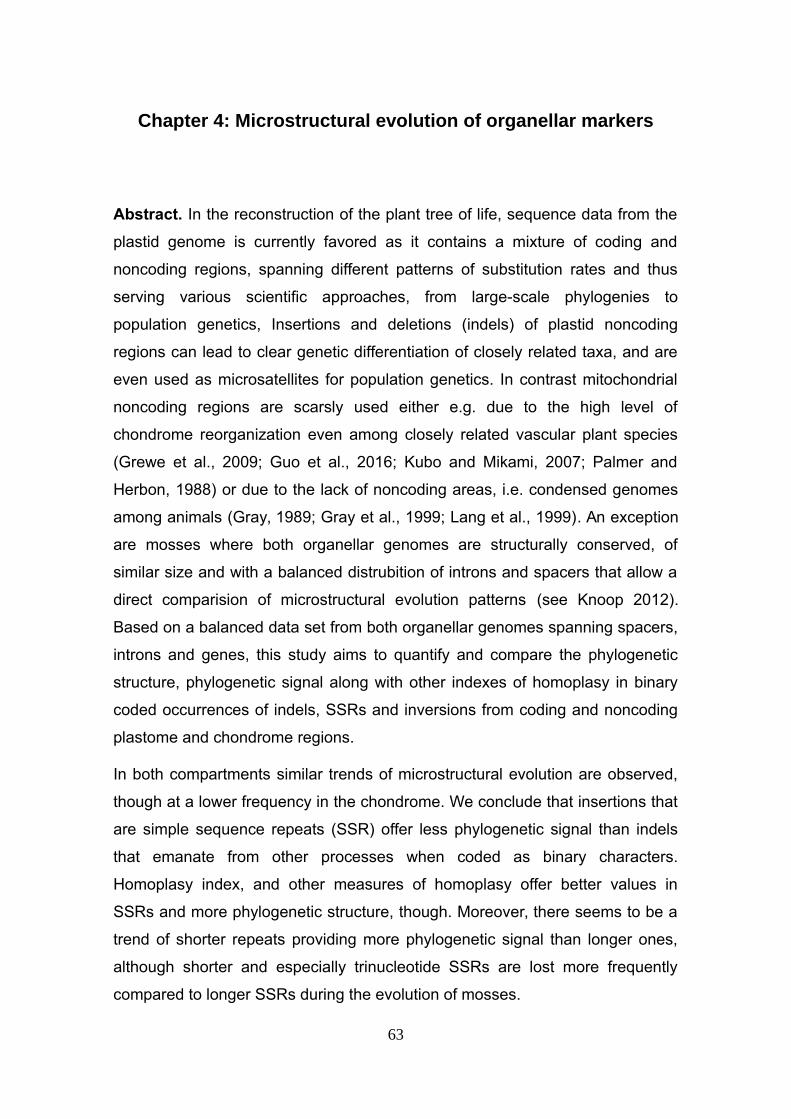
Chapter 4: Microstructural evolution of organellar markers
Abstract. In the reconstruction of the plant tree of life, sequence data from the
plastid genome is currently favored as it contains a mixture of coding and
noncoding regions, spanning different patterns of substitution rates and thus
serving various scientific approaches, from large-scale phylogenies to
population genetics, Insertions and deletions (indels) of plastid noncoding
regions can lead to clear genetic differentiation of closely related taxa, and are
even used as microsatellites for population genetics. In contrast mitochondrial
noncoding regions are scarsly used either e.g. due to the high level of
chondrome reorganization even among closely related vascular plant species
(Grewe et al., 2009; Guo et al., 2016; Kubo and Mikami, 2007; Palmer and
Herbon, 1988) or due to the lack of noncoding areas, i.e. condensed genomes
among animals (Gray, 1989; Gray et al., 1999; Lang et al., 1999). An exception
are mosses where both organellar genomes are structurally conserved, of
similar size and with a balanced distrubition of introns and spacers that allow a
direct comparision of microstructural evolution patterns (see Knoop 2012).
Based on a balanced data set from both organellar genomes spanning spacers,
introns and genes, this study aims to quantify and compare the phylogenetic
structure, phylogenetic signal along with other indexes of homoplasy in binary
coded occurrences of indels, SSRs and inversions from coding and noncoding
plastome and chondrome regions.
In both compartments similar trends of microstructural evolution are observed,
though at a lower frequency in the chondrome. We conclude that insertions that
are simple sequence repeats (SSR) offer less phylogenetic signal than indels
that emanate from other processes when coded as binary characters.
Homoplasy index, and other measures of homoplasy offer better values in
SSRs and more phylogenetic structure, though. Moreover, there seems to be a
trend of shorter repeats providing more phylogenetic signal than longer ones,
although shorter and especially trinucleotide SSRs are lost more frequently
compared to longer SSRs during the evolution of mosses.
63

Finally, indels are thought to be the results of one or more hypothetic
mechanisms like slipped strand mispairing leading to motif gains or losses. The
observed diversity of indel length and motif, however, is suggestive of an
alternative or second mechanism leading to SSRs, as the frequency of tri-,
tetra- and pentanucleotide SSRs is much higher than expected when assuming
an indel to be matching the flanking region just by chance, which is required for
slipped strand mispairing. Besides, hairpin initiated intramolecular
recombination may also lead to a second type of microstructural mutation in the
chondrome, inversions that are known to change on population level.
Keywords: simple sequence repeat (SSR), hairpin associated inversion (HAI),
insertion/deletion (indels), Fritz’s D, Blomberg’s K.
Introduction.
The condition to successfully apply binary coding (indel coding, e.g. Müller
2006) is a correct alignment. Therefore, insertions and deletions (indels) and
inversions in DNA samples require a great deal of attention during alignment
processes. As different types of indels can be distinguished based on the
putative mechanism that can explain the inheritance of an indel, the question
arises, if these differences lead to different phylogenetic properties and if
different indel types have a different impact on phylogenetic reconstructions.
Most notably in noncoding genetic markers like introns and intergenic spacer
and few genes like matK (Hilu et al., 2003; Neuhaus and Link, 1987) and ycf1
(Drescher et al., 2000; Neubig et al., 2009), length variability and inversions of
course can only be detected in comparison to homologous sequences in related
taxa. The underlying mechanisms leading to length variability can be manifold
(Li, 1997), in plastid DNA (cpDNA) only a few types of mutations are
responsible for the majority of insertions and deletions found in alignments of
noncoding sequences (Graham et al., 2000; Müller et al., 2006). The most
commonly proposed mechanism that leads to these repetitive length mutations
is slipped strand mispairing (Levinson and Gutman, 1987; Tachida and Iizuka,
64

1992) that leads to simple sequence repeats (SSR). These are a phenomenon
common to all nuclear and organellar/bacterial genomes (Greaves and Patient,
1985; Hamada et al., 1982; Tautz, 1989; Tautz and Schlötterer, 1994). SSRs
typically occur in sites of DNA that are highly susceptible to mutations (Kashi
and King, 2006). These regions are usually referred to as micro- or
minisatellites, with the first ones consisting of repeated motifs of usually less
than five to six nucleotides and the latter simply longer than that, usually 10-60
nucleotides (Borsch and Quandt, 2009).
Like other noncoding sequence stretches, SSRs are often considered as junk
DNA, but their role in a number of inherited diseases and effects on gene
expression by phase variation (Gymrek et al. 2015) and utility in forensics
(Jeffreys et al. 1985), evolutionary studies and population genetics have been
well documented since their discovery in the early 80s (Chambers and
MacAvoy, 2000; Jarne and Lagoda, 1996). The high variability render SSRs as
powerful Mendelian markers (Jarne and Lagoda, 1996) in mammalian and plant
systems for genetic analyses at the species or population level (Dib et al., 1996;
Dietrich et al., 1996; Morgante and Olivieri, 1993; Sverdlov et al., 1998).
SSRs can be dispersed in all areas of the genome, especially in noncoding
stretches, but some loci accumulate hundreds of SSRs with very high rates of
insertion or deletion, which are then called micro- or minisatellites and are used
as standard markers in population studies. In phylogenetic studies on more
distant related taxa, however, the utility especially of very short and monomeric
microsatellites is thought to be limited due to high mutation rates and size
homoplasy or allele length constraints (Bruford and Wayne, 1993; Goldstein and
Pollock, 1997). These effects, however, may only appear, when the quantity of
tandem repeats in a typical SSR locus with hundreds of repeats is used as a
discrete character but may be irrelevant when used as a properly aligned and
binary coded indel event. Rules for alignment of noncoding sequences have
been discussed in numerous studies (Borsch et al., 2003; Giribet and Wheeler,
1999; Graham et al., 2000; Kelchner, 2000; Löhne and Borsch, 2005; Morrison,
2009; Ochoterena, 2009), which agree in the necessity to take knowledge about
microstructural mutation patterns and mechanisms into account.
65

The phylogenetic utility of noncoding marker, reviewed in Borsch and Quandt
(2009), summarized the frequency of SSRs in dependency of their repeat length
across different studies on various plant lineages employing different noncoding
plastid marker. They found a surprisingly high fraction of tetra-, penta- and
hexanucleotide SSRs in the alignment. Another study on Nymphaeales by
Borsch (2007) employing the trnT-F region, counted the gains and losses of
SSRs via ancestral reconstruction and found only 3 losses compared to 68
gains. This indicates a strong tendency to retain SSRs after their occurrence,
which should be a good precondition of a reliable phylogenetic character.
But is the distribution of indel length and motif intrinsic and common to both
organellar compartments? Thus are both compartments evolving in a similar
fashion in terms of substitution rate and microstructural evolution which leads to
a comparable phylogenetic structure? As the structural integrity of the
chondrome is abandoned early in tracheophyte evolution (Grewe et al., 2009;
Guo et al., 2016; Kubo and Mikami, 2007; Palmer and Herbon, 1988) a direct
comparison is only feasible in one of the bryophyte lineages which at the same
time extends the deep level phylogenetic to 500 MYA (chapter 2). Therefore, a
balanced data set of plastome and chondrome data spanning spacers, introns
and genes was compiled for a representative set of mosses, with the aim to
evaluate the phylogenetic utility of SSRs compared to other indel events in the
context of indel coding. We examine dispersed SSRs across organellar
molecular phylogenetic marker, from plastids and mitochondria, containing
coding and noncoding sequences rather than typical microsatellite marker. On
the one hand, indels make alignments of noncoding regions challenging, and
today, there is still no alignment algorithm that can align indels – and especially
SSRs – satisfactorily. On the other hand, after a proper time-consuming manual
alignment, indels might be a valuable source of information when coded as
binary characters, e.g. via indel coding. The contribution of indels that can be
attributed to different mechanisms of nascency may also have very different
characteristics in phylogeny reconstructions. Simple sequence repeats are easy
to detect and to align, while other indels do not reveal their derivation or
homology. This leads to the following questions:
66

Do SSRs have acceptable levels of phylogenetic structure and
homoplasy compared to other indels? And if these characteristics are
significantly worse in SSRs, can we still justify the usage of SSRs as
binary coded traits in the same way as other indels? Is the frequency of
gain and loss of an SSR so high, that the occurrence of SSRs resembles
a random distribution rather than a derived trait?
Insertions and deletions can only be identified in comparison to homologous
sequences from related taxa. Due to the diffuse definitions of repeat mutations
leading to length variability like insertions, deletions (indels) and different kinds
of repeats, we stick to the outlining in Borsch and Quandt (2009). Here, SSRs
are, together with inversions, inverted repeats and indels, described under the
general term “microstructural mutations”. We do not differentiate between micro-
or minisatellites, nor do we include homo-nucleotide repeats, as we cannot
determine the length of the repeat unit, we also cannot distinguish them from
sequencing errors. We confine to comparing indels containing a simple
sequence repeat (SSRs) to indels that cannot be identified as a repeat of the
flanking sequence. The latter are thus assumed to have a different history than
SSRs. Instead of a simple summary of SSRs observed among sequences in an
alignment (Borsch and Quandt, 2009), we reconstructed the gain or loss of
SSRs in the phylogenetic context via ancestral state reconstruction.
Short inversions are periodically found in loops at noncoding DNA. The single
stranded DNA at the locus or the transcribed RNA would form a hairpin
structure due to dyad symmetry around these inversion-prone sites (compare
Kelchner & Wendel 1996; Borsch & Quandt 2009), therefore called hairpin
associated inversion (HAI).
The scope of this study is the quantification of indel length distribution and
phylogenetic structure sensu Müller et al. 2006 and chapter 3 in all SSR
positions compared indels other than SSR. Additionally, we compare the
phylogenetic signal based on two per site statistics among SSRs of different
lengths and among inversions at six sites within the data set. Finally, we
estimate the phylogenetic signal and homoplasy in non-autapomorphic
inversion sites.
67

Material and Methods
Unambiguously identifiable simple sequence repeats and inversions were
annotated during the manual alignment process of the sequences in the data
set from chapter 2 by PhyDE labels (Müller, 2005). We carefully followed the
rules outlined in Kelchner 2000 to increase accuracy of the alignment by
considering knowledge on microstructural evolution. Indels other than SSRs
were automatically coded following the simple indel coding approach (Simmons
and Ochoterena, 2000) implemented in SeqState 1.4 (Müller 2005).
Information about position, occurrence and length of SSRs were extracted via a
perl script that prepares a nexus file with a binary matrix coding the presence or
absence of a SSRs. Along with this matrix, a paup block with the appropriate
commands to infer ancestral states of each binary character on a given
topology was included and executed in PAUP 4.0a152 (Swofford, 2002). The
reconstructed gain or loss of a SSRs at each site is then evaluated and
summarized for each length. The topology that was used to infer ancestral
states is the ML topology taken from chapter 2. Also, based upon this topology,
we calculate the rescaled consistency index, the retention index and the
homoplasy index (RC, RI, HI) (Farris, 1989; Kluge and Farris, 1969) for each
indel partition.
The phylogenetic structure RC and RC,fix (chapter 2) is then calculated for
pairwise comparisons between the partitions containing only SSRs and the
partition of all remaining indels and the partition including both types of indels as
well.
The phylogenetic signal statistics Blomberg's K (Blomberg et al., 2003) and D
(Fritz and Purvis, 2010) were calculated for each position and averaged across
each respective partition (all indels, SSRs and other indels), then for each
length-class of SSRs (ranging from 2 to 9, 10≥∩≤14, and ≥15) and finally for
each individual inversion. Both measures check for phylogenetic signal in binary
traits that test the non-randomness of a trait distribution against a given
topology. Here we use the maximum likelihood (ML) topology (congruent with
the Bayesian inference (BI topology) from chapter 2.
68

Blomberg's K is a scaled variance ratio of the variance of phylogenetically
independent contrasts among species relative to randomization via tip shuffling.
K is proportional to the signal strength in a trait and assesses the significance in
difference of the signal of a trait against a simulated distribution assuming
Brownian motion character evolution. Values of K approaching zero indicate
similarity to a random distribution, those approaching 1 point to a Brownian
distribution. Higher values indicate an increasingly stronger relation between the
trait's evolution and the given phylogeny. The quantile of the observed
phylogenetically independent contrast variance (PIC) serves as a 1-tailed p-
Value to test for better phylogenetic signal than expected by Brownian motion or
random trait evolution (p(PIC)).
While K can also be applied to continuous-valued data, phylogenetic D is better
fitted to binary data, as it compares the number of changes in reconstructed
states of a binary trait at each node and to the mean sum of changes in
character evolution simulations. These simulations employ two models of
character evolution, phylogenetic randomness and Brownian threshold model.
Values of phylogenetic signal D lower than zero indicate better signal strength in
the data than expected from a Brownian distribution, and those higher than one
indicate a random distribution of the trait. Since we compare classes of traits (in
the test for phylogenetic signal in all indels, SSRs and indels without SSRs, as
well as the per SSR length class tests), we compare the mean K and D
statistics per class.
We estimated the correlation between both phylogenetic signal statistics and HI
by calculating the Pearson correlation coefficient of each pair.
Finally, the phylogenetic Signal D and K is calculated for each non-
autapomorphic inversion site that contains at least two homologous inversions.
The significance of D departing from 0 (significantly different to Brownian
expectation) and 1 (random expectation) is calculated independently based on
both types of simulations. In this study, inversion were always associated with a
hairpin structure, therefore called hairpin initiated inversion (HAI).
69

Results
The indel coding binary matrix from the plastid and mitochondrial markers
contains 1753 character positions, 410 (23.4%) of these are identified as simple
sequence repeat (SSRs). From these 410 positions, 35.4% are distinct
alignment patterns informative to maximum likelihood and 26.1% were
parsimony uninformative (Table 9, characters/patterns/PI sites).
The stacked bar plot in figure 15 shows the count of reconstructed gain and loss
of SSRs in mitochondria and plastids, subdivided by repeat unit length. Gains of
SSR have a peak in tri- and tetranucleotide SSRs in both genomes. By far the
most losses happen in trinucleotid SSRs, we counted 37 reconstructed losses
in trinucleotide SSR, while only 15 losses in dinucleotid SSR, 11 in
tetranucleotid SSRs and only 9 in pentanucelotid SSRs can be found. Losses of
SSRs with longer repeat units appear to be rather scarce, and SSRs longer
than six nucleotides are found predominantly in plastids.
Phylogenetic structure RC and RC,fix together with their corresponding 95%
confidence interval are presented in table 9. Higher per nucleotide phylogenetic
structure RC and RC,fix are found in SSRs, the homoplasy indices are also a bit
lower in SSRs, while the consistency index (CI) and the rescaled consistency
(RC) index is accordingly higher in this partition. Both measures for
phylogenetic signal however, Blomberg's K and especially phylogenetic D
indicate significantly more phylogenetic signal in non-SSR indels.
The Pearson correlation coefficient r between K and HI is r = 0.45, between D
and HI r = -0.30 and between D and K r = -0.38. These values reveal only weak
to moderate correlations between these measures.
Per SSR length class measures of phylogenetic signal D and K are shown in
table 17 (appendix) and figure 16. The linear regression in the upper graph
(mean(K statistic)) shows an descending slope while the linear regression in the
middle graph (mean(D statistic)) shows an ascending slope, both indicate a
moderate decline in phylogenetic signal in sites with longer SSRs. The size of
the circles in the upper graph is proportional to the fraction of p(PIC) lower than
70

0.05. The associated confidence intervals are calculated based on the variance
of the K and D between each element of each length class.
The lower Graph shows the fraction of positions that have either a better mean
phylogenetic signal D than expected based on a Brownian motion model
(black), a better signal than expected on a random model (white) or worse than
that (grey). Table 3 also lists details about the number of coded SSRs and the
fraction of parsimony informative sites (PI), together with the homoplasy index
(HI, after excluding non-PI sites).►
► Figure 16 (next page): Mean Phylogenetic signal D and K of SSRs in relation to length. Dashed lines show the linear regression, circles in the upper graph are proportional to the fraction of p(PIC)<0.05, thus showing the fraction of positions resembling a random distribution. Vertcal bars in the upper and middle show the 95% confidence interval. The lower graph shows a stacked barplot of the fractions of positions exhibiting worse (black) or better (white) phylogenetic signal than random or better than simulated Brownian characters (grey).
71
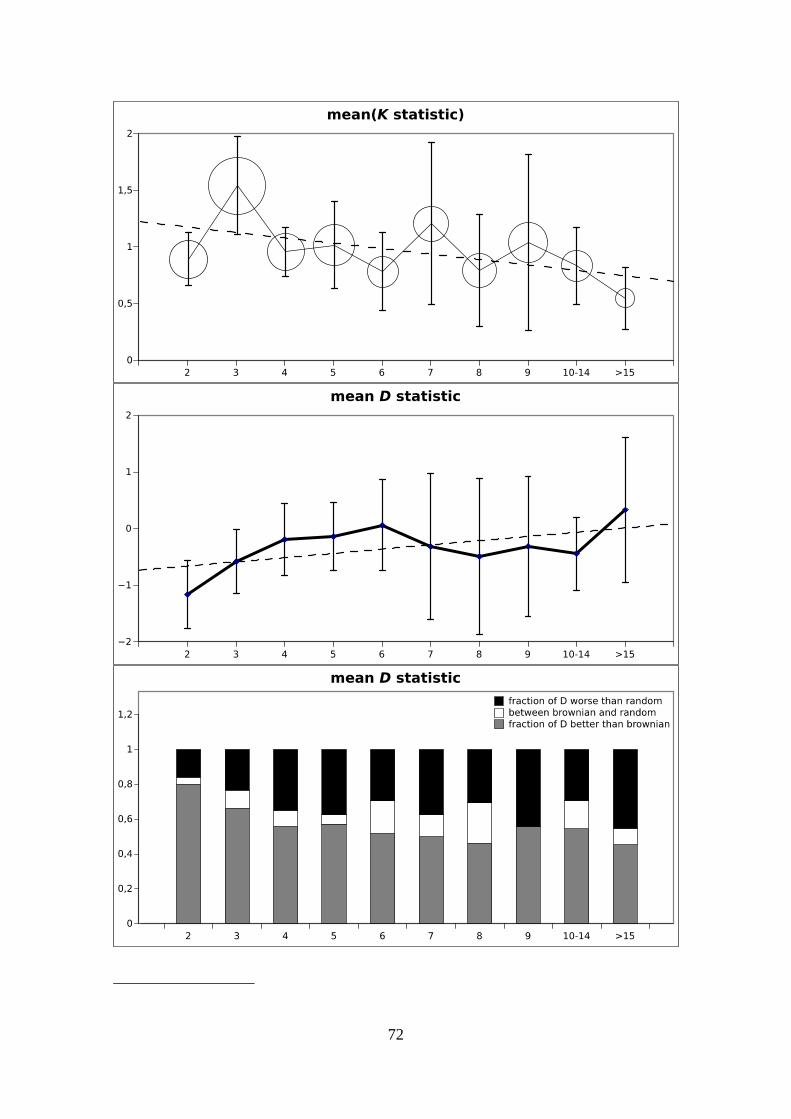
72

Table 8: Phylogenetic structure and signal in simple indel coding (sic), simple sequence repeats (SSRs), and sic excluding SSRs. Measure RC (upper right) and RC,fix (mid left) depict the amount of phylogenetic structure per sequenced nucleotide, the latter against the background of a given topology. Additional statistics (RI/RC/HI) depict the level of homoplasy in the data, phylogenetic signal D and Blomberg's K quantify phylogenetic signal across indel partitions. Calculation of RI,RC, HI, D and K are based on the ML topology from chapter 1.
simple indel coding SSRs sic without SSRs
phylogenetic structure RC
simple indel coding
ph
ylo
ge
ne
tic
str
uc
ture
RC
fix
better inRC/RcfixCI95% lower boundCI95% upper bound
SSRs0,05350,04670,0604
SSRs0,04690,04130,0524
SSRs
SSRs0,06630,04370,0888
insignificant−0,0021−0,00920,005
sic without SSRs
insignificant0,0204−0,00740,0483
SSRs0,03360,01730,0498
retention index (RI) 0.709 0.805 0.680
rescaled consistency index (RC) 0.471 0.630 0.551
homoplasy index (HI (=1-CI)) 0.337 0.218 0.300
characters/distinct alignment patterns/PI sites 1753/1334/558 410/145/107 1343/1189/451
mean(K Statistic (95% CI))mean(p(PIC variance) < 0.05)
1.25192 (0.05181)0.3287
1.0349 (0.1276)0.2910
1.3643 (0.0821)0.3494
mean(phylogenetic D (95% CI))fraction of E(D) better than Brownian fraction of E(D) better than random
-0.84242 (0.38391)0.692310.81818
-0.3313 (0.2408)0.59070.6912
-1.0221 (0.5345)0.72600.8356

The assessment of phylogenetic signal D and K in inversion sites revealed significant
values in inversions as well. Out of the 11 observed inversions sites, 5 were parsimony
informative. Except for one position, values for phylogenetic signal D indicate more
phylogenetic signal than expected from a Brownian distribution simulation. K values
indicate departure from randomness in the first 4 tests, with the first two sites being
close to a Brownian distribution. The last site comprised even more signal than expected
from the Brownian simulation. Despite having significant phylogenetic signal, the
homoplasy index from the first and the last site is extremely high.
For comparison, a two-dimensional plot of the secondary structure representation of
both HAI states at each site, together with their estimated Gibbs energy ΔG, is given in
figure 17. We also plot the occurrence of these traits on the tree topology from chapter
1, which is also used to calculate the phylogenetic signal, phylogenetic structure RC,fix
and the reconstructed gain and loss of SSRs in this study (Figure 18).
74/145

Table 9: Blomberg's K statistic and phylogenetic Signal D in non-autapomorphic inversion sites. Values of D < 0 indicate evidence for a conserved phylogenetic signal, D ≈ 0, when the trait distribution resembles a Brownian process and D ≈ 1 or D > 1, when random.
symbol position Description of the position
motif:50% consensusstrict consensus
freqency in taxa
# gain # loss RI RC HI K Statistic p(PIC variance)
phylogenetic D
p(E(D)) random
p(E(D)) brownian
■ 569-574A loop in P9 in cobI gI_intron
TCC ↔ GGATRR ↔ YYA
20 5 4 0.579 0.064 0.889 0.91 0.0010 -0.53 0 0.93
2342-2349
D2 loop in Nad2 gII_intron
TAAT ↔ ATTATAAT ↔ ATRB
4 2 0 0.667 0.333 0.5 0.91 0.0020 -1.4 0 0.91
✚ 11487-11496
P6 loop in trnL gI_intron
ATTTA ↔ TAAAT 2 2 0 0 0 0.5 0.25 0.3745 +1.3 0.63 0.16
✘ 18163-18178
atpB-rbcL IGSATTTTT ↔ AAAAATAHTTTT ↔ AYAAAV
5 2 0 0.750 0.375 0.5 0.70 0.0020 -0.73 0 0.84
▲ 18262-18273
atpB-rbcL IGSGTTTTA ↔ TAAGAC/TGTRTTA ↔ MYAYWV
39 4 1 0.793 0.113 0.857 1.21 0.0010 -0.53 0 0
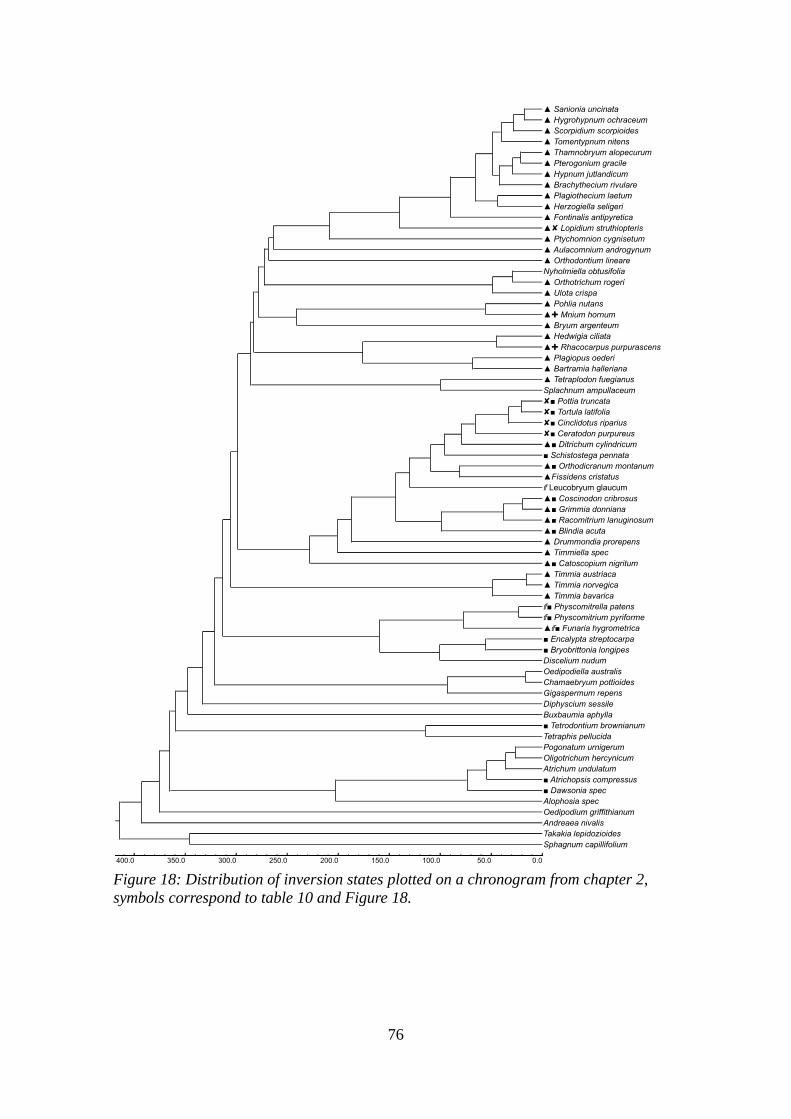
76
▲ Sanionia uncinata▲ Hygrohypnum ochraceum▲ Scorpidium scorpioides▲ Tomentypnum nitens▲ Thamnobryum alopecurum▲ Pterogonium gracile▲ Hypnum jutlandicum▲ Brachythecium rivulare▲ Plagiothecium laetum▲ Herzogiella seligeri▲ Fontinalis antipyretica▲ Lopidium struthiopteris✘▲ Ptychomnion cygnisetum▲ Aulacomnium androgynum▲ Orthodontium lineareNyholmiella obtusifolia▲ Orthotrichum rogeri▲ Ulota crispa▲ Pohlia nutans▲ Mnium hornum✚▲ Bryum argenteum▲ Hedwigia ciliata▲ Rhacocarpus purpurascens✚▲ Plagiopus oederi▲ Bartramia halleriana▲ Tetraplodon fuegianusSplachnum ampullaceum
■ Pottia truncata✘■ Tortula latifolia✘■ Cinclidotus riparius✘■ Ceratodon purpureus✘
▲■ Ditrichum cylindricum■ Schistostega pennata▲■ Orthodicranum montanum▲Fissidens cristatus Leucobryum glaucum
▲■ Coscinodon cribrosus▲■ Grimmia donniana▲■ Racomitrium lanuginosum▲■ Blindia acuta▲ Drummondia prorepens▲ Timmiella spec▲■ Catoscopium nigritum▲ Timmia austriaca▲ Timmia norvegica▲ Timmia bavarica■ Physcomitrella patens■ Physcomitrium pyriforme
▲ ■ Funaria hygrometrica■ Encalypta streptocarpa■ Bryobrittonia longipesDiscelium nudumOedipodiella australisChamaebryum pottioidesGigaspermum repensDiphyscium sessileBuxbaumia aphylla■ Tetrodontium brownianumTetraphis pellucidaPogonatum urnigerumOligotrichum hercynicumAtrichum undulatum■ Atrichopsis compressus■ Dawsonia specAlophosia specOedipodium griffithianumAndreaea nivalisTakakia lepidozioidesSphagnum capillifolium
0.050.0100.0150.0200.0250.0300.0350.0400.0
Figure 18: Distribution of inversion states plotted on a chronogram from chapter 2, symbols correspond to table 10 and Figure 18.

Discussion
The high accumulation of tetra-, penta- and hexanucleotide SSRs that is
reported by Graham et al. 2000 and Borsch & Quandt 2009 cannot be observed
here to the extent in their dataset. Still, the observed diversity of indel length
and motif is suggestive of an alternative or second mechanism leading to SSRs,
as the frequency of tri-, tetra- and pentanucleotide SSRs is much higher than
expected when assuming an indel to be matching the flanking region just by
chance, which is required for slipped strand mispairing. The reconstructed gains
in di-, tri-, tetra- and pentanucleotides are at least twice as frequent as in longer
SSRs. Trinucleotid SSRs are unexpectedly more frequent than dinucleotid
SSRs. Losses in trinucleotide SSRs are exceptionally more frequent than in all
other classes. This leads to a higher fraction of positions with trinucleotide
SSRs having a phylogenetic signal that is similar to a random distribution. Here,
42.3% of the positions had a p(PIC) variance of less than 0.05, the average in
all motif length classes is 27.0%. Nevertheless, the mean phylogenetic Signal K
and the level of homoplasy HI are highest in trinucleotide SSRs, which again
indicates a possible inverted relationship of these two measures. This cannot be
stretched as a general rule in all motif lengths, since we find only weak to
moderate correlations between HI and K as well as HI and D.
Since only 6 parsimony informative inversion sites with an inversion could be
found in this data set, conclusions on their impact on the phylogenetic
reconstruction against the background of a comprehensive 15922 character
position alignment plus 1813 indel positions (via simple indel coding, Simmons
& Ochoterena 2000) may be limited. But we could investigate their properties in
detail. Except for one position, there is no evidence for randomness based on
the two statistics of phylogenetic signal K and D, but only one position exhibits
more phylogenetic structure than expected on a Brownian simulation.
How can measure for phylogenetic structure, the homoplasy, rescaled
consistency and retention index (RC, Rc,fix, HI, RC and RI) be better in SSRs
than in other indels, while these positions at the same time show less mean
phylogenetic signal K and D? The aim of this study is to check whether SSRs
77

and inversions, both emerging from unique processes, have phylogenetic
characteristics that would justify their use as a source of information or if these
should be excluded prior to phylogenetic reconstructions. The statistical
measures chosen for the analyses should resemble more or less the same
picture; phylogenetic structure should arise from positions with high levels of
phylogenetic signal. Homoplasy would otherwise decrease the amount of
phylogenetic signal and thereby lower phylogenetic structure (sensu Chapter 2,
Müller et al. 2006). Källersjö et al. (1999) found that homoplasy could
substantially increase “phylogenetic structure”, which in this case was based on
counts of groups that are supported by jackknife scores. This may also hold true
for indels that are not deducible from SSRs or inversions, their higher level of
homoplasy may still bear more phylogenetic signal. The study in Källersjöh et
al. (1999) employed a large set of 2538 rbcL sequences from all plant lineages,
proving that homoplasy does not necessarily condition saturation (Swofford et
al., 1996).
Indels that are not SSRs or inversions would emerge from multiple unknown
mechanisms that have individual rates and also individual effects that obscure
the true phylogenetic signal (Gatesy et al., 1999; Gatesy and Baker, 2005). This
might be one explanation for the higher homoplasy in those indels. In their
theory of hidden support, these individual biases in combination may be nullified
by contrast while common phylogenetic signal may accrue (Barrett et al., 1991;
Gatesy and Baker, 2005).
On the one hand, the two measures for phylogenetic signal, D and K, compare
the distribution of a trait on a given topology – here the presence or absence of
the indel of its class – to simulated Brownian or random distributions and infer
their departure from these. On the other hand, phylogenetic structure is a
measure of the effective performance of markers normalized to the nucleotide
content (compare chapter 3). Those two measure are not synonymous, they
rather span a minimum and a maximum level of contribution of data to solve a
phylogenetic problem.
SSRs and Inversions contain significant levels of phylogenetic signal, both excel
randomness and Brownian motion character evolution simulations in most
78

cases. The initial question if SSRs and inversions have enough reliability as
phylogenetic characters to justify their use in phylogenetic studies should be
answered based on their phylogenetic signal. The results show that homoplasy
does not correlate with phylogenetic signal, so excluding or weighting
characters differently based on their homoplasy index alone may bear the risk
of unwarranted elimination of data. To minimize this risk, randomness of the
occurrence of a trait must be proven satisfactorily prior to exclusion,
phylogenetic structure is a subordinated problem. In this study, we cannot reject
the hypothesis, that SSRs and inversions both have phylogenetic signal close to
or better than the expectation based on Brownian motion character evolution,
hence exclusion of these classes of indels is not justified.
Since only 6 parsimony informative inversion sites with an inversion could be
found in this data set, conclusions on their impact on the phylogenetic
reconstruction against the background of a comprehensive 15922 character
position alignment plus 1813 indel positions (via simple indel coding, Simmons
& Ochoterena 2000) may be limited. But we could investigate their properties in
detail. Except for one position, there is no evidence for randomness based on
the two statistics of phylogenetic signal K and D, but only one position exhibits
more phylogenetic structure than expected on a Brownian simulation.
The initial question, whether we find significantly worse levels of phylogenetic
signal in SSRs than in other indels cannot be answered easily, as in SSRs, we
find lower levels of homoplasy and more phylogenetic structure but less
phylogenetic signal at the same time. These results seem to be contradictory,
but this might indicate a minor influence of homoplasy on phylogenetic
structure, which in turn might be a more robust measure for quantity and quality
in phylogenetic markers than phylogenetic signal.
79

Summary
In the reconstruction of the plant tree of life, sequence data from the plastid
genome is currently favored as it contains a mixture of coding and noncoding
regions, spanning different patterns of substitution rates and thus serving
various scientific approaches, from large-scale phylogenies to population
genomics. Most interestingly, the fast evolving noncoding regions of plastid
origin have been shown to be a powerful phylogenetic tool not only in in shallow
levels of angiosperm phylogenetics, but also at deep levels (Barniske et al.,
2012; Borsch and Quandt, 2009), as a result of a more equitable distribution of
phylogenetic information due to low selective constraints (Barniske et al., 2012;
Müller et al., 2006). But is intrinsic and common to both organellar
compartments? Thus are both compartments evolving in a similar fashion in
terms of substitution rate and microstructural evolution which leads to a
comparable phylogenetic structure? As the structural integrity of the chondrome
is abandoned early in tracheophyte evolution (e.g. Palmer and Herbon 1988;
Kubo and Mikami 2007; Grewe et al. 2009) a direct comparision is only feasible
in one of the bryopyhe lineages which at the same time extends the deep level
phylogenetic to 500 MYA. Therefore, a balanced data set of plastom and
chondrome data spanning spacers, introns and genes was compiled for a
representative set of mosses, a dataset that also roots in with previous studies
that aimed to resolve the difficult backbone phylogeny of mosses.
Most importantly, the data now allows resolving crucial nodes with significance,
that were not confidently resolved in other studies. At the same time the
evolutionary history of peristomes as a crucial distinguishing feature in moss
systematics could be traced in a geological time line, including shifts in
speciation rates of these lineages. Furthermore,it allows quantifying and
comparing the phylogenetic structure in different phylogenetic markers from
mitochondrial and plastid DNA. Finally, a survey on the phylogenetic properties
of different types of insertion and deletions (indels), namely simple sequence
repeats, hairpin associated inversions and all other indels evaluates the
peculiarities in each type and their phylogenetic impact.
80

Chapter 1: Cytoplasmic noncoding DNA: characteristics and utility in phylogenetics
• The phylogenetic utility of noncoding DNA faces displacement by
apparent superior phylogenomic studies that employ huge amounts of
coding genes. An increase of genes may lead to more precision, but an
increase in accuracy still needs to be tested.
• Mitochondrial DNA in mosses and liverworts is – in contrast to other plant
lineages – consistent in gene content and order. Within each lineage,
spacer and introns are largely positionally conserved. This conditions a
successful establishment of phylogenetic marker with assumedly
adequate levels of variability.
• Mosses are often seen as a primeval group with limited evolutionary
capacity and no economic value that at best can be studied as a model
of early plant evolution and the link between algae and vascular plants.
Reconstructed late diversification bursts however suggest a multilateral
coevolution between angiosperms and peristomate mosses.
Chapter 2: Resolving the backbone phylogeny of mosses: an organellar perspective
• The reconstructed land plant phylogeny recovers the branching order
also found in Qiu et al. (2007), with liverworts branching first, followed by
mosses and hornworts.
• Reconstructed divergence times of the crown group of mosses dates
back to the lower Devonian, 414 mya [95%HPD: 395.8 – 433.5]. Very
soon after that, the origination of classes within the Bryophytina (≈ all
arthrodontous mosses) took place within the Carboniferous (358.9 –
298.9).
• Tetraphidopsida are reconstructed as sister to arthrodontous mosses
with considerable support in simple indel coding analyses (1.0 BI, 91 ML)
but only moderate support without indel coding (0.9 BI, 79 ML), the
81

nematodontous peristome therewith characterizes a paraphyletic group
and is most likely the ancestral state of the arthrodontous peristome.
Clarification via developmental studies is still pending.
• The basal most Bryopsida are the Buxbaumiidae, followed by the
Diphysciidae.
• The aperistomate Gigaspermidae retain a sister relationship to
Funariidae and the rest of the arthrodontous mosses.
• The diplolepideous Funariidae are resolved sister to the Timmiidae,
which in turn are sister to the Dicranidae and Bryidae. According to this
branching order, their respective peristome types, the Timmia-type
(4:2:8), the haplolepideous and the diplolepideous-alternating peristomes
are assumedly derived from the diplolepideous-opposite peristome type
(Funaria type, 4:2:4).
• Difficulties in the reconstructions of basal bryophyte relationships may be
related to very short branches between basal nodes and heterogeneous
substitution rates in pplastomes and chondromes, which point to
incongruent evolutionary dynamics between the two organellar genomes
during moss evolution
• Four positive shifts in speciation rate were detected, three of which are
estimated to occur during mid to upper Cretaceous, indicating a
correlation with the concurrent evolution of angiosperm woody habitats.
One rate shift occurs earlier in the upper Jurassic, possibly related to the
recovery phase after the Triassic mass extinction event.
• Emergence of peristome types took place in the Carboniferous,
significant shifts in speciation rate were reconstructed two geological
eras later in Jurassic and Carboniferous, which indicates no correlation
between these two events..
82

Chapter 3: Phylogenetic structure (RC, RC,fix, RC,fix(S)) of organellar markers
The new method yields three measures for phylogenetic structure;
RC is the phylogenetic structure in each marker, without a priori
knowledge about the topology.
RC,fix is the phylogenetic structure in a marker against the background of
a constraint topology. Differences between RC and RC,fix can be
interpreted as nonrandom incongruence.
RC,fix(S) is the phylogenetic structure RC,fix, limited to a subset of nodes.
This measure allows checking for temporal gradients in phylogenetic
structure.
Contrary to prevailing assumptions that conserved regions are a better
source of phylogenetic structure to resolve deep level nodes, we found
that noncoding regions from plastids yield significantly more phylogenetic
structure especially in deeper nodes.
High functional constraints generally lead to low phylogenetic structure.
Thus noncoding DNA from plastids and mitochondria generally yields
more phylogenetic structure than slow evolving genes except for the
unique fast evolving matK.
Phylogenetic marker from plastids generally yield more phylogenetic
structure on a per nucleotide basis compared to mitochondrial marker.
Differences in phylogenetic structure under a constrained topology (Rcfix)
and without such a constraint (RC) correlate with the total amount of
phylogenetic structure. In mosses, the dominant sources of phylogenetic
structure are matK and noncoding plastid marker.
83

The gradient in phylogenetic structure G =RC,fix(S2) - RC,fix(S1) often
appears low, but tripartite analyses show more intricacies in structure
distribution among partitions.
Small gradients in phylogenetic structure are not necessarily a sign of a
uniform distribution; when comparing these results to the tripartite
analyses, we often find significant differences.
Tendencies in a marker or partition to either resolve old or young nodes,
deduced from the gradient G, do not reflect common prospects on
marker performance; in mosses, noncoding marker from plastids show a
significant negative gradient distribution, while mitochondrial coding and
noncoding marker provide better information in younger nodes.
Re-sampling of the data into very small replicates lowers the amount of
deduced phylogenetic structure, but still allows significant differences in
each comparison.
Chapter 4: Microstructural evolution of organellar markers
The observed diversity of indel length and motif is suggestive of an
alternative or second mechanism leading to SSRs, as the frequency of
tri-, tetra- and pentanucleotide SSRs is much higher than expected when
assuming an indel to be matching the flanking region just by chance,
which is required for slipped strand mispairing.
Proportionate to their variability, both cytoplasmic genomes exhibit a
similar pattern of indel length and frequency, therefore a common
mechanism can be assumed.
SSRs exhibit more phylogenetic structure than indels other than SSRs.
indices for homoplasy (HI, RI, RC) also exhibit better values in SSRs.
Measures for phylogenetic signal (Fritz's D and Blomberg's K) reveal
lower signal in SSRs, but still near to or better than the expectation
based on a Brownian simulation.
84

As a minimum, no justification to omit a particular kind of indel can be
made based on phylogenetic signal, phylogenetic structure or the
homoplasy index, retention index or consistency index.
Phylogenetic structure RC appears to be a better measure of
phylogenetic quality compared to phylogenetic signal, as it reveals the
effective level of contribution of data to resolve difficult topological
questions.
Four out of five inversions investigated in this study exhibit phylogenetic
signal on a higher level than randomness, but only one position exhibits
more signal than expected on Brownian character evolution simulation.
This may not justify its exclusion from phylogenetic analyses, but a gain
of significant insight into phylogenetic questions should not be expected
either.
85

Acknowledgements
I would like to express my deep gratitude to Professor Dr. Quandt and Professor
Dr. Müller, my research supervisors, for their patient guidance and useful
critiques of this research work. I would also like to thank Prof. Max Weigend, Dr.
Federico Lübert and Dr. Jens Mutke for their advice and assistance. My grateful
thanks are also extended to Dr. Marcus Lehnert for his help in interpreting
results and reading the manuscript, to Claudia Schütte, who supported my work
with advice and sequences and to Karola Maul and Susann Wicke for their
support in the lab and letting me contribute to their projects. Furthermore, I
would like to thank Prof. Dr. Scot Kelchner, Prof. Dr. Bernard Goffinet, Dr.
Susana Magallón, Dr. Yang Liu, Dr. Rafael Medina, Dr. Lily Lewis, Prof. Dr.
Volker Knoop, Monika Polsakiewicz and Ben Stöver for sharing ideas and data
to the projects. I would also like to extend my thanks to all other past and
present members of the Quandt working group and all the other people in the
Nees Institute and the botanical garden, especially Thomas Joßberger, Jürgen
Ensikat, Prof. Dr. Scheersoi, Elisabeth Gebhard and finally Elke Hedke, who
expedited administrative proceedings with empathy.
Finally, I wish to thank my parents for their support and encouragement
throughout my study. I would also like to thank my wife who accompanied most
of my academic life so far. And finally I thank all my friends who enriched my
study time in Bonn with joy.
86

References
Álvarez, I., Wendel, J.F., 2003. Ribosomal ITS sequences and plant phylogenetic inference. Mol. Phylogenet. Evol. 29, 417–434. doi:10.1016/S1055-7903(03)00208-2
Anderson, L.E., 1963. Mosses. Bryologist 66, 107. doi:10.2307/3240710
Archie, J.W., 1989. A Randomization Test for Phylogenetic Information in Systematic Data. Syst. Zool. 38, 239–252. doi:10.2307/2992285
Avise, J.C., Arnold, J., Ball, R.M., Bermingham, E., Lamb, T., Neigel, J.E., Reeb, C.A., Saunders, N.C., 1987. Intraspecific Phylogeography: The Mitochondrial DNA Bridge Between Population Genetics and Systematics. Annu. Rev. Ecol. Syst. 18, 489–522. doi:10.1146/annurev.es.18.110187.002421
Baldwin, B.G., Sanderson, M.J., Porter, J.M., Wojciechowski, M.F., Campbell, C.S., Donoghue, M.J., 1995. The its Region of Nuclear Ribosomal DNA: A Valuable Source of Evidence on Angiosperm Phylogeny. Ann. Missouri Bot. Gard. 82, 247. doi:10.2307/2399880
Barniske, A.-M., Borsch, T., Müller, K., Krug, M., Worberg, A., Neinhuis, C., Quandt, D., 2012. Phylogenetics of early branching eudicots: Comparing phylogenetic signal across plastid introns, spacers, and genes. J. Syst. Evol. 50, 85–108. doi:10.1111/j.1759-6831.2012.00181.x
Barrett, M., Donoghue, M.J., Sober, E., 1991. Against Consensus. Syst. Zool. 40, 486. doi:10.2307/2992242
Bateman, R.M., Crane, P.R., DiMichele, W.A., Kenrick, P.R., Rowe, N.P., Speck, T., Stein, W.E., 1998. Early Evolution of Land Plants: Phylogeny, Physiology, and Ecology of the Primary Terrestrial Radiation. Annu. Rev. Ecol. Syst. 29, 263–292. doi:10.1146/annurev.ecolsys.29.1.263
Beagley, C.T., Okimoto, R., Wolstenholme, D.R., 1998. The mitochondrial genome of the sea anemone Metridium senile (Cnidaria): Introns, a paucity of tRNA genes, and a near-standard genetic code. Genetics 148, 1091–1108. doi:10.1139/z82-412
Beckert, S., Muhle, H., Pruchner, D., Knoop, V., 2001. The mitochondrial nad2 gene as a novel marker locus for phylogenetic analysis of early land plants: a comparative analysis in mosses. Mol Phylogenet Evol 18, 117–126. doi:10.1006/mpev.2000.0868
Beckert, S., Steinhauser, S., Muhle, H., Knoop, V., 1999. A molecular phylogeny of bryophytes based on nucleotide sequences of the mitochondrial nad5 gene. Plant Syst. Evol. 218, 179–192. doi:10.1007/BF01089226
87

Bell, N.E., Hyvönen, J., 2010. Phylogeny of the moss class Polytrichopsida (BRYOPHYTA): Generic-level structure and incongruent gene trees. Mol. Phylogenet. Evol. 55, 381–398. doi:10.1016/j.ympev.2010.02.004
Bendich, A.J., 2004. Circular Chloroplast Chromosomes: The Grand Illusion. Plant Cell Online 16, 1661–1666. doi:10.1105/tpc.160771
Bergthorsson, U., Adams, K.L., Thomason, B., Palmer, J.D., 2003. Widespread horizontal transfer of mitochondrial genes in flowering plants. Nature 424, 197–201. doi:10.1038/nature01743
Betancur, R., Naylor, G.J.P., Ortí, G., 2014. Conserved genes, sampling error, and phylogenomic inference. Syst. Biol. 63, 257–262. doi:10.1093/sysbio/syt073
Bird, C.P., Stranger, B.E., Dermitzakis, E.T., 2006. Functional variation and evolution of non-coding DNA. Curr. Opin. Genet. Dev. 16, 559–564. doi:10.1016/j.gde.2006.10.003
Blaimer, B.B., Brady, S.G., Schultz, T.R., Lloyd, M.W., Fisher, B.L., Ward, P.S., 2015. Phylogenomic methods outperform traditional multi-locus approaches in resolving deep evolutionary history: a case study of formicine ants. BMC Evol. Biol. 15, 271. doi:10.1186/s12862-015-0552-5
Blomberg, S.P., Garland, T., Ives, A.R., 2003. Testing for phylogenetic signal in comparative data: behavioral traits are more labile. Evolution (N. Y). 57, 717–745. doi:10.1111/j.0014-3820.2003.tb00285.x
Blomquist, H.L., Robertson, L.L., 1941. The Development of the Peristome in Aulacomnium heterostichum. Bull. Torrey Bot. Club 68, 569. doi:10.2307/2481457
Bock, R., 2007. Structure, function, and inheritance of plastid genomes. pp. 29–63. doi:10.1007/4735_2007_0223
Bock, R., Knoop, V., 2012. Genomics of chloroplasts and mitochondria, Advances in Photosynthesis and Respiration. Springer Netherlands, Dordrecht. doi:10.1007/978-94-007-2920-9
Boffey, S.A., Leech, R.M., 1982. Chloroplast DNA levels and the control of chloroplast division in light-grown wheat leaves. Plant Physiol. 69, 1387–1391.
Boore, J.L., 1999. Animal mitochondrial genomes. Nucleic Acids Res. 27, 1767–80. doi:10.1093/nar/27.8.1767
Borsch, T., Hilu, K.W., Quandt, D., Wilde, V., Neinhuis, C., Barthlott, W., 2003. Noncoding plastid trnT-trnF sequences reveal a well resolved phylogeny of basal angiosperms. J. Evol. Biol. 16, 558–576. doi:10.1046/j.1420-9101.2003.00577.x
88

Borsch, T., Hilu, K.W., Wiersema, J.H., Löhne, C., Barthlott, W., Wilde, V., 2007. Phylogeny of Nymphaea (Nymphaeaceae): Evidence from Substitutions and Microstructural Changes in the Chloroplast trnT‐trnF Region. Int. J. Plant Sci. 168, 639–671. doi:10.1086/513476
Borsch, T., Quandt, D., 2009. Mutational dynamics and phylogenetic utility of noncoding chloroplast DNA. Plant Syst. Evol. 282, 169–199. doi:10.1007/s00606-009-0210-8
Boyce, C.K., Brodribb, T.J., Feild, T.S., Zwieniecki, M. a, 2009. Angiosperm leaf vein evolution was physiologically and environmentally transformative. Proc. Biol. Sci. 276, 1771–6. doi:10.1098/rspb.2008.1919
Boyce, C.K., Lee, J.-E., Feild, T.S., Brodribb, T.J., Zwieniecki, M. a., 2010. Angiosperms Helped Put the Rain in the Rainforests: The Impact of Plant Physiological Evolution on Tropical Biodiversity. Ann. Missouri Bot. Gard. 97, 527–540. doi:10.3417/2009143
Braithwaite, R., 1887. The British moss-flora. L. Reeve & Co, London.
Brenner, G.J., 1996. Evidence for the Earliest Stage of Angiosperm Pollen Evolution: A Paleoequatorial Section from Israel, in: Flowering Plant Origin, Evolution & Phylogeny. Springer US, Boston, MA, pp. 91–115. doi:10.1007/978-0-585-23095-5_5
Brotherus, V.F., 1924. Musci, in: Engler, A., Prantl, K. (Eds.), Die Natürlichen Pflanzenfamilien, 2d Ed. Vols. Duncker and Humblot, Berlin, pp. 1–478.
Browning, A.J., Gunning, B.E.S., 1979. Structure and Function of Transfer Cells in the Sporophyte Haustorium of Funaria hygrometrica Hedw. J. Exp. Bot. 30, 1247–1264. doi:10.1093/jxb/30.6.1247
Bruford, M.W., Wayne, R.K., 1993. Microsatellites and their application to population genetic studies. Curr. Opin. Genet. Dev. 3, 939–943. doi:10.1016/0959-437X(93)90017-J
Buck, W.R., Crum, H., 1990. An evaluation of familial limits among the genera traditionally aligned with the Thuidiaceae and Leskeaceae. Contrib. from Univ. Michigan Herb. 17, 55–69.
Budke, J.M., Jones, C.S., Goffinet, B., 2007. Development of the enigmatic peristome of Timmia megapolitana (Timmiaceae; Bryophyta). Am. J. Bot. 94, 460–467. doi:10.3732/ajb.94.3.460
Burger, G., Yan, Y., Javadi, P., Lang, B.F., 2009. Group I-intron trans-splicing and mRNA editing in the mitochondria of placozoan animals. Trends Genet. 25, 381–386. doi:10.1016/j.tig.2009.07.003
89

Campagna, M.L., Downie, S.R., 1998. The Intron in Chloroplast Gene rpl 16 is Missing From the Flowering Plant Families Geraniaceae, Goodeniaceae, and Plumbaginaceae. Gene 91, 1–11.
Cavalier-Smith, T., 1992. The number of symbiotic origins of organelles. BioSystems 28, 91–106. doi:10.1016/0303-2647(92)90011-M
Cavalier-Smith, T., 1978. Nuclear volume control by nucleoskeletal DNA, selection for cell volume and cell growth rate, and the solution of the DNA C-value paradox. J. Cell Sci. 34, 247–278.
Cech, T., 1990. Self-Splicing Of Group I Introns. Annu. Rev. Biochem. 59, 543–568. doi:10.1146/annurev.biochem.59.1.543
Cech, T.R., 1986. The generality of self-splicing RNA: relationship to nuclear mRNA splicing. Cell 44, 207–210.
Chambers, G.K., MacAvoy, E.S., 2000. Microsatellites: Consensus and controversy. Comp. Biochem. Physiol. - B Biochem. Mol. Biol. 126, 455–476. doi:10.1016/S0305-0491(00)00233-9
Chang, Y., Graham, S.W., 2011. Inferring the higher-order phylogeny of mosses (Bryophyta) and relatives using a large, multigene plastid data set. Am. J. Bot. 98, 839–849. doi:10.3732/ajb.0900384
Chase, M.W., Christenhusz, M.J.M., Fay, M.F., Byng, J.W., Judd, W.S., Soltis, D.E., Mabberley, D.J., Sennikov, A.N., Soltis, P.S., Stevens, P.F., Briggs, B., Brockington, S., Chautems, A., Clark, J.C., Conran, J., Haston, E., M??ller, M., Moore, M., Olmstead, R., Perret, M., Skog, L., Smith, J., Tank, D., Vorontsova, M., Weber, A., 2016. An update of the Angiosperm Phylogeny Group classification for the orders and families of flowering plants: APG IV. Bot. J. Linn. Soc. 181, 1–20. doi:10.1111/boj.12385
Chase, M.W., Soltis, D.E., Olmstead, R.G., Morgan, D., Les, D.H., Mishler, B.D., Duvall, M.R., Price, R.A., Hills, H.G., Qiu, Y.-L., Kron, K.A., Rettig, J.H., Conti, E., Palmer, J.D., Manhart, J.R., Sytsma, K.J., Michaels, H.J., Kress, W.J., Karol, K.G., Clark, W.D., Hedren, M., Gaut, B.S., Jansen, R.K., Kim, K.-J., Wimpee, C.F., Smith, J.F., Furnier, G.R., Strauss, S.H., Xiang, Q.-Y., Plunkett, G.M., Soltis, P.S., Swensen, S.M., Williams, S.E., Gadek, P.A., Quinn, C.J., Eguiarte, L.E., Golenberg, E., Learn, G.H., Graham, S.W., Barrett, S.C.H., Dayanandan, S., Albert, V.A., 1993. Phylogenetics of Seed Plants: An Analysis of Nucleotide Sequences from the Plastid Gene rbcL. Ann. Missouri Bot. Gard. 80, 528. doi:10.2307/2399846
90

Chiang, T.-Y., Schaal, B.A., Peng, C.-I., 1998. Universal primers for amplification and sequencing a noncoding spacer between the atpB and rbcL genes of chloroplast DNA. Bot. Bull. Acad. Sin. 39.
Christiano De Souza, I.C., Ricardi Branco, F.S., Vargas, Y.L., 2012. Permian bryophytes of Western Gondwanaland from the Paraná Basin in Brazil. Palaeontology 55, 229–241. doi:10.1111/j.1475-4983.2011.01111.x
Cox, C.J., Goffinet, B., Newton, A.E., Shaw, A.J., Hedderson, T.A.J., 2000. Phylogenetic Relationships Among the Diplolepideous-alternate Mosses (Bryidae) Inferred from Nuclear and Chloroplast DNA Sequences. Bryologist 103, 224–241. doi:10.1639/0007-2745(2000)103[0224:PRATDA]2.0.CO;2
Cox, C.J., Goffinet, B., Shaw, A.J., Boles, S.B., 2004. Phylogenetic Relationships among the Mosses Based on Heterogeneous Bayesian Analysis of Multiple Genes from Multiple Genomic Compartments. Syst. Bot. 29, 234–250. doi:10.1600/036364404774195458
Cox, C.J., Goffinet, B., Wickett, N.J., Boles, S.B., Shaw, a J., 2010. Moss diversity: A molecular phylogenetic analysis of genera. Phytotaxa 9, 175–195.
Cox, C.J., Li, B., Foster, P.G., Embley, T.M., Civán, P., Civan, P., 2014. Conflicting Phylogenies for Early Land Plants are Caused by Composition Biases among Synonymous Substitutions. Syst. Biol. 63, 272–279. doi:10.1093/sysbio/syt109
Crosby, M.R., 1980. The diversity and relationships of mosses. mosses North Am. 115, 129.
Crum, H.A., Anderson, L.E., 1981. Mosses of Eastern North America. Columbia University Press.
Crundwell, A.C., 1979. Rhizoids and moss taxonomy. Bryophyt. Syst. 347–363.
Darlu, P., Lecointre, G., 2002. When Does the Incongruence Length Difference Test Fail? Mol. Biol. Evol. 19, 432–437. doi:10.1093/oxfordjournals.molbev.a004098
de Bridel-Brideri, S.-E., 1827. Bryologia universa seu systematica ad novam methodum dispositio: historia et descriptio omnium muscorum frondosorum huscusque cognitorum cum synonymia ex auctoribus probatissimis. Barth.
Dib, C., Fauré, S., Fizames, C., Samson, D., Drouot, N., Vignal, A., Millasseau, P., Marc, S., Kazan, J., Seboun, E., Lathrop, M., Gyapay, G., Morissette, J., Weissenbach, J., 1996. A comprehensive genetic map of the human genome based on 5,264 microsatellites. Nature 380, 152–154. doi:10.1038/380152a0
Dietrich, W.F., Miller, J., Steen, R., Merchant, M.A., Damron-Boles, D., Husain, Z., Dredge, R., Daly, M.J., Ingalls, K.A., Evans, C.A., DeAngelis, M.M., Kruglyak, L., Goodman, N., Copeland, N.G., Jenkins, N.A., Hawkins, T.L., Stein, L., Page,
91

D.C., Lander, E.S., 1996. A comprehensive genetic map of the mouse genome. Nature 380, 149–152. doi:10.1038/380149a0
Dixon, H.N., 1924. The student’s handbook of British mosses, 3rd ed. VT Sumfield.
Dolphin, K., Belshaw, R., Orme, C.D.L., Quicke, D.L.J., 2000. Noise and Incongruence: Interpreting Results of the Incongruence Length Difference Test. Mol. Phylogenet. Evol. 17, 401–406. doi:10.1006/mpev.2000.0845
Doolittle, W.F., Sapienza, C., 1980. Selfish genes, the phenotype paradigm and genome evolution. Nature 284, 601–603. doi:10.1038/284601a0
Drake, J.A., Bird, C., Nemesh, J., Thomas, D.J., Newton-Cheh, C., Reymond, A., Excoffier, L., Attar, H., Antonarakis, S.E., Dermitzakis, E.T., Hirschhorn, J.N., 2006. Conserved noncoding sequences are selectively constrained and not mutation cold spots. Nat. Genet. 38, 223–227. doi:10.1038/ng1710
Drescher, A., Stephanie, R., Calsa, T., Carrer, H., Bock, R., 2000. The two largest chloroplast genome-encoded open reading frames of higher plants are essential genes. Plant J. 22, 97–104. doi:10.1046/j.1365-313X.2000.00722.x
Drummond, A.J., Suchard, M.A., Xie, D., Rambaut, A., 2012. Bayesian phylogenetics with BEAUti and the BEAST 1.7. Mol. Biol. Evol. 29, 1969–73. doi:10.1093/molbev/mss075
Duff, R.J., Nickrent, D.L., 1999. Phylogenetic Relationships of Land Plants using Mitochondrial Small-Subunit rDNA Sequences. Am. J. Bot. 86, 372–386. doi:10.2307/2656759
Dunham, I., Kundaje, A., Aldred, S.F., Collins, P.J., Davis, C.A., Doyle, F., Epstein, C.B., Frietze, S., Harrow, J., Kaul, R., Khatun, J., Lajoie, B.R., Landt, S.G., Lee, B.-K., Pauli, F., Rosenbloom, K.R., Sabo, P., Safi, A., Sanyal, A., Shoresh, N., Simon, J.M., Song, L., Trinklein, N.D., Altshuler, R.C., Birney, E., Brown, J.B., Cheng, C., Djebali, S., Dong, X., Dunham, I., Ernst, J., Furey, T.S., Gerstein, M., Giardine, B., Greven, M., Hardison, R.C., Harris, R.S., Herrero, J., Hoffman, M.M., Iyer, S., Kellis, M., Khatun, J., Kheradpour, P., Kundaje, A., Lassmann, T., Li, Q., Lin, X., Marinov, G.K., Merkel, A., Mortazavi, A., Parker, S.C.J., Reddy, T.E., Rozowsky, J., Schlesinger, F., Thurman, R.E., Wang, J., Ward, L.D., Whitfield, T.W., Wilder, S.P., Wu, W., Xi, H.S., Yip, K.Y., Zhuang, J., Bernstein, B.E., Birney, E., Dunham, I., Green, E.D., Gunter, C., Snyder, M., Pazin, M.J., Lowdon, R.F., Dillon, L.A.L., Adams, L.B., Kelly, C.J., Zhang, J., Wexler, J.R., Green, E.D., Good, P.J., Feingold, E.A., Bernstein, B.E., Birney, E., Crawford, G.E., Dekker, J., Elnitski, L., Farnham, P.J., Gerstein, M., Giddings, M.C., Gingeras, T.R., Green, E.D., Guigó, R., Hardison, R.C., Hubbard, T.J., Kellis, M., Kent, W.J., Lieb, J.D., Margulies, E.H., Myers, R.M., Snyder, M., Stamatoyannopoulos, J.A., Tenenbaum, S.A., Weng, Z., White, K.P., Wold, B.,
92

Khatun, J., Yu, Y., Wrobel, J., Risk, B.A., Gunawardena, H.P., Kuiper, H.C., Maier, C.W., Xie, L., Chen, X., Giddings, M.C., Bernstein, B.E., Epstein, C.B., Shoresh, N., Ernst, J., Kheradpour, P., Mikkelsen, T.S., Gillespie, S., Goren, A., Ram, O., Zhang, X., Wang, L., Issner, R., Coyne, M.J., Durham, T., Ku, M., Truong, T., Ward, L.D., Altshuler, R.C., Eaton, M.L., Kellis, M., Djebali, S., Davis, C.A., Merkel, A., Dobin, A., Lassmann, T., Mortazavi, A., Tanzer, A., Lagarde, J., Lin, W., Schlesinger, F., Xue, C., Marinov, G.K., Khatun, J., Williams, B.A., Zaleski, C., Rozowsky, J., Röder, M., Kokocinski, F., Abdelhamid, R.F., Alioto, T., Antoshechkin, I., Baer, M.T., Batut, P., Bell, I., Bell, K., Chakrabortty, S., Chen, X., Chrast, J., Curado, J., Derrien, T., Drenkow, J., Dumais, E., Dumais, J., Duttagupta, R., Fastuca, M., Fejes-Toth, K., Ferreira, P., Foissac, S., Fullwood, M.J., Gao, H., Gonzalez, D., Gordon, A., Gunawardena, H.P., Howald, C., Jha, S., Johnson, R., Kapranov, P., King, B., Kingswood, C., Li, G., Luo, O.J., Park, E., Preall, J.B., Presaud, K., Ribeca, P., Risk, B.A., Robyr, D., Ruan, X., Sammeth, M., Sandhu, K.S., Schaeffer, L., See, L.-H., Shahab, A., Skancke, J., Suzuki, A.M., Takahashi, H., Tilgner, H., Trout, D., Walters, N., Wang, H., Wrobel, J., Yu, Y., Hayashizaki, Y., Harrow, J., Gerstein, M., Hubbard, T.J., Reymond, A., Antonarakis, S.E., Hannon, G.J., Giddings, M.C., Ruan, Y., Wold, B., Carninci, P., Guigó, R., Gingeras, T.R., Rosenbloom, K.R., Sloan, C.A., Learned, K., Malladi, V.S., Wong, M.C., Barber, G.P., Cline, M.S., Dreszer, T.R., Heitner, S.G., Karolchik, D., Kent, W.J., Kirkup, V.M., Meyer, L.R., Long, J.C., Maddren, M., Raney, B.J., Furey, T.S., Song, L., Grasfeder, L.L., Giresi, P.G., Lee, B.-K., Battenhouse, A., Sheffield, N.C., Simon, J.M., Showers, K.A., Safi, A., London, D., Bhinge, A.A., Shestak, C., Schaner, M.R., Ki Kim, S., Zhang, Z.Z., Mieczkowski, P.A., Mieczkowska, J.O., Liu, Z., McDaniell, R.M., Ni, Y., Rashid, N.U., Kim, M.J., Adar, S., Zhang, Z., Wang, T., Winter, D., Keefe, D., Birney, E., Iyer, V.R., Lieb, J.D., Crawford, G.E., Li, G., Sandhu, K.S., Zheng, M., Wang, P., Luo, O.J., Shahab, A., Fullwood, M.J., Ruan, X., Ruan, Y., Myers, R.M., Pauli, F., Williams, B.A., Gertz, J., Marinov, G.K., Reddy, T.E., Vielmetter, J., Partridge, E., Trout, D., Varley, K.E., Gasper, C., Bansal, A., Pepke, S., Jain, P., Amrhein, H., Bowling, K.M., Anaya, M., Cross, M.K., King, B., Muratet, M.A., Antoshechkin, I., Newberry, K.M., McCue, K., Nesmith, A.S., Fisher-Aylor, K.I., Pusey, B., DeSalvo, G., Parker, S.L., Balasubramanian, S., Davis, N.S., Meadows, S.K., Eggleston, T., Gunter, C., Newberry, J.S., Levy, S.E., Absher, D.M., Mortazavi, A., Wong, W.H., Wold, B., Blow, M.J., Visel, A., Pennachio, L.A., Elnitski, L., Margulies, E.H., Parker, S.C.J., Petrykowska, H.M., Abyzov, A., Aken, B., Barrell, D., Barson, G., Berry, A., Bignell, A., Boychenko, V., Bussotti, G., Chrast, J., Davidson, C., Derrien, T., Despacio-Reyes, G., Diekhans, M., Ezkurdia, I., Frankish, A., Gilbert, J., Gonzalez, J.M., Griffiths, E., Harte, R., Hendrix, D.A., Howald, C., Hunt, T., Jungreis, I., Kay, M., Khurana, E., Kokocinski, F., Leng, J., Lin, M.F., Loveland, J., Lu, Z., Manthravadi, D., Mariotti, M., Mudge, J.,
93

Mukherjee, G., Notredame, C., Pei, B., Rodriguez, J.M., Saunders, G., Sboner, A., Searle, S., Sisu, C., Snow, C., Steward, C., Tanzer, A., Tapanari, E., Tress, M.L., van Baren, M.J., Walters, N., Washietl, S., Wilming, L., Zadissa, A., Zhang, Z., Brent, M., Haussler, D., Kellis, M., Valencia, A., Gerstein, M., Reymond, A., Guigó, R., Harrow, J., Hubbard, T.J., Landt, S.G., Frietze, S., Abyzov, A., Addleman, N., Alexander, R.P., Auerbach, R.K., Balasubramanian, S., Bettinger, K., Bhardwaj, N., Boyle, A.P., Cao, A.R., Cayting, P., Charos, A., Cheng, Y., Cheng, C., Eastman, C., Euskirchen, G., Fleming, J.D., Grubert, F., Habegger, L., Hariharan, M., Harmanci, A., Iyengar, S., Jin, V.X., Karczewski, K.J., Kasowski, M., Lacroute, P., Lam, H., Lamarre-Vincent, N., Leng, J., Lian, J., Lindahl-Allen, M., Min, R., Miotto, B., Monahan, H., Moqtaderi, Z., Mu, X.J., O’Geen, H., Ouyang, Z., Patacsil, D., Pei, B., Raha, D., Ramirez, L., Reed, B., Rozowsky, J., Sboner, A., Shi, M., Sisu, C., Slifer, T., Witt, H., Wu, L., Xu, X., Yan, K.-K., Yang, X., Yip, K.Y., Zhang, Z., Struhl, K., Weissman, S.M., Gerstein, M., Farnham, P.J., Snyder, M., Tenenbaum, S.A., Penalva, L.O., Doyle, F., Karmakar, S., Landt, S.G., Bhanvadia, R.R., Choudhury, A., Domanus, M., Ma, L., Moran, J., Patacsil, D., Slifer, T., Victorsen, A., Yang, X., Snyder, M., White, K.P., Auer, T., Centanin, L., Eichenlaub, M., Gruhl, F., Heermann, S., Hoeckendorf, B., Inoue, D., Kellner, T., Kirchmaier, S., Mueller, C., Reinhardt, R., Schertel, L., Schneider, S., Sinn, R., Wittbrodt, B., Wittbrodt, J., Weng, Z., Whitfield, T.W., Wang, J., Collins, P.J., Aldred, S.F., Trinklein, N.D., Partridge, E.C., Myers, R.M., Dekker, J., Jain, G., Lajoie, B.R., Sanyal, A., Balasundaram, G., Bates, D.L., Byron, R., Canfield, T.K., Diegel, M.J., Dunn, D., Ebersol, A.K., Frum, T., Garg, K., Gist, E., Hansen, R.S., Boatman, L., Haugen, E., Humbert, R., Jain, G., Johnson, A.K., Johnson, E.M., Kutyavin, T. V., Lajoie, B.R., Lee, K., Lotakis, D., Maurano, M.T., Neph, S.J., Neri, F. V., Nguyen, E.D., Qu, H., Reynolds, A.P., Roach, V., Rynes, E., Sabo, P., Sanchez, M.E., Sandstrom, R.S., Sanyal, A., Shafer, A.O., Stergachis, A.B., Thomas, S., Thurman, R.E., Vernot, B., Vierstra, J., Vong, S., Wang, H., Weaver, M.A., Yan, Y., Zhang, M., Akey, J.M., Bender, M., Dorschner, M.O., Groudine, M., MacCoss, M.J., Navas, P., Stamatoyannopoulos, G., Kaul, R., Dekker, J., Stamatoyannopoulos, J.A., Dunham, I., Beal, K., Brazma, A., Flicek, P., Herrero, J., Johnson, N., Keefe, D., Lukk, M., Luscombe, N.M., Sobral, D., Vaquerizas, J.M., Wilder, S.P., Batzoglou, S., Sidow, A., Hussami, N., Kyriazopoulou-Panagiotopoulou, S., Libbrecht, M.W., Schaub, M.A., Kundaje, A., Hardison, R.C., Miller, W., Giardine, B., Harris, R.S., Wu, W., Bickel, P.J., Banfai, B., Boley, N.P., Brown, J.B., Huang, H., Li, Q., Li, J.J., Noble, W.S., Bilmes, J.A., Buske, O.J., Hoffman, M.M., Sahu, A.D., Kharchenko, P. V., Park, P.J., Baker, D., Taylor, J., Weng, Z., Iyer, S., Dong, X., Greven, M., Lin, X., Wang, J., Xi, H.S., Zhuang, J., Gerstein, M., Alexander, R.P., Balasubramanian, S., Cheng, C., Harmanci, A., Lochovsky, L., Min, R., Mu, X.J., Rozowsky, J., Yan, K.-K., Yip, K.Y., Birney, E.,
94

2012. An integrated encyclopedia of DNA elements in the human genome. Nature 489, 57–74. doi:10.1038/nature11247
Dunn, C.W., Hejnol, A., Matus, D.Q., Pang, K., Browne, W.E., Smith, S.A., Seaver, E., Rouse, G.W., Obst, M., Edgecombe, G.D., Sørensen, M. V., Haddock, S.H.D., Schmidt-Rhaesa, A., Okusu, A., Kristensen, R.M., Wheeler, W.C., Martindale, M.Q., Giribet, G., 2008. Broad phylogenomic sampling improves resolution of the animal tree of life. Nature 452, 745–749. doi:10.1038/nature06614
Edwards, S.R., 1984. Homologies and inter-relationships of moss peristomes. New Man. Bryol. 2, 658–695.
Edwards, S.R., 1979. Taxonomic implications of cell patterns in haplolepidous moss peristomes. Bryophyt. Syst. 317, 658–695.
Eisen, J.A., 1998. Phylogenomics : Improving Functional Predictions for Uncharacterized Genes by Evolutionary Analysis. Genome Res. 163–167. doi:10.1101/gr.8.3.163
Farris, J.S., 1989. The retention index and the rescaled consistency index. Cladistics 5, 417–419. doi:10.1111/j.1096-0031.1989.tb00573.x
Farris, J.S., KÄllersjÖ, M., Kluge, A.G., Bult, C., 1995. Constructing a significance test for incongruence. Syst. Biol. doi:10.1093/sysbio/44.4.570
Feild, T.S., Arens, N.C., Doyle, J. a., Dawson, T.E., Donoghue, M.J., 2004. Dark and disturbed: a new image of early angiosperm ecology. Paleobiology 30, 82–107. doi:10.1666/0094-8373(2004)030<0082:DADANI>2.0.CO;2
Fiz-Palacios, O., Schneider, H., Heinrichs, J., Savolainen, V., 2011. Diversification of land plants: insights from a family-level phylogenetic analysis. BMC Evol. Biol. 11, 341. doi:10.1186/1471-2148-11-341
Fleischer, M., 1908. Die Musci der Flora von Buitenzorg:(zugleich Laubmoosflora von Java). EJ Brill.
Fritz, S.A., Purvis, A., 2010. Selectivity in mammalian extinction risk and threat types: A new measure of phylogenetic signal strength in binary traits. Conserv. Biol. 24, 1042–1051. doi:10.1111/j.1523-1739.2010.01455.x
Galili, T., 2015. dendextend: an R package for visualizing, adjusting and comparing trees of hierarchical clustering. Bioinformatics 31, 3718–3720. doi:10.1093/bioinformatics/btv428
Gatesy, J., Baker, R.H., 2005. Hidden likelihood support in genomic data: can forty-five wrongs make a right? Syst. Biol. 54, 483–492. doi:10.1080/10635150590945368
Gatesy, J., O’Grady, P., Baker, R.H., 1999. Corroboration among Data Sets in Simultaneous Analysis: Hidden Support for Phylogenetic Relationships among
95

Higher Level Artiodactyl Taxa. Cladistics 15, 271–313. doi:10.1111/j.1096-0031.1999.tb00268.x
Gernhard, T., 2008. The conditioned reconstructed process. J. Theor. Biol. 253, 769–778. doi:10.1016/j.jtbi.2008.04.005
Giribet, G., Wheeler, W.C., 1999. On gaps. Cladistics 13, 132–143.
Goffinet, B., Buck, W.R., 2004. Systematics of Bryophyta: from molecules to a revised classification. Monogr. Syst. Bot. from Missouri Bot. Gard. 98, 205–239.
Goffinet, B., Cox, C.J., 2000. Phylogenetic Relationships Among Basal-most Arthrodontous Mosses with Special Emphasis on the Evolutionary Significance of the Funariineae. Bryologist 103, 212–223. doi:10.1639/0007-2745(2000)103[0212:PRABMA]2.0.CO;2
Goffinet, B., Wickett, N.J., Werner, O., Ros, R.M., Shaw, A.J., Cox, C.J., 2007. Distribution and phylogenetic significance of the 71-kb inversion in the plastid genome in Funariidae (Bryophyta). Ann. Bot. 99, 747–753. doi:10.1093/aob/mcm010
Goldstein, D.B., Pollock, D.D., 1997. Launching microsatellites: a review of mutation processes and methods of phylogenetic interference. J. Hered. 88, 335–342. doi:10.1093/oxfordjournals.jhered.a023114
Graham, L.E., 1993. Origin of land plants. John Wiley & Sons, Inc., New York.
Graham, L.K.E., Wilcox, L.W., 2000. The origin of alternation of generations in land plants: a focus on matrotrophy and hexose transport. Philos. Trans. R. Soc. Lond. B. Biol. Sci. 355, 757-66–7. doi:10.1098/rstb.2000.0614
Graham, S.W., Kohn, J.R., Morton, B.R., Eckenwalder, J.E., Spencer, C.H., Biology, S., Dec, N., 1998. Phylogenetic Congruence and Discordance among One Morphological and Three Molecular Data Sets from Pontederiaceae Phylogenetic Congruence and Discordance Among One Morphological and Three Molecular Data Sets from Pontederiaceae 47, 545–567.
Graham, S.W., Reeves, P. a., Burns, A.C.E., Olmstead, R.G., 2000. Microstructural changes in noncoding chloroplast DNA: interpretation, evolution, and utility of indels and inversions in basal angiosperm phylogenetic inference. Int. J. Plant Sci. 161, S83–S96. doi:10.1086/317583
Gray, J., Chaloner, W.G., Westoll, T.S., 1985. The Microfossil Record of Early Land Plants: Advances in Understanding of Early Terrestrialization, 1970-1984 [and Discussion]. Philos. Trans. R. Soc. B Biol. Sci. 309, 167–195. doi:10.1098/rstb.1985.0077
96

Gray, M.W., 1989. The evolutionary origins of organelles. Trends Genet. 5, 294–299. doi:10.1016/0168-9525(89)90111-X
Gray, M.W., Burger, G., Lang, B.F., 1999. Mitochondrial Evolution. Science (80-. ). 283, 1476–1481. doi:10.1126/science.283.5407.1476
Greaves, D.R., Patient, R.K., 1985. (AT)n is an interspersed repeat in the Xenopus genome. EMBO J. 4, 2617–2626.
Grewe, F., Viehoever, P., Weisshaar, B., Knoop, V., 2009. A trans-splicing group I intron and tRNA-hyperediting in the mitochondrial genome of the lycophyte Isoetes engelmannii. Nucleic Acids Res. 37, 5093–5104. doi:10.1093/nar/gkp532
Groth-Malonek, M., Pruchner, D., Grewe, F., Knoop, V., 2005. Ancestors of trans-splicing mitochondrial introns support serial sister group relationships of hornworts and mosses with vascular plants. Mol. Biol. Evol. 22, 117–125. doi:10.1093/molbev/msh259
Groth-Malonek, M., Rein, T., Wilson, R., Groth, H., Heinrichs, J., Knoop, V., Croth, H., Heinrichs, J., Knoop, V., 2007. Different fates of two mitochondrial gene spacers in early land plant evolution. Int. J. Plant Sci. 168, 709–717. doi:10.1086/513472
Grout, A.J., 1903. Mosses with Hand-lens and Microscope.
Guo, W., Grewe, F., Fan, W., Young, G.J., Knoop, V., Palmer, J.D., Mower, J.P., 2016. Ginkgo and Welwitschia Mitogenomes Reveal Extreme Contrasts in Gymnosperm Mitochondrial Evolution. Mol. Biol. Evol. 33, 1448–1460. doi:10.1093/molbev/msw024
Hackett, J.D., Yoon, H.S., Li, S., Reyes-Prieto, A., Rümmele, S.E., Bhattacharya, D., 2007. Phylogenomic analysis supports the monophyly of cryptophytes and haptophytes and the association of rhizaria with chromalveolates. Mol. Biol. Evol. 24, 1702–1713. doi:10.1093/molbev/msm089
Hagemann, R., 2004. The Sexual Inheritance of Plant Organelles, in: Molecular Biology and Biotechnology of Plant Organelles. Springer Netherlands, Dordrecht, pp. 93–113. doi:10.1007/978-1-4020-3166-3_4
Halle, T.G., 1916. A fossil sporogonium from the Lower Devonian of Roragen in Norway. Bot. Notiser 1916: 79-81.. 1936. Notes on the Devonian genus Sporogonites. Sven. Bot. Tidsk 30, 613–623.
Hamada, H., Petrino, M.G., Kakunaga, T., 1982. A novel repeated element with Z-DNA-forming potential is widely found in evolutionarily diverse eukaryotic genomes. Proc. Natl. Acad. Sci. U. S. A. 79, 6465–9. doi:10.1073/pnas.79.21.6465
Handa, H., 2003. The complete nucleotide sequence and RNA editing content of the mitochondrial genome of rapeseed (Brassica napus L.): Comparative analysis of
97

the mitochondrial genomes of rapeseed and Arabidopsis thaliana. Nucleic Acids Res. 31, 5907–5916. doi:10.1093/nar/gkg795
Hasebe, M., Omori, T., Nakazawa, M., Sano, T., Kato, M., Iwatsuki, K., 1994. rbcL gene sequences provide evidence for the evolutionary lineages of leptosporangiate ferns. Proc. Natl. Acad. Sci. U. S. A. 91, 5730–4. doi:10.1073/pnas.91.12.5730
Hausner, G., Olson, R., Simon, D., Johnson, I., Sanders, E.R., Karol, K.G., McCourt, R.M., Zimmerly, S., 2006. Origin and evolution of the chloroplast trnK (matK) intron: a model for evolution of group II intron RNA structures. Mol. Biol. Evol. 23, 380–91. doi:10.1093/molbev/msj047
Hedenäs, L., Eldenäs, P., 2007. Cryptic speciation, habitat differentiation, and geography in Hamatocaulis vernicosus (Calliergonaceae, Bryophyta). Plant Syst. Evol. 268, 131–145. doi:10.1007/s00606-007-0529-y
Hedges, S.B., Marin, J., Suleski, M., Paymer, M., Kumar, S., 2015. Tree of life reveals clock-like speciation and diversification. Mol. Biol. Evol. 32, 835–845. doi:10.1093/molbev/msv037
Hedwig, J., 1801. Species Muscorum Frondorosum Descriptae et Tabulis Aeneis Ixxvii Coloratis Illustatae. Schwaegrichen.
Heibl, C., 2013. PHYLOCH: R language tree plotting tools and interfaces to diverse phylogenetic software packages.
Hiesel, R., Wissinger, B., Schuster, W., Brennicke, A., 1989. RNA editing in plant mitochondria. Science 246, 1632–4. doi:10.1126/science.2480644
Hillis, D.M., 1991. Discriminating Between Phylogenetic Signal and Random Noise in DNA. Phylogenetic Anal. DNA Seq. 278.
Hilu, K., Liang, H., 1997. The matK gene: sequence variation and application in plant systematics. Am. J. Bot. 84, 830. doi:10.2307/2445819
Hilu, K.W., Borsch, T., Müller, K., Soltis, D.E., Soltis, P.S., Savolainen, V., Chase, M.W., Powell, M.P., Alice, L.A., Evans, R., Sauquet, H., Neinhuis, C., Slotta, T.A.B., Rohwer, J.G., Campbell, C.S., Chatrou, L.W., 2003. Angiosperm phylogeny based on matK sequence information. Am. J. Bot. 90, 1758–76. doi:10.3732/ajb.90.12.1758
Huelsenbeck, J.P., 1991. Tree-length distribution skewness: an indicator of phylogenetic information. Syst. Biol. 40, 257–270.
Huttunen, S., Bell, N., Bobrova, V.K., Buchbender, V., Buck, W.R., Cox, C.J., Goffinet, B., Hedenäs, L., Ho, B.-C., Ignatov, M.S., Krug, M., Kuznetsova, O., Milyutina, I.A., Newton, A., Olsson, S., Pokorny, L., Shaw, J.A., Stech, M., Troitsky, A., Vanderpoorten, A., Quandt, D., 2012a. Disentangling knots of rapid evolution:
98

origin and diversification of the moss order Hypnales. J. Bryol. 34, 187–211. doi:10.1179/1743282012Y.0000000013
Huttunen, S., Olsson, S., Buchbender, V., Enroth, J., Hedenäs, L., Quandt, D., 2012b. Phylogeny-Based Comparative Methods Question the Adaptive Nature of Sporophytic Specializations in Mosses. PLoS One 7, e48268. doi:10.1371/journal.pone.0048268
Jablonski, D., 2005. Mass extinctions and macroevolution. Paleobiology 31, 192–210. doi:10.1666/0094-8373(2005)031[0192:MEAM]2.0.CO;2
Jarne, P., Lagoda, P.J.L., 1996. Microsatellites, from molecules to populations and back. Trends Ecol. Evol. 11, 424–429. doi:10.1016/0169-5347(96)10049-5
Jordan, W.C., Courtney, M.W., Neigel, J.E., 1996. Low levels of intraspecific genetic variation at a rapidly evolving chloroplast DNA locus in North American duckweeds (Lemnaceae). Am. J. Bot. 430–439.
Källersjö, M., Albert, V.A., Farris, J.S., Kalersjo, M., Albert, V.A., Farris, J.S., 1999. Homoplasy Increases Phylogenetic Structure. Cladistics 15, 91–93. doi:10.1111/j.1096-0031.1999.tb00400.x
Källersjö, M., Farris, J.S., Kluge, A.G., Bult, C., 1992. Skewness and permutation. Cladistics 8, 275–287.
Kashi, Y., King, D.G., 2006. Simple sequence repeats as advantageous mutators in evolution. Trends Genet. 22, 253–259. doi:10.1016/j.tig.2006.03.005
Kelchner, S.A., 2000. The Evolution of Non-Coding Chloroplast DNA and Its Application in Plant Systematics. Source Ann. Missouri Bot. Gard. 87, 482–498. doi:10.2307/2666142
Kelchner, S.A., Clark, L.G., 1997. Molecular evolution and phylogenetic utility of the chloroplast rpl16 intron in Chusquea and the Bambusoideae (Poaceae). Mol. Phylogenet. Evol. 8, 385–397. doi:10.1006/mpev.1997.0432
Kelchner, S.A., Wendel, J.F., 1996. Hairpins create minute inversions in non coding regions of chloroplast DNA. Curr. Genet. 30, 259–262. doi:10.1007/s002940050130
Kenrick, P., 2000. The relationships of vascular plants. Philos. Trans. R. Soc. B Biol. Sci. 355, 847–855. doi:10.1098/rstb.2000.0619
Kenrick, P., Crane, P.R., 1997. The origin and early evolution of plants on land. Nature 389, 33–39. doi:10.1038/37918
Kluge, A.G., Farris, J.S., 1969. Quantitative Phyletics and the Evolution of Anurans. Syst. Zool. 18, 1. doi:10.2307/2412407
99

Knoop, V., 2012. Seed Plant Mitochondrial Genomes: Complexity Evolving. pp. 175–200. doi:10.1007/978-94-007-2920-9_8
Knoop, V., 2010. Looking for sense in the nonsense: a short review of non-coding organellar DNA elucidating the phylogeny of bryophytes. Trop. Biol. 31, 51–60.
Kruger, K., Grabowski, P.J., Sands, J., Gottschling, D.E., Cech, T.R., Zaug, J., Grabowski, P.J., Zaug, A., 1982. Self-Splicing RNA: Autoexcision and Autocyclization of the Ribosomal RNA Intervening Sequence of Tetrahymena. Cell 31, 147–157.
Kubo, T., Mikami, T., 2007. Organization and variation of angiosperm mitochondrial genome. Physiol. Plant. 129, 6–13. doi:10.1038/29286
Kuhlbrodt, H., 1922. Über die phylogenetische Entwicklung des Spaltöffnungsapparates am Sporophyten der Moose. Beiträge zur Allg. Bot. herausgeg. von Haberlandt 2, 363–402.
Laenen, B., Shaw, B., Schneider, H., Goffinet, B., Paradis, E., Désamoré, A., Heinrichs, J., Villarreal, J.C., Gradstein, S.R., McDaniel, S.F., Long, D.G., Forrest, L.L., Hollingsworth, M.L., Crandall-Stotler, B., Davis, E.C., Engel, J., Von Konrat, M., Cooper, E.D., Patiño, J., Cox, C.J., Vanderpoorten, A., Shaw, A.J., 2014. Extant diversity of bryophytes emerged from successive post-Mesozoic diversification bursts. Nat. Commun. 5, 6134. doi:10.1038/ncomms6134
Lang, B.F., Gray, M.W., Burger, G., 1999. Mitochondrial Genome Evolution and the Origin of Eukaryotes. Annu. Rev. Genet. 33, 351–397. doi:10.1146/annurev.genet.33.1.351
Leigh, J.W., Susko, E., Baumgartner, M., Roger, A.J., 2008. Testing congruence in phylogenomic analysis. Syst. Biol. 57, 104–15. doi:10.1080/10635150801910436
Levinson, G., Gutman, G.A., 1987. Slipped-strand mispairing: a major mechanism for DNA sequence evolution. Mol. Biol. Evol. 4, 203–221. doi:10.1093/oxfordjournals.molbev.a040442
Li, L., Wang, B., Liu, Y., Qiu, Y.-L., 2009. The Complete Mitochondrial Genome Sequence of the Hornwort Megaceros aenigmaticus Shows a Mixed Mode of Conservative Yet Dynamic Evolution in Early Land Plant Mitochondrial Genomes. J. Mol. Evol. 68, 665–678. doi:10.1007/s00239-009-9240-7
Li, W.-H., 1997. Molecular evolution. Sinauer Associates Incorporated, Sunderland.
Lilly, J.W., 2001. Cytogenomic Analyses Reveal the Structural Plasticity of the Chloroplast Genome in Higher Plants. Plant Cell Online 13, 245–254. doi:10.1105/tpc.13.2.245
100

Liu, Y., Cox, C.J., Wang, W., Goffinet, B., 2014a. Mitochondrial Phylogenomics of Early Land Plants: Mitigating the Effects of Saturation, Compositional Heterogeneity, and Codon-Usage Bias. Syst. Biol. 63, 862–878. doi:10.1093/sysbio/syu049
Liu, Y., Medina, R., Goffinet, B., 2014b. 350 My of Mitochondrial Genome Stasis in Mosses, an Early Land Plant Lineage. Mol. Biol. Evol. 31, 2586–2591. doi:10.1093/molbev/msu199
Liu, Y., Xue, J.-Y.Y., Wang, B., Li, L., Qiu, Y.-L.L., 2011. The mitochondrial genomes of the early land plants Treubia lacunosa and Anomodon rugelii: Dynamic and conservative evolution. PLoS One 6, e25836. doi:10.1371/journal.pone.0025836
Löhne, C., Borsch, T., 2005. Molecular evolution and phylogenetic utility of the petD group II intron: A case study in basal angiosperms. Mol. Biol. Evol. 22, 317–332. doi:10.1093/molbev/msi019
Ludwig, M.Z., 2002. Functional evolution of noncoding DNA. Curr. Opin. Genet. Dev. 12, 634–639. doi:10.1016/S0959-437X(02)00355-6
Magallón, S., Sanderson, M.J., 2001. ABSOLUTE DIVERSIFICATION RATES IN ANGIOSPERM CLADES. Evolution (N. Y). 55, 1762. doi:10.1554/0014-3820(2001)055[1762:ADRIAC]2.0.CO;2
Magombo, Z.L.K., 2003. The Phylogeny of Basal Peristomate Mosses : Evidence from cpDNA , and Implications for Peristome Evolution. Syst. Bot. 28, 24–38. doi:10.2307/3093935
Malek, O., Lättig, K., Hiesel, R., Brennicke, A., Knoop, V., 1996. RNA editing in bryophytes and a molecular phylogeny of land plants. EMBO J. 15, 1403–11.
Mander, L., Kürschner, W.M., McElwain, J.C., 2010. An explanation for conflicting records of Triassic-Jurassic plant diversity. Proc. Natl. Acad. Sci. U. S. A. 107, 15351–15356. doi:10.1073/pnas.1004207107
Martin, W., Roettger, M., Kloesges, T., Thiergart, T., Woehle, C., Gould, S., Dagan, T., 2012. Modern endosymbiotic theory: Getting lateral gene transfer in- to the equation. J. Endocytobiosis Cell Res. 23, 1–5.
Mereschkowsky, C., 1905. Über natur und ursprung der chromatophoren im pflanzenreiche. Biol Cent. 25, 593–604.
Michel, F., 1995. Structure and Activities of Group II Introns. Annu. Rev. Biochem. 64, 435–461. doi:10.1146/annurev.biochem.64.1.435
Michel, F., Kazuhiko, U., Haruo, O., 1989. Comparative and functional anatomy of group II catalytic introns — a review. Gene 82, 5–30. doi:10.1016/0378-1119(89)90026-7
101

Mishler, B.D., 1988. Reproductive ecology of bryophytes. Plant Reprod. Ecol. 285–306.
Mishler, B.D., Churchill, S.P., 1985. Transition to a land flora: phylogenetic relationships of the Green Algae and Bryophytes. Cladistics 1, 305–328. doi:10.1111/j.1096-0031.1985.tb00431.x
Mitten, W., 1859. Musci Indiae Orientalis; an enumeration of the mosses of the East Indies. J. Proc. Linnaean Soc. Suppl. to Bot. 1, 1–171.
Mohr, G., Perlman, P.S., Lambowitz, A.M., 1993. Evolutionary relationships among group II intron-encoded proteins and identification of a conserved domain that may be related to maturase function. Nucleic Acids Res. 21, 4991–4997. doi:10.1093/nar/21.22.4991
Moore, B.R., Höhna, S., May, M.R., Rannala, B., Huelsenbeck, J.P., 2016. Critically evaluating the theory and performance of Bayesian analysis of macroevolutionary mixtures. Proc. Natl. Acad. Sci. 113, 9569–9574. doi:10.1073/pnas.1518659113
Morgante, M., Olivieri, A., 1993. PCR-amplified microsatellites as markers in plant genetics. Plant J. 3, 175–182. doi:10.1046/j.1365-313X.1993.t01-9-00999.x
Moritz, C., Dowling, T.E., Brown, W.M., 1987. Evolution of Animal Mitochondrial DNA: Relevance for Population Biology and Systematics. Annu. Rev. Ecol. Syst. 18, 269–292. doi:10.1146/annurev.es.18.110187.001413
Morrison, D.A., 2009. A framework for phylogenetic sequence alignment. Plant Syst. Evol. 282, 127–149. doi:10.1007/s00606-008-0072-5
Müller, J., Müller, K.F., Quandt, D., Neinhuis, C., 2005. PhyDE— Phylogenetic Data Editor, version 0.9971 [online].
Müller, K., 2006. Incorporating information from length-mutational events into phylogenetic analysis. Mol. Phylogenet. Evol. 38, 667–676. doi:10.1016/j.ympev.2005.07.011
Müller, K., 2005. SeqState: Primer design and sequence statistics for phylogenetic DNA datasets. Appl. Bioinformatics 4, 65–69. doi:10.2165/00822942-200504010-00008
Müller, K.F., Borsch, T., Hilu, K.W., 2006. Phylogenetic utility of rapidly evolving DNA at high taxonomical levels: contrasting matK, trnT-F, and rbcL in basal angiosperms. Mol. Phylogenet. Evol. 41, 99–117. doi:10.1016/j.ympev.2006.06.017
Nadot, S., Bajon, R., Lejeune, B., 1994. The chloroplast gene rps 4 as a tool for the study of Poaceae phylogeny. Plant Syst. Evol. 191, 27–38.
Neubig, K.M., Whitten, W.M., Carlsward, B.S., Blanco, M.A., Endara, L., Williams, N.H., Moore, M., 2009. Phylogenetic utility of ycf1 in orchids: a plastid gene more variable than matK. Plant Syst. Evol. 277, 75–84. doi:10.1007/s00606-008-0105-0
102

Neuhaus, H., Link, G., 1987. The chloroplast tRNALys(UUU) gene from mustard (Sinapis alba) contains a class II intron potentially coding for a maturase-related polypeptide. Curr. Genet. 11, 251–257. doi:10.1007/BF00355398
Newton, A.E., Cox, C.J., Duckett, J.G., Wheeler, J.A., Goffinet, B., Hedderson, T.A.J., Mishler, B.D., 2000. Evolution of the Major Moss Lineages: Phylogenetic Analyses Based on Multiple Gene Sequences and Morphology. Bryologist 103, 187–211. doi:10.1639/0007-2745(2000)103[0187:EOTMML]2.0.CO;2
Niklas, K.J., Kutschera, U., 2010. The evolution of the land plant life cycle. New Phytol 185, 27–41. doi:10.1111/j.1469-8137.2009.03054.x
Niklas, K.J., Tiffney, B.H.B.H., Knoll, A.H., 1983. Patterns in vascular land plant diversification. Nature 303, 614–616. doi:10.1038/303614a0
Ochoterena, H., 2009. Homology in coding and non-coding DNA sequences: A parsimony perspective. Plant Syst. Evol. 282, 151–168. doi:10.1007/s00606-008-0095-y
Oda, K., Yamato, K., Ohta, E., Nakamura, Y., Takemura, M., Nozato, N., Akashi, K., Kanegae, T., Ogura, Y., Kohchi, T., Ohyama, K., 1992. Gene organization deduced from the complete sequence of liverwort Marchantia polymorpha mitochondrial DNA. A primitive form of plant mitochondrial genome. J. Mol. Biol. 223, 1–7. doi:10.1016/0022-2836(92)90708-R
Ohno, S., 1972. So much “junk” DNA in our genome. Brookhaven Symp. Biol. 23, 366–70.
Oldenburg, D.J., Bendich, A.J., 2004. Most Chloroplast DNA of Maize Seedlings in Linear Molecules with Defined Ends and Branched Forms. J. Mol. Biol. 335, 953–970. doi:10.1016/j.jmb.2003.11.020
Olmstead, R.G., Palmer, J.D., 1994. Chloroplast DNA Systematics: A review of Methods and Data Analysis. Am. J. Bot. 81, 1205–1224.
Olmstead, R.G., Reeves, P.A., Yen, A.C., 1998. Patterns of Sequence Evolution and Implications for Parsimony Analysis of Chloroplast DNA, in: Molecular Systematics of Plants II. Springer US, Boston, MA, pp. 164–187. doi:10.1007/978-1-4615-5419-6_6
Olsson, S., Buchbender, V., Enroth, J., Huttunen, S., Hedenäs, L., Quandt, D., 2009. Evolution of the Neckeraceae (Bryophyta): Resolving the backbone phylogeny. Syst. Biodivers. 7, 419–432. doi:10.1017/S1477200009990132
Orgel, L.E., Crick, F.H., 1980. Selfish DNA: the ultimate parasite. Nature 284, 604–607. doi:10.1038/284604a0
103

Östergren, G., 1945. Parasitic nature of extra fragment chromosomes. Bot. Not. 2, 157–163.
Palmer, J.D., 1990. Contrasting modes and tempos of genome evolution in land plant organelles. Trends Genet. 6, 115–120. doi:10.1016/0168-9525(90)90125-P
Palmer, J.D., Herbon, L.A., 1988. Plant Mitochondrial DNA Evolves Rapidly in Structure, but Slowly in Sequence. J Mol Evol 28, 87–97. doi:10.1007/BF02143500
Palmer, J.D., Qiu, Y.-L., Cho, Y., Cox, J.C., 1998. The gain of three mitochondrial introns identifies liverworts as the earliest land plants. Nature 394, 671–674. doi:10.1038/29286
Philippe, H., Brinkmann, H., Lavrov, D. V., Littlewood, D.T.J., Manuel, M., Wörheide, G., Baurain, D., 2011. Resolving difficult phylogenetic questions: Why more sequences are not enough. PLoS Biol. 9. doi:10.1371/journal.pbio.1000602
Philippe, H., Derelle, R., Lopez, P., Pick, K., Borchiellini, C., Boury-Esnault, N., Vacelet, J., Renard, E., Houliston, E., Quéinnec, E., Da Silva, C., Wincker, P., Le Guyader, H., Leys, S., Jackson, D.J., Schreiber, F., Erpenbeck, D., Morgenstern, B., Wörheide, G., Manuel, M., 2009. Phylogenomics Revives Traditional Views on Deep Animal Relationships. Curr. Biol. 19, 706–712. doi:10.1016/j.cub.2009.02.052
Plummer, M., Best, N., Cowles, K., Vines, K., 2006. CODA: convergence diagnosis and output analysis for MCMC. R News 6, 7–11. doi:10.1159/000323281
Porsch, O., 1905. Der Spalt{ö}ffnungsapparat im Lichte der Phylogenie: Ein Beitrag zur“ phylogenetischen Pflanzenhistologie.” G. Fischer.
Proctor, M.C.F., 1977. Evidence on the carbon nutrition of moss sporophytes from 14 CO 2 uptake and the subsequent movement of labelled assimilate. J. Bryol. 9, 375–386. doi:10.1179/jbr.1977.9.3.375
Pybus, O.G., Harvey, P.H., 2000. Testing macro-evolutionary models using incomplete molecular phylogenies. Proc. R. Soc. B Biol. Sci. 267, 2267–2272. doi:10.1098/rspb.2000.1278
Qiu, Y.-L., Li, L., Wang, B., Chen, Z., Knoop, V., Groth-Malonek, M., Dombrovska, O., Lee, J., Kent, L., Rest, J., Estabrook, G.F., Hendry, T.A., Taylor, D.W., Testa, C.M., Ambros, M., Crandall-Stotler, B., Duff, R.J., Stech, M., Frey, W., Quandt, D., Davis, C.C., 2006. The deepest divergences in land plants inferred from phylogenomic evidence. Proc. Natl. Acad. Sci. 103, 15511–15516. doi:10.1073/pnas.0603335103
104

Qiu, Y., Dombrovska, O., Lee, J., Li, L., Whitlock, B. a., Bernasconi‐Quadroni, F., Rest, J.S., Davis, C.C., Borsch, T., Hilu, K.W., Renner, S.S., Soltis, D.E., Soltis, P.S., Zanis, M.J., Cannone, J.J., Gutell, R.R., Powell, M., Savolainen, V., Chatrou, L.W., Chase, M.W., 2005. Phylogenetic Analyses of Basal Angiosperms Based on Nine Plastid, Mitochondrial, and Nuclear Genes. Int. J. Plant Sci. 166, 815–842. doi:10.1086/431800
Qiu, Y.L., Li, L.B., Wang, B., Xue, J.Y., Hendry, T. a, Li, R.Q., Brown, J.W., Liu, Y., Hudson, G.T., Chen, Z.D., 2010. Angiosperm phylogeny inferred from sequences of four mitochondrial genes. J. Syst. Evol. 48, 391–425. doi:DOI 10.1111/j.1759-6831.2010.00097.x
Quandt, D., Stech, M., 2005. Molecular evolution of the trnLUAA intron in bryophytes. Mol. Phylogenet. Evol. 36, 429–443. doi:10.1016/j.ympev.2005.03.014
Quandt, D., Stech, M., 2004. Molecular evolution of the trnTUGU-trnFGAA region in bryophytes. Plant Biol. 6, 545–554. doi:10.1055/s-2004-821144
Quandt, D., Stech, M., 2003. Molecular systematics of bryophytes in context of land plant phylogeny. Plant genome Biodivers. Evol. 1, 267–295.
Rabosky, D.L., 2014. Automatic Detection of Key Innovations, Rate Shifts, and Diversity-Dependence on Phylogenetic Trees. PLoS One 9, e89543. doi:10.1371/journal.pone.0089543
Rabosky, D.L., Mitchell, J.S., Chang, J., 2017. Is BAMM flawed? Theoretical and practical concerns in the analysis of multi-rate diversification models. Syst. Biol. 0, preprint. doi:10.1093/sysbio/syx037
Rambaut, A., Suchard, M.A., Xie, D., Drummond, A.J., 2014. Tracer v1.6.
Rannala, B., Yang, Z., 2008. Phylogenetic inference using whole genomes. Annu. Rev. Genomics Hum. Genet. 9, 217–231. doi:10.1146/annurev.genom.9.081307.164407
Raup, D.M., Sepkoski, J.J., 1982. Mass extinctions in the marine fossil record. Science (80-. ). 215, 1501–1503. doi:10.1126/science.215.4539.1501
Renault, S., Bonnemain, L., Gaudillere, P., Physiologie, L. De, Associee, U.D.R., 1992. Physiological Aspects of Sugar Exchange between the Gametophyte and the Sporophyte of Polytrichum formosum. PLANT Physiol. 100, 1815–1822.
Reuter, J.S., Mathews, D.H., 2010. RNAstructure: software for RNA secondary structure prediction and analysis. BMC Bioinformatics 11, 129. doi:10.1186/1471-2105-11-129
Rice, D.W., Alverson, A.J., Richardson, A.O., Young, G.J., Sanchez-Puerta, M. V, Munzinger, J., Barry, K., Boore, J.L., Zhang, Y., dePamphilis, C.W., Knox, E.B., Palmer, J.D., 2013. Horizontal transfer of entire genomes via mitochondrial fusion
105

in the angiosperm Amborella. Science (80-. ). 342, 1468–1473. doi:10.1126/science.1246275
Ronquist, F., Teslenko, M., van der Mark, P., Ayres, D.L., Darling, A., Höhna, S., Larget, B., Liu, L., Suchard, M.A., Huelsenbeck, J.P., 2012. MrBayes 3.2: efficient Bayesian phylogenetic inference and model choice across a large model space. Syst. Biol. 61, 539–42. doi:10.1093/sysbio/sys029
Rot, C., Goldfarb, I., Ilan, M., Huchon, D., 2006. Putative cross-kingdom horizontal gene transfer in sponge (Porifera) mitochondria. BMC Evol. Biol. 6, 71. doi:10.1186/1471-2148-6-71
Rubinstein, C. V., Gerrienne, P., de la Puente, G.S., Astini, R.A., Steemans, P., 2010. Early Middle Ordovician evidence for land plants in Argentina (eastern Gondwana). New Phytol. 188, 365–369. doi:10.1111/j.1469-8137.2010.03433.x
Saito, K., 1975. A monograph of Japanese Pottiaceae (Musci). J. Hattori Bot. Lab. 39, 373–537.
Samigullin, T.H., Valiejo-Roman, K.M., Troitsky, A. V, Bobrova, V.K., Filin, V.R., Martin, W., Antonov, A.S., 1998. Sequences of rDNA internal transcribed spacers from the chloroplast DNA of 26 bryophytes: properties and phylogenetic utility. FEBS Lett. 422, 47–51. doi:10.1016/S0014-5793(97)01600-1
Sanderson, M.J., 2003. r8s: inferring absolute rates of molecular evolution and divergence times in the absence of a molecular clock. Bioinformatics 19, 301–302. doi:10.1093/bioinformatics/19.2.301
Sato, N., Terasawa, K., Miyajima, K., Kabeya, Y., 2003. Organization, Developmental Dynamics, and Evolution of Plastid Nucleoids. pp. 217–262. doi:10.1016/S0074-7696(03)32006-6
Schierwater, B., Eitel, M., Jakob, W., Osigus, H.J., Hadrys, H., Dellaporta, S.L., Kolokotronis, S.O., DeSalle, R., 2009. Concatenated analysis sheds light on early metazoan evolution and fuels a modern “urmetazoon” hypothesis. PLoS Biol. 7. doi:10.1371/journal.pbio.1000020
Schimper, W.P., 1855. Corollarium Bryologiae Europaeae, Con- spectum Diagnosticum Familiarum, Generum et Specierum, Adnotationes Novas atque Emendationes. Schwaizerbart, Stuttgart.
Schnable, P., 1998. The molecular basis of cytoplasmic male sterility and fertility restoration. Trends Plant Sci. 3, 175–180. doi:10.1016/S1360-1385(98)01235-7
Schneider, H., Schuettpelz, E., Pryer, K.M., Cranfill, R., Magallón, S., Lupia, R., 2004. Ferns diversified in the shadow of angiosperms. Nature 428, 553–557. doi:10.1038/nature02361
106
Schuettpelz, E., Pryer, K.M., 2009. Evidence for a Cenozoic radiation of ferns in an angiosperm-dominated canopy. Proc. Natl. Acad. Sci. 106, 11200–11205. doi:10.1073/pnas.0811136106
Shaw, A.J., Anderson, L.E., Mishler, B.D., 1987. Peristome development in mosses in relation to systematics and evolution. I. Diphyscium foliosum (Buxbaumiaceae). Mem. N. Y. Bot. Gard. 45, 55–70.
Shaw, A.J., Cox, C.J., Goffinet, B., Buck, W.R., Boles, S.B., 2003. Phylogenetic evidence of a rapid radiation of pleurocarp mosses (Bryophyta). Evolution (N. Y). 57, 2226–2241. doi:10.1111/j.0014-3820.2003.tb00235.x
Shaw, A.J., Szovenyi, P., Shaw, B., 2011. Bryophyte diversity and evolution: Windows into the early evolution of land plants. Am. J. Bot. 98, 352–369. doi:10.3732/ajb.1000316
Shaw, A.J., Szövényi, P., Shaw, B., 2011. Bryophyte diversity and evolution: windows into the early evolution of land plants. Am. J. Bot. 98, 352–69. doi:10.3732/ajb.1000316
Shaw, J., Lickey, E.B., Beck, J.T., Farmer, S.B., Liu, W., Miller, J., Siripun, K.C., Winder, C.T., Schilling, E.E., Small, R.L., 2005. The tortoise and the hare II: relative utility of 21 noncoding chloroplast DNA sequences for phylogenetic analysis. Am. J. Bot. 92, 142–166. doi:10.3732/ajb.92.1.142
Shaw, J., Renzaglia, K., 2004. Phylogeny and diversification of bryophytes. Am. J. Bot. 91, 1557–1581. doi:10.3732/ajb.91.10.1557
Shelton, G.W.K., Stockey, R.A., Rothwell, G.W., Tomescu, A.M.F., 2016. Krassiloviella limbelloides gen. et sp. nov.: Additional Diversity in the Hypnanaean Moss Family Tricostaceae (Valanginian, Vancouver Island, British Columbia). Int. J. Plant Sci. 177, 792–808. doi:10.1086/688707
Shimodaira, H., 2002. An approximately unbiased test of phylogenetic tree selection. Syst. Biol. 51, 492–508. doi:10.1080/10635150290069913
Shimodaira, H., Hasegawa, M., 2001. CONSEL: for assessing the confidence of phylogenetic tree selection. Bioinformatics 17, 1246–1247. doi:10.1093/bioinformatics/17.12.1246
Siepel, A., Bejerano, G., Pedersen, J.S., Hinrichs, A.S., Hou, M., Rosenbloom, K., Clawson, H., Spieth, J., Hillier, L.D.W., Richards, S., Weinstock, G.M., Wilson, R.K., Gibbs, R.A., Kent, W.J., Miller, W., Haussler, D., 2005. Evolutionarily conserved elements in vertebrate, insect, worm, and yeast genomes. Genome Res. 15, 1034–1050. doi:10.1101/gr.3715005
107

Silvestro, D., Cascales-Miñana, B., Bacon, C.D., Antonelli, A., 2015. Revisiting the origin and diversification of vascular plants through a comprehensive Bayesian analysis of the fossil record. New Phytol. 207, 425–436. doi:10.1111/nph.13247
Simmons, M.P., Ochoterena, H., 2000. Gaps as characters in sequence-based phylogenetic analyses. Syst. Biol. 49, 369–381. doi:10.1080/10635159950173889
Smoot, E.L., Taylor, T.N., 1986. Structurally preserved fossil plants from Antarctica: II. A Permian moss from the Transantarctic Mountains. Am. J. Bot. 1683–1691.
Soltis, D.E., Gitzendanner, M.A., Strenge, D.D., Soltis, P.S., 1997. Chloroplast DNA intraspecific phylogeography of plants from the Pacific Northwest of North America. Plant Syst. Evol. 206, 353–373. doi:10.1007/BF00987957
Stamatakis, A., 2014. RAxML version 8: A tool for phylogenetic analysis and post-analysis of large phylogenies. Bioinformatics 30, 1312–1313. doi:10.1093/bioinformatics/btu033
Stech, M., McDaniel, S.F., Hernández-Maqueda, R., Ros, R.M., Werner, O., Muñoz, J., Quandt, D., 2012. Phylogeny of haplolepideous mosses — challenges and perspectives. J. Bryol. 34, 173–186. doi:10.1179/1743282012Y.0000000014
Stech, M., Quandt, D., 2010. 20,000 Species and Five Key Markers: the Status of Molecular Bryophyte Phylogenetics. Phytotaxa 9, 196–228. doi:10.11646/phytotaxa.9.1.11
Stech, M., Wagner, D., 2005. Molecular relationships, biogeography, and evolution of Gondwanan Campylopus species (Dicranaceae, Bryopsida). Taxon 54.
Sugita, M., Shinozaki, K., Sugiura, M., 1985. Tobacco chloroplast tRNA(UUU) gene contains a 2.5-kilobase-pair intron: An open reading frame and a conserved boundary sequence in the intron. Proc. Natl. Acad. Sci. U. S. A. 82, 3557–3561. doi:10.1073/pnas.82.11.3557
Sugiura, M., 1992. The chloroplast genome. Plant Mol. Biol. 19, 149–168. doi:10.1007/s00438-005-0092-6
Sverdlov, V.E., Dukhanina, O.I., Hoebee, B., Rapp, J.P., 1998. Linkage mapping of fifty-eight new rat microsatellite markers. Mamm. Genome 9, 816–821. doi:10.1007/s003359900873
Swofford, D.L., 2003. PAUP*. Phylogenetic Analysis Using Parsimony (*and Other Methods). Version 4. Sinauer Associates, Sunderland, Massachusetts.
Swofford, D.L., 2002. Phylogenetic Analysis Using Parsimony (*and Other Methods). Sinauer Associates, Sunderland, Massachusetts.
108

Swofford, D.L., Olsen, G.J., Waddell, P.J., Hillis, D.M., 1996. P1hylogenetic inference, in: Hillis, D.M., Moritz, C., Mable, B.K. (Eds.), Molecular Systematics (2nd Ed.). Sinauer Associates, Inc., Sunderland, Massachusetts, pp. 407–514.
Taberlet, P., Gielly, L., Pautou, G., Bouvet, J., 1991. Universal primers for amplification of three non-coding regions of chloroplast DNA. Plant Mol. Biol. 17, 1105–1109. doi:10.1007/BF00037152
Tachida, H., Iizuka, M., 1992. Persistence of repeated sequences that evolve by replication slippage. Genetics 131, 471–478.
Tautz, D., 1989. Hypervariabflity of simple sequences as a general source for polymorphic DNA markers. Nucleic Acids Res. 17, 6463–6471. doi:10.1093/nar/17.16.6463
Tautz, D., Schlötterer, C., 1994. Simple sequences. Curr. Opin. Genet. Dev. 4, 832–837. doi:10.1016/0959-437X(94)90067-1
Taylor, E.C., 1962. The Philibert peristome articles. An abridged translation. Bryologist 65, 175–212.
Taylor, Z.N., Rice, D.W., Palmer, J.D., 2015. The complete moss mitochondrial genome in the angiosperm Amborella is a chimera derived from two moss whole-genome transfers. PLoS One 10, 1–21. doi:10.1371/journal.pone.0137532
Tsudzuki, J., Nakashima, K., Tsudzuki, T., Hiratsuka, J., Shibata, M., Wakasugi, T., Sugiura, M., 1992. Chloroplast DNA of black pine retains a residual inverted repeat lacking rRNA genes: nucleotide sequences of trnQ, trnK, psbA, trnI and trnH and the absence of rps16. Mol. Gen. Genet. 232, 206–214.
Uzawa, M., Higuchi, M., 2010. Comparative development of the sporophyte-gametophyte junction in six moss species. J. Plant Res. 123, 777–787. doi:10.1007/s10265-010-0339-0
Vallès, Y., Halanych, K.M., Boore, J.L., 2008. Group II introns break new boundaries: Presence in a bilaterian’s genome. PLoS One 3, 1–6. doi:10.1371/journal.pone.0001488
Vitt, D.H., 1984. Classification of the Bryopsida. New Man. Bryol. 2, 696–759.
Vitt, D.H., 1981. Adaptive Modes of the Moss Sporophyte. Bryologist 84, 166. doi:10.2307/3242820
Volkmar, U., Knoop, V., 2010. Introducing intron locus cox1i624 for phylogenetic analyses in Bryophytes: on the issue of Takakia as sister genus to all other extant mosses. J. Mol. Evol. 70, 506–18. doi:10.1007/s00239-010-9348-9
109

Wahrmund, U., Quandt, D., Knoop, V., 2010. The phylogeny of mosses - Addressing open issues with a new mitochondrial locus: Group I intron cobi420. Mol. Phylogenet. Evol. 54, 417–426. doi:10.1016/j.ympev.2009.09.031
Wahrmund, U., Rein, T., Müller, K.F., Groth-Malonek, M., Knoop, V., 2009. Fifty mosses on five trees: comparing phylogenetic information in three types of non-coding mitochondrial DNA and two chloroplast loci. Plant Syst. Evol. 282, 241–255. doi:10.1007/s00606-008-0043-x
Wang, W., Wu, Y., Messing, J., 2012. The Mitochondrial Genome of an Aquatic Plant, Spirodela polyrhiza. PLoS One 7, 1–9. doi:10.1371/journal.pone.0046747
Wang, Y., Ding, J., Daniell, H., Hu, H., Li, X., 2012. Motif analysis unveils the possible co-regulation of chloroplast genes and nuclear genes encoding chloroplast proteins. Plant Mol. Biol. 80, 177–187. doi:10.1007/s11103-012-9938-6
Ward, B.L., Anderson, R.S., Bendich, A.J., 1981. The mitochondrial genome is large and variable in a family of plants (Cucurbitaceae). Cell 25, 793–803. doi:10.1016/0092-8674(81)90187-2
Wicke, S., Muller, K.F., de Pamphilis, C.W., Quandt, D., Wickett, N.J., Zhang, Y., Renner, S.S., Schneeweiss, G.M., 2013. Mechanisms of Functional and Physical Genome Reduction in Photosynthetic and Nonphotosynthetic Parasitic Plants of the Broomrape Family. Plant Cell 25, 3711–3725. doi:10.1105/tpc.113.113373
Wicke, S., Quandt, D., 2009. Universal primers for the amplification of the plastid trnK/matK region in land plants. An. del Jardín Botánico Madrid 66, 285–288. doi:10.3989/ajbm.2231
Wicke, S., Schneeweiss, G.M., dePamphilis, C.W., Müller, K.F., Quandt, D., 2011. The evolution of the plastid chromosome in land plants: Gene content, gene order, gene function. Plant Mol. Biol. 76, 273–297. doi:10.1007/s11103-011-9762-4
Wickett, N.J., Mirarab, S., Nguyen, N., Warnow, T., Carpenter, E., Matasci, N., Ayyampalayam, S., Barker, M.S., Burleigh, J.G., Gitzendanner, M.A., Ruhfel, B.R., Wafula, E., Der, J.P., Graham, S.W., Mathews, S., Melkonian, M., Soltis, D.E., Soltis, P.S., Miles, N.W., Rothfels, C.J., Pokorny, L., Shaw, A.J., DeGironimo, L., Stevenson, D.W., Surek, B., Villarreal, J.C., Roure, B., Philippe, H., dePamphilis, C.W., Chen, T., Deyholos, M.K., Baucom, R.S., Kutchan, T.M., Augustin, M.M., Wang, J., Zhang, Y., Tian, Z., Yan, Z., Wu, X., Sun, X., Wong, G.K.-S., Leebens-Mack, J., 2014. Phylotranscriptomic analysis of the origin and early diversification of land plants. Proc. Natl. Acad. Sci. U. S. A. 111, E4859-68. doi:10.1073/pnas.1323926111
Wickett, N.J., Zhang, Y., Hansen, S.K., Roper, J.M., Kuehl, J. V., Plock, S.A., Wolf, P.G., Depamphilis, C.W., Boore, J.L., Goffinet, B., 2008. Functional gene losses
110

occur with minimal size reduction in the plastid genome of the parasitic liverwort Aneura mirabilis. Mol. Biol. Evol. 25, 393–401. doi:10.1093/molbev/msm267
Wolfe, K.H., Morden, C.W., Palmer, J.D., 1992. Function and evolution of a minimal plastid genome from a nonphotosynthetic parasitic plant. Proc. Natl. Acad. Sci. U. S. A. 89, 10648–52. doi:10.1073/pnas.89.22.10648
Won, H., Renner, S.S., 2003. Horizontal gene transfer from flowering plants to Gnetum. Proc. Natl. Acad. Sci. U. S. A. 100, 10824–9. doi:10.1073/pnas.1833775100
Worberg, A., Quandt, D., Barniske, A.-M., Löhne, C., Hilu, K.W., Borsch, T., 2007. Phylogeny of basal eudicots: Insights from non-coding and rapidly evolving DNA. Org. Divers. Evol. 7, 55–77. doi:10.1016/j.ode.2006.08.001
Xue, J.Y., Liu, Y., Li, L., Wang, B., Qiu, Y.L., 2010. The complete mitochondrial genome sequence of the hornwort Phaeoceros laevis: Retention of many ancient pseudogenes and conservative evolution of mitochondrial genomes in hornworts. Curr. Genet. 56, 53–61. doi:10.1007/s00294-009-0279-1
Yoder, A.D., Irwin, J.A., Payseur, B.A., 2001. Failure of the ILD to determine data combinability for slow loris phylogeny. Syst. Biol. 50, 408–424. doi:10.1080/10635150116801
Zanis, M.J., Soltis, D.E., Soltis, P.S., Mathews, S., Donoghue, M.J., 2002. The root of the angiosperms revisited. Proc. Natl. Acad. Sci. 99, 6848–6853. doi:10.1073/pnas.092136399
Zhong, Sun, L., Penny, D., 2015. The Origin of Land Plants: A Phylogenomic Perspective. Evol. Bioinforma. 137. doi:10.4137/EBO.S29089
Zuckerkandl, E., 1976. Evolutionary processes and evolutionary noise at the molecular level. J. Mol. Evol. 7, 269–311. doi:10.1007/BF01743626
Zwickl, D.J., Hillis, D.M., 2002. Increased Taxon Sampling Greatly Reduces Phylogenetic Error. Syst. Biol. 51, 588–598. doi:10.1080/10635150290102339
111

Index to Figures
Figure 1: Synteny of land plant plastid chromosomes. The plastid chromosomes are shown in linearized form illustrating relative gene synteny. Genes are depicted by boxes colored according to their relevant functional class (see legend). Genes encoded by the leading strand (strand) or by the lagging strand (- strand) are shown above or below the grey chromosome bar, respectively. Lines from selected genes/ gene-regions mentioned above the first chromosome bar roughly indicate genes clusters that have been reorganizated during land plant evolution.(from Wicke et al., 2011)................................6
Figure 2: Graphical representation of the plastid genome of the moss Sanionia uncinata (Park et al. 2015, Accession KM111545, plotted with OGDRAW v1.1 (Lohse et al. 2013)) Reading direction indicated by arrows, genes belonging to functional complexes are color coded and listed in the legend......................................................................................................7
Figure 3: Gene order comparison among mitochondrial genomes of bryophytes compared to Chara vulgaris. Gene content and order is strongly conserved within mosses and liverworts, but not in other lineages. (from Liu et al., 2011)...............................................................9
Figure 4: Graphical representation of the Mitochondrial genome of the moss Sanionia uncinata (Park et al. 2015, Accession KP984757, plotted with OGDRAW v1.1 (Lohse et al. 2013). Reading direction indicated by arrows, genes belonging to functional complexes are color coded and itemized in the legend.....................................................................10
Figure 5: Phylogeny of land plants following Qiu et al. (2006)........................................................12
Figure 6: SEM picture and peristome diagram of Hypnum imponens, a diplolepideous-alternating moss.................................................................................................................................13
Figure 7: Frequency of inserted simple sequence repeat elements of the chloroplast genome across lineages and genomic regions. Black: trnL group I intron of the asterids (K. Solomon et al., unpublished data). Dark gray: petD group II intron of the asterids (K. Solomon et al., unpublished data). Light gray: introns and spacers of the chloroplast IR of early branching angiosperms (Graham et al. 2000). White: spacers and group I intron of the trnT–trnF region in Nymphaea (Borsch et al. 2007) (from Borsch and Quandt, 2009). .17
Figure 8: Phylogeny of all extant moss lineages with BI (left values) and ML (right values) support. Values above the branch are inferred by the datasets with indel coding (Simmons and Ochoterena, 2009), those below the branch are inferred without indel coding...............31
Figure 9: Tanglegram of topologies inferred by all plastid markers (left) and all mitochondrial markers (right) in this study. As far as possible, branches were arranged to maximize compatibility, if not possible, branches are depicted as dashed lines..............................33
Figure 10: Topology tests, results from these tests are presented in table 1 and below each tree. Altered branches are indicated in red. Result..................................................................35
Figure 11: Pruned Chrongram of the bryophytina clade colored by the rate of speciation, estimated in BAMM. Legend of the speciation rates corresponding to the branch colors in the lower right. Error bars showing the 95% HPD interval drawn in red. Placement of rate shift configuration with the highest probability of 0.13: 4 core rate shifts, depicted by

red circles. Bars on the right hand side show species richness in each clade, refer to table 15 for details. Takakio. = Takaiopsida, Sphagn. = Sphagnopsida, Andrea. = Andreaeopsida, Oedipod. = Oedipodiopsida, Polytrich. = Polytrichales, Tetraphid. = Tetraphidales, Buxbau. = Buxbaumiidae, Diphysc. = Diphysciidae, Gigasperm. = Gigaspermales, Catoscop. = Catoscopiales, Timiell. = Timiellales, Scouler. = Scouleriales, MADP = Mitteniales+Archidiales+Dicranales+Pottiales (nested in Dicranales), Splachn. = Splachnales, Hedwig. = Hedwigiales, HeBa. = Helicophyllales+Bartramiales, Bry. = Bryales, Ortho. = Orthotrichales, Orthod. = Orthodontiales, Aula. = Aulacomniales, Ptych. = Ptychomniales, Hooker. = Hookeria. 39
Figure 12: Evolution of mosses and their peristome. The paraphyly of nematodontous mosses (red) suggests that their peristome is the ancestor of the arthrodontous peristome. Legend: HALPO = haplolepid, PH = proto haplolepideous, DA = diplolepid alternate, DS = diplolepid, DO = diplolepideous opposing, GYM = gymnostomate, red= nematodontous, orange = arthrodontous.........................................................................41
Figure 13: Flow diagram of the analysis steps involved in the calculation of phylogenetic structure and its variants.................................................................................................................52
Figure 14: Differences in RC,fix in bipartite (upper row) and tripartite analyses (middle row). The lower graphs show the ranking of RC relative to the best performing marker. The left column depicts results from the comparisons plastid and mitochondrial coding and noncoding markers. The right column shows results from the comparisons of non coding marker from both organelles. Error bars indicate the 95% confidence interval of the mean RC and RC,fix values across the re-sampled replicates...................................58
Figure 15: Frequency of gain and loss of SSRs in plastids and mitochondria. The hatched area behind the bar plots visualizes the expected distribution when considering a random process in the origination of a SSRs, the sliding mean regression (dashed line) of gained SSRs (cp+mt) shows a deferred negative trend...............................................................71
Figure 16 (next page): Mean Phylogenetic signal D and K of SSRs in relation to length. Dashed lines show the linear regression, circles in the upper graph are proportional to the fraction of p(PIC)<0.05, thus showing the fraction of positions resembling a random distribution. Vertcal bars in the upper and middle show the 95% confidence interval. The lower graph shows a stacked barplot of the fractions of positions exhibiting worse (black) or better (white) phylogenetic signal than random or better than simulated Brownian characters (grey).............................................................................................71
Figure 17: Two dimensional representation of the dyad motifs in hairpin associated inversion sites. Symbols above hairpins correspond to the symbols in table 2 and.................................74
Figure 18: Distribution of inversion states plotted on a chronogram from chapter 2, symbols correspond to table 10 and Figure 18..............................................................................76
Figure 19: The nine best sets of rate shifts, ranked by their marginal likelihood. (f).......................131
Figure 20: Clade specific speciation rates and background rates. The speciation rate for each individual Clade is plotted in blue with red confidence intevals, the background rate -that is the speciation rate over time excluding the clade of interest - red with black 95% CI...................................................................................................................................132

Figure 21: Ratogram inferred by the concatenated plastid dataset. Branch length correspond to substitution rates inferred by RAxML 8.2, values above branches depict support values with indel coding, below without indel coding. Left values are posteriour probabilities from BI, right values are bootstraps from ML...............................................................133
Figure 22: Ratogram inferred by the concatenated mitochondrial dataset. Branch length correspond to substitution rates inferred by RAxML 8.2, values above branches depict support values with indel coding, below without indel coding. Left values are posteriour probabilities from BI, right values are bootstraps from ML. The branch lengths in this tree have the same scale as in Figure 15........................................................................134
Figure 23: Chronogram of the land plant dataset, inferred with BEAST 1.8. Colors and periods correspondent to the international stratigraphic chart...................................................135
Figure 23: Divergence dating using relaxed clock dating, implemented in r8s (Sanderson, 2003)135
Figure 24: LP phylogeny containing all major streptophyte lineages. Branch lengths correspond to substitution rates inferred via ML in RAxML 8.2. Support values above branches are bootstrap values from ML, below branches are posterior probabilities from BI..........137
Figure 25: Lineage through time plot (ltt) and chronogram of the constraint tree used to include divergence times. The green bar indicates the time span of the divergence of all peristomate moss lineages during the Carboniferous....................................................138

Index of tables
Table 1: Posterior probability of each rate shift count observed during the runs...............................36
Table 2: List of the nine shift configurations with the highest posterior probability. In Figure 19 (appendix) the corresponding 3x3 plot of these shift configurations on their respective phylorate plots are presented...........................................................................................37
Table 3: The mean speciation rate for all clades with an estimated core shift event and their background speciation rate. A corresponding graphical presentation is in figure 20 (appendix)........................................................................................................................37
Table 4: Differences in phylogenetic structure between all plastid and all mitochondrial markers...54
Table 5: Difference in phylogenetic structure between matK and coding, noncoding plastid or mitochondrial partitions...................................................................................................55
Table 6: Gradient G = RC,fix(S2) – RC,fix(S1) in coding and noncoding markers from plastid and mitochondria and matK...................................................................................................56
Table 7: Difference in phylogenetic structure between noncoding plastid and mitochondrial partitions: group I introns, group II introns and spacer...................................................57
Table 8: Phylogenetic structure and signal in simple indel coding (sic), simple sequence repeats (SSRs), and sic excluding SSRs. Measure RC (upper right) and RC,fix (mid left) depict the amount of phylogenetic structure per sequenced nucleotide, the latter against the background of a given topology. Additional statistics (RI/RC/HI) depict the level of homoplasy in the data, phylogenetic signal D and Blomberg's K quantify phylogenetic signal across indel partitions. Calculation of RI,RC, HI, D and K are based on the ML topology from chapter 1..................................................................................................73
Table 9: Blomberg's K statistic and phylogenetic Signal D in non-autapomorphic inversion sites. Values of D < 0 indicate evidence for a conserved phylogenetic signal, D ≈ 0, when the trait distribution resembles a Brownian process and D ≈ 1 or D > 1, when random.......75
Table 10: List of 69 Taxa in the backbone mosses (BM) dataset. Accessions for each marker are given if available. If substituted by a closely related taxon,the name is stated below the accession number...........................................................................................................118
Table 11: NCBI Accessions from LP data set. Taxa substituted by a close relative of the same family is indicated by the epitheton (in brackets).....................................................................121
Table 12: Plastid primers used in this study.....................................................................................124
Table 13: Fossil calibration points for divergence dating.................................................................125
Table 14: Species richness in extant mosses. Samplingfraction is the number of taxa that represent a clade divided by the total number of know taxa belonging to the clade.......................129
Table 15: Testing the sensitivity of the rate shift prior “expectedNumberOfRates”. While an influence cannot be denied, the first three core shifts are always recovered.................136

Table 16: Per motif length homoplasy measures and statistics for phylogenetic signal K and D, number of coded SSR sites and number of reconstructed events..................................139

Appendix

Table 10: List of 69 Taxa in the backbone mosses (BM) dataset. Accessions for each marker are given if available. If substituted by a closely related taxon,the name is stated below the accession number.Taxonomy
Subdivision
Class
Subclass
Superorder
Order
Family
Species Lab code cobi420nad2 with nad2i156
nad5 with nad5i753
nad5-nad4 IGS rbcL rps4 trnK/matK atpB-rbcL IGS trnL G1 rpl16 G2
Sphagnopsida Sphagnum fallax EC42FJ870693S. capillifolium
AJ299524 AJ001225 DQ098673 AB013673AY309730S. squarrosum
LN828293 AY864303 AY327835AF194900
S. fallax
Takakiopsida Takakia lepidozioidesEC70
B881FJ870694 AJ299525 AJ291553 EU095268 AF244565 AF306950 LN828294 AY864296 AB304383 LN828228
Andreaeopsida Andreaea nivalis B882 FJ870695 AJ299526 AJ299526 DQ098672AF478198A. nitida
AJ617675A. rupestris
LN828295AY864297
A. rupestris
AY050278
A.rupestrisLN828229
Oedipodiopsida Oedipodium griffithianumUConn3528 (B1388)
LN828227 LN828285 AY312880 LN828284 HQ413006 AF306968 LN828296 LN828210 AF478314 LN828230
Polytrichopsida Alophosia azorica UConn UConn UConn UConn UConn UConn UConn UConn UConn UConn UConn
Atrichopsis compressus UConn UConn UConn UConn UConn UConn UConn UConn UConn UConn UConn
Atrichum undulatum
B379
B356
B319
FJ870696 AJ299527 AJ001229 EU095269 AY118236 AY137681 LN828297 EU124445 AF545002 LN828231
Dawsonia spec. B883 FJ870697 EU095309AY908804D. superba
EU095270AF208410D. papuana
AF208419D. papuana
LN828298EU124424
D. superba
AF246704
D. papuanaLN828232
Oligotrichum hercynicumB872
B973FJ870698 EU095310
AY908805O. parallelum
EU095271
AY118242O. austroaligerum
AY137688 LN828299AY864302
O. canaliculatumAF545014 LN828233
Pogonatum urnigerum B884 FJ870699 AJ299528 AJ291554 EU095272AF478206P. perichaetiale
AF478258P. perichaetale
LN828300EU124442
P. subulatumGU569719 LN828234
Tetraphidopsida Tetraphis pellucidaB873
B967FJ870700 AJ299529 AJ224855 EU095273 AF478203 AF306954 LN828301 LN828211 AF231908. LN828235
Tetrodontium brownianum GBoL1541 UConn UConn AY908809 UConn JN162295 AY908022 LN828302 LN828212 LN828225 LN828236
Bryopsida
BuxbaumiidaeBuxbaumia aphylla
B928
B972FJ870701 AJ299531 AJ291555 EU095274 AF478212 AF231897 LN828303 AY86429 AF478299 LN828237
Diphysciidae Diphyscium sessile B885 FJ870702 AJ299530 Z98972 EU095275AF478219D. fasciculatum
AF478270D. fasciculatum
LN828304DQ397161
D. foliosum
AF478308
D. fasciculatumLN828238
Timmiidae
Timmiales Timmia austriaca B886 FJ870703 FJ870755 FJ870748 FJ870748 AJ275185 AF223035 LN828305 DQ397132 DQ397165 LN828239
Timmia megapolitana B866 FJ870704 AJ299532 AJ622820 EU095276 DQ778619 AF222902 LN828306 DQ397147 AF435351 LN828240
Timmia norvegica B887 FJ870705 FJ870756 FJ870749 FJ870749AJ275166 T. sibirica
AF023775 T. sibirica
LN828307 JF342799 DQ397184 LN828241
Gigaspermidae
Gigaspermales Chamaebryum pottioidesB1390
UConn 3630FJ870706 FJ870757 AY908983 FJ870750 FJ870761 AF223051 LN828308 JN089201 AF229908 LN828242
Gigaspermum repensB1389
UConn3583FJ870707 FJ870758 AY908974 FJ870751 FJ870762 AF231064 LN828309 JN089220 AF229906 LN828243
Oedipodiella australisUConn 2681
B1417FJ870708 FJ870759 FJ870754 FJ870752 FJ870763 FJ870765 LN828310 JN089225 JN088955 LN828244
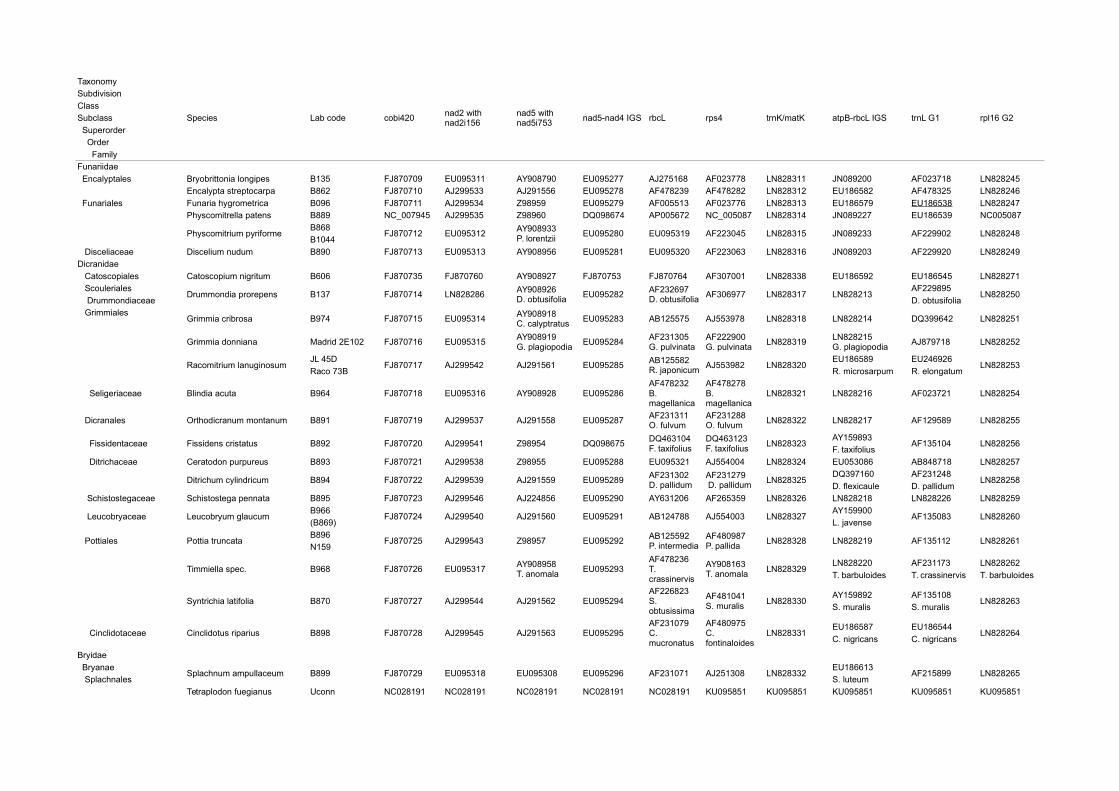
Taxonomy
Subdivision
Class
Subclass
Superorder
Order
Family
Species Lab code cobi420nad2 with nad2i156
nad5 with nad5i753
nad5-nad4 IGS rbcL rps4 trnK/matK atpB-rbcL IGS trnL G1 rpl16 G2
Funariidae
Encalyptales Bryobrittonia longipes B135 FJ870709 EU095311 AY908790 EU095277 AJ275168 AF023778 LN828311 JN089200 AF023718 LN828245
Encalypta streptocarpa B862 FJ870710 AJ299533 AJ291556 EU095278 AF478239 AF478282 LN828312 EU186582 AF478325 LN828246
Funariales Funaria hygrometrica B096 FJ870711 AJ299534 Z98959 EU095279 AF005513 AF023776 LN828313 EU186579 EU186538 LN828247
Physcomitrella patens B889 NC_007945 AJ299535 Z98960 DQ098674 AP005672 NC_005087 LN828314 JN089227 EU186539 NC005087
Physcomitrium pyriformeB868
B1044FJ870712 EU095312
AY908933P. lorentzii
EU095280 EU095319 AF223045 LN828315 JN089233 AF229902 LN828248
Disceliaceae Discelium nudum B890 FJ870713 EU095313 AY908956 EU095281 EU095320 AF223063 LN828316 JN089203 AF229920 LN828249
Dicranidae
Catoscopiales Catoscopium nigritum B606 FJ870735 FJ870760 AY908927 FJ870753 FJ870764 AF307001 LN828338 EU186592 EU186545 LN828271
Scouleriales
DrummondiaceaeDrummondia prorepens B137 FJ870714 LN828286
AY908926D. obtusifolia
EU095282AF232697D. obtusifolia
AF306977 LN828317 LN828213AF229895
D. obtusifoliaLN828250
GrimmialesGrimmia cribrosa B974 FJ870715 EU095314
AY908918C. calyptratus
EU095283 AB125575 AJ553978 LN828318 LN828214 DQ399642 LN828251
Grimmia donniana Madrid 2E102 FJ870716 EU095315AY908919G. plagiopodia
EU095284AF231305G. pulvinata
AF222900G. pulvinata
LN828319LN828215 G. plagiopodia
AJ879718 LN828252
Racomitrium lanuginosumJL 45D
Raco 73BFJ870717 AJ299542 AJ291561 EU095285
AB125582R. japonicum
AJ553982 LN828320EU186589
R. microsarpum
EU246926
R. elongatumLN828253
Seligeriaceae Blindia acuta B964 FJ870718 EU095316 AY908928 EU095286AF478232B. magellanica
AF478278B. magellanica
LN828321 LN828216 AF023721 LN828254
Dicranales Orthodicranum montanum B891 FJ870719 AJ299537 AJ291558 EU095287AF231311O. fulvum
AF231288O. fulvum
LN828322 LN828217 AF129589 LN828255
Fissidentaceae Fissidens cristatus B892 FJ870720 AJ299541 Z98954 DQ098675DQ463104F. taxifolius
DQ463123F. taxifolius
LN828323AY159893
F. taxifoliusAF135104 LN828256
Ditrichaceae Ceratodon purpureus B893 FJ870721 AJ299538 Z98955 EU095288 EU095321 AJ554004 LN828324 EU053086 AB848718 LN828257
Ditrichum cylindricum B894 FJ870722 AJ299539 AJ291559 EU095289AF231302 D. pallidum
AF231279 D. pallidum
LN828325DQ397160
D. flexicaule
AF231248
D. pallidumLN828258
Schistostegaceae Schistostega pennata B895 FJ870723 AJ299546 AJ224856 EU095290 AY631206 AF265359 LN828326 LN828218 LN828226 LN828259
Leucobryaceae Leucobryum glaucumB966
(B869)FJ870724 AJ299540 AJ291560 EU095291 AB124788 AJ554003 LN828327
AY159900
L. javenseAF135083 LN828260
Pottiales Pottia truncataB896
N159FJ870725 AJ299543 Z98957 EU095292
AB125592P. intermedia
AF480987P. pallida
LN828328 LN828219 AF135112 LN828261
Timmiella spec. B968 FJ870726 EU095317AY908958T. anomala
EU095293AF478236T. crassinervis
AY908163T. anomala
LN828329LN828220
T. barbuloides
AF231173
T. crassinervis
LN828262
T. barbuloides
Syntrichia latifolia B870 FJ870727 AJ299544 AJ291562 EU095294AF226823S. obtusissima
AF481041S. muralis
LN828330AY159892
S. muralis
AF135108
S. muralisLN828263
Cinclidotaceae Cinclidotus riparius B898 FJ870728 AJ299545 AJ291563 EU095295AF231079C. mucronatus
AF480975C. fontinaloides
LN828331EU186587
C. nigricans
EU186544
C. nigricansLN828264
Bryidae
Bryanae
SplachnalesSplachnum ampullaceum B899 FJ870729 EU095318 EU095308 EU095296 AF231071 AJ251308 LN828332
EU186613
S. luteumAF215899 LN828265
Tetraplodon fuegianus Uconn NC028191 NC028191 NC028191 NC028191 NC028191 KU095851 KU095851 KU095851 KU095851 KU095851

Taxonomy
Subdivision
Class
Subclass
Superorder
Order
Family
Species Lab code cobi420nad2 with nad2i156
nad5 with nad5i753
nad5-nad4 IGS rbcL rps4 trnK/matK atpB-rbcL IGS trnL G1 rpl16 G2
Orthotrichales Ulota crispaB863
B965FJ870730 AJ299553 AJ291568 EU095297 AY631208
AY618370U. hutchinsiae
LN828333 EU186617 EU186557 LN828266
Orthotrichum rogeri KM873610 KM873610 KM873610 KM873610 NC026212 NC026212 NC026212 NC026212 NC026212 NC026212
Nyholmiella obtusifolia KX702279 KX702279 KX702279 KX702279 KP765733 KP765733 KP765733 KP765733 KP765733 KP765733
Hedwigiales Hedwigia ciliata B461 FJ870731 AJ299554 Z98966 EU095298 AF005517 AF478289 LN828334 LN828221 AF478336 LN828267
Rhacocarpaceae Rhacocarpus purpurascens B871 FJ870732 AJ299555 Z98967 EU095299 AJ275171 AF023815 LN828335 EU186598 HF536608 LN828268
Bartramiales Bartramia halleriana Bh 114 FJ870733 AJ299547 Z98961 EU095300 AF231090 AF265358LN828336
B. hampeana
EU186599
B. strictaAY532395 LN828269
Plagiopus oederi B47/B320 FJ870734 AJ299548 Z98962 EU095301 DQ481540 AF023833 LN828337 AF413559 AF023757 LN828270
BryalesBryum argenteum (from WGS GPZP01 & Genbank)
KC663059 - KC663059 KC662861 KC662788 GPZP01 KC493910 GPZP01 GPZP01 GPZP01 AF546777
Mnium hornum B900 FJ870736 AJ299552 AJ291567 EU095302 AF226820 AF023796 LN828339 AF546857 AF231177 LN828272
Pohlia nutans B901 FJ870737 AJ299550 AJ291565 EU095303AJ275175P. cruda
AF023795P.cruda
LN828340AF546859
P. crudaDQ108957 LN828273
Rhizogoniales
AulacomniaceaeAulacomnium androgynum B865 FJ870738 AJ299549 AJ291564 EU095304
AJ275180A. turgidum
AF023809A. turgidum
LN828341 AF413529 AF023729 LN828274
Orthodontiaceae Orthodontium lineare B902 FJ870739 AJ299551 AJ291566 EU095305 AJ275174 AF023800 LN828342 EU186619 EU186558 LN828275
Ptychomniales Ptychomnion cygnisetum N131 KC784949 KC784949 KC784949 KC784949 DQ196095 AY306984N131P. aciculare
EU186632P. ptychocarpon
AJ862681 JN162156
Hypnanae; Hookeriales Lopidium concinnumUCONNL. struthiopteris
UCONNL. struthiopteris
AY631221UCONNL. struthiopteris
AY631190 AY631153B512L. penniforme
AY864295 AY306780N92
L. concinnum
Hypnales Plagiotheciaceae
Herzogiella seligeri B903 FJ870740 AJ299561 AJ291573 DQ098681 EU095322AF469815H. striatella
LN828343 LN828222 AF472453 LN828276
Plagiothecium laetum UCONN UCONN UCONN UCONN KF882034 KF882359 KF882134 KF882284 KF882184 KF882334
Hypnanceae Hypnum jutlandicum GBoL481 GBoL481 GBoL481 GBoL481 GBoL481 GBoL481 GBoL481 GBoL481 GBoL481 GBoL481 GBoL481
Fontinalaceae Fontinalis antipyretica B904 FJ870741 AJ299558 AJ291570 EU095306 AB050949 AF023817 LN828344 EU186638 AF023771 LN828277
Amblystegiaceae Hygrohypnum ochraceum B905 FJ870742 AJ299562 AJ291574 DQ098679 EU095323AY908620H. smithii
LN828345 AY857584 AY012571 LN828278
Sanionia uncinata - KP984757 KP984757 KP984757 KP984757 KM111545 KM111545 KM111545 KM111545 KM111545 KM111545
Scorpidium scorpioides B906 FJ870743 AJ299563 AJ291575 DQ098680 EU095324 AY908584 LN828346 AY625977 AY626014 LN828279
Brachytheciaceae Tomentypnum nitens B907 FJ870744 AJ299560 AJ291572 DQ098677 AB024676AY908567T. falcifolium
LN828347 LN828223 AY009854 LN828280
Brachythecium rivulare KR732319 KR732319 KR732319 KR732319 AB024674 AM990348 SH131 EF530950 AM990348 FM160950
Leucodontaceae Pterogonium gracile B864 FJ870745 AJ299556 Z98968 EU095307 AY631194 AY907970 LN828348 HQ268443 HE717062 LN828281
Neckeraceae Thamnobryum alopecurum B475 FJ870747 AJ299559 AJ291571 DQ098678 AY532392 AF023834 LN828350EU186642
T. pandumAY010287 LN828283

Table 11: NCBI Accessions from LP data set. Taxa substituted by a close relative of the same family is indicated by the epitheton (in brackets).
atpB rbcL psaA psbB matK rps4 trnL G1 core rrn23 (Cp-LSU) rrn16 Cp-SSU
Streptophyta
Mesostigma viride NC002186 NC002186 NC002186 NC002186 - NC002186 NC002186 NC002186 NC002186
Chlorokybus atmophyticus DQ422812 DQ422812 DQ422812 DQ422812 - DQ422812 DQ422812 DQ422812 DQ422812
Klebsormidium flaccidum KJ461680 KJ461680 KJ461680 KJ461680 KJ461680 KJ461680 -
Interfilum terricola KM462881 KM462881 KM462881 KM462881 KM462881 KM462881 KM462881 KM462881 KM462881
Chara vulgaris DQ229107 DQ229107 DQ229107 DQ229107 DQ229107 DQ229107 DQ229107 DQ229107 DQ229107
Chaetosphaeridium globosum NC004115 NC004115 NC004115 NC004115 NC004115 NC004115 NC004115 NC004115 NC004115
Zygnema circumcarinatum NC008117 NC008117 NC008117 NC008117 NC008117 NC008117 NC008117 NC008117 NC008117
Roya anglica KJ461681 KJ461681 KJ461681 KJ461681 KJ461681 KJ461681 KJ461681 KJ461681 KJ461681
Marchantiophytina
Haplomitrium gibbsiae KF852066 AY608030 AB013675 (mnioides) HQ413015 (hookeri) KF851438 AY007641
Treubia lacunosa HQ412995 AY507428 HQ413014 AY507468 KP324847
Blasia pusilla DQ646047 DQ645982 AY507436 AY007619
Marchantia polymorpha X04465 X04465 X04465 X04465 X04465 X04465 X04465 X04465 X04465
Conocephalum conicum DQ646015 AB056154 AF264664 AY688791 AF071834
Pellia endivifolia JX827163 JX827163 JX827163 JX827163 JX827163 JX827163 JX827163 JX827163 JX827163
Fossombronia angulosa AY507353 AY507398 HF585107 HF585119 HF585128 AY507440 AY507527
Aneura mirabilis NC010359 NC010359 NC010359 NC010359 NC010359 NC010359 NC010359 NC010359 NC010359
Frullania DQ646041 (dilatata) AM384881(dilatata) KC918782 (tamarisci)
Porella platyphylla DQ646040 (pinnata) EF547189 - - AY168655 AY462387 AY007637
Ptilidium pulcherrimum HM222519 HM222519 HM222519 HM222519 HM222519 HM222519 HM222519 HM222519 HM222519
Herbertus stramineus AY607903 (H. sakurai) KC250516 JN113493 KF851457 DQ293985
Plagiochila asplenoidesDQ646035 (porelloides) AY149839 B266 JX308605 AY149858
Jungermannia exsertifoliaKF942425 KF943592 KF943503
AY453774 (J. exsertifolia)
Scapania undulata DQ646032 (nemorea) AY149840 GU295889 (bolanderi) AY462392 AY453783
Anthocerotophytina
Leiosporoceros dussii GQ497601 AY619652 NA HQ413019 KF482228 KP238712
Anthoceros formosae NC004543 NC004543 NC004543 NC004543 NC004543 NC004543 NC004543 NC004543 NC004543
Nothoceros aenigmaticus NC020259 NC020259 NC020259 NC020259 NC020259 NC020259 NC020259 NC020259 NC020259
Lycopodiophyta
Huperzia lucidula AY660566 AY660566 AY660566 AY660566 AY660566 AY660566 AY660566 AY660566 AY660566
Isoëtes flaccida GU191333 GU191333 GU191333 GU191333 GU191333 GU191333 GU191333 GU191333 GU191333
Selaginella moellendorffii FJ755183 FJ755183 FJ755183 FJ755183 FJ755183 FJ755183 FJ755183 FJ755183 FJ755183
Monilophytina
Psilotum nudum KC117179 KC117179 KC117179 KC117179 KC117179 KC117179 KC117179 KC117179 KC117179
Ophioglossum californicum KC117178 KC117178 KC117178 KC117178 KC117178 KC117178 KC117178 KC117178 KC117178
Angiopteris evecta DQ821119 DQ821119 DQ821119 DQ821119 DQ821119 DQ821119 DQ821119 DQ821119 DQ821119
Equisetum arvense GU191334 GU191334 GU191334 GU191334 GU191334 GU191334 GU191334 GU191334 GU191334
Equisetum hyemale KC117177 KC117177 KC117177 KC117177 KC117177 KC117177 KC117177 KC117177 KC117177
Osmundastrum cinnamomeum KF225592 KF225592 KF225592 KF225592 KF225592 KF225592 KF225592 KF225592 KF225592
Lygodium japonicum KC536645 KC536645 KC536645 KC536645 KC536645 KC536645 KC536645 KC536645 KC536645
Gleichenia japonica AF313550 U05624 - - HM021798 AF313599 (dicarpa) AY651838 (dicarpa)
Diplopterygium glaucum NC_024158 NC_024158 NC_024158 NC_024158 NC_024158 NC_024158 NC_024158 NC_024158 NC_024158
Hymenophyllum tunbrigense EF463469 AB496576 EU552822 (hirsutum) JF303898 AY775420 (javanicum) KF113295 (javanicum)

atpB rbcL psaA psbB matK rps4 trnL G1 core rrn23 (Cp-LSU) rrn16 Cp-SSU
(polyanthos)
Marsilea crenata KC536646 KC536646 KC536646 KC536646 KC536646 KC536646 KC536646 KC536646 KC536646
Alsophila spinulosa NC012818 NC012818 NC012818 NC012818 NC012818 NC012818 NC012818 NC012818 NC012818
Lophosoria quadripinnata ABA325 ABA325 ABA325 ABA325 ABA325 ABA325 ABA325 ABA325 ABA325
Cyathea atahuallpa ABA128 ABA128 ABA128 ABA128 ABA128 ABA128 ABA128 ABA128 ABA128
Cyathea obnoxia ABA135 ABA135 ABA135 ABA135 ABA135 ABA135 ABA135 ABA135 ABA135
Plagiogyria glauca KP136831 KP136831 KP136831 KP136831 JF303911 (euphlebia) KP136831 KP136831 KP136831 KP136831
Pteridium aquilinum HM535629 HM535629 HM535629 HM535629 HM535629 HM535629 HM535629 HM535629 HM535629
Cheilanthes lindheimeri HM778032 HM778032 HM778032 HM778032 HM778032 HM778032 HM778032 HM778032 HM778032
Adiantum capillus-veneris AY178864 AY178864 AY178864 AY178864 AY178864 AY178864 AY178864 AY178864 AY178864
Ceratopteris richardii KM052729 KM052729 KM052729 KM052729 KM052729 KM052729 KM052729 KM052729 KM052729
Dipteris conjugata KP136829 KP136829 KP136829 EU552820 - KP136829 KP136829 KP136829 KP136829
Cystopteris protrusa KP136830 KP136830 KP136830 KP136830 KP136830 KP136830 KP136830 KP136830 KP136830
Asplenium nidus EF463336 AB013238 AJ347885 KP835367 DQ629313
Dicksonia antarctica U93829 HM021802 EU552818 HM021802 AF313596 AM410355 KJ569698 KJ569698
Mankyua chejuensis JF343520 JF343520 JF343520 JF343520 JF343520 JF343520 JF343520 JF343520 JF343520
Gymnosperms
Wollemia nobilis KP259800 KP259800 KP259800 KP259800 KP259800 KP259800 KP259800 KP259800 KP259800
Welwitschia mirabilis NC010654 NC010654 NC010654 NC010654 NC010654 NC010654 NC010654 NC010654 NC010654
Ephedra equisetina NC011954 NC011954 NC011954 NC011954 NC011954 NC011954 NC011954 NC011954 NC011954
Gnetum montanum NC021438 NC021438 NC021438 NC021438 NC021438 NC021438 NC021438 NC021438 NC021438
Gnetum gnemon KP099649 KP099649 KP099649 KP099649 KP099649 KP099649 KP099649 KP099649 KP099649
Cycas taitungensis AP009339 AP009339 AP009339 AP009339 AP009339 AP009339 AP009339 AP009339 AP009339
Cycas revoluta JN867588 JN867588 JN867588 JN867588 JN867588 JN867588 JN867588 JN867588 JN867588
Encephalartos lehmannii LC049336 LC049336 LC049336 LC049336 LC049336 LC049336 LC049336 LC049336 LC049336
Lepidozamia peroffskyana LC049207 LC049207 LC049207 LC049207 LC049207 LC049207 LC049207 LC049207 LC049207
Zamia furfuracea JX416857 JX416857 JX416857 JX416857 JX416857 JX416857 JX416857 JX416857 JX416857
Dioon spinulosum LC049070 LC049070 LC049070 LC049070 LC049070 LC049070 LC049070 LC049070 LC049070
Ginkgo biloba AB684440 AB684440 AB684440 AB684440 AB684440 AB684440 AB684440 AB684440 AB684440
Abies koreana KP742350 KP742350 KP742350 KP742350 KP742350 KP742350 KP742350 KP742350 KP742350
Cedrus deodara AB480043 AB480043 AB480043 AB480043 AB480043 AB480043 AB480043 AB480043 AB480043
Picea abies HF937082 HF937082 HF937082 HF937082 HF937082 HF937082 HF937082 HF937082 HF937082
Pinus thunbergii D17510 D17510 D17510 D17510 D17510 D17510 D17510 D17510 D17510
Larix decidua AB501189 AB501189 AB501189 AB501189 AB501189 AB501189 AB501189 AB501189 AB501189
Araucaria muelleri KM678419 KM678419 KM678419 KM678419 KM678419 KM678419 AY145322 (araucana) KM678419 KM678419
Phyllocladus trichomanoidesAJ621931 AB027315 AJ344293 AJ347877 AF456376
AY188258 (aspleniifolius)
AY083117 (aspleniifolius)
Podocarpus lambertii KJ010812 KJ010812 KJ010812 KJ010812 KJ010812 KJ010812 KJ010812 KJ010812 KJ010812
Taxus mairei KJ123824 KJ123824 KJ123824 KJ123824 KJ123824 KJ123824 KJ123824 KJ123824 KJ123824
Torreya californica AJ621934 AB027317 (nucifera) AF180025 AF222706 AB030137 (nucifera) DQ478804 KJ589069 DQ478782 (nucifera)
Cryptomeria japonica AP010967 AP010967 AP010967 AP010967 AP010967 AP010967 AP010967 AP010967 AP010967
Cupressus sempervirens KP099643 KP099643 KP099643 KP099643 KP099643 KP099643 KP099643 KP099643 KP099643
Hesperocyparis arizonica AJ621925 L12571 AJ344291 AJ347875 AF152188 HM024371 HM024539 KP099644 KP099644
Juniperus bermudiana KF866297 KF866297 KF866297 KF866297 KF866297 KF866297 KF866297 KF866297 KF866297
Metasequoia glyptostroboides KR061358 KR061358 KR061358 KR061358 KR061358 KR061358 KR061358 KR061358 KR061358
Sequoia sempervirens AJ621927 L25755 AF180012 AJ347882 AF152209 AY188266 AB030051 EU161555
Taiwania flousiana KC427274 KC427274 KC427274 KC427274 KC427274 KC427274 KC427274 KC427274 KC427274
Angiosperms
Amborella trichopoda AJ506156 AJ506156 AJ506156 AJ506156 AJ506156 AJ506156 AJ506156 AJ506156 AJ506156
Brasenia schreberi AJ235418 M77031 GU902260 AY779187 JF268431 AY145329
Nuphar advena DQ354691 DQ354691 DQ354691 DQ354691 DQ354691 DQ354691 DQ354691 DQ354691 DQ354691
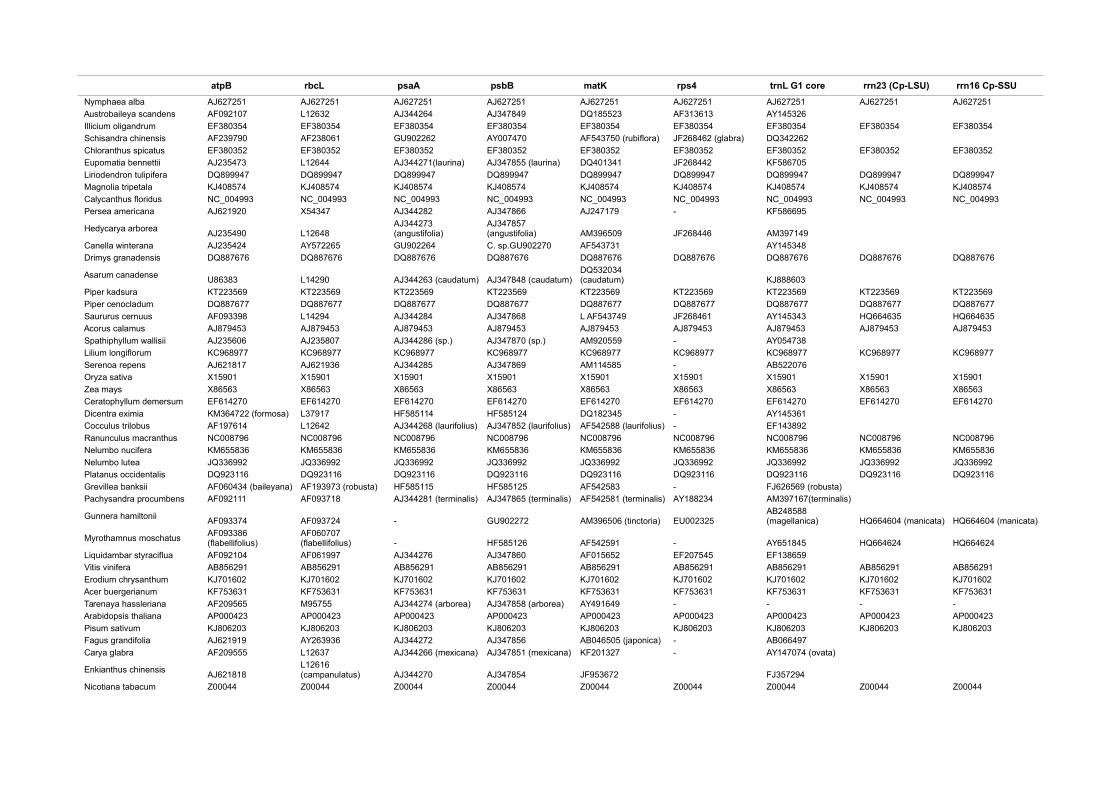
atpB rbcL psaA psbB matK rps4 trnL G1 core rrn23 (Cp-LSU) rrn16 Cp-SSU
Nymphaea alba AJ627251 AJ627251 AJ627251 AJ627251 AJ627251 AJ627251 AJ627251 AJ627251 AJ627251
Austrobaileya scandens AF092107 L12632 AJ344264 AJ347849 DQ185523 AF313613 AY145326
Illicium oligandrum EF380354 EF380354 EF380354 EF380354 EF380354 EF380354 EF380354 EF380354 EF380354
Schisandra chinensis AF239790 AF238061 GU902262 AY007470 AF543750 (rubiflora) JF268462 (glabra) DQ342262
Chloranthus spicatus EF380352 EF380352 EF380352 EF380352 EF380352 EF380352 EF380352 EF380352 EF380352
Eupomatia bennettii AJ235473 L12644 AJ344271(laurina) AJ347855 (laurina) DQ401341 JF268442 KF586705
Liriodendron tulipifera DQ899947 DQ899947 DQ899947 DQ899947 DQ899947 DQ899947 DQ899947 DQ899947 DQ899947
Magnolia tripetala KJ408574 KJ408574 KJ408574 KJ408574 KJ408574 KJ408574 KJ408574 KJ408574 KJ408574
Calycanthus floridus NC_004993 NC_004993 NC_004993 NC_004993 NC_004993 NC_004993 NC_004993 NC_004993 NC_004993
Persea americana AJ621920 X54347 AJ344282 AJ347866 AJ247179 - KF586695
Hedycarya arboreaAJ235490 L12648
AJ344273 (angustifolia)
AJ347857 (angustifolia) AM396509 JF268446 AM397149
Canella winterana AJ235424 AY572265 GU902264 C. sp.GU902270 AF543731 AY145348
Drimys granadensis DQ887676 DQ887676 DQ887676 DQ887676 DQ887676 DQ887676 DQ887676 DQ887676 DQ887676
Asarum canadenseU86383 L14290 AJ344263 (caudatum) AJ347848 (caudatum)
DQ532034 (caudatum) KJ888603
Piper kadsura KT223569 KT223569 KT223569 KT223569 KT223569 KT223569 KT223569 KT223569 KT223569
Piper cenocladum DQ887677 DQ887677 DQ887677 DQ887677 DQ887677 DQ887677 DQ887677 DQ887677 DQ887677
Saururus cernuus AF093398 L14294 AJ344284 AJ347868 L AF543749 JF268461 AY145343 HQ664635 HQ664635
Acorus calamus AJ879453 AJ879453 AJ879453 AJ879453 AJ879453 AJ879453 AJ879453 AJ879453 AJ879453
Spathiphyllum wallisii AJ235606 AJ235807 AJ344286 (sp.) AJ347870 (sp.) AM920559 - AY054738
Lilium longiflorum KC968977 KC968977 KC968977 KC968977 KC968977 KC968977 KC968977 KC968977 KC968977
Serenoa repens AJ621817 AJ621936 AJ344285 AJ347869 AM114585 - AB522076
Oryza sativa X15901 X15901 X15901 X15901 X15901 X15901 X15901 X15901 X15901
Zea mays X86563 X86563 X86563 X86563 X86563 X86563 X86563 X86563 X86563
Ceratophyllum demersum EF614270 EF614270 EF614270 EF614270 EF614270 EF614270 EF614270 EF614270 EF614270
Dicentra eximia KM364722 (formosa) L37917 HF585114 HF585124 DQ182345 - AY145361
Cocculus trilobus AF197614 L12642 AJ344268 (laurifolius) AJ347852 (laurifolius) AF542588 (laurifolius) - EF143892
Ranunculus macranthus NC008796 NC008796 NC008796 NC008796 NC008796 NC008796 NC008796 NC008796 NC008796
Nelumbo nucifera KM655836 KM655836 KM655836 KM655836 KM655836 KM655836 KM655836 KM655836 KM655836
Nelumbo lutea JQ336992 JQ336992 JQ336992 JQ336992 JQ336992 JQ336992 JQ336992 JQ336992 JQ336992
Platanus occidentalis DQ923116 DQ923116 DQ923116 DQ923116 DQ923116 DQ923116 DQ923116 DQ923116 DQ923116
Grevillea banksii AF060434 (baileyana) AF193973 (robusta) HF585115 HF585125 AF542583 - FJ626569 (robusta)
Pachysandra procumbens AF092111 AF093718 AJ344281 (terminalis) AJ347865 (terminalis) AF542581 (terminalis) AY188234 AM397167(terminalis)
Gunnera hamiltoniiAF093374 AF093724 - GU902272 AM396506 (tinctoria) EU002325
AB248588 (magellanica) HQ664604 (manicata) HQ664604 (manicata)
Myrothamnus moschatusAF093386 (flabellifolius)
AF060707 (flabellifolius) - HF585126 AF542591 - AY651845 HQ664624 HQ664624
Liquidambar styraciflua AF092104 AF061997 AJ344276 AJ347860 AF015652 EF207545 EF138659
Vitis vinifera AB856291 AB856291 AB856291 AB856291 AB856291 AB856291 AB856291 AB856291 AB856291
Erodium chrysanthum KJ701602 KJ701602 KJ701602 KJ701602 KJ701602 KJ701602 KJ701602 KJ701602 KJ701602
Acer buergerianum KF753631 KF753631 KF753631 KF753631 KF753631 KF753631 KF753631 KF753631 KF753631
Tarenaya hassleriana AF209565 M95755 AJ344274 (arborea) AJ347858 (arborea) AY491649 - - - -
Arabidopsis thaliana AP000423 AP000423 AP000423 AP000423 AP000423 AP000423 AP000423 AP000423 AP000423
Pisum sativum KJ806203 KJ806203 KJ806203 KJ806203 KJ806203 KJ806203 KJ806203 KJ806203 KJ806203
Fagus grandifolia AJ621919 AY263936 AJ344272 AJ347856 AB046505 (japonica) - AB066497
Carya glabra AF209555 L12637 AJ344266 (mexicana) AJ347851 (mexicana) KF201327 - AY147074 (ovata)
Enkianthus chinensisAJ621818
L12616 (campanulatus) AJ344270 AJ347854 JF953672 FJ357294
Nicotiana tabacum Z00044 Z00044 Z00044 Z00044 Z00044 Z00044 Z00044 Z00044 Z00044

Table 12: Plastid primers used in this study
trnK/matK
trnK-Fbryo1 GGGTTGCTAACTCAATGGTAGAG trnK land plants Wicke & Quandt 2009
psbARbryo CGCTTTCGCGTCTTTCTAAAG psbA land plants Quandt
trnK_450F TTAAGTCAGRAGAGCAAT trnK bryophytesexcl. Sphagum
Quandtthis study
matK_1307R AAGCTAATGTTTTAGCRCAAGAA matK bryophytes Quandtthis study
matK_1321R CTTTTATGTTTRCAAGCTAATG matK bryophytes Quandtthis study
matK_1400R TTTGAABAATATCAAGATACCA matK bryophytes Quandtthis study
rpl16
F71 GCTATGCTTAGTGTGTGACTCGTT rpl16Exon1
bryophytes Jordan et al. 1996
rpl16R GTAATCCAAGCTGGTTCAAGTGC rpl16 Exon 2 bryophytes Quandt/ Olsson
trnLF
trnL_15 AWTGGTAGACGCTRCGGACT trnL 5’exon
land plants Wicke & Quandt 2009
trnF_39 TTTGAACTGGTGACACRAGGA trnF land plants Wicke & Quandt 2009
atpB-rbcL
atpB1 ACATCKARTACKGGACCAATAA atpB-rbcL bryophytes Chiang_et_al_1998
rbcL1 AACACCAGCTTTRAATCCAA atpB-rbcL bryophytes Chiang_et_al_1998
rbcl
rbcL_34F GGTGTTGGATTTAAAGCTGGTGTT rbcL bryophytes Cox__et_al_2000
rbcL_1390R CTTTCCAAACTTCACAAGCAGCAG rbcL bryophytes Cox__et_al_2000
rbcL_745R CTTCACAWGTACCTGCRGTAG rbcL bryophytes Cox__et_al_2000

Table 13: Fossil calibration points for divergence dating.
Code Node (MRCA) from to type Fossil Reference StratigraphyAge (Myr)
lower upper
ROOTColeochaetales + Emryophytes
Chara Fagus - Estimation Hackett etal 2007 Estimation 970 870
Embryophytes
EMB07 Emryophyta stem Halpomitrium Fagus fixCryptospores with sporopollenin
Rubinstein etal 2010upper Ordovician (Hirnantian)
485 443,8
MTZ Metzgeriales stem Pellia Plagiochila min Metzgeriothallus sharonaeVanAller, Hernick, et al. 2008
middle devonian (Givetian)
387,7 382,7
MOSMosses + Vascular Plants
Sphagnum Fagus minSporogonites spp. (sporangium with central sterile region)
Halle 1916/1936; Kenrick and Crane, 1997; Goffinet etal 2000
lower devonian 419,2 393,3
BRY Bryidae Tetraplodon Sanionia min Merceria augustica Smoot & Taylor, 1986upper permian (lopingian)
259,8 252,2
HYP pleurocarpous stem Ptychomnion Sanionia min Capimirinus riopretensis de Souza et al 2012 permian (guadalupian) 272,3 259,8
HYP2 Hypnanae crown Lopidium Sanionia max Krassiloviella limbelloides Shelton et al. 2016Early cretaceous (Valanginian)
139,8 132,9
Tracheophytes
LYC Tracheophyta crown Huperzia Fagus min Baragwanathia longifolia
Garrat and Rickards, 1987; Hueber, 1992; Kenrick and Crane, 1997
Upper Silurian (Ludlow) 427,4 423
ISSIsoetaceae + Selaginallaceae
Isoetes Selaginella min Leclercquia complexaFairon-Demaret 1974, Kenrick & Crane 1997
Middle Devonian (Givetian)
393,3 382,7
IBY Equisetales stem Equisetum Asplenium min Ibyka amphikoma Skog & Banks, 1973Middle Devonian (Givetian)
393,3 382,7
OSM Osmundaceae stem Osmunda Asplenium minThamnopteris schlechtendalii
Miller 1971, Taylor &al. 2009
Upper Permian 259,8 252,2
GLE Gleichenia stem Diplopterygium Gleichenia min Gleichenia chaloneriHerendeen & Skog 1998
(Early) Albian 113,5 100,5

Code Node (MRCA) from to type Fossil Reference StratigraphyAge (Myr)
lower upper
SCZSchizaeaceae crown (sister to Lygodium)
Lygodium Asplenium min Stachypteris spicans
Harris 1961; van Konijnenburg-vanCittert 1991; Wikström & Kenrick 2002
Middle Juassic (Bajocian)
170,3 168,3
MAR Marsileaceae stem Marsilea Asplenium min Regnellites nagashimae Yamada & Kato, 2002Upper Jurassic (Berriasian)
163,5 145
CYA Cyatheaceae stem Dicksonia Cyathea minCyathocalulis naktongensis and C. yabei
Ogura, 1927; Nishida 1982; Lantz et al. 1999 (Schuettpelz & Pryer 2009; Korall & Pryer, 2014)
Upper Jurassic 163,5 145
PTE Pteridaceae stem Ceratopteris Asplenium min Pteris sp.Krassilov & Bacchia, 2000
mid-Cenomanian 100,5 93,9
EUPSpermatophyta stem = Euphyllophyta crown
Psilotum Fagus minPertica quadrifaria, Pertica varia
Gensel & Andrews 1994; Banks 1975; Kenrick & Crane 1997
Lower Devonian (Emsian)
407,6 393,3
Gymnosperms
CGS Conifers + Ginkgo stem Cycas Juniperus min Swillingtonia denticulataTrivett 1992Scott 1974; Scott & Chaloner 1983
Middle Pennsylvanian 315,2 307
CYC Cycads crown CycasEncephalartos
min Crossozamia spp.Gao & Thomas 1989; Hermsen et al. 2006
Lower Permian 298,9 272,3
PIN Pinaceae stem Cedrus Juniperus min Eathiestrobus mackenziei Rothwell et al. 2012 Upper Triassic 237 201,3
PPS Pinus-Picea split Pinus Picea minPicea burtonii, Pinus mundayi
Klymiuk & Stockey, 2012; Falcon-Lang et al. 2016
Valanginian 139,8 132,9
GNE Gnetophytes stem Ephedra Juniperus minDechellyia gormanii, Masculostrobus clatratus
Ash 1972; Crane 1996 Upper Triassic 237 201,3
EPHEphedra stem = Gnetales crown
Ephedra Gnetum minLiaoxia chenii, Ephedra archaeorhytidosperma
Rydin et al. 2006; Yang et al. 2005
Early Cretaceous (Barremian)
129,4 125

Code Node (MRCA) from to type Fossil Reference StratigraphyAge (Myr)
lower upper
ARAU Araucariaceae stem Phyllocladus Araucaria minBrachyphyllum mamillare and Araucarites phillipsii
Harris, 1979Middle Jurassic (Aalenian)
174,1 170,3
TAX Taxaceae stem Taxus Juniperus min Palaeotaxus rediviva Florin 1951Lower Jurassic (Hettangian)
201,3 199,3
Angiosperms
ANG Angiosperms crown Amborella Fagus maxPollen with infratectal columellae and perforate to reticulate tectum
Hughes & McDougall 1987; Hughes et al. 1991; Brenner 1996; Doyle 2005, 2009, 2012
Valanginian-Hauterivian; Lower Cretaceous
151,8 132,9
NYM Nymphaeaceae stem Brasenia Nuphar min Monetianthus mirus Friis et al. 2001, 2009late Aptian to early Albian
113 100,5
SCS Schisandraceae stem Austrobaileya Illicium min Anacostia marylandensisFriis et al., 1997; Doyle et al., 2008
late Aptian to early Albian
113 100,5
CHL Chloranthaceae crown Chloranthus Hedycarya min Asteropollis plantFriis et al., 1994, 1997, 1999; Eklund et al., 2004
late Barremian-early Aptian
125 113
MAG Magnoliales crown Eupomatia Magnolia min Endressinia brasiliana
Mohr and Bernardes-de-Oliveira, 2004; Doyle and Endress, 2010
late Aptian to early Albian
113 100,5
LAU Lauraceae stem Persea Hedycarya min Potomacanthus lobatusvon Balthazar et al. 2007
early-middle Albian; Lower Cretaceous
113 100,5
WINWinteraceae stem =Canellales crown
Canella Drimys min Walkeripollis gabonensisDoyle et al. 1990a, 1990b, Doyle & Endress 2010;
late Barremian; Lower Cretaceous
129,4 125
ARAC Araceae crown Spathiphyllum Oryza min Mayoa portugallica Friis et al. 2004late Barremian-early Aptian
129,4 125
ARE Arecaceae stem Serenoa Oryza minLeaves, stems and pollen grains assigned to Araceae
Christopher 1979; Daghlian 1981
Santonian, Upper Cretaceous
86,3 83,6

Code Node (MRCA) from to type Fossil Reference StratigraphyAge (Myr)
lower upper
EUD Eudicotyledoneae stem Ceratophyllum Fagus minTricolpate pollen grains, Hyrcantha decussata
Doyle & Hotton 1991,Dilcher et al. 2007; Friis et al. 2011; Leng & Friis 2003, 2006
Barremian-Aptian; Lower Cretaceous Radiometric date: 125 Ma
129,4 125
RAN Ranunculales crown Dicentra Ranunculus min Teixeiraea lusitanicavon Balthazar et al. 2005
late Aptian, Lower Cretaceous
125 113
MEN Menispermaceae stem Cocculus Ranunculus minPrototinomiscium testudinarum, P. vangerowii
Knobloch & Mai 1986Maastrichtian; Upper Cretaceous
72,3 66
PLA Platanaceae stem Platanuss Grevillea min Sapindopsis plant Crane et al. 1993early-middle Albian; Lower Cretaceous
113 100,5
BUX Buxales stem Pachysandra Fagus min Spanomera marylandensis Drinnan et al. 1991late Albian (Lower Cretaceous)
113 100,5
PEN Pentapetalae crown Nicotiana Fagus min Rose Creek flowerBasinger and Dilcher, 1984
latest Albian (Lower Cretaceous)
113 100,5
ERI Ericales crown Enkianthus Nicotiana minPaleoenkianthus sayrevillensis
Nixon & Crepet 1993Turonian (Upper Cretaceous)
93,9 89,8
BRA Brassicales stem Acer Tarenaya min Dressiantha bicarpelata Gandolfo et al., 1998Turonian (Upper Cretaceous)
93,9 89,8
FAG Fagales crown Carya Fagus min Normapolles pollenPacltová 1966; Friis et al. 1983
middle Cenomanian; Upper Cretaceous
100,5 93,9

Table 14: Species richness in extant mosses. Samplingfraction is the number of taxa that represent a clade divided by the total number of know taxa belonging to the clade.
species name cladename samplingfraction #tax #species in clade
Sphagnum capillifolium Sphagnopsida 0,0033 1 301
Takakia lepidozioides Takakiopsida 0,5000 1 2
Andreaea nivalis Andreaeopsida 0,0110 1 91
Alophosia spec Polytrichopsida 0,0261 6 230
Atrichopsis compressus Polytrichopsida 0,0261 6 230
Atrichum undulatum Polytrichopsida 0,0261 6 230
Dawsonia spec Polytrichopsida 0,0261 6 230
Pogonatum urnigerum Polytrichopsida 0,0261 6 230
Oligotrichum hercynicum Polytrichopsida 0,0261 6 230
Oedipodium griffithianum Oedipodiopsida 1,0000 1 1
Tetraphis pellucida Tetraphidopsida 0,4000 2 5
Tetrodontium brownianum Tetraphidopsida 0,4000 2 5
Buxbaumia aphylla Buxbaumiidae 0,0833 1 12
Diphyscium sessile Diphysciidae 0,0714 1 14
Gigaspermum repens Gigaspermidae 0,5000 3 6
Chamaebryum pottioides Gigaspermidae 0,5000 3 6
Oedipodiella australis Gigaspermidae 0,5000 3 6
Encalypta streptocarpa Funariidae 0,0526 2 38
Bryobrittonia longipes Funariidae 0,0526 2 38
Discelium nudum Funariidae 0,0139 4 288
Funaria hygrometrica Funariidae 0,0139 4 288
Physcomitrella patens Funariidae 0,0139 4 288
Physcomitrium pyriforme Funariidae 0,0139 4 288
Timmia bavarica Timmiidae 0,5000 3 6
Timmia norvegica Timmiidae 0,5000 3 6
Timmia austriaca Timmiidae 0,5000 3 6
Catoscopium nigritum Catoscopiales 1,0000 1 1
Timmiella spec Timmiellales 0,0769 1 13
Drummondia prorepens Scouleriales 0,1000 1 10
Blindia acuta Grimmiales 0,0091 4 440
Racomitrium lanuginosum Grimmiales 0,0091 4 440
Coscinodon cribrosus Grimmiales 0,0091 4 440
Grimmia donniana Grimmiales 0,0091 4 440
Leucobryum glaucum MADP 0,0025 9 3566
Orthodicranum montanum MADP 0,0025 9 3566
Fissidens cristatus MADP 0,0025 9 3566
Schistostega pennata MADP 0,0025 9 3566
Ditrichum cylindricum MADP 0,0025 9 3566
Ceratodon purpureus MADP 0,0025 9 3566

species name cladename samplingfraction #tax #species in clade
Cinclidotus riparius MADP 0,0025 9 3566
Tortula latifolia MADP 0,0025 9 3566
Pottia truncata MADP 0,0025 9 3566
Hedwigia ciliata Hedwigiales 0,0513 2 39
Rhacocarpus purpurascens Hedwigiales 0,0513 2 39
Bartramia halleriana Helicophyllales + Bartramiales
0,0053 2 376
Plagiopus oederi Helicophyllales + Bartramiales
0,0053 2 376
Tetraplodon fuegianus Splachnales 0,0235 2 85
Splachnum ampullaceum Splachnales 0,0235 2 85
Bryum argenteum Bryales 0,0029 3 1043
Pohlia nutans Bryales 0,0029 3 1043
Mnium hornum Bryales 0,0029 3 1043
Ulota crispa Orthotrichales 0,0036 3 840
Orthotrichum rogeri Orthotrichales 0,0036 3 840
Nyholmiella obtusifolia Orthotrichales 0,0036 3 840
Orthodontium lineare Orthodontiales 0,0455 1 22
Aulacomnium androgynum Aulacomniales 0,0833 1 12
Ptychomnion cygnisetum Ptychomniales 0,0227 1 44
Lopidium struthiopteris Hookeriales 0,0014 1 699
Fontinalis antipyretica Hypnales 0,0028 12 4245
Sanionia uncinata Hypnales 0,0028 12 4245
Brachythecium rivulare Hypnales 0,0028 12 4245
Plagiothecium laetum Hypnales 0,0028 12 4245
Herzogiella seligeri Hypnales 0,0028 12 4245
Scorpidium scorpioides Hypnales 0,0028 12 4245
Hygrohypnum ochraceum Hypnales 0,0028 12 4245
Hypnum jutlandicum Hypnales 0,0028 12 4245
Tomentypnum nitens Hypnales 0,0028 12 4245
Pterogonium gracile Hypnales 0,0028 12 4245
Thamnobryum alopecurum Hypnales 0,0028 12 4245


1 100
1 100
1 100
1 100
1 98
1 96
1 97
0.97 83
1 100
1 100
1 100
1 100
1 100
1 100
1 100
1 99
1 100
1 100
1 81
1 76
1 100
1 100
0.68 40
0.63 33
0.98 42
0.95 32
1 88
1 64
1 95
1 93
0.99 94
0.95 82
1 100
1 100
1 99
1 94
1 100
1 100
1 99
1 99
0.86 52
0.76 42
1 94
1 90
1 94
1 93
1 100
1 100
1 100
1 97
Sanionia uncinataHygrohypnum ochraceum
Scorpidium scorpioidesTomentypnum nitens
0.98 92
0.97 89
1 76
1 73
1 72
1 74
Thamnobryum alopecurumPterogonium gracile
Hypnum jutlandicumBrachythecium rivulare
1 90
1 79
Plagiothecium laetumHerzogiella seligeri
Fontinalis antipyreticaLopidium concinnum
Ptychomnion cygnisetumAulacomnium androgynum
Orthodontium lineare
1 100
1 100
1 93
1 98
Orthotrichum rogeriNyholmiella obtusifolia
Ulota crispa
1 92
1 89
1 100
1 100
Mnium hornumPohlia nutans
Bryum argenteum1 100
1 100
Bartramia hallerianaPlagiopus oederi
1 100
1 100
Rhacocarpus purpurascensHedwigia ciliata
1 100
1 100
Splachnum ampullaceumTetraplodon fuegianus
1 100
1 100
0.99 82
0.96 73
1 83
1 81
1 100
1 100
1 83
0.99 79
1 100
1 100
1 96
1 88
1 100
1 100
1 95
1 81
1 100
1 100
1 91
1 89
Tortula latifoliaPottia truncata
Cinclidotus ripariusCeratodon purpureus
Ditrichum cylindricumSchistostega pennata
1 97
0.97 89
Orthodicranum montanumFissidens cristatus
Leucobryum glaucum
1 100
1 100
1 100
1 100
1 100
1 100
Grimmia donnianaCoscinodon cribrosus
Racomitrium lanuginosumBlindia acuta
Drummondia prorepensTimmiella spec
Catoscopium nigritum
1 100
1 100
1 100
1 100
Timmia austriacaTimmia norvegica
Timmia bavarica
1 100
1 100
1 100
1 100
1 100
1 100
Physcomitrella patensPhyscomitrium pyriforme
Funaria hygrometrica
1 92
1 88
1 100
1 100
Encalypta streptocarpaBryobrittonia longipes
Discelium nudum
1 100
1 100
1 100
1 100
Chamaebryum pottioidesOedipodiella australis
Gigaspermum repensDiphyscium sessile
Buxbaumia aphylla1 100
1 100
Tetraphis pellucidaTetrodontium brownianum
1 100
1 100
1 100
1 100
1 94
1 96
1 98
1 98
[0.45] 57
0.9 69
Atrichum undulatumPogonatum urnigerum
Oligotrichum hercynicumAtrichopsis compressus
Dawsonia specAlophosia spec
Oedipodium griffithianumAndreaea nivalis
Sphagnum capillifoliumTakakia lepidozioides
Bryidae
Dicranidae
Timmiidae
Gigaspermidae
Funariidae
Tetraphidopsida
Polytrichopsida
OedipodiopsidaAndreaeopsidaSphagnopsidaTakakiopsida
Bryopsida
Figure 21: Ratogram inferred by the concatenated plastid dataset. Branch length correspond to substitution rates inferred by RAxML 8.2, values above branches depict support values with indel coding, below without indel coding. Left values are posteriour probabilities from BI, right values are bootstraps from ML.
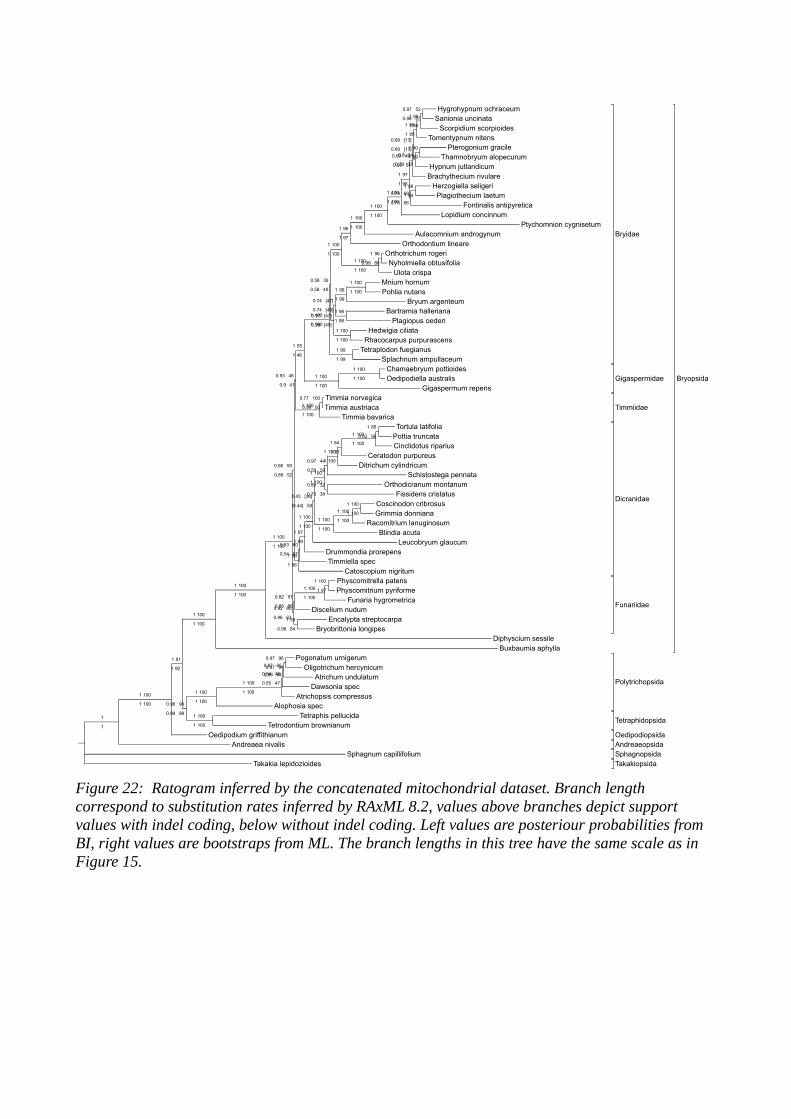
1
1
1 100
1 100
1 91
1 92
1 100
1 100
1 100
1 100
1 100
1 100
0.98 59
0.88 52
0.93 46
0.9 41
1 55
1 46
1 100
1 100
0.58 39
0.58 40
1 100
1 100
1 96
1 97
1 100
1 100
1 100
1 100
1 100
1 100
1 97
1 96
0.99 49
0.99 51
0.89 [13]
0.89 [13]
1 96
1 95
1 99
1 99
0.97 52
0.98 57
Hygrohypnum ochraceumSanionia uncinata
Scorpidium scorpioidesTomentypnum nitens
0.8 34
0.79 35
1 90
1 89
Pterogonium gracileThamnobryum alopecurum
Hypnum jutlandicumBrachythecium rivulare
0.79 69
0.78 66
1 86
1 84
Herzogiella seligeriPlagiothecium laetum
Fontinalis antipyreticaLopidium concinnum
Ptychomnion cygnisetumAulacomnium androgynum
Orthodontium lineare
1 100
1 100
1 96
0.99 88
Orthotrichum rogeriNyholmiella obtusifolia
Ulota crispa
0.97 [47]
0.98 [49]
0.74 [47]
0.74 [49]
1 99
1 99
1 100
1 100
Mnium hornumPohlia nutans
Bryum argenteum1 98
1 98
Bartramia hallerianaPlagiopus oederi
1 100
1 100
Hedwigia ciliataRhacocarpus purpurascens
1 99
1 99
Tetraplodon fuegianusSplachnum ampullaceum
1 100
1 100
1 100
1 100
Chamaebryum pottioidesOedipodiella australis
Gigaspermum repens
1 100
1 100
0.77 100
0.99 93
Timmia norvegicaTimmia austriaca
Timmia bavarica
1 96
1 96
0.53 60
0.54 57
1 97
1 99
1 100
1 100
0.43 [36]
[0.44] 50
1 100
1 100
0.97 44
0.59 50
1 100
1 100
1 84
1 81
1 100
1 100
1 85
0.62 96
Tortula latifoliaPottia truncataCinclidotus riparius
Ceratodon purpureusDitrichum cylindricum
Schistostega pennata0.89 32
0.73 38
Orthodicranum montanumFissidens cristatus
1 100
1 100
1 100
1 100
1 100
1 100
Coscinodon cribrosusGrimmia donniana
Racomitrium lanuginosumBlindia acuta
Leucobryum glaucumDrummondia prorepensTimmiella spec
Catoscopium nigritum
0.92 60
0.96 63
0.82 57
0.85 66
1 100
1 100
1 100
1 97
Physcomitrella patensPhyscomitrium pyriforme
Funaria hygrometricaDiscelium nudum
1 59
0.98 84
Encalypta streptocarpaBryobrittonia longipes
Diphyscium sessileBuxbaumia aphylla
0.98 96
0.99 98
1 100
1 100
1 100
1 100
0.54 48
0.55 47
0.87 65
0.88 64
0.97 96
0.97 94
Pogonatum urnigerumOligotrichum hercynicum
Atrichum undulatumDawsonia spec
Atrichopsis compressusAlophosia spec
1 100
1 100
Tetraphis pellucidaTetrodontium brownianum
Oedipodium griffithianumAndreaea nivalis
Sphagnum capillifoliumTakakia lepidozioides
Bryidae
Dicranidae
Timmiidae
Gigaspermidae
Funariidae
Tetraphidopsida
Polytrichopsida
OedipodiopsidaAndreaeopsidaSphagnopsidaTakakiopsida
Bryopsida
Figure 22: Ratogram inferred by the concatenated mitochondrial dataset. Branch length correspond to substitution rates inferred by RAxML 8.2, values above branches depict support values with indel coding, below without indel coding. Left values are posteriour probabilities from BI, right values are bootstraps from ML. The branch lengths in this tree have the same scale as in Figure 15.


Table 15: Testing the sensitivity of the rate shift prior “expectedNumberOfRates”. While an influence cannot be denied, the first three core shifts are always recovered.
prior 2 5 10 100
rank prob core shifts prob core shifts prob core shifts prob core shifts
1 0,13658 5 0,17055 5 0,19931 5 0,23544 5
2 0,12458 4 0,1006 4 0,10612 4 0,12598 4
3 0,06862 5 0,08661 5 0,09039 5 0,11892 5
4 0,06262 3 0,0493 6 0,05333 5 0,09585 4
5 0,04197 4 0,04397 5 0,04959 6 0,06666 4
6 0,04064 4 0,04330 4 0,04186 3 0,04733 4
7 0,03664 5 0,03997 4 0,03999 4 0,04159 3
8 0,02798 6 0,03464 4 0,03626 4 0,03520 3
9 0,02598 2 0,03331 3 0,03346 4 0,02493 3


Table 16: Per motif length homoplasy measures and statistics for phylogenetic signal K and D, number of coded SSR sites and number of reconstructed events.
motif length (SSRs)
number of coded SSRs
# reconstructed events
PI sites%
RI RC HI(excl. uniformative Char.)
mean(K statistic)
95%CI (K) fraction of failedp(PIC variance)
mean D statistic
95% CI (D)
fraction D better than Brownian
fraction D better than random
2 50 65 34 0.5319 0.3694 0.5641 0.8927 0.2347 0.2857 -1.1601 0.5976 0.8000 0.8400
3 79 107 35.4 0.7979 0.4601 0.6744 1.5418 0.4310 0.4231 -0.5751 0.5710 0.6623 0.7662
4 77 79 16.9 0.7714 0.6387 0.5517 0.9572 0.2158 0.2763 -0.1902 0.6371 0.5584 0.6494
5 56 61 28.6 0.8421 0.7255 0.3600 1.0166 0.3837 0.3091 -0.1402 0.5947 0.5714 0.6250
6 27 24 18.5 0.8889 0.8571 0.1667 0.7830 0.3442 0.2308 0.0616 0.8033 0.5185 0.7037
7 24 25 16.7 0.8824 0.8145 0.3330 1.2046 0.7145 0.2609 -0.3158 1.2827 0.5000 0.6250
8 13 14 15.4 1 1 0 0.7932 0.4935 0.2500 -0.4920 1.3784 0.4615 0.6923
9 18 16 33.3 1 1 0 1.0405 0.7737 0.2941 -0.3094 1.2334 0.5556 0.5556
10-14 44 43 27.3 0.8919 0.8176 0.2500 0.8361 0.3400 0.2326 -0.4393 0.6456 0.5455 0.7045
>15 22 24 18.2 0.8571 0.7857 0.3330 0.5466 0.2758 0.1429 0.3308 1.2835 0.4545 0.5455
Σ 410 45.8 24.43 0.85 0.75 0.32 0.96 0.42 0.27 -0.32 0.9 0.56 0.67