evaluating the impact of different bus fleet configurations transport group greater wellington...
TRANSCRIPT
pwc.co.nz
Evaluating theimpact ofdifferent busfleetconfigurations
Greater Wellington
Regional Council
April 2014
.
Public Transport GroupGreater Wellington Regional CouncilPO Box 11646Wellington
4 April 2014
Evaluating the impact of different bus fleet configurations in theWellington region
We have pleasure in presenting our report on the evaluation of the potential configurations of
Wellington’s future bus fleet.
This report has been produced in accordance with our Engagement Letter dated 6 January 2014. We
draw your attention to the important notice in Appendix F.
Yours sincerely
Bruce Wattie Chris Money
Partner Director

PwC Page iii
Table of contents
Glossary of terms 4
1. Executive summary 5
2. Introduction and context 11
3. The need for investment 16
4. Strategic considerations 18
5. Bus technologies in the market 22
6. Core economic evaluation 30
7. Wider economic evaluation 39
Appendix A – Benefit cost ratios and cost and benefit breakdown 47
Appendix B – Methodology 48
Appendix C – Key inputs and assumptions 52
Appendix D – Background to modelling 58
Appendix E – Report figures inclusive of accelerated HFC bus implementation 65
Appendix F – Important Notice 68

PwC Page 4
Glossary of terms
Abbreviation Term
BCR Benefit Cost Ratio
BRT Bus Rapid Transit
CO Carbon monoxide
CO2 Carbon dioxide
EEM Economic Evaluation Manual
GW Greater Wellington Regional Council
HC Hydrocarbon
HFC Hydrogen Fuel Cell
LRT Light Rail Transit
NOx Nitrous oxides
PM10 Particulate matter
PTOM Public Transport Operating Model
PTSS Public Transport Spine Study
WCCL Wellington Cable Car Limited
WELL Wellington Electricity Lines Limited

PwC Page 5
1. Executive summary
Introduction
Wellington’s bus fleet is presently made up of 60 electric trolleys and 218 diesel buses. The fleet is of mixed
age and performance capability. Many buses in the fleet will need to be replaced over the next five to ten
years.
The present Metlink bus network includes a mix of high-frequency core routes through to lower frequency
local connector routes. Suburbs to the South, East and West have core routes set up to take trolleys, while
suburbs to the North have no trolley capability. Typically, bus routes overlap in the central city (North,
South, Railway Station to Courtenay Place) but only a small number of services in the Wellington region do
not terminate in the central city (for example the Airport Flyer).
The Greater Wellington Regional Council (“Greater Wellington”) is looking to improve the operating
performance of its future network. It is taking the opportunity of the conclusion of the trolley bus operating
contract in 2017 to evaluate options for Wellington’s bus fleet configuration in order to facilitate the desired
performance improvement.
This report has been prepared to evaluate the potential bus fleet configurations that could be used to
achieve a best practice bus fleet (i.e. it does not take account of legacy buses presently operating in
Wellington). A best practice fleet is a fleet that will deliver an efficient, cost-effective service that also meets
the region’s environmental and social goals. The ageing nature of the current fleet means that it does not
sufficiently meet these criteria. Different combinations of bus types have been assessed against a
trolley/diesel combination “base case”1. The intention is for Greater Wellington to consult on the bus fleet
configuration options in April 2014.
A decision is required on the investment to be made in Wellington’s bus
fleet and supporting infrastructure
Trolley buses make up approximately 20% of the current bus fleet, with the remainder of the fleet being
comprised of mixed age and mixed European (Euro) emission standard diesel buses. Euro emission
standards for vehicles define the acceptable levels of exhaust emissions for vehicles sold within the EU 2.
These standards range from Euro I standard to Euro VI standard. Figure 1 summarises the current fleet
mix by bus type and by Euro standard.
1 Referred to as the ‘baseline’ option throughout this report.
2 PolicyMeasures (2010). Euro Standards. Retrieved from www.policymeasures.com
PwC Page 6
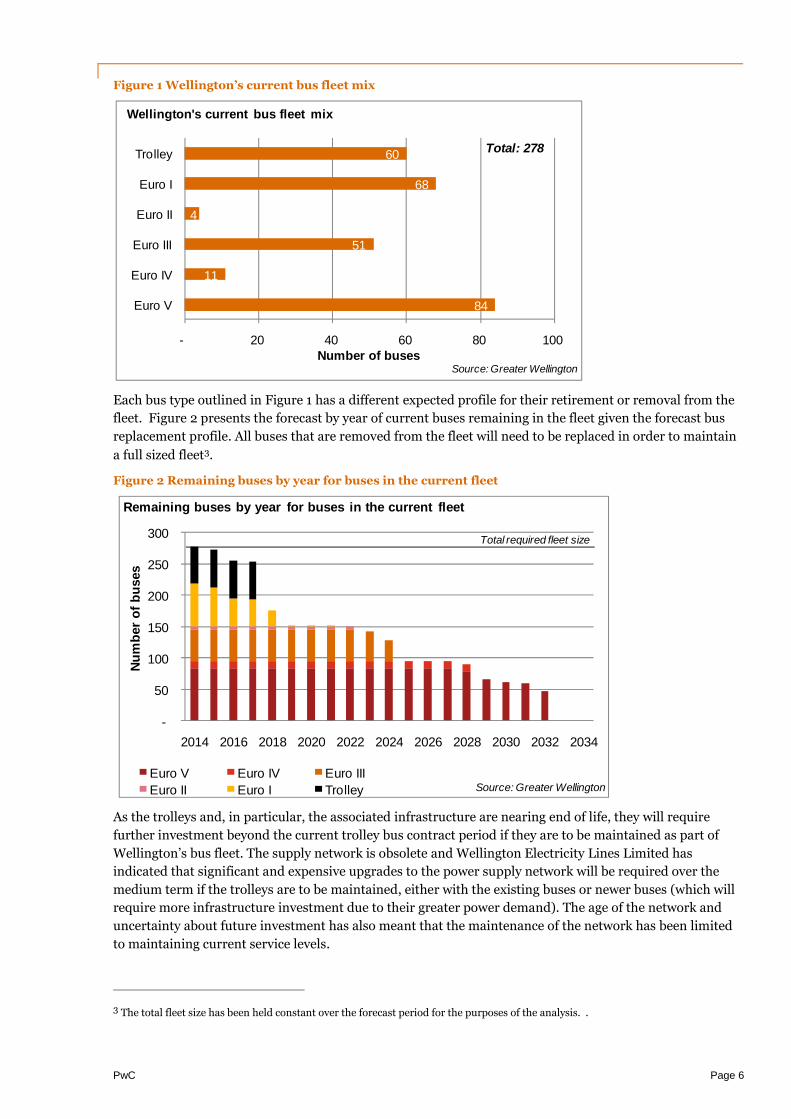
Figure 1 Wellington’s current bus fleet mix
Each bus type outlined in Figure 1 has a different expected profile for their retirement or removal from the
fleet. Figure 2 presents the forecast by year of current buses remaining in the fleet given the forecast bus
replacement profile. All buses that are removed from the fleet will need to be replaced in order to maintain
a full sized fleet3.
Figure 2 Remaining buses by year for buses in the current fleet
As the trolleys and, in particular, the associated infrastructure are nearing end of life, they will require
further investment beyond the current trolley bus contract period if they are to be maintained as part of
Wellington’s bus fleet. The supply network is obsolete and Wellington Electricity Lines Limited has
indicated that significant and expensive upgrades to the power supply network will be required over the
medium term if the trolleys are to be maintained, either with the existing buses or newer buses (which will
require more infrastructure investment due to their greater power demand). The age of the network and
uncertainty about future investment has also meant that the maintenance of the network has been limited
to maintaining current service levels.
3 The total fleet size has been held constant over the forecast period for the purposes of the analysis. .
84
11
51
4
68
60
- 20 40 60 80 100
Euro V
Euro IV
Euro III
Euro II
Euro I
Trolley
Number of buses
Wellington's current bus fleet mix
Source: Greater Wellington
Total: 278
-
50
100
150
200
250
300
2014 2016 2018 2020 2022 2024 2026 2028 2030 2032 2034
Nu
mb
er
of
bu
ses
Euro V Euro IV Euro III
Euro II Euro I Trolley
Remaining buses by year for buses in the current fleet
Source: Greater Wellington
Total required fleet size

PwC Page 7
Many of the diesel buses in the fleet will also need to be replaced within the next 5 – 10 years. All of the
Euro I and Euro II standard diesels are expected to be removed from the fleet by 2023 and a decision is
required on what should replace these buses.
The conclusion and potential renewal of the trolley bus operating contract in 2017 provides an opportunity
for Greater Wellington to consider its strategy for both trolley and diesel replacement options. The total
costs associated with any replacement decision will be impacted by two factors – bus replacement costs and
infrastructure costs. The need for supporting infrastructure will depend on the bus option chosen.
Maintaining the current network will require significant investment
The trolley bus overhead network is nearing the end of its life. Substantial reinvestment in the power
supply infrastructure will be required if trolleys are to be retained in Wellington’s bus fleet. Figure 3
highlights the present value costs of the ‘baseline’4 option involving reinvestment in trolleys and a ‘run
down’ option where little to no network investment is made and trolleys are gradually replaced with Euro
III diesel buses (as the trolley capability degrades)5. These options represent minimum investment options
for the current fleet based on whether trolleys are retained or removed.
Figure 3 Present value (PV) costs of minimum reinvestment options for the current fleet
Infrastructure estimates in the baseline option are based on information from Greater Wellington,
Wellington Electricity Lines Limited and Wellington Cable Car Limited. The difference in the present value
costs of these two options is significant at approximately $90m.
A wide range of options are available for bus replacement
The emergence of new bus technology and the tightening of Euro emission standards mean that there are
many options that can be considered for the renewal of Wellington’s bus fleet. The bus types assessed in the
economic evaluation in this report are diesels, trolleys, dual modes (trolley/diesel), hybrids, opportunity
electrics and hydrogen fuel cells (HFC).
The bus replacement options evaluated are summarised in Table 1.
4 For the purposes of the fleet evaluation, the baseline option has been taken to be the ‘base case’ or ‘do minimum’ option.
5 Trolleys are replaced with Euro IIIs as these are expected to be the lowest type of Euro standard diesel that would be consideredfrom 2018. As Euro I and Euro II buses are forecast to mostly be phased out by this time, these Euro standard buses have not beenconsidered to replace trolleys.
355 343
108 27
-
100
200
300
400
500
Baseline Run down
$m
PV of bus operating and capital costs
PV of infrastructure requirements Source: GW, WELL, PwC analysis
Total present value costs of minimum reinvestment options for thecurrent fleet

PwC Page 8
Table 1 Bus replacement options considered in the evaluation
Option Replace current diesels with… Replace current trolleys with…
Diesel & Trolley Euro V/VI diesels New trolleys
Diesel & Dual Euro V/VI diesels Dual modes (trolley/diesel)
Diesel Euro V/VI diesels
Hybrid & Trolley Hybrids New trolleys
Hybrid & Dual Hybrids Dual modes (trolley/diesel)
Hybrid Hybrids
Electric Opportunity electrics6
HFC Hydrogen fuel cells
Acc. Hybrid Hybrids*
Acc. Electric Opportunity electrics*
Acc. HFC Hydrogen fuel cells*
* Under options 5 – 7, existing buses in the fleet are replaced at an accelerated rate. These options have been included to assess the
benefits of a faster introduction of newer technologies.
Most bus fleet configuration options provide positive net benefits relative to
the baseline
An economic evaluation in line with the New Zealand Transport Agency’s Economic Evaluation Manual
(EEM) has been undertaken for the different bus fleet configuration options. The economic evaluation is
based on the quantitative and qualitative costs and benefits of each option.
Benefits (or disbenefits) that have been included in the analysis include time savings and environmental
emission reductions that may be realised from a change in the bus fleet mix. Time savings have been based
on information provided by Greater Wellington about the differences in travel time between trolley and
diesel buses. Trolleys tend to be slower than diesels because of overloading issues, de-polings and from
being unable to pass each other. Emission reductions would be realised if buses employed cleaner burning
technologies than the current buses.
The costs in the analysis include bus costs, costs of infrastructure, annual maintenance costs, driver costs,
and fuel and electricity costs.
The net benefits (relative benefits less relative costs) of each option compared to the baseline have been
calculated and are included in Figure 4. This figure excludes the accelerated hydrogen fuel cell (“HFC”)
introduction option as the magnitude of this option’s negative net benefit skews the relativity to the other
options. Figure 4 is replicated with the inclusion of this option in Appendix E.
6 Opportunity electrics are battery powered buses that charge at multiple stops throughout their travel route. These differ to electricbuses that charge overnight.
PwC Page 9
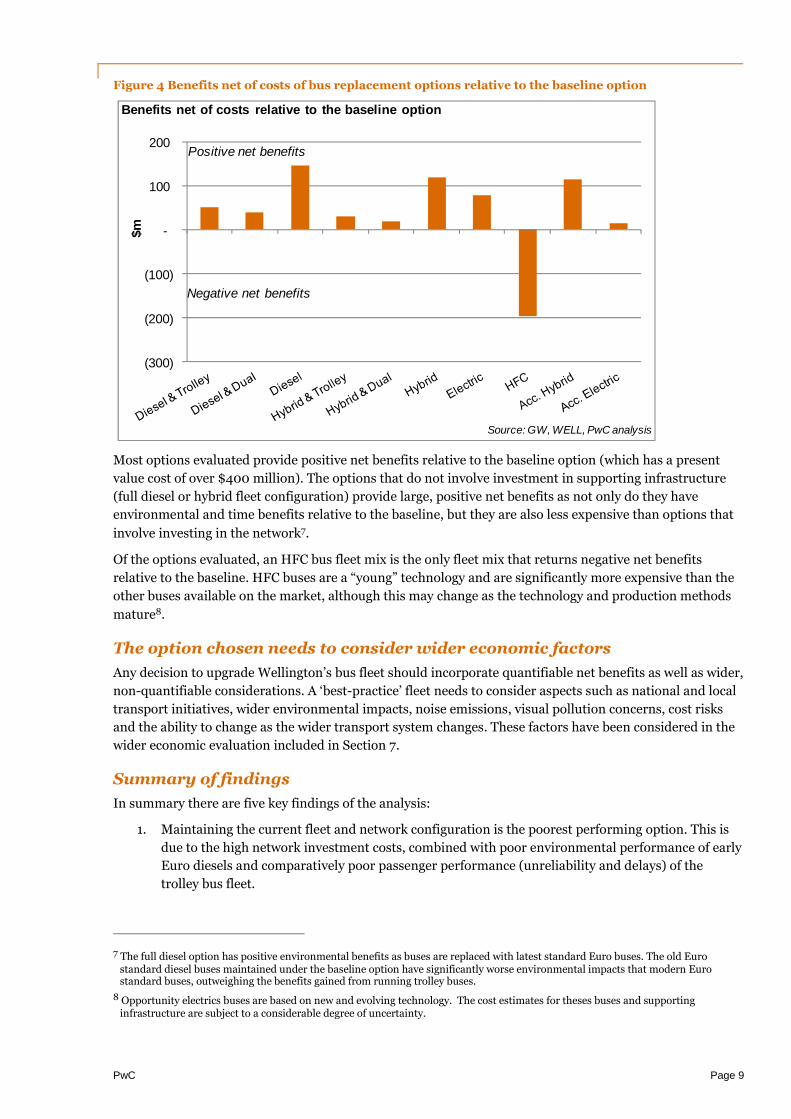
Figure 4 Benefits net of costs of bus replacement options relative to the baseline option
Most options evaluated provide positive net benefits relative to the baseline option (which has a present
value cost of over $400 million). The options that do not involve investment in supporting infrastructure
(full diesel or hybrid fleet configuration) provide large, positive net benefits as not only do they have
environmental and time benefits relative to the baseline, but they are also less expensive than options that
involve investing in the network7.
Of the options evaluated, an HFC bus fleet mix is the only fleet mix that returns negative net benefits
relative to the baseline. HFC buses are a “young” technology and are significantly more expensive than the
other buses available on the market, although this may change as the technology and production methods
mature8.
The option chosen needs to consider wider economic factors
Any decision to upgrade Wellington’s bus fleet should incorporate quantifiable net benefits as well as wider,
non-quantifiable considerations. A ‘best-practice’ fleet needs to consider aspects such as national and local
transport initiatives, wider environmental impacts, noise emissions, visual pollution concerns, cost risks
and the ability to change as the wider transport system changes. These factors have been considered in the
wider economic evaluation included in Section 7.
Summary of findings
In summary there are five key findings of the analysis:
1. Maintaining the current fleet and network configuration is the poorest performing option. This is
due to the high network investment costs, combined with poor environmental performance of early
Euro diesels and comparatively poor passenger performance (unreliability and delays) of the
trolley bus fleet.
7 The full diesel option has positive environmental benefits as buses are replaced with latest standard Euro buses. The old Eurostandard diesel buses maintained under the baseline option have significantly worse environmental impacts that modern Eurostandard buses, outweighing the benefits gained from running trolley buses.
8 Opportunity electrics buses are based on new and evolving technology. The cost estimates for theses buses and supportinginfrastructure are subject to a considerable degree of uncertainty.
(300)
(200)
(100)
-
100
200$m
Benefits net of costs relative to the baseline option
Source: GW, WELL, PwC analysis
Positive net benefits
Negative net benefits

PwC Page 10
2. The largest environmental benefits to Wellington will result from replacing the early Euro diesel
buses with modern technology buses, regardless of what the technology is. In this respect, all
options offer positive environmental benefits relative to the baseline, even those that see the trolley
bus fleet (and existing diesels) replaced with modern diesels.
3. With the exception of HFC buses, options that are not reliant on a network investment result in
cost savings compared to retaining the current network and fleet configuration.
4. Net benefits of all options are at least $50 million higher than the baseline option, and the
difference between the options is reasonably small given the scale of funding and a 40 year analysis
period.
5. The results of the analysis show there are four options that allow Greater Wellington to reduce
direct costs to ratepayers relative to the baseline and increase environmental and efficiency
benefits.

PwC Page 11
2. Introduction and context
Wellington’s current bus network
Wellington’s bus fleet is currently comprised of a mixture of electric trolleys and diesel buses. Diesels make up
approximately 80% of the total fleet with the remaining 20% of the fleet being of trolleys. Over 120 buses in the
diesel fleet are of Euro standard III or lower and the majority of these are Euro I standard buses.
The fleet is of mixed age and performance capability. Approximately 30% of the current fleet was registered
prior to 2004 and will require replacement in the next five to ten years.
The present Metlink bus network includes a mix of high-frequency core routes through to lower frequency local
connector routes. Typically, routes overlap in the central city (North, South, Railway Station to Courtenay
Place) but only a small number of services in the Wellington region do not terminate in the central city (for
example, the Airport Flyer). Most bus routes serving the southern and western suburbs travel on Courtney
Place and Lambton Quay, which at times causes congestion in the city centre.
Figure 5 shows Wellington City’s regularly scheduled bus network, as at December 2013.
Figure 5 Wellington city’s bus network as at December 20139
9 Metlink. (2013). Network map. Retrieved from www.metlink.org.nz

PwC Page 12
Suburbs to the South, East and West have core routes set up to take trolleys, while suburbs to the North have no
trolley bus capability. The existing trolley bus network covers 80km of road and is shown in Figure 6.
Figure 6 Trolley bus routes in Wellington
The trolley bus overhead network extends throughout the western and southern suburbs with no wiring
extending north of the railway station. Although the network covers many of the busiest routes through the
central city, no investment in major extensions to the network has been made in at least 20 years. Trolley wires
are run on a single alignment through the central routes, constraining rerouting options for trolleys in the
congested city centre. More information on Wellington’s trolley network is provided in the following section.
Wellington’s trolley bus network
Current network
Wellington’s trolley bus fleet is currently comprised of 60 buses. These were refreshed during 2007 to 2009
using axles and traction motors from the former trolley fleet from the 1980s. The buses have the capacity to
hold between 54 and 70 passengers, with an average capacity of 66. This average capacity is greater than that of
a standard diesel bus (55), but less than the larger diesel buses (75) that operate on Wellington’s network.
The weekday service on trolley bus routes covers a distance of 8,141km, representing 36% of the total bus
service distance in Wellington city. The number of buses required on the trolley routes during peak morning
traffic is 67, of which 54 are typically trolleys and the remaining 13 are diesel buses.
During weekends, trolley bus routes comprise 9,211km, representing about half of all bus kilometres in the city.
Due to the extra, unfunded costs associated with managing the overhead network, however, trolleys are
replaced with diesel buses during weekend operations.
Trolley bus trends and Wellington’s continued use
International trolley use has reduced in recent decades and Wellington’s trolley bus system is the only
remaining public trolley bus system in Australasia. Reasons for declining usage include the high maintenance

PwC Page 13
and renewal costs of overhead networks, reliability issues, the inflexibility of changing transport routes and
inefficiencies associated with not being able to pass other trolleys on the same line.
Wellington has so far gone against the international trend of reducing trolley bus use. There had been
discussion on reducing Wellington’s trolley bus services, but this received considerable opposition from the
public. Environmental considerations have become an increasing factor in trolley bus related decisions.
Trolley bus disruptions
The inflexibility of the overhead network means that disruptions to trolley services are common when roading
and infrastructure work is being undertaken or when other events occur that limit the passage of trolleys. In the
20 months to July 2013, diesel buses were required to replace trolleys for a quarter of all weekday services. One
example of trolley bus system disruptions was the recent work on the Karori tunnel portals. The work prevented
trolleys running on the Karori service for almost a year and required 14 additional diesel buses to be brought
into Wellington. Similar issues are common and will be experienced with the work to be undertaken at the
Basin Reserve and in the Hataitai tunnel in the near future as part of the Rapid Transit Spine and the Airport to
Levin Road of National Significance.
International trolley bus use
History
The first trolleys came into use at the turn of the 19th and 20th centuries. Although Germany was the first
country to introduce trolleys in 1882, trolley bus use became more wide spread from the early 1920s. This time
period aligned with improved levels of infrastructure and engineering capability, making the implementation of
trolley bus systems more feasible.
Since the 1970s, the motivations behind investing in trolley bus systems have changed. Environmental
awareness, rising fuel prices and changes in the energy market have been at the forefront of trolley bus
discussions. The desire to find alternatives to diesel and petrol based public transport resulted in trolleys
becoming a more acceptable solution for public transport.
Despite the changing motivations, international trolley bus use has reduced in recent decades. As of 2010,
approximately only 40,000 trolleys were being used internationally. Almost three quarters of these were in
Eastern European countries – most notably Russia. Asia, Northern America and wider Europe account for a
significant proportion of the remainder10
The sections below summarise examples of international trolley bus systems. These examples provide
background for Wellington’s trolley bus system.
San Francisco, USA
The San Francisco trolley bus system is comprised of around 300 trolleys (the largest in the United States and
Canada).11 The trolleys are provided with electric power from the city’s hydro electric power supply and produce
almost no pollution. The quiet efficiency of the trolleys is generally considered more important than the
‘unsightliness’ of the overhead wires required for their operation.12
An advantage of trolleys in San Francisco is that they are more efficient than diesel motor buses on climbing
hilly routes. This is because the electric motors can be overloaded for short periods of time without being
damaged. The trolleys in San Francisco are also reported to have low overall operating costs and produce low to
zero emissions.
10 Zavada, Zavada, Milos. (2010). Conditions for Implementing Trolley buses in Public Urban Transport.
11 Paul Bignardi, San Francisco Municipal Transport Agency. (2012). San Francisco trolley Coach Analysis. Retrieved from www.apta.com.
12 Municipal Transport Agency. (2013). Muni trolley (Electric) Coaches. Retrieved from www.sfmta.com.

PwC Page 14
Disadvantages of San Francisco’s continued use of the trolleys include maintenance challenges and public
opposition of the visual pollution of the overhead wiring network. There are reportedly about three times as
many major failures and twice as many road calls for trolleys compared to diesels in the fleet. Further, as
replacement parts are located internationally, it can be time consuming and expensive when repairs are
required.
It is reported that while the public supports the quiet environmentally friendly trolleys option, they are opposed
to expansion of the wire network, limiting the effectiveness of the system. Electric powered buses which do not
need overhead wiring have been considered as an alternative for future reinvestment.13
Seattle, USA
The trolley bus system in Seattle, Washington is the second largest in the United States (after the San Francisco
system). The fleet consists of 159 electric buses that run on 14 routes on over 100km of road.14 The system
opened in 1940 and continues to operate today, with replacements of the ageing trolley fleet expected in 2015.15
Electric buses have been chosen in Seattle over diesels primarily because the electric service supports the
Climate Action goals to reduce greenhouse gas.16 They are also quiet, are part of Seattle’s transit heritage and
are efficient at travelling around Seattle’s hilly and densely populated environment.17
King County Metro transit, which currently supplies the Seattle trolley buses, are about to provide new trolleys
that will use approximately one third less power than the current models, as well as incorporate regenerative
braking. Special features of the new buses include wheelchair access, three doors, air conditioning and the
ability to kneel the full bus (60 foot models).
The decision to renew the fleet was motivated in part by a growth in ridership in King County, as well as a desire
to increase weekend and evening riding frequency. The initial purchase is expected to be of up to 141 new
trolleys, costing a total of around US$164 million.18
Vancouver, Canada
Vancouver operates the second largest fleet of zero emission electric trolley buses in North America. The fleet
consists of around 250 trolley buses and includes articulated models that have the capacity to hold up to 200
passengers. The trolley buses operate primarily in the city, with diesel or natural gas transit buses operating on
longer, less travelled routes. Vancouver has chosen to use trolleys for the city centre’s public transport system
due to advantages such as large rider capacity and reduced noise and air pollution.19
The South Coast British Columbia Transport Authority updated the fleet in 2006 with modern low floor trolleys
that can reach maximum speeds of 65km per hour. Special features of the new buses include a mobility aid
ramp and kneeling ability, improving the ease of boarding for regular and disabled passengers. A new de-
wirement detection system is also a feature and is supported by retriever reels, enabling the faster retrieval
13 Paul Bignardi, San Francisco Municipal Transport Agency. (2012). San Francisco trolley Coach Analysis. Retrieved from www.apta.com.
14 Seattle Department of Transportation. Electric Trolley Bus Fact Sheet. Retrieved from www.seattle.gov.
15 Capitol Hill Seattle Blog. (2013). New trolley buses coming by 2015, City boosts county’s service on nine key Seattle lines. Retrieved fromwww.capitolhillseattle.com.
16 Seattle Department of Transportation. Electric Trolley Bus Fact Sheet. Retrieved from www.seattle.gov.
17 Capitol Hill Seattle Blog. (2013). New trolley buses coming by 2015, City boosts county’s service on nine key Seattle lines. Retrievedfrom www.capitolhillseattle.com.
18 Capitol Hill Seattle Blog. (2013). New trolley buses coming by 2015, City boosts county’s service on nine key Seattle lines. Retrievedfrom www.capitolhillseattle.com.
19 The TBus group. (2001). The Benefits of Clean, Quiet, Emission-Free Transit Service: Prompting the Trolley bus in Vancouver.Retrieved from www.tbus.org.uk.

PwC Page 15
when the trolley’s de-pole. Regenerative braking capability is utilised and the buses include battery-powered
emergency units so that small deviations can be made en-route by each bus.20
Leeds, England
Leeds New Generation Transport has proposed a 14.8km trolley bus system that will run between the northern
and southern edges of Leeds through the city centre. Each bus will be capable of holding 160 standing and
seated passengers. The new system would aim to reduce congestion through increased use of public transport,
reduce carbon emissions and improve the connectivity between areas.21
Despite the targeted benefits of the system, there has been significant opposition to the £250 million project.
Approximately 20 buildings will need to be demolished for space, and another 3,000 business and domestic
properties could be affected. Opposition to the proposal claims that the project will provide poor value for
money and will damage both the environment and quality of life.22
20 Vossloh Electrical Systems. Kiepe Traction Equipment for Low-floor trolley Buses and Articulated Low-floor Trolley Buses. Retrievedfrom www.vossloh-kiepe.com.
21 New Generation Transport. What is New Generation Transport? Retrieved from www.ngtmetro.com.
22 Yorkshire Evening Post. (2013). The full impact of Leeds trolley bus. Retrieved from www.yorkshireeveningpost.co.uk.

PwC Page 16
3. The need for investment
Introduction
The mixed age and performance ability of the buses in Wellington’s current fleet mean that the replacement of a
significant number of buses will be required over the next five to ten years. Over half of the diesels in the
current fleet will need to be replaced over this period based on the forecast fleet removal profile (as summarised
in Figure 2).
As the trolleys in the fleet and associated infrastructure are nearing end of life, additional investment will also
be required if trolleys are to be maintained as part of Wellington’s bus fleet. As the current trolley bus operating
contract concludes in 2017, Greater Wellington is evaluating its strategy for fleet replacement and the bus types
that should be considered for Wellington’s future bus fleet composition.
Wellington’s trolley bus system is reaching the end of its life
The overhead network that supports the trolleys is reaching the end of its life. The age of the network and
uncertainty around future investment has meant that the maintenance of the network has been limited to
maintaining current service levels. The costs associated with maintaining the overhead network has lead to
trolley bus services costing significantly more to run than equivalent diesel buses, both in terms of “out of
pocket” costs and economic costs (e.g. time losses). .
Of the 15 substation points supplying electricity to the network, 13 are made of obsolete 1950s equipment. The
remaining two substations were constructed in the 1980s using more modern equipment. The equipment in the
supply network is obsolete by modern standards and has not been upgraded in 50 years.
If trolleys are to be used beyond the current trolley operating contract (ending in 2017), the buses will need to
be replaced with newer models. Although the trolley bus fleet was refreshed during 2007 to 2009, the upgrades
were made using old chassis and motors. The buses, therefore, are not equipped with modern technology.
Although the buses have back-up power storage so they can temporarily run when they are disconnected from
the network, this has limited range. The reserve electricity is primarily used to return the buses to the depot or
to remove the buses from the roadway when there are problems with the overhead network.
The investment required to replace the existing system
The existing overhead network will require significant reinvestment beyond current spending for it to remain
viable over the long term. The supply network is obsolete and Wellington Electricity Lines Limited has
indicated that significant and expensive upgrades to the power supply network will be required over the
medium term if the trolleys are to be maintained. Assuming a life of up to 50 years, any reinvestment will also
involve a significant commitment to ongoing maintenance costs in order to maintain the quality of service of
the network.
The age of the trolley fleet means that new buses will be required even if the overhead network did not require
reinvestment. The capital cost of trolleys is significantly higher than diesel alternatives, at least partially
offsetting the benefit that can be gained from running trolleys off electricity that is cheaper to source on a per
kilometre basis.
Minimum investment options
Two options could be considered as ‘do minimum’ cases for Wellington’s current bus fleet. These include a
minimal investment option in the current fleet inclusive of trolleys, and a minimal investment option where
trolleys are progressively removed. These are defined as follows:
Baseline – The baseline option assumes that the current bus fleet mix is maintained. As the trolley fleet and
associated infrastructure is near the end of its life, this option includes the required investment to keep the

PwC Page 17
current fleet in operation. The option assumes that the current overhead network is maintained until the end of
the current contract in 2017. Work to upgrade the overhead network and required electricity infrastructure is
estimated to be approximately $52m and is incurred in 2018.23
Run down – The run down option assumes that the current trolleys are maintained until the end of the
current contract in 2017. Thereafter, it assumes that trolleys are phased out at a rate of 10 buses per year (based
on a gradual reduction in the ability of the network to power the buses) and are replaced with Euro III standard
diesels. Annual maintenance is performed on the overhead network until all trolleys are phased out, but no
significant capital is spent on the renewal of the network.
Figure 7 shows the total present value costs of the two minimum investment options described above.
Figure 7 total present value costs of minimal investment options
Figure 7 highlights that the baseline option is significantly more expensive than the run down option over a 40
year forecast period. The total present value costs under the baseline option are approximately 25% more than
the run down option. This cost difference is mostly attributable to the large additional infrastructure investment
required under the baseline. As trolleys only comprise approximately 20% of the total fleet, this present value
cost difference is significant on a per bus basis (approximately $1.5m per bus).
For the purposes of the fleet evaluation, the baseline option has been taken to be the ‘base case’ or ‘do
minimum’ option. The run down option has been included here to provide context on the significant present
value costs associated with maintaining the current bus fleet.
23This high-level cost estimate is included based on information provided from Greater Wellington and Wellington Electricity LinesLimited.
355 343
108 27
-
100
200
300
400
500
Baseline Run down
$m
PV of bus operating and capital costs
PV of inf rastructure requirements Source: GW, WELL, PwC analysis
Total present value costs of minimum reinvestment options for thecurrent fleet

PwC Page 18
4. Strategic considerations
Introduction
Public transport underpins growth by supporting the activities demanded by a growing economy. High quality
public transport helps to shape the running of the economy through providing more choice and improving the
throughput of people in congested areas. Conversely, poor public transport can constrain travel and increase
the time taken for the public to access their workplaces. Any investment to be made in Wellington’s public
transport needs to consider national transport strategies, Wellington transport strategies and any existing and
future contractual arrangements.
Contribution to national initiatives
Transport plays an important role in enabling the Government’s overall goal to grow the New Zealand economy
to deliver greater prosperity, security and opportunities for all New Zealanders. The transport system provides
connections — both domestically and internationally — for communities and businesses, and meets the travel
needs of international tourists.
The Government’s overarching goal for transport is to provide:
“An effective, efficient, safe, secure, accessible and resilient transport system that supports the growth
of our country’s economy in order to deliver greater prosperity, security and opportunities for all
New Zealanders.”
The National Infrastructure Plan sets out specific goals for transport infrastructure, all of which have relevance
for investment in land transport. These goals are to achieve:
1. A long-term strategic approach to transport planning which maximises the potential synergies between
regional planning and central government strategies.
2. A flexible and resilient transport system that offers greater accessibility and can respond to changing
patterns in demand by maintaining and developing the capacity of the network.
3. Improved operational management practice and the use of demand management tools especially in urban
areas experiencing significant growth.
4. A network of priority roads that will improve journey time and reliability, and ease severe congestion,
boosting the growth potential of key economic areas and improving transport efficiency, road safety and
access to markets.
5. A continued reduction in deaths and serious injuries that occur on the network
6. A public transport system that is robust and effective and offers a range of user options that will attract a
greater percentage of long-term users.
7. A rail system that enables the efficient movement of freight and complements other modes of passenger
transport and freight movement.
8. Sea and air ports that are linked to the overall transport network to support efficient nationwide movement
of passengers, domestic goods and exports and imports and are able to respond to technological changes
and changing international safety and security standards.
Goal two is particularly relevant in relation to Wellington’s bus fleet renewal. Current issues with the network
associated with network flexibility and bus reliability will need to be addressed when upgrading the bus fleet.

PwC Page 19
Contribution to Wellington’s transport strategies
The reinvestment in Wellington’s bus fleet needs to account for the wider plans and strategies for Wellington’s
public transport network. Bus route evaluations, for example, may influence the feasibility of certain bus types
running on the Wellington network. Factors that may impact reinvestment decisions include the Public
Transport Spine Study, the Wellington City Bus Review and the Public Transport Operating Model. These are
outlined below.
Public Transport Spine Study
The Public Transport Spine Study (PTSS) was completed in June 2013. The study was commissioned by Greater
Wellington, Wellington City Council and the NZ Transport Agency with the aim of establishing what the future
of Wellington’s public transport system should look like.
Three options were short-listed and evaluated for the study. These were:
Bus Priority – an improved bus network using the existing vehicle fleet. This which would provide
greater bus priority at intersections and key routes.
Bus Rapid Transit (BRT) – a network utilising dedicated bus lanes for new, high capacity buses. Other
improvements would be made to the system to improve frequency and journey times.
Light Rail Transit (LRT) – a network based around using dedicated tracks for new light rail vehicles.
Other interchanges would be included to transfer to other modes of transport.
The PTSS resulted in the BRT option being chosen by the Regional Transport Committee as the preferred
option to take forward for public consultation. The option provided the highest transport benefits and had the
highest Benefit Cost Ratio (BCR) of the three options. The LRT provided the second highest transport benefits
but its high cost led it to have the lowest BCR of the three options.
The study concluded that the optimum time to implement BRT is in 2021/2022. It was concluded that it would
be technically feasible to develop the BRT option incrementally, but that the optimal introduction would be in a
single stage with completion around 2021/2022. This would align with the roading improvements scheduled for
the Basin Reserve and the Mt Victoria tunnel duplication.
The BRT option was evaluated on the assumption that the existing trolley bus network would not impede the
BRT. This needs to be factored into any decisions on the future of Wellington’s trolley bus fleet as it is unlikely
the BRT can be implemented in its suggested form if trolleys are still being used.24
Public Transport Operating Model
The Public Transport Operating Model (PTOM) is a planning, procurement and business development
framework. The model is designed to improve the commerciality of public transport services, incentivising
services to become fully commercial, and to improve the confidence in efficient pricing.
The model puts emphasis on regional councils and operators working in partnership to deliver public transport
services. Key to the PTOM in Wellington is the requirement of Greater Wellington to define its units of public
transport, with each unit being a public transport service that is considered to be core to the network. The fixed
infrastructure of the trolleys means that the long term plan for trolleys needs to be considered when configuring
the units.25
24 New Zealand Transport Agency. (2013). Central Wellington public transport spine study. Retrieved from www.nzta.govt.nz
25 Ministry of Transport. (2013). Public Transport Operating Model. Retrieved from www.transport.govt.nz.

PwC Page 20
Wellington City Bus Review
The Wellington City Bus Review was undertaken as a review of the current Wellington bus system and routes.
The aim of the review was to improve the reliability, coverage, efficiency and effectiveness of Wellington City’s
bus services and the subsequent value for money of the services.
Contractual arrangements
The existing contractual arrangements for diesel bus operations and trolley bus operations differ in complexity
due to the number of parties involved. The current contract for diesel bus operations is held between Greater
Wellington and NZ Bus Limited. In comparison, the current contractual arrangements involved in operating the
trolleys are more complex and involve several parties.
The contractual arrangements involved in Wellington’s bus operations are shown in Figure 8 and are
summarised below.
Figure 8 Wellington bus contractual relationships
Greater Wellington contracts with NZ Bus Limited to operate diesel bus services.
Greater Wellington contracts with Wellington City Transport Limited to operate trolley bus services.
Greater Wellington contracts with and funds Wellington Cable Car Limited to provide access to and
maintain the overhead network.26
The trolleys are owned and operated by Wellington City Transport Limited, which is owned by New
Zealand Bus Limited.
The overhead network is owned by Wellington Cable Car Limited, which is a council controlled
organisation of the Wellington City Council.
Transfield Services Limited manages the maintenance of the overhead network under contract from
Wellington Cable Car Limited.
Wellington Electricity Lines Limited owns the system of 15 substations that feed the overhead network
and are contracted by Wellington City Transport Limited to provide power to the overhead network.
26 It has been proposed that Wellington Cable Car Limited be brought in-house at Wellington City Council. If this occurs, the contractualstructure for trolley network provision will change.
NZ Bus LimitedWellington City
Council
Wellington CityTransport Limited
Wellington ElectricityLines Limited
Northpower Limited
Greater WellingtonRegional Council
Wellington Cable CarLimited
Transfield ServicesLimited
Trolley busoperations
Networkprovision
Electricityprovision
Substationmaintenance
Networkmaintenance
New ZealandTransport Agency
Co-fundedwith
OwnershipContractFunding
Key
Diesel bus operations
PwC Page 21
Northpower Limited is contracted by Wellington Electricity Lines Limited for the maintenance of the 15
substations.
Greater Wellington and the NZ Transport Agency co-fund the bus services, including maintenance and
operation of the overhead network.
These contractual relationships pose challenges for further investment in the trolley bus network. Multiple
interests will need to be satisfied and getting an accurate estimate of the potential investment will require
careful co-ordination between the interested parties.
Wellington Cable Car Limited, which owns the overhead network, has no contractual relationship with
Wellington Electricity Lines Limited, who supplies the power to the overhead network. If the decision is made
to renew the trolley bus infrastructure, partnership between Wellington Electricity Lines Limited and
Wellington Cable Car Limited27 would be important to ensuring that the required infrastructure specifications
are aligned.
27 Or Wellington City Council if Wellington Cable Car is brought in-house.
PwC Page 22
5. Bus technologies in the market
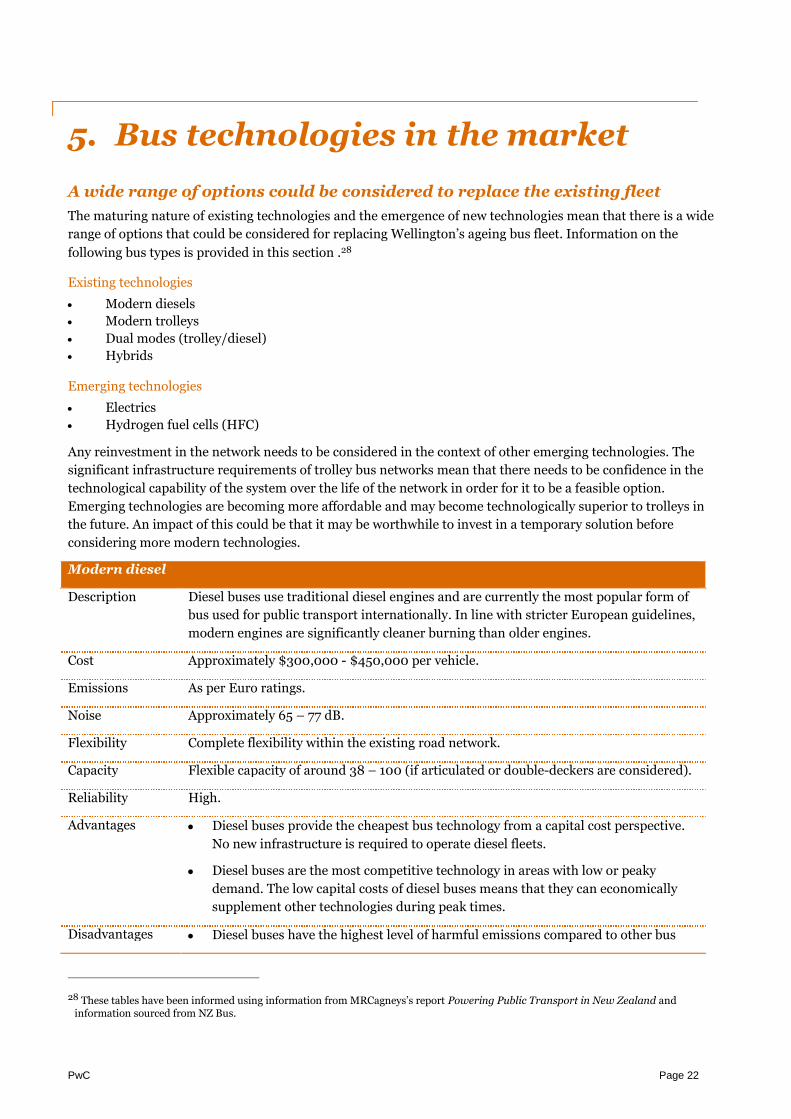
A wide range of options could be considered to replace the existing fleet
The maturing nature of existing technologies and the emergence of new technologies mean that there is a wide
range of options that could be considered for replacing Wellington’s ageing bus fleet. Information on the
following bus types is provided in this section .28
Existing technologies
Modern diesels
Modern trolleys
Dual modes (trolley/diesel)
Hybrids
Emerging technologies
Electrics
Hydrogen fuel cells (HFC)
Any reinvestment in the network needs to be considered in the context of other emerging technologies. The
significant infrastructure requirements of trolley bus networks mean that there needs to be confidence in the
technological capability of the system over the life of the network in order for it to be a feasible option.
Emerging technologies are becoming more affordable and may become technologically superior to trolleys in
the future. An impact of this could be that it may be worthwhile to invest in a temporary solution before
considering more modern technologies.
Modern diesel
Description Diesel buses use traditional diesel engines and are currently the most popular form of
bus used for public transport internationally. In line with stricter European guidelines,
modern engines are significantly cleaner burning than older engines.
Cost Approximately $300,000 - $450,000 per vehicle.
Emissions As per Euro ratings.
Noise Approximately 65 – 77 dB.
Flexibility Complete flexibility within the existing road network.
Capacity Flexible capacity of around 38 – 100 (if articulated or double-deckers are considered).
Reliability High.
Advantages Diesel buses provide the cheapest bus technology from a capital cost perspective.
No new infrastructure is required to operate diesel fleets.
Diesel buses are the most competitive technology in areas with low or peaky
demand. The low capital costs of diesel buses means that they can economically
supplement other technologies during peak times.
Disadvantages Diesel buses have the highest level of harmful emissions compared to other bus
28 These tables have been informed using information from MRCagneys’s report Powering Public Transport in New Zealand andinformation sourced from NZ Bus.

PwC Page 23
Modern diesel
technologies. Although international standards have significantly improved
emission levels, impacts are still high relative to other technologies.
The requirement of diesel buses to have gearboxes and other complex engine
components can increase maintenance costs compared to technologies such as
electric motors.
Diesel buses have high noise pollution when accelerating and climbing hills. In
urban areas, this impact is worse due to the greater number of stops and
subsequent acceleration and gear changes.
Deployment Diesel buses are currently the predominant bus used internationally. As international
emissions standards tighten, older diesel buses are being replaced with buses that run
with significantly reduced environmental impacts.
Coupled with increased accessibility to renewable energy sources, environmental
considerations are moving many counties to consider alternative technologies such as
hybrid and electric buses.
Trolley
Description Trolleys are powered by electricity delivered by overhead cables. Trolleys require
significant upfront capital investment in overhead systems but provide the
environmental benefits of having no greenhouse gas emissions (provided electricity is
sourced from renewable sources).
Rising maintenance costs and limited bus route flexibility has resulted in many
countries migrating away from trolley systems to alternative bus systems.
Cost Approximately $700,000 per vehicle, in addition to the significant capital investment
in, and the maintenance of, overhead networks.
Emissions Nil except for emissions at the source of electricity generation.
Noise Low, at approximately 60 – 70 dB.
Flexibility Limited to overhead wiring networking. Trolleys have a limited ability to overtake
other trolleys on the same line.
Capacity Similar to diesel.
Reliability Reliability is impacted by buses de-wiring from overhead cables. Fixed wiring
networks also mean that if parts of the network are unavailable (e.g. due to road works
underneath), alternative buses need to be used. In the 20 months till July 2013, diesel
buses have been required to replace trolleys for a quarter of all weekday services.
Advantages Trolleys have no emissions. Provided electricity is generated from renewable
sources, trolleys are an environmentally friendly alternative to diesel buses.
Trolleys create very limited noise pollution.
Trolleys are capable of efficiently moving up steep gradients. This is due to the
ability of electric motors to provide maximum torque at start up and to be
overloaded for short periods of time without damage.
PwC Page 24
Trolley
Technological improvements mean that trolleys can cover limited distances
without being connected to an overhead network. This means obstacles can be
avoided and can reduce (somewhat) the complexity of the overhead wiring
required.
Disadvantages Trolleys require significant investment in overhead network infrastructure.
Overhead wiring networks means that bus routes are limited to existing
infrastructure and are difficult to revise (in the absence of investment in network
extensions or changes). Any extension to the network requires significant capital
investment.
The power supply system can become overloaded if too many trolleys are drawing
electricity from the network at the same time, stalling the movement of the
trolleys.
Overhead wiring limits the ability to introduce taller vehicles (e.g. double-deckers).
Overhead wiring contributes to visual pollution.
Overhead wiring poses potential risks to pedestrians if the lines become damaged
or fall.
Trolleys have limited ability to pass other trolley buses that are running off the
same line. This slows traffic, particularly at stops and if buses de-pole.
The low noise output of trolleys can result in crashes with pedestrians. This
problem may be compounded in Wellington with the central city’s existing issues
with pedestrian ‘jaywalking’.
Deployment The main examples of trolley bus use are in Eastern European countries, Asia and
Northern America. Trolley bus use is falling internationally and Wellington’s system is
the last remaining trolley bus system in Australasia.
Dual mode (trolley/diesel)
Description Dual mode trolley/diesel buses have both an electrical and a diesel engine. The two
engines power the buses in one of two ways: firstly some buses are designed to use the
diesel engine as an electrical generator; secondly some buses share the powering of the
axles of the bus between the two engines. The diesel component of the engine is
programmed to only supply the power demanded by the electrical components of the
bus.29 This enables the buses to provide a quiet public transport service to areas both
with and without overhead wires.30
Cost Estimated to be approximately $800,000 per vehicle, in addition to the significant
investment in, and maintenance of, overhead networks.
Emissions Pure trolleys do not produce exhaust fumes as they are fully powered by overhead
29 Patent Buddy .(2014). US Patent No: 4,853,553: Dual mode diesel electric power system for vehicles. Retrieved fromwww.patentbuddy.com.
30 Strickland, J. (2013). Modern Trolley buses. Retrieved from www.bc.transport2000.ca.

PwC Page 25
Dual mode (trolley/diesel)
cables. This results in a more environmentally friendly public transport system,
provided that the energy source is renewable.31 Dual mode trolleys produce
significantly lower emissions than traditional buses. The volume of emissions
produced is limited by the distance of the off-cable portion of the bus route.32
Noise Low noise while powered by electricity from the overhead network.
Flexibility While on the overhead cable networks, unless catered for by the infrastructure, the
trolleys are unable to overtake each other. Additionally, while attached to the electric
cable infrastructure, the buses are less flexible than their diesel bus counterparts. The
hindrance caused by the lack of flexibility is especially evident in high traffic volumes,
in narrow streets (especially with sharp corners) and at bus stops.33
Capacity Similar to electric trolleys.
Reliability The electrical component of the buses relies on power supplied through the overhead
cables. If there is a power outage, the buses must rely on the diesel component of their
propulsion system for the entire bus route or must be replaced by other diesel buses in
the fleet.
Advantages Broadly similar to “pure” trolley buses
There are no requirements for a battery, therefore removing the constraint on
mileage that battery powered buses have. Recharging related infrastructure is also
not required as the electricity source is provided through the overhead cables.
Depending on the model, the buses can be more energy efficient than battery
powered buses as they do not bear the weight of the battery.34
Disadvantages Broadly similar to trolley buses.
Trolley systems require significant investment in overhead network
infrastructure.35
Power outages can decrease the benefits of dual mode trolleys.36
Dual mode buses have higher capital costs than traditional diesel buses.37
Deployment Information on the deployment of dual mode buses has not been readily available from
desktop research. Improving technology and electric energy storage may mean that
these buses are not considered to be a viable option for public transport
31 Low-tech magazine. (2009). Get wired (again): Trolleybuses and Trolleytrucks. Retrived fromwww.lowtechmagazine.com
32 32 Intercity Transit. (2013).Hybrid Bus Fact Sheet. Retrieved from www.intercitytransit.com33 Matzoros, A (2002). Electric Trolley Buses or Thermal Buses? The case of Athens.
abstracts.aetransport.org/paper/download/id/1132
34 Low-tech magazine. (2009). Get wired (again): Trolleybuses and Trolleytrucks. Retrived fromwww.lowtechmagazine.com
35 Low-tech magazine. (2009). Get wired (again): Trolleybuses and Trolleytrucks. Retrived fromwww.lowtechmagazine.com
36 Matzoros, A (2002). Electric Trolley Buses or Thermal Buses? The case of Athens.abstracts.aetransport.org/paper/download/id/1132
37 37 George, P.(2013)How Diesel-fueled Hybrids Work. Retrieved from www.auto.howstuffworks.com

PwC Page 26
Dual mode (trolley/diesel)
implementation.
Hybrid (diesel/electric)
Description Hybrid buses typically use an electric engine in conjunction with a diesel based
combustion engine. The diesel engine is used to charge an internal battery pack which
drives the motor. Regenerative braking is also typically used, transforming kinetic
energy from braking into electrical energy.
Hybrid engines are optimum in urban areas due to lower speeds (reducing energy
consumption) and increased braking (increasing kinetic energy conversion).
Cost Approximately $600,000 per vehicle.
Emissions Up to 25 percent less than standard diesel buses.
Noise Quieter than diesels by approximately 2-3 dB.
Flexibility Complete flexibility within the existing road network.
Capacity Slightly less than diesel alternatives due to the additional battery weight.
Reliability Unproven in the long term, however hybrids are considered to be mature enough for
full scale implementation.
Advantages Hybrid buses produce approximately 25 percent less emissions than standard
diesel buses.
Improved fuel efficiencies reduce ongoing fuel expenditure, at least partially
offsetting the higher capital cost of investment (compared to diesels).
Hybrid buses require no supporting infrastructure, meaning that they can be
introduced easily into the existing fleet. This also means that even if hybrids are
not chosen as the long-term fleet replacement option, they may be appropriate as a
transition vehicle prior to moving to newer technologies.
Disadvantages As a relatively young technology, the long-term reliability of hybrid buses is not
fully known. Auckland deployed hybrid buses in 2000 but these were withdrawn
by 2010 due to technical difficulties.
Hybrids are likely to have minimal fuel savings relative to diesels over longer
distances. Hybrids perform best when travelling on routes where stopping and
starting is frequent as this is better suited to the low speed torque from the electric
drive system. Travelling on long distance routes also means the that benefits
realised from regenerative braking are lower.
Deployment Hybrid buses are becoming more widely used and acknowledged as an alternative to
standard diesel buses. London runs over 300 hybrid buses as part of its regular service,
including double-decker hybrids which have the capacity to carry up to 110 passengers.
Electric
Description Electric buses are powered by an electric battery that drives the motor. These batteries

PwC Page 27
Electric
must be recharged regularly. There are currently two modern types of electric bus in
use – ‘opportunity buses’ and ‘overnight buses’.
Opportunity buses recharge at stopping points en-route allowing them to carry a
lightweight battery (increasing passenger capacity). Overnight buses contain heavier
batteries that are designed to operate all day without recharge. This enables overnight
buses to have more route flexibility than opportunity buses, but at the cost of reduced
capacity.
Regenerative braking is also commonly used to transform kinetic energy from braking
into electrical energy, reducing the amount of charging required at charge stations.
Cost Approximately $900,000 – $1.1m, in addition to charging infrastructure requirements
and battery replacement costs.
Emissions Nil provided electricity generation is renewable.
Noise Low, at approximately 60 – 70 dB.
Flexibility Overnight buses have complete flexibility on the existing network. Opportunity buses
are dependent on power supply infrastructure. They have complete flexibility within
existing road networks if sufficient charging stations are available, otherwise they have
limited range.
Capacity The capacity of overnight buses is slightly less than diesel alternatives due to the
additional battery weight.
Reliability Currently not fully known as the technology is still relatively young and not widely
deployed beyond demonstration projects and niche applications.
Advantages Electric buses have no ongoing emissions outside of the emissions generated at the
point of electricity generation. Provided that the electricity is generated from a
renewable source, electric battery buses are an environmentally friendly
alternative to diesel buses.38
Electric buses create very little noise relative to diesel equivalents.
Electric buses may provide cost advantages compared to conventional diesel buses
because of their high-efficiency electric motors and potentially cheaper sources of
energy. Overnight models charge when energy demand is lowest, minimizing the
energy cost to recharge the buses.
Electric buses contain fewer mechanical components than diesel buses, reducing
engine related maintenance costs.
Disadvantages As a relatively young technology, the long-term reliability of electric buses is not
fully known.
Infrastructure is required for recharging stations for opportunity buses. Recharge
stations are also required for overnight buses, but the investment is less than
opportunity bus infrastructure requirements.
38 This does not consider any emissions that may be produced during the bus manufacturing process.

PwC Page 28
Electric
The range of opportunity buses is limited to routes where recharging stations exist.
The ranges of overnight buses are only restricted by the charge capacity of the
battery. Models are available than can travel over 200km on an overnight charge.
This is shorter than an average daily bus route in Wellington, but could be
managed through spot charging at the end of each route.
Regular charging of opportunity buses can cause delays, and inconvenience to
passengers.
Battery weight can impact on the carrying capacity of electric buses.
Deployment Although electric buses are a relatively young technology, they are improving in
commercial feasibility. A number of cities have adopted electric buses as part of their
public transport service, including:
Shenzhen, China, which is currently operating 200 electric buses, and has recently
ordered 1,000 more. Each bus has a maximum range of 225km.
Seoul, Korea, which has had 9 buses in operation since 2010 and plans to add to
the fleet. These are a battery plug-in model which takes about half an hour to
recharge, with a range of 100km and maximum speed of 100km/hr.
Adelaide, Australia, which deployed a fleet of electric buses powered by solar
energy in 2008. The Adelaide City Council has reported a significant reduction in
pollution in the city but that the maintenance cost of the electric buses is two times
that of a diesel model. In addition, they have found that the buses sometimes
cannot run a full day due to insufficient charge and are not always able to recharge
overnight.
Other countries that are using electric buses as part of their public transport
service include Italy, Sweden and the United States.
Hydrogen fuel cell (HFC)
Description The international use of HFC buses is currently limited to “early adopters”. Although
they are in their relative infancy, HFC vehicles are becoming more common
internationally, with mainstream production expected within the next decade.
The buses are fuelled using hydrogen and use chemical reactions to convert the
chemical energy into electrical energy. Water vapour is the only byproduct of the
energy conversion process, meaning that engines represent an environmentally
friendly technology.39
Travel ranges for HFC buses vary, but HFC buses trialled in Perth had a manufacturer
specified maximum range of 250km40 and Whistler’s fleet had a specified range of
approximately 500km41.
39 Fuel Cells and Hydrogen Joint Undertaking, McKinsey & Company Inc. Urban Buses: Alternative Powertrains for Europe.
40 Owen, Cockroft. (2006). A Cost-Benefit Analysis of Perth’s Hydrogen Fuel Cell Buses.
41 Vancouver Sun. (2013). Whistler’s hydrogen fuel cell bus program in jeopardy. Retrieved from www.vancouversun.com.

PwC Page 29
Hydrogen fuel cell (HFC)
Cost Approximately $2.7m, in addition to the capital costs of hydrogen fuel stations.
Emissions Nil.
Noise Low – similar to trolleys.
Flexibility Complete flexibility within the existing road network provided refueling stations are
accessible.
Capacity Similar to diesel buses.
Reliability Unknown in the long-term.
Advantages The only byproduct of the energy conversion process is water vapour.
Subsequently, HFC buses have the potential to decrease greenhouse gas emissions.
Similar to conventional diesel buses, HFC buses have a long driving range before
requiring refuelling.
As HFC buses use hydrogen for fuelling, they are not impacted by daily electricity
price peaks. Depending on future electricity generation capability, the feasibility of
HFC buses may comparatively improve from a cost perspective.
Disadvantages HFC is significantly more expensive than other technologies. Technological
improvements and mass production may be required before HFC technology is
considered to be a viable alternative to other low-emission based bus technology.
Infrastructure is required to install appropriate refueling stations.
If hydrogen fuel is sourced using depletable resources, HFC buses may not be as
environmentally friendly as purported.
Deployment The largest international fleet of HFC buses that has been run is in Whistler, British
Columbia. The fleet of 20 buses has been used since 2010, including at the 2010
Olympic Winter Games. Since the Games, the HFC buses have been used in the
Whistler Transit system, representing almost 90 percent of the total fleet. In 2013, the
decision was made to replace the buses with diesel buses as the cost of running and
maintaining the buses was considered to be too high.
Other countries that have trialed or are using HFC buses include China, the US, Brazil,
the UK, Japan and Australia.42
42 BC Transit. Hydrogen Fuel Cell Buses. Retrieved from www.bctransit.com

PwC Page 30
6. Core economic evaluation
Introduction
Having considered the need for investment and strategic considerations, the economic assessment evaluates the
different options available to Greater Wellington. The aim of the economic evaluation is to outline the
quantitative and qualitative costs and benefits of each option considered for Wellington’s bus fleet renewal.
The approach to the economic evaluation has been to quantify benefits and costs where possible. Any
quantification has been done on a conservative basis and needs to be considered in conjunction with any wider,
non-quantifiable benefits or costs associated with each option. The assessment of options also needs to consider
the risks associated with each option such as potential cost overruns.
Core economic evaluation
The core economic evaluation involves calculating the costs and benefits of each option in line with the New
Zealand Transport Agency’s Economic Evaluation Manual (EEM). Benefits that have been included in the
evaluation relate to those that may be realised from time savings and from emission reductions. The capital and
operating costs associated with each option have also been estimated.
Noise benefits have not been included in the core economic evaluation as the NZ Transport Agency’s EEM noise
values were not envisioned to apply across a whole network. Noise impacts were trialled in the evaluation but
resulted in disproportionately high benefits for all options relative to the time and environmental savings. The
result of removing noise is that the benefits of all “do something” options are currently under-valued, although
the relative differences between the options are unlikely to be substantially impacted. Information available on
noise benefits is included in the wider economic evaluation, including a case study on the Golden Mile.
The quantified benefits and costs for each option have been summarised in comparison to the ‘baseline’ option
where the current bus fleet is maintained. Benefit cost ratios (BCRs) have been summarised and are included in
Appendix A.
As some options provide benefits at a cost saving relative to the baseline, net benefits (in dollar terms) are
considered to be a more meaningful metric for option comparison than BCR calculations. A more detailed
description of the methodology and inputs used for the economic evaluation are respectively included in
Appendix B and Appendix C.
Wider economic evaluation
The wider economic evaluation involves consideration of factors that are not directly accounted for in the NZ
Transport Agency’s EEM. Some wider considerations that should be factored into the bus renewal decision
include network flexibility, bus emission standards, noise and visual pollution, and cost risks. These factors
have been summarised and discussed in relation to the proposed bus renewal options in the next section of the
report.
Current fleet and fleet removal profile
Wellington’s current fleet includes a combination of trolleys and diesel buses. Trolleys make up approximately
20% of the total fleet, with the remainder of the fleet being of mixed age and mixed Euro standard diesel buses
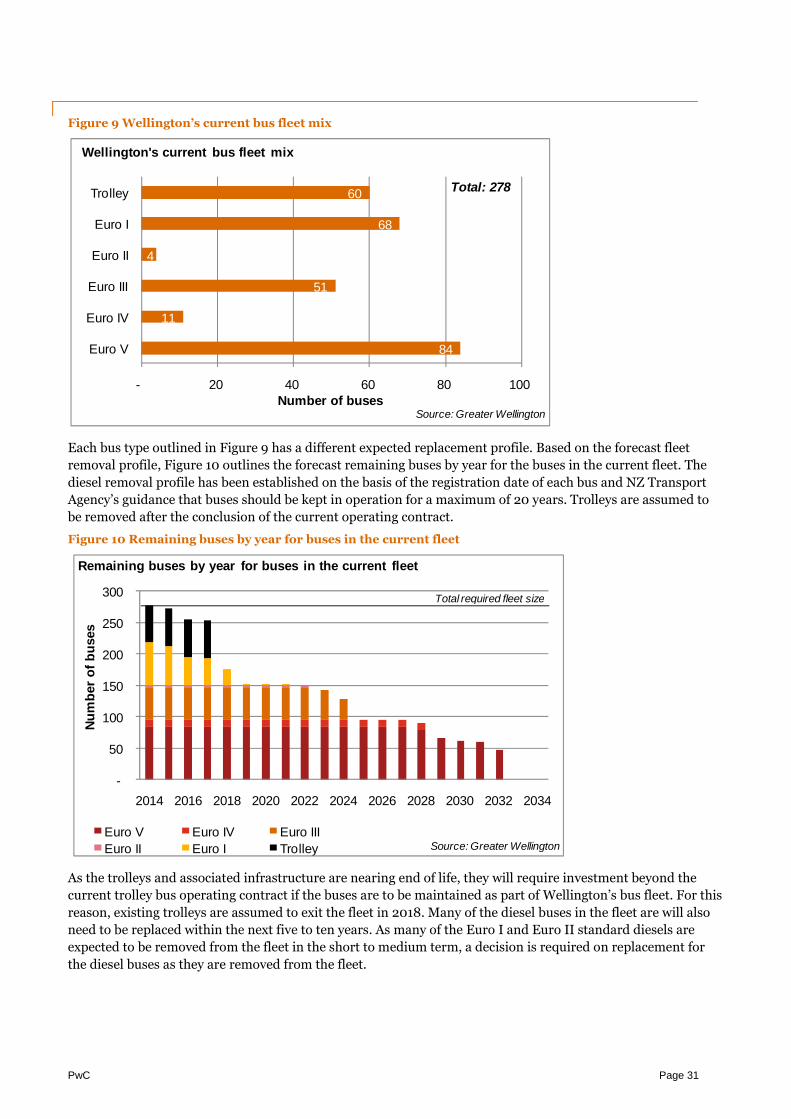
(standards I to V). Figure 9 summarises Wellington’s current fleet mix by bus type and by Euro standard.
PwC Page 31
Figure 9 Wellington’s current bus fleet mix
Each bus type outlined in Figure 9 has a different expected replacement profile. Based on the forecast fleet
removal profile, Figure 10 outlines the forecast remaining buses by year for the buses in the current fleet. The
diesel removal profile has been established on the basis of the registration date of each bus and NZ Transport
Agency’s guidance that buses should be kept in operation for a maximum of 20 years. Trolleys are assumed to
be removed after the conclusion of the current operating contract.
Figure 10 Remaining buses by year for buses in the current fleet
As the trolleys and associated infrastructure are nearing end of life, they will require investment beyond the
current trolley bus operating contract if the buses are to be maintained as part of Wellington’s bus fleet. For this
reason, existing trolleys are assumed to exit the fleet in 2018. Many of the diesel buses in the fleet are will also
need to be replaced within the next five to ten years. As many of the Euro I and Euro II standard diesels are
expected to be removed from the fleet in the short to medium term, a decision is required on replacement for
the diesel buses as they are removed from the fleet.
84
11
51
4
68
60
- 20 40 60 80 100
Euro V
Euro IV
Euro III
Euro II
Euro I
Trolley
Number of buses
Wellington's current bus fleet mix
Source: Greater Wellington
Total: 278
-
50
100
150
200
250
300
2014 2016 2018 2020 2022 2024 2026 2028 2030 2032 2034
Nu
mb
er
of
bu
ses
Euro V Euro IV Euro III
Euro II Euro I Trolley
Remaining buses by year for buses in the current fleet
Source: Greater Wellington
Total required fleet size
PwC Page 32
Buses that are removed from the fleet during the forecast period will need to be replaced in order to maintain a
full sized fleet.43 Although there is not an urgent requirement to confirm a diesel replacement strategy
(compared to trolleys), the conclusion of the trolley bus operating contract provides a timely opportunity for
Greater Wellington to confirm its strategy for fleet wide replacement options.
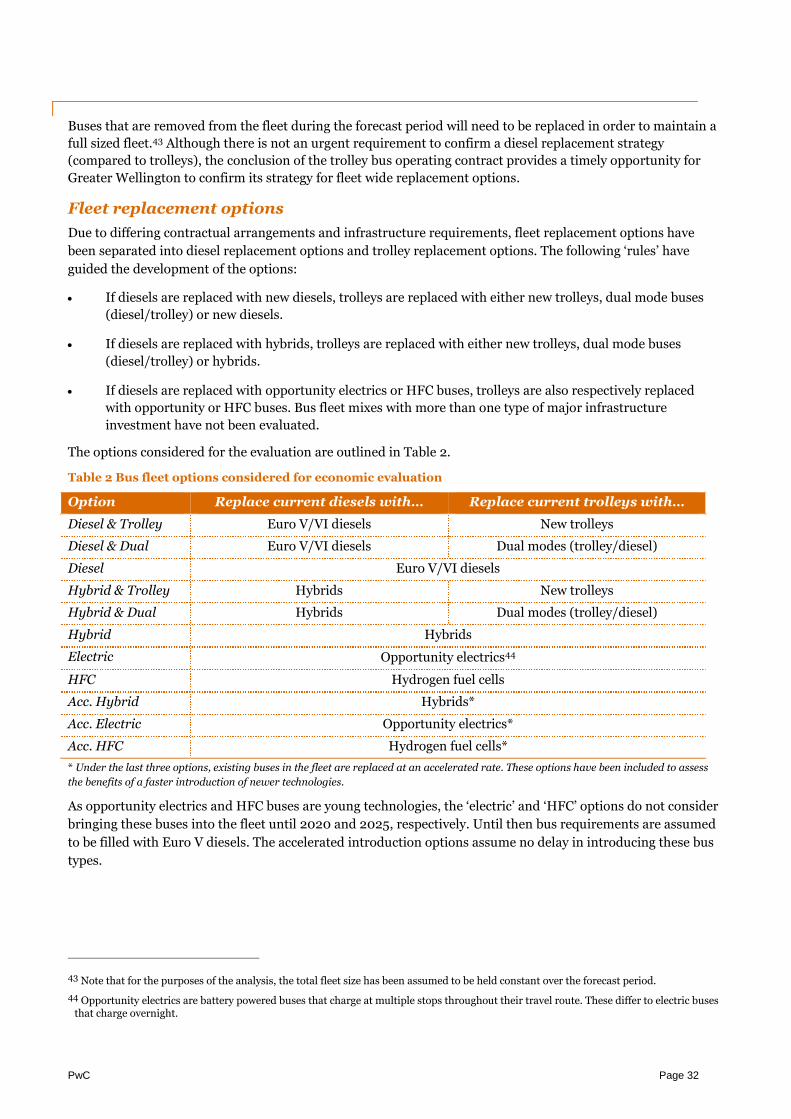
Fleet replacement options
Due to differing contractual arrangements and infrastructure requirements, fleet replacement options have
been separated into diesel replacement options and trolley replacement options. The following ‘rules’ have
guided the development of the options:
If diesels are replaced with new diesels, trolleys are replaced with either new trolleys, dual mode buses
(diesel/trolley) or new diesels.
If diesels are replaced with hybrids, trolleys are replaced with either new trolleys, dual mode buses
(diesel/trolley) or hybrids.
If diesels are replaced with opportunity electrics or HFC buses, trolleys are also respectively replaced
with opportunity or HFC buses. Bus fleet mixes with more than one type of major infrastructure
investment have not been evaluated.
The options considered for the evaluation are outlined in Table 2.
Table 2 Bus fleet options considered for economic evaluation
Option Replace current diesels with… Replace current trolleys with…
Diesel & Trolley Euro V/VI diesels New trolleys
Diesel & Dual Euro V/VI diesels Dual modes (trolley/diesel)
Diesel Euro V/VI diesels
Hybrid & Trolley Hybrids New trolleys
Hybrid & Dual Hybrids Dual modes (trolley/diesel)
Hybrid Hybrids
Electric Opportunity electrics44
HFC Hydrogen fuel cells
Acc. Hybrid Hybrids*
Acc. Electric Opportunity electrics*
Acc. HFC Hydrogen fuel cells*
* Under the last three options, existing buses in the fleet are replaced at an accelerated rate. These options have been included to assess
the benefits of a faster introduction of newer technologies.
As opportunity electrics and HFC buses are young technologies, the ‘electric’ and ‘HFC’ options do not consider
bringing these buses into the fleet until 2020 and 2025, respectively. Until then bus requirements are assumed
to be filled with Euro V diesels. The accelerated introduction options assume no delay in introducing these bus
types.
43 Note that for the purposes of the analysis, the total fleet size has been assumed to be held constant over the forecast period.
44 Opportunity electrics are battery powered buses that charge at multiple stops throughout their travel route. These differ to electric busesthat charge overnight.

PwC Page 33
Benefits relative to the baseline
The benefits associated with different bus fleet combinations have been estimated relative to the baseline option
where the current fleet mix is maintained (along with any associated infrastructure investment). These benefits
relate to time savings and emission reductions that may be realised as a result of moving away from the current
bus fleet mix.
Time savings – Wellington’s current bus network incurs time delays as a result of running trolley bus
services. Delays result from trolleys de-poling from the overhead wiring, network overloads, and from
trolleys being unable to pass other trolleys due to wiring inflexibility. Replacing trolleys with different
technologies is likely to result in time savings which can be quantified using the EEM.
Using information provided by Greater Wellington, savings have been estimated based on historical
trolley bus delays recorded on the Karori to Lyall bay route using Real Time Information45. For the
purposes of the analysis it has been assumed that savings are the same across all other bus technologies
(including new trolleys46).
Environmental emission savings – Diesel buses produce harmful emissions as a result of burning fuel
during bus operations. The evaluation has quantified the impact of any carbon dioxide (CO2), particulate
matter (PM10) and nitrous oxide (NOx) emission reductions that result from changing the bus fleet mix.
Carbon monoxide (CO) and hydrocarbon (HC) emissions have also been calculated but have not been
able to be monetised.47 Estimates have been calculated using bus efficiency information, diesel emission
information and forecasts of emissions resulting from New Zealand’s electricity generation.
The emissions savings realised from electric bus implementation are reliant on the clean-sourcing of
electricity. Non-renewable energy generation will result in emissions being produced at the energy
source, at least partially offsetting the benefits that can be gained at the street level. Wellington
Electricity Lines Limited have indicated that as the trolleys’ peak operations occur when electricity
demand is high, peaking plants may be in operation, meaning that a proportion of the electricity used is
generated using gas fired sources. For the purposes of the analysis, it has been assumed that the
electricity used is from mixed renewable sources.
Benefits results
The estimated benefits of each option relative to the baseline option are summarised in Figure 11. The largest
benefits across all options are associated with time savings. Local emission benefits are relatively similar across
the options compared to the baseline. This is because all options provide large reductions in emissions
compared to the ageing diesels in the existing fleet.
45 Real Time Information is information on when buses are due based on actual location (using GPS vehicle tracking) rather than scehduledtimes.
46 Note that this approach results in a probable over-estimation of the benefits of new trolleys relative to other non-network options,because while newer trolleys will be able to travel faster than older trolleys, there are still de-poling and passing risks (albeit reduced).
47 The total localised and CO2 emissions by volume are summarised in Section 7.
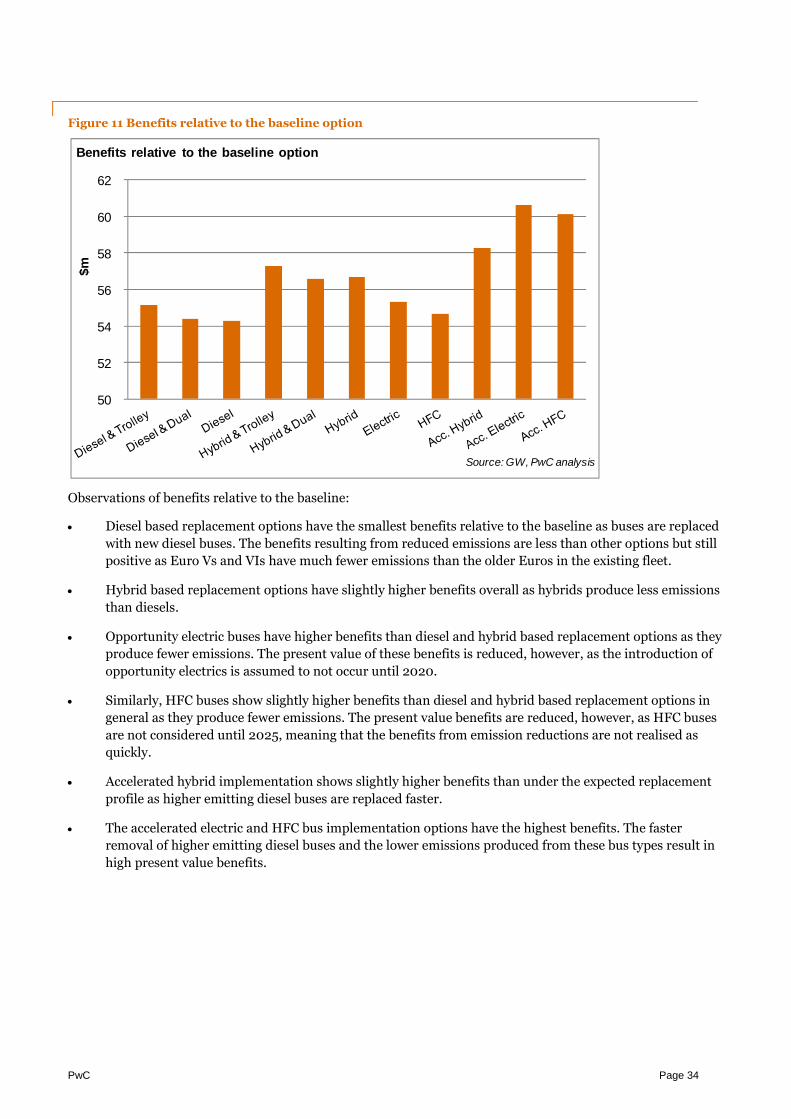
PwC Page 34
Figure 11 Benefits relative to the baseline option
Observations of benefits relative to the baseline:
Diesel based replacement options have the smallest benefits relative to the baseline as buses are replaced
with new diesel buses. The benefits resulting from reduced emissions are less than other options but still
positive as Euro Vs and VIs have much fewer emissions than the older Euros in the existing fleet.
Hybrid based replacement options have slightly higher benefits overall as hybrids produce less emissions
than diesels.
Opportunity electric buses have higher benefits than diesel and hybrid based replacement options as they
produce fewer emissions. The present value of these benefits is reduced, however, as the introduction of
opportunity electrics is assumed to not occur until 2020.
Similarly, HFC buses show slightly higher benefits than diesel and hybrid based replacement options in
general as they produce fewer emissions. The present value benefits are reduced, however, as HFC buses
are not considered until 2025, meaning that the benefits from emission reductions are not realised as
quickly.
Accelerated hybrid implementation shows slightly higher benefits than under the expected replacement
profile as higher emitting diesel buses are replaced faster.
The accelerated electric and HFC bus implementation options have the highest benefits. The faster
removal of higher emitting diesel buses and the lower emissions produced from these bus types result in
high present value benefits.
50
52
54
56
58
60
62
$m
Benefits relative to the baseline option
Source: GW, PwC analysis
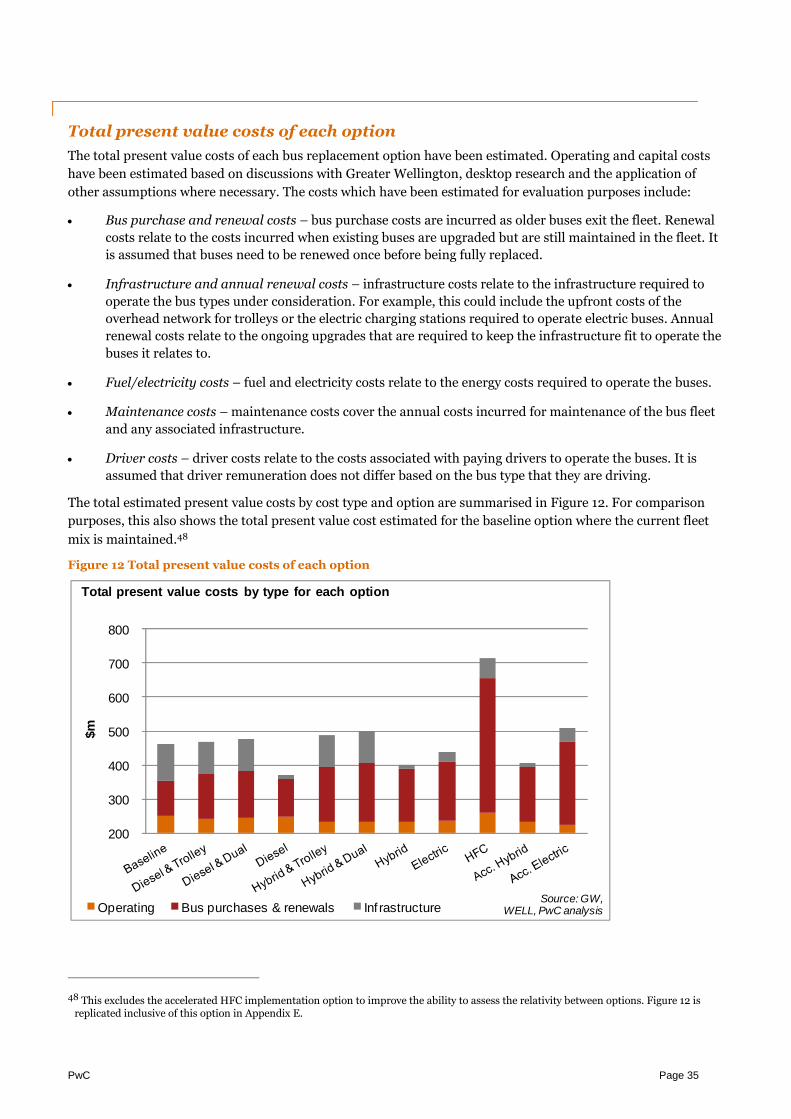
PwC Page 35
Total present value costs of each option
The total present value costs of each bus replacement option have been estimated. Operating and capital costs
have been estimated based on discussions with Greater Wellington, desktop research and the application of
other assumptions where necessary. The costs which have been estimated for evaluation purposes include:
Bus purchase and renewal costs – bus purchase costs are incurred as older buses exit the fleet. Renewal
costs relate to the costs incurred when existing buses are upgraded but are still maintained in the fleet. It
is assumed that buses need to be renewed once before being fully replaced.
Infrastructure and annual renewal costs – infrastructure costs relate to the infrastructure required to
operate the bus types under consideration. For example, this could include the upfront costs of the
overhead network for trolleys or the electric charging stations required to operate electric buses. Annual
renewal costs relate to the ongoing upgrades that are required to keep the infrastructure fit to operate the
buses it relates to.
Fuel/electricity costs – fuel and electricity costs relate to the energy costs required to operate the buses.
Maintenance costs – maintenance costs cover the annual costs incurred for maintenance of the bus fleet
and any associated infrastructure.
Driver costs – driver costs relate to the costs associated with paying drivers to operate the buses. It is
assumed that driver remuneration does not differ based on the bus type that they are driving.
The total estimated present value costs by cost type and option are summarised in Figure 12. For comparison
purposes, this also shows the total present value cost estimated for the baseline option where the current fleet
mix is maintained.48
Figure 12 Total present value costs of each option
48 This excludes the accelerated HFC implementation option to improve the ability to assess the relativity between options. Figure 12 isreplicated inclusive of this option in Appendix E.
200
300
400
500
600
700
800
$m
Operating Bus purchases & renewals Inf rastructure
Total present value costs by type for each option
Source: GW,WELL, PwC analysis
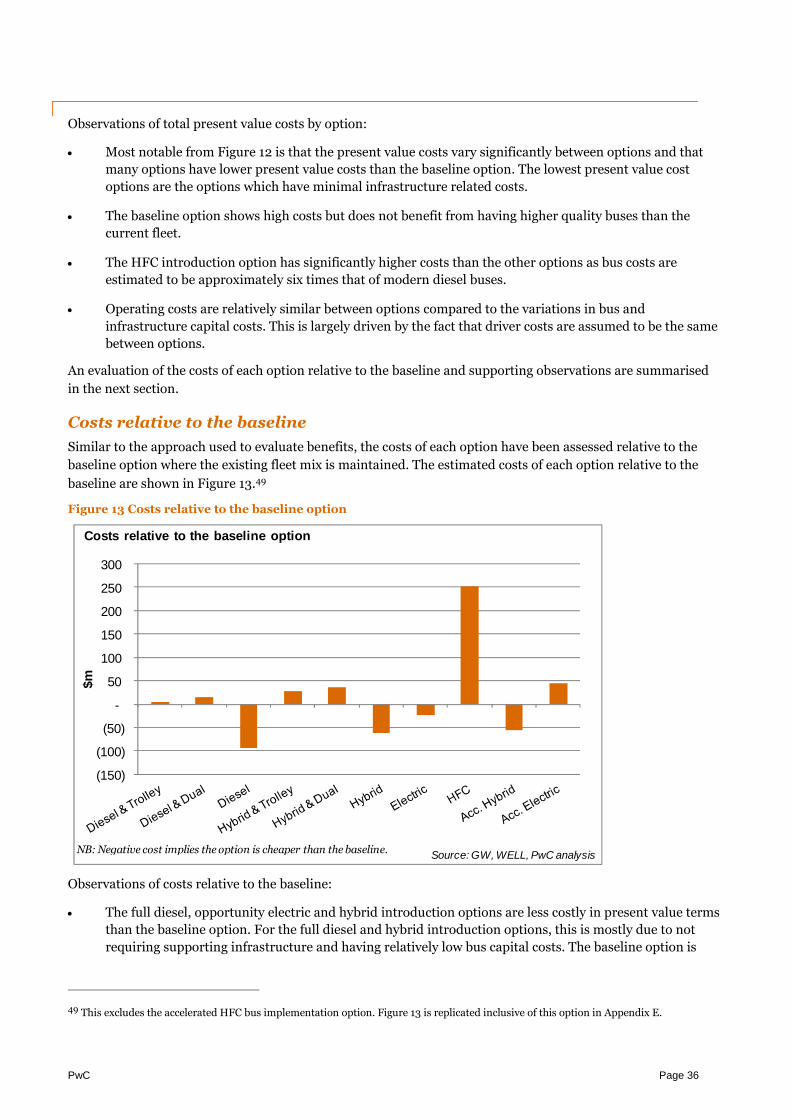
PwC Page 36
Observations of total present value costs by option:
Most notable from Figure 12 is that the present value costs vary significantly between options and that
many options have lower present value costs than the baseline option. The lowest present value cost
options are the options which have minimal infrastructure related costs.
The baseline option shows high costs but does not benefit from having higher quality buses than the
current fleet.
The HFC introduction option has significantly higher costs than the other options as bus costs are
estimated to be approximately six times that of modern diesel buses.
Operating costs are relatively similar between options compared to the variations in bus and
infrastructure capital costs. This is largely driven by the fact that driver costs are assumed to be the same
between options.
An evaluation of the costs of each option relative to the baseline and supporting observations are summarised
in the next section.
Costs relative to the baseline
Similar to the approach used to evaluate benefits, the costs of each option have been assessed relative to the
baseline option where the existing fleet mix is maintained. The estimated costs of each option relative to the
baseline are shown in Figure 13.49
Figure 13 Costs relative to the baseline option
Observations of costs relative to the baseline:
The full diesel, opportunity electric and hybrid introduction options are less costly in present value terms
than the baseline option. For the full diesel and hybrid introduction options, this is mostly due to not
requiring supporting infrastructure and having relatively low bus capital costs. The baseline option is
49 This excludes the accelerated HFC bus implementation option. Figure 13 is replicated inclusive of this option in Appendix E.
(150)
(100)
(50)
-
50
100
150
200
250
300
$m
Costs relative to the baseline option
Source: GW, WELL, PwC analysisNB: Negative cost implies the option is cheaper than the baseline.

PwC Page 37
estimated to be more expensive than these options even though the standards of buses in the fleet do not
differ to what they are now. This is because the baseline option requires large infrastructure investment.
The delayed electric bus introduction reduces the present value of bus purchase and infrastructure costs.
The costs associated with opportunity electrics are subject to considerable uncertainty, reflecting that
they are an emerging technology
The new trolley and dual bus implementation options are more expensive than the baseline. This is
mainly due to overhead infrastructure estimates being $70m compared to the equivalent baseline
estimate of $52m.
HFC introduction is much more expensive than the baseline as both the buses and the supporting
infrastructure is expensive. Similar to electric buses, as HFC buses are an emerging technology, there is
large cost uncertainly associated with this option.
The accelerated hybrid option is slightly more expensive in present value terms than under the forecast
replacement profile as the buses are brought into service sooner. The accelerated option is still less
expensive than the baseline.
Accelerated opportunity electric implementation is more expensive than the baseline as the entire fleet is
replaced with electric buses. The earlier introduction increases the present value costs of this option.
Net benefits relative to the baseline
The net benefits of each option relative to the baseline option are summarised in Figure 14. Based on net benefit
calculations, most evaluated options produce benefits greater than costs relative to the baseline. Options that
provide benefits while also having associated cost savings represent the options with the greatest positive net
benefits.50
Figure 14 Benefits net of costs relative to the baseline option
50 This excludes the accelerated HFC introduction option. Figure 14 is replicated with the inclusion of this option in Appendix E.
(300)
(200)
(100)
-
100
200
$m
Benefits net of costs relative to the baseline option
Source: GW, WELL, PwC analysis
Positive net benefits
Negative net benefits

PwC Page 38
Observations of benefits net of costs relative to the baseline:
Full diesel and hybrid replacement options show the largest positive net benefits, followed by opportunity
electric implementation. This is mainly attributable to having benefits associated with each option while
also being cheaper than the baseline option.
The diesel and trolley, diesel and dual, hybrid and trolley and accelerated opportunity electric options
also return positive net benefits. The relative benefits associated with each of these options exceed the
relative costs of each option.
The HFC option has significantly negative net benefits. The extra capital expenditure required for HFC
buses does not support sufficient extra benefits to return positive net benefits.

PwC Page 39
7. Wider economic evaluation
Not all of the costs and benefits associated with the different fleet options can be quantified. This section
highlights other factors that should be considered when evaluating different options for the composition of
Wellington’s bus fleet. These factors include wider emission information, noise impacts, network flexibility,
visual pollution and cost over-run risks.
Emission volumes and monetisable value
As outlined in section 6, monetary values have been placed on CO2, PM10 and NOx emissions, but it has not been
possible to put values on CO and HC emissions for benefit calculation purposes. The following analysis aims to
capture these emission impacts by looking at estimated emissions by volume.
It is important to note that a higher volume of emissions of one type does not necessarily mean the cost placed
on these is greater than a lesser volume of another emission type. For example, CO2 emission volumes for diesel
volumes far exceed PM10 emission volumes. However, as PM10 emissions have larger direct health
consequences on a per tonne basis, the per tonne cost of these emissions is greater.
The next three sections outline the improvements that have been made to emissions standards and the total
estimated volumes of localised and CO2 emissions under the evaluated options.
Localised emissions and standards by diesel bus type
Europe introduced heavy-duty vehicle localised emission standards in 1988. The ‘Euro’ standards that are
currently used for buses were established in 1992 and relate to the emissions of CO, HC, PM10 and NOx. In New
Zealand, these standards provide guidance for which standard diesel buses would be best to include in public
transport fleets from an environmental perspective. The standards have been tightened every few years since
1992 for the expected maximum emissions.51
Table 3 outlines the current Euro standards and the years that these standards were introduced.
Table 3 Current Euro standards and years introduced
The tightening of emission allowances between each Euro standard is significant. The total maximum emissions
to qualify as Euro VI standard represent only about 12% of the total emissions that would be expected from a
Euro I standard bus. Figure 15 shows the maximum total emissions per kilometre by Euro standard.
51 Transport Policy. (2014). EU: Heavy-duty: Emissions. Retrieved from www.transportpolicy.net
Euro standard introduction
Standard Y ear introduced
Euro I 1992
Euro II 1996
Euro III 2000
Euro IV 2005
Euro V 2008
Euro VI 2013

PwC Page 40
Figure 15 Total emissions per kilometre by Euro standard
Figure 15 highlights the consistent reduction of maximum emission expectations as new Euro standards have
been introduced. A further breakdown of Euro standards by emission type are provided in Figure 16. This
summarises Euro standards by NOX, PM10, CO and HC emissions.
Figure 16 Total emissions by NOX, PM, CO2 and HC
0
10
20
30
40
50
60
Euro I Euro II Euro III Euro IV Euro V Euro VI
To
tal
em
issio
ns
(g/k
m)
Total emissions per kilometre by Euro standard
Source: Dieselnet, PwC analysis
0
3
6
9
12
15
18
21
Euro I Euro II Euro III Euro IV Euro V Euro VI
CO
em
issio
ns
(g/k
m)
CO emissions per kilometre by Euro standard
Source: Dieselnet, PwC analysis
0.0
1.0
2.0
3.0
4.0
5.0
Euro I Euro II Euro III Euro IV Euro V Euro VI
HC
em
issio
ns
(g/k
m)
HC emissions per kilometre by Euro standard
Source: Dieselnet, PwC analysis
0
5
10
15
20
25
30
35
Euro I Euro II Euro III Euro IV Euro V Euro VI
NO
Xem
issio
ns
(g/k
m)
NOX emissions per kilometre by Euro standard
Source: Dieselnet, PwC analysis
0.0
0.2
0.4
0.6
0.8
1.0
1.2
1.4
1.6
Euro I Euro II Euro III Euro IV Euro V Euro VI
PM
em
issio
ns
(g/k
m)
PM emissions per kilometre by Euro standard
Source: Dieselnet, PwC analysis

PwC Page 41
Figure 16 highlights significant tightening of Euro standards with respect to emissions. Reductions are
particularly noteworthy for NOx and PM10. Euro VI allowances for these emissions represent only 4% and 2%
respectively for these emission types compared to Euro I standards.
Localised emission forecasts by bus type
The mixture of Euro standard diesels in the current fleet means that emission reduction benefits could be
realised if existing diesels are replaced with newer diesels or other bus types. Figure 17 shows the total
estimated localised emissions by option over the forecast period and the reduction in emissions relative to the
baseline. These emissions are compared to the baseline.
Figure 17 Total localised emissions by option and comparison to baseline
Observations of total localised emissions relative to the baseline:
The improvements in Euro standards mean that significant environmental benefits could be realised
from simply upgrading the older diesel buses in the fleet with new Euro V or VI standard buses.
Emission reductions are the greatest under the accelerated opportunity electric and HFC bus
introduction options.
The potential emission reductions are greater as the number of diesel buses in the fleet falls. If reductions
are made at an accelerated rate, emission reductions can subsequently be realised more quickly.
Hybrid bus options show greater reductions in localised emissions than the options that include the
purchase of new diesels. This is mostly because hybrids are assumed to have the underlying emission
standards of Euro VI buses. Euro VIs show considerable improvements over Euro Vs for NOx and HC
reductions.
CO2 forecasts by bus type
CO2 is a common by-product of vehicle operations and electricity generation. Increased CO2 emissions resulting
from human activity have been widely attributed to global warming. The replacement option chosen for
Wellington’s bus fleet will impact the amount of CO2 emitted as a result of bus operations. CO2 emissions by
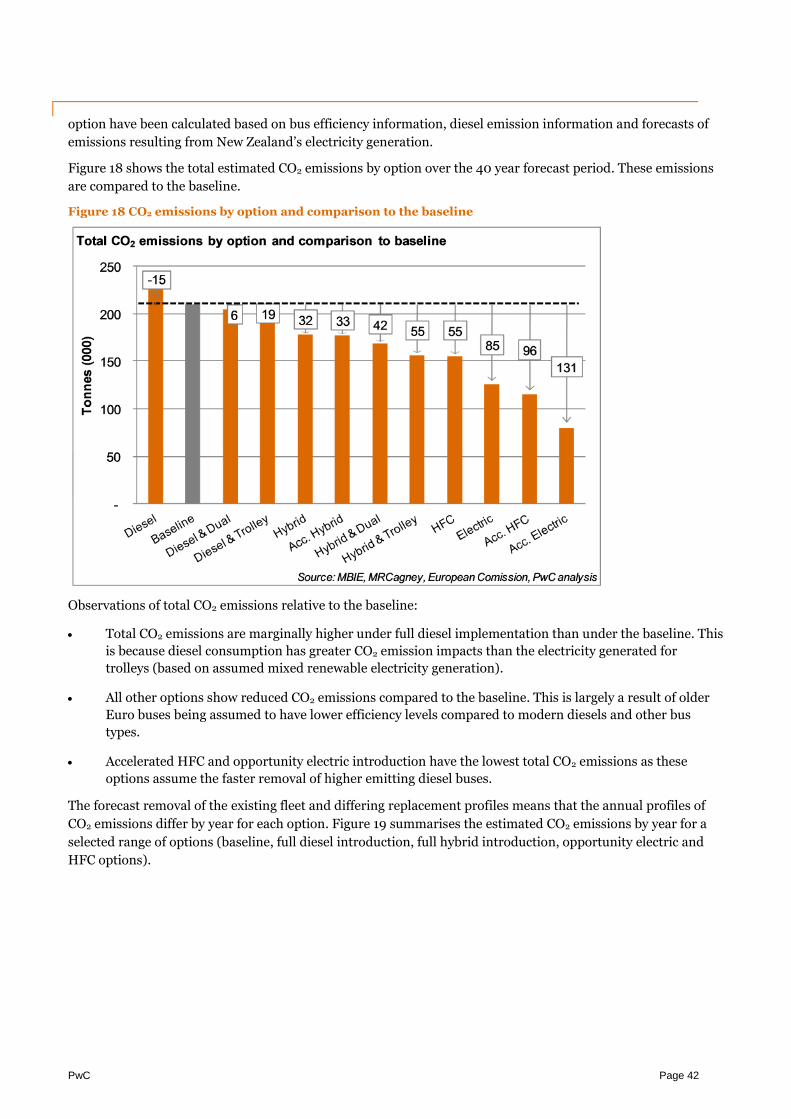
PwC Page 42
option have been calculated based on bus efficiency information, diesel emission information and forecasts of
emissions resulting from New Zealand’s electricity generation.
Figure 18 shows the total estimated CO2 emissions by option over the 40 year forecast period. These emissions
are compared to the baseline.
Figure 18 CO2 emissions by option and comparison to the baseline
Observations of total CO2 emissions relative to the baseline:
Total CO2 emissions are marginally higher under full diesel implementation than under the baseline. This
is because diesel consumption has greater CO2 emission impacts than the electricity generated for
trolleys (based on assumed mixed renewable electricity generation).
All other options show reduced CO2 emissions compared to the baseline. This is largely a result of older
Euro buses being assumed to have lower efficiency levels compared to modern diesels and other bus
types.
Accelerated HFC and opportunity electric introduction have the lowest total CO2 emissions as these
options assume the faster removal of higher emitting diesel buses.
The forecast removal of the existing fleet and differing replacement profiles means that the annual profiles of
CO2 emissions differ by year for each option. Figure 19 summarises the estimated CO2 emissions by year for a
selected range of options (baseline, full diesel introduction, full hybrid introduction, opportunity electric and
HFC options).

PwC Page 43
Figure 19 CO2 emissions by year for a selected range of options
Observations of total annual CO2 emissions relative to the baseline:
The full diesel, opportunity electric and HFC options show a rise in CO2 emissions in 2018 as trolleys are
replaced with diesels.
CO2 emissions then fall under the opportunity electric and HFC options as new buses are included in the
fleet. Electric buses have lower emissions due to the lower estimated energy requirements of these buses.
Emissions under the full hybrid option steadily fall in line with the replacement profile of existing diesels.
The full diesel option shows greater annual emissions compared to the baseline as trolleys are replaced
with diesel buses.
-
1
2
3
4
5
6
7
2015 2020 2025 2030 2035 2040 2045 2050
To
nn
es
(000)
Baseline Diesel Hybrid
Electric HFC
CO2 emissions by year for a range of selected options
Source: MBIE, MRCagney,European Commission, PwC analysis

PwC Page 44
Noise impacts
An advantage of running alternative technology buses (such as trolleys or electrics) is the reduced noise impacts
in built up areas. Electric engines run with lower noise impacts than diesel engines, meaning that operating
electric buses can minimise noise impacts at a street level. Benefits are greater in urban areas due to the greater
number of stops required and subsequent increases in acceleration and gear changes. The built-up nature of
central city streets also means that noise does not disperse as it would in more open areas, instead reflecting off
buildings and other structures.
Detailed information on the relative noise emissions of each bus type evaluated was not readily available for
quantification purposes. Some indicative information was available on the noise range of different bus types
and is summarised in Figure 20.
Figure 20 Noise range by bus type
The indicative values in Figure 20 highlight that diesel buses have a higher range for noise emissions than other
bus technologies. Hybrid buses have the second highest noise emission range because they have a diesel engine
(as well as an electric engine). Trolleys, electrics and HFC buses have similar noise ranges, which are lower than
diesel and hybrid alternatives.
Local impacts of bus noise: case study of the Golden Mile
In order to understand the broader effects of different fleet compositions on local amenity and quality of life, we
have conducted an indicative case study of localised noise impacts on Wellington’s central bus spine – Lambton
Quay, Willis Street, Manners Mall, and Courtenay Place.
In addition to being one of the busiest bus corridors in Wellington – with over 100 buses running along it
during the peak hour – the case study area represents the densest areas of residential population and
employment in Wellington. Consequently, it is likely that noise impacts in this study area will account for a
moderate proportion of the overall impacts in Wellington City.
This is a limited case study rather than a full economic evaluation of the noise impacts of Wellington City’s bus
fleet. As a result, we have estimated indicative annual impacts, rather than whole-of-life impacts, for a more
limited set of fleet composition options.
We compare noise outcomes under four broad fleet mixes (as defined in Table 1) :
The baseline, which includes 60 trolleys and 218 diesels of varying age and quality.
50
55
60
65
70
75
80
Diesel Trolleybus Hybrid Electric HFC
Decib
el
Minimum noise output
Maximum noise outputSource: NZ Bus, GW, PwC analysis
Noise range by bus type

PwC Page 45
An all-diesel fleet configuration starting in 2018.
The ‘electric’ option, which entails the introduction of electric buses starting in 2022. By 2030, the year
for which we conducted noise modelling for this option, Wellington’s bus fleet would include 90 battery
electric buses and 188 diesel buses.
The ‘hybrid’ option, which entails the introduction of hybrid buses starting in 2015. By 2030 (the year for
which noise modelling has been conducted), Wellington’s bus fleet would include 216 hybrid buses and
62 diesel buses.
Figure 21 summarises the results of the analysis for these four options. Changes to the fleet mix are likely to
have a moderate impact on noise levels in the study area. Similar results were found for relative noise increases
when using high-end bus noise estimates as when using lower-end estimates. However, we emphasise that
actual outcomes may vary due to finer-grained factors such as differences in noise across the bus speed change
cycle.
Figure 21 Comparison of estimated average daily noise levels on Lambton Quay
This indicative analysis of noise levels suggests that the replacement of trolleys by diesels would increase
average noise levels on the Golden Mile by an estimated 19% to 25% (equivalent to a 0.8 to 1.0 decibel
increase). The EEM approach to valuing noise impacts suggests that this may have a moderate economic impact
on local retailers and residences – equivalent to an annual disbenefit in the range of $300 per affected property.
It would also have a moderate impact on pedestrian amenity in the study area.
By contrast, the electric bus option would lead to a modest reduction in noise levels on the Golden Mile by
2030, reducing bus noise by an estimated 4% to 11% (equivalent to a 0.2 to 0.5 decibel reduction). This is due to
this option including quieter electric buses in the longer term. However, it is likely to have some short-term
disbenefits in the period between removal of trolley buses in 2018 and introduction of significant numbers of
electric buses in the mid-2020s. In the long term, this could lead to annual benefits of $100 or more per
affected property.
The modelling suggests that the introduction of hybrids would have a considerably more uncertain impact on
bus noise on the Golden Mile. This is due to hybrids, which would eventually comprise the majority of the fleet
under this option, being relatively quiet when stopped or when running on stored battery power, but being
comparable to diesel buses when running their diesel engines. The results suggest that a more detailed
modelling approach would be required in order to fully understand the impact of this option.
66.6 67.466.3 66.7
78.4 79.478.1
75.4
55
60
65
70
75
80
85
Baseline Diesel Electric Hybrid
LA
eq
(decib
els
)
Comparison of estimated average noise levels (LAeq)Lambton Quay, south end
Min Max
PwC Page 46
Cost risks
A risk that needs to be accounted for in the fleet renewal evaluation is the risk of cost over-runs. This risk is
greater if the decision is made to replace existing buses with emerging bus technologies such as electric or HFC
buses. As these bus types are not currently implemented on a significantly large scale world-wide, establishing
cost estimates for these bus types is more difficult and is subject to greater risk.
This risk may also be relevant if buses are replaced with new trolleys. The falling international use of trolleys
may result in increased maintenance and operating costs associated with running the buses. These risks will
need to be accounted for when more detailed analysis is undertaken on potential bus fleet costs.
Network flexibility
Options for Wellington’s future public transport system will be impacted by which bus types are chosen to
replace buses as they leave the fleet. Trolleys, opportunity electrics and HFCs will have reduced flexibility to
system changes compared to diesel and hybrid buses as these bus types require supporting infrastructure.
As outlined earlier, the fleet mix should consider the BRT option chosen as part of the Spine Study. If trolleys
are to be maintained and used on any different future network, any costs associated with extending overhead
infrastructure will need to be estimated. Similarly for HFC and opportunity electric buses, consideration will
need to be given to how much of the network the buses will be designed to cover and where subsequent
charging and fuelling stations are positioned.
Visual pollution
One of the trade-offs of using trolleys is the subsequent negative visual impact. The electricity that is required to
run the trolleys is delivered through a complex system of overhead wiring. This “visual pollution” is unique to
trolleys and is often cited as a reason to remove trolleys from operations.
The visual impacts of overhead wiring would be avoided with the introduction of any other bus type considered
in the evaluation.
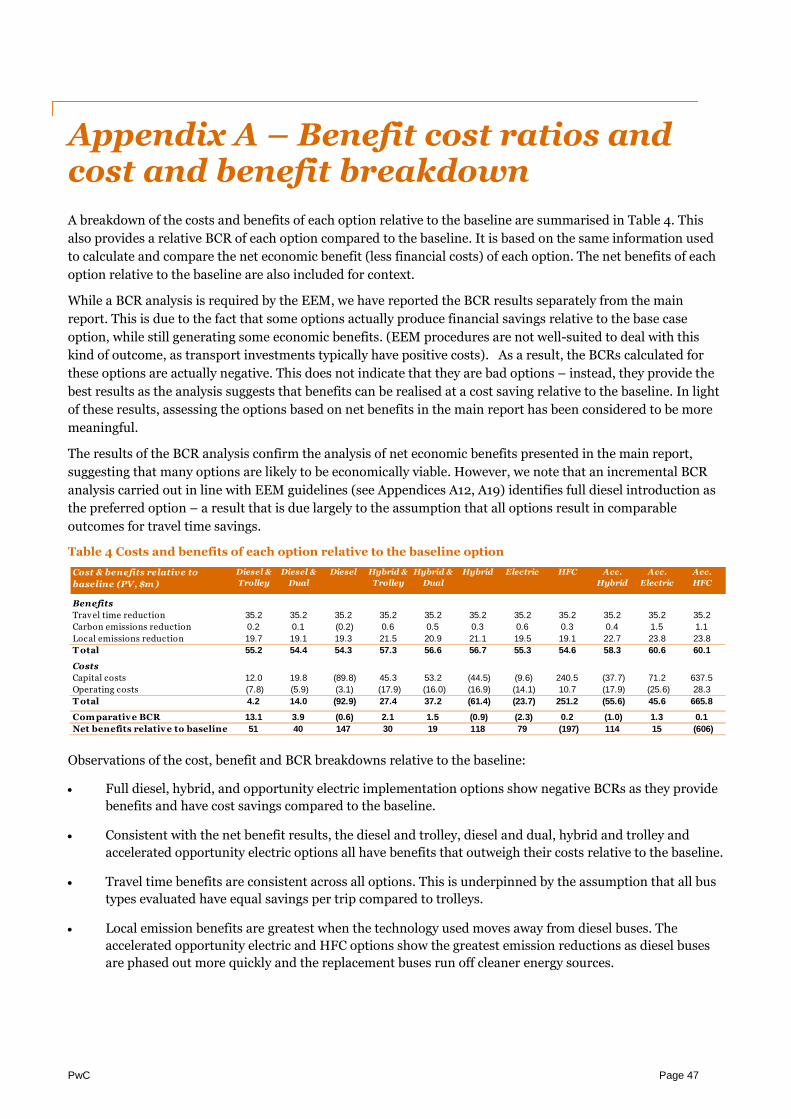
PwC Page 47
Appendix A – Benefit cost ratios andcost and benefit breakdown
A breakdown of the costs and benefits of each option relative to the baseline are summarised in Table 4. This
also provides a relative BCR of each option compared to the baseline. It is based on the same information used
to calculate and compare the net economic benefit (less financial costs) of each option. The net benefits of each
option relative to the baseline are also included for context.
While a BCR analysis is required by the EEM, we have reported the BCR results separately from the main
report. This is due to the fact that some options actually produce financial savings relative to the base case
option, while still generating some economic benefits. (EEM procedures are not well-suited to deal with this
kind of outcome, as transport investments typically have positive costs). As a result, the BCRs calculated for
these options are actually negative. This does not indicate that they are bad options – instead, they provide the
best results as the analysis suggests that benefits can be realised at a cost saving relative to the baseline. In light
of these results, assessing the options based on net benefits in the main report has been considered to be more
meaningful.
The results of the BCR analysis confirm the analysis of net economic benefits presented in the main report,
suggesting that many options are likely to be economically viable. However, we note that an incremental BCR
analysis carried out in line with EEM guidelines (see Appendices A12, A19) identifies full diesel introduction as
the preferred option – a result that is due largely to the assumption that all options result in comparable
outcomes for travel time savings.
Table 4 Costs and benefits of each option relative to the baseline option
Observations of the cost, benefit and BCR breakdowns relative to the baseline:
Full diesel, hybrid, and opportunity electric implementation options show negative BCRs as they provide
benefits and have cost savings compared to the baseline.
Consistent with the net benefit results, the diesel and trolley, diesel and dual, hybrid and trolley and
accelerated opportunity electric options all have benefits that outweigh their costs relative to the baseline.
Travel time benefits are consistent across all options. This is underpinned by the assumption that all bus
types evaluated have equal savings per trip compared to trolleys.
Local emission benefits are greatest when the technology used moves away from diesel buses. The
accelerated opportunity electric and HFC options show the greatest emission reductions as diesel buses
are phased out more quickly and the replacement buses run off cleaner energy sources.
Cost & benefits relative to
baseline (PV, $m )
Diesel &
Trolley
Diesel &
Dual
Diesel Hybrid &
Trolley
Hybrid &
Dual
Hybrid Electric HFC Acc.
Hybrid
Acc.
Electric
Acc.
HFC
Benefits
Trav el time reduction 35.2 35.2 35.2 35.2 35.2 35.2 35.2 35.2 35.2 35.2 35.2
Carbon emissions reduction 0.2 0.1 (0.2) 0.6 0.5 0.3 0.6 0.3 0.4 1.5 1.1
Local emissions reduction 19.7 19.1 19.3 21.5 20.9 21.1 19.5 19.1 22.7 23.8 23.8
T otal 55.2 54.4 54.3 57.3 56.6 56.7 55.3 54.6 58.3 60.6 60.1
Costs
Capital costs 12.0 19.8 (89.8) 45.3 53.2 (44.5) (9.6) 240.5 (37.7) 71.2 637.5
Operating costs (7.8) (5.9) (3.1) (17.9) (16.0) (16.9) (14.1) 10.7 (17.9) (25.6) 28.3
T otal 4.2 14.0 (92.9) 27.4 37.2 (61.4) (23.7) 251.2 (55.6) 45.6 665.8
Com parative BCR 13.1 3.9 (0.6) 2.1 1.5 (0.9) (2.3) 0.2 (1.0) 1.3 0.1
Net benefits relative to baseline 51 40 147 30 19 118 79 (197) 114 15 (606)

PwC Page 48
Appendix B – Methodology
Overview
The approach to the economic evaluation has been informed using NZ Transport Agency’s Economic Evaluation
Manual and focuses on whole-of-fleet outcomes. The evaluation has been based on high-level composition
options and bus network requirements such as service kilometres and service hours. The aim of the evaluation
has been to estimate the benefits that could be gained from a wide range of options and to assess the capital and
operating costs required to realise these benefits.
Inputs for the economic evaluation have been sourced from a combination of discussions with Greater
Wellington, publically available research and publications, and from the application of assumptions where
required. Inputs and any assumptions have been tested with Greater Wellington to confirm their level of
appropriateness.
The modelling has been undertaken in two phases – fleet composition modelling and fleet operations
modelling. The fleet composition modelling focused on assessing the options that were available for
Wellington’s future bus fleet. This model was used to calculate the bus and infrastructure capital costs relating
to the options.52 The fleet operations modelling focused on assessing the operational impacts of the different
bus fleet from a cost, emission and time savings perspective.
A summary of the modelling structure, inputs, outputs and interdependencies are summarised in Figure 22.
Figure 22 Economic modelling structure
52 Infrastructure maintenance costs would not necessarily be classified as capital costs, however these costs have been included asinfrastructure capital costs so clearer comparisons can be made between infrastructure reliant options, and options without infrastructurerequirements.
Fleet composition model Fleet operations model
• Current and projected fleet size.
• Forecast fleet run-down profile.
• Expected lifespan of buses andinfrastructure.
• Cost to purchase/renew buses andinfrastructure.
• Data on bus fuel efficiency/energy use.
• Bus emissions standards and emissioninformation.
• Forecasts of fuel/energy prices andelectricity generation mix.
• Driver and maintenance costs.
• Total service-km, service-hrs.
• Time delays by bus type.
• Scenarios for future bus fleet composition.
• Forecast annual capital costs overevaluation period, including:
• Bus purchases.
• Bus renewals.
• Infrastructure developments.
• Infrastructure maintenance andrenewals.
• Annual emissions from bus fleet.
• Annual time savings from bus fleet.
• Forecast annual bus operating costs overthe evaluation period, including:
• Fuel/electricity costs.
• Driver costs.
• Maintenance costs.
Compositionscenarios
Model inputs
Outputs for scenarios

PwC Page 49
More detailed descriptions of the models are outlined in the following sections.
Fleet composition modelling
The fleet composition modelling was used to analyse Wellington’s bus fleet based on information on the current
and expected future size of the fleet, the fleet removal profile, and the types of buses that may be considered for
bus replacement. Due to differing contractual arrangements and ongoing requirements, bus replacement has
been considered separately for diesel buses and trolleys. The costs which have been included as part of the fleet
composition modelling includes:
Bus purchase and renewal costs – bus purchase costs relate to repurchases of buses as older buses exit
the fleet. Renewal costs relate to the costs incurred when existing buses are upgraded but are still
maintained in the fleet. It is assumed that buses need to be renewed once between repurchases.
Infrastructure purchase and annual renewal costs – infrastructure costs relate to the infrastructure
required to operate the bus types under consideration. For example, this could include the upfront costs
of the overhead network for trolleys or the electric charging stations required to operate electric buses.
Annual renewal costs relate to the ongoing upgrades that are required to keep the infrastructure fit to
operate the buses it relates to.
The modelling incorporates a ‘baseline’ case in which Wellington would maintain its existing fleet mix,
replacing the buses with similar quality buses as they exit the fleet.
Fleet operations modelling
The fleet operations modelling forecasts the operational outcomes of different fleet compositions. Estimated
operating costs include driver costs, maintenance costs and fuel costs. Other quantified operational impacts
include CO2 emissions, localised emissions and relative differences in user travel times. The following formula
summarises the calculations that have been used to quantify operational outcomes:
� � � � � � � � � � � � � � � � � � =∑ � � × � �∑ � �
× � �
Where:
i = Type of bus
Ni = Number of buses, by type
Ui = Per-unit outcome measure (e.g. CO2 emitted per kilometre, passenger delay per trip)
ST = Total volume of service (e.g. total service-kilometres, total passenger trips on network)
Adapting an EEM approach to fleet operations modelling
The fleet-wide modelling approach has required the identification of broad differences in economic
performance between different bus types. NZ Transport Agency’s EEM has been used to establish procedures
for the economic evaluation of different factors. These are summarised in Table 5.
Table 5 Approach to calculating operating impacts using the EEM
Category Approach
CO2 emission reductions CO2 emissions have been calculated based on bus efficiency
information, diesel emission information and forecasts of
emissions resulting from New Zealand’s electricity
generation. The EEM’s value of $40 per tonne has been used
to monetise the cost of emission.
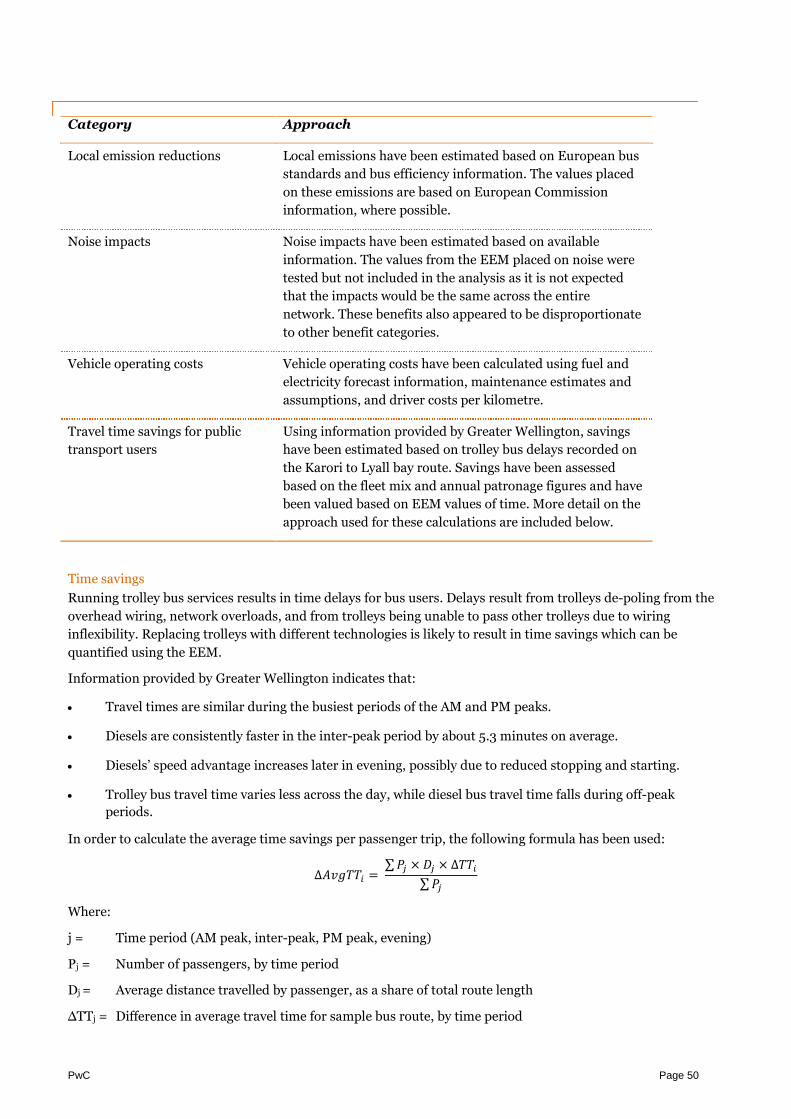
PwC Page 50
Category Approach
Local emission reductions Local emissions have been estimated based on European bus
standards and bus efficiency information. The values placed
on these emissions are based on European Commission
information, where possible.
Noise impacts Noise impacts have been estimated based on available
information. The values from the EEM placed on noise were
tested but not included in the analysis as it is not expected
that the impacts would be the same across the entire
network. These benefits also appeared to be disproportionate
to other benefit categories.
Vehicle operating costs Vehicle operating costs have been calculated using fuel and
electricity forecast information, maintenance estimates and
assumptions, and driver costs per kilometre.
Travel time savings for public
transport users
Using information provided by Greater Wellington, savings
have been estimated based on trolley bus delays recorded on
the Karori to Lyall bay route. Savings have been assessed
based on the fleet mix and annual patronage figures and have
been valued based on EEM values of time. More detail on the
approach used for these calculations are included below.
Time savings
Running trolley bus services results in time delays for bus users. Delays result from trolleys de-poling from the
overhead wiring, network overloads, and from trolleys being unable to pass other trolleys due to wiring
inflexibility. Replacing trolleys with different technologies is likely to result in time savings which can be
quantified using the EEM.
Information provided by Greater Wellington indicates that:
Travel times are similar during the busiest periods of the AM and PM peaks.
Diesels are consistently faster in the inter-peak period by about 5.3 minutes on average.
Diesels’ speed advantage increases later in evening, possibly due to reduced stopping and starting.
Trolley bus travel time varies less across the day, while diesel bus travel time falls during off-peak
periods.
In order to calculate the average time savings per passenger trip, the following formula has been used:
∆ � � � � � � =∑ � � × � � × ∆ � � �
∑ � �
Where:
j = Time period (AM peak, inter-peak, PM peak, evening)
Pj = Number of passengers, by time period
Dj = Average distance travelled by passenger, as a share of total route length
∆TTj = Difference in average travel time for sample bus route, by time period

PwC Page 51
Once the estimated differences in per-trip travel times have been calculated based on the above formula, these
values have been used to calculate the total annual travel time benefit associated with each fleet mix. In order to
do so, the following formula has been used:
� � � � � � � � � � � � � � � � � � =∑ � � × ∆ � � � � � �
∑ � �× � � × � � �
Where:
i = Type of bus
Ni = Number of buses, by type (from fleet composition modelling)
∆AvgTTi = Difference in average travel time per trip compared to a baseline, by bus type
PT = Total annual passenger trips on the network
VoT = Weighted average value of time for bus users across all time periods and trip purposes (based on
standard EEM factors)
For the purposes of the analysis, savings have been estimated based on trolley bus delays recorded on the
Karori to Lyall bay route. It has been assumed that savings are the same across all other bus technologies
(including new trolleys). This may slightly understate outcomes for some alternative technologies, as there is
some evidence that electric buses and more modern trolley buses deployed in other cities accelerate and brake
faster than diesel buses. However, data was not available to robustly quantify any additional time advantage for
alternative technologies.

PwC Page 52
Appendix C – Key inputs andassumptions
Information for the economic evaluation has been sourced from a combination of discussions with Greater
Wellington, publically available research and publications, and from the application of assumptions where
required. Inputs and any assumptions have been tested with Greater Wellington to confirm the level of
appropriateness. This appendix sets out the key inputs and assumptions that have been used in the analysis.
These have been separated into inputs and assumptions for benefits, capital expenditure and operating
expenditure.
Benefits
Time savings
Real time journey data for the Lyall Bay to Karori (3) route, collected in 2013 by Greater Wellington, has
been used to estimate differences in travel times for trolleys and diesels. Data on time taken for diesels
and trolleys to complete the 15.2 km route has been grouped by time period as shown in Figure 23.
Figure 23 Analysis of average bus travel times on the Lyall Bay to Karori route
This data was aggregated by time of day as shown in Table 6.
Table 6 Difference in travel time by bus type and time period
0
10
20
30
40
50
60
Av
era
ge
trip
len
gth
(min
)
Time of day (30 min intervals)
Average trolleybus time Average diesel bus time Source: GW, PwC analysis
Lyall Bay to Karori (3): Average trip times by bus type and time of day
Karori to Lyall Bay (3): Difference in travel tim e by tim e period
Tim e period Hours
Added mins per trip % slower than diesel
AM peak 7 am-8am 241 5.57 11%
8am-9am 267 3.81 7 %
Interpeak 9am-4pm 3,215 5.29 10%
PM peak 4pm-5pm 512 1.66 3%
5pm-6pm 441 4.21 8%
Evening 6pm-10:30pm 7 56 9.95 22%
Source: GW, Pw C analysis
Num ber of
buses m easured
Trolley travel tim e relative to diesel

PwC Page 53
After completing an analysis of travel time differences for trolleys and diesel buses, data from Greater
Wellington on (a) the percent of total region-wide trips taken within each time period and (b) the average
distance of trips taken at different times of day was used to estimate the delay that the average trolley bus
passenger could expect to experience in each time period. These inputs and calculations are summarised
in Table 7.
Table 7 Analysis of average delay per passenger, by time period
Finally, EEM values were used to estimate the cost of delay to bus passengers, by time period. These
figures are summarised in Table 8.
Table 8 EEM values for public transport user value of time, by time period
CO2 emissions
CO2 emissions by option have been calculated based on bus efficiency information, diesel emission
information and forecasts of emissions resulting from New Zealand’s electricity generation.
Efficiency
Efficiency by bus type is summarised in Table 9.
Table 9 Efficiency by bus type
Where possible, bus efficiency levels have been assumed to be the same as in MRCagney’s report
Powering Public Transport in New Zealand (2012) which sets out estimated efficiency per vehicle of
Tim e period Hours % of total trips
by period
Average trip
distance
(km )
Trip distance as
% of Karori-
Lyall Bay route
Avg delay per
trolley on Karori-
Lyall Bay (m in)
Avg delay per
passenger
(m in)
AM peak 7 am-8am 8% 5.5 36% 5.57 2.01
AM peak 8am-9am 11% 5.5 36% 3.81 1.37
Interpeak 9am-4pm 44% 4.8 31% 5.29 1.65
PM peak 4pm-5pm 9% 5.5 36% 1.66 0.60
PM peak 5pm-6pm 12% 5.5 36% 4.21 1.52
Evening 6pm-10:30pm 15% 4.8 31% 9.95 3.10
Average across all tim e periods 5.04 33% 1.7 6
Weighted average PT value of tim e, by tim e period
Tim e period VoT (July 2013 $/hr)
AM peak 12.66
Interpeak 16.91
PM peak 12.41
Evening 12.10
Source: EEM tables A4.1(a), A2.4, A12.3
Bus type Efficiency (MJ / 100km )
Current trolley 7 15
Euro I 1 ,440
Euro II 1 ,380
Euro III 1 ,320
Euro IV 1,260
Euro V 1,200
Euro VI 1 ,140
Dual mode (trolley /diesel) 843
Hy drogen fuel cell 1 ,200
New trolley 650
Hy brid 840
Opportunity electric 540

PwC Page 54
diesels, hybrids, electrics and trolleys. Based on the date of the report, the diesel efficiency has assumed
to be that relating to Euro V standard diesels. Electric buses have been taken to be opportunity electrics.
Current trolleys are assumed to be 10% less efficient than new trolleys.
Each Euro diesel bus lower than Euro V is assumed to be approximately 5% less efficient than the next
standard. For example, Euro IVs are assumed to be 5% less efficient than Euro Vs.
Dual mode buses are assumed to be on overhead wiring for 65% of journeys. Efficiency levels are
assumed to be a weighted proportion of new trolley efficiency and Euro V diesel efficiency.
HFCs are assumed to be as efficient as Euro V diesels.
Emissions
Diesel emissions (kg/CO2) per MJ are taken to be 0.07325 as per European Commission information.
Emissions from electricity generation are based on mixed renewable energy emissions as per Ministry of
Business, Innovation and Employment’s forecasts.
Local emissions
Local emissions have been estimated based on European bus standards and bus efficiency information.
The values placed on these emissions have been based on European Commission information, where
possible.
Localised emissions (g/km) by bus are summarised in Table 10.
Table 10 Localised emissions by bus and emission type
Where possible, localised emissions have been summarised based on Euro standards. This applies to
diesel buses from Euro standards I – VI.
Trolleys (current and new), HFCs, and opportunity electrics are assumed to have no localised emissions.
Dual modes are assumed to have emissions equivalent to Euro Vs for the time that they are not
connected to overhead wiring (assumed to be 35%).
Hybrids are assumed to have emissions per kWh similar to Euro VI diesels. Emissions have been scaled
down based on the efficiency of hybrid buses.
Monetary values have been placed on PM10 and NOx emissions, but CO and HC emissions have been
unable to be monetised for benefit calculation purposes.
Localised em issions by bus and em ission type (g/km )
Bus type CO HC NO X PM 10
Current trolley - - - -
Euro I 18.00 4.40 32.00 1.44
Euro II 15.33 4.22 26.83 0.58
Euro III 7 .7 0 2.42 18.33 0.37
Euro IV 5.25 1.61 12.25 0.07
Euro V 5.00 1.53 6.67 0.07
Euro VI 4.7 5 0.41 1 .27 0.03
Dual mode (trolley /diesel) 1 .7 5 0.54 2.33 0.02
Hy drogen fuel cell - - - -
New trolley - - - -
Hy brid 3.50 0.30 0.93 0.02
Opportunity electric - - - -

PwC Page 55
The value placed on PM10 and NOx emissions is approximately $362,000 and $10,400 per tonne,
respectively. These values are based on ARUP’s methodology report on the sustainability benefits
valuation for the Auckland City Rail Link.53
Capital expenditure
Capital expenditure has been split into bus related capital expenditure and infrastructure related capital
expenditure.
Bus fleet removal profile
As per NZ Transport Agency’s current fleet emissions policy, diesel buses are assumed to be kept for a
maximum period of 20 years. Greater Wellington’s information on the registration dates of buses in the
fleet has been used to generate a fleet run-out profile.
Under the accelerated bus removal profile, forecast bus removals by Euro standard (based on the
removal approach above) are doubled in each year.
Bus purchase costs
The bus purchase costs used in the evaluation are summarised in Table 11.
Table 11 Bus purchase costs by bus type
Where possible, bus purchase costs have been assumed to be the same as in MRCagney’s report
Powering Public Transport in New Zealand (2012). This sets out estimated capital costs per vehicle for
diesels, hybrids, electrics and trolleys. Based on the date of the report, the diesel cost has been assumed
to be that relating to a Euro V standard diesel. Electric buses have been assumed to be opportunity
electrics.
Current trolleys are assumed to be 25% cheaper than new trolleys.
Each Euro diesel bus lower than Euro V is assumed to be approximately 5% cheaper than the next
standard. For example, Euro IVs are assumed to be 5% cheaper than Euro Vs.
Euro VI diesels are assumed to be 10% more expensive than Euro Vs.
Dual mode buses are assumed to 15% more expensive than new trolleys.
HFC costs have been estimated based on Whistler’s HFC bus costs.
53 ARUP, Auckland Transport. (2013). Auckland City Rail Link Sustainability Benefits Valuation Methodology Development.
Bus type Capital cost ($000)
Current trolley 525
Euro I 320
Euro II 340
Euro III 360
Euro IV 380
Euro V 400
Euro VI 440
Dual mode (trolley /diesel) 805
Hy drogen fuel cell 2,7 7 1
New trolley 7 00
Hy brid 600
Opportunity electric 900

PwC Page 56
Bus renewal costs
Bus renewals are assumed to be required 10 years after the purchase of each bus type. This is half the
maximum time that buses are advised to be kept based on NZ Transport Agency’s current fleet emissions
policy.
Bus renewal costs are assumed to be 30% of the bus purchase cost for all bus types.
Up front infrastructure purchase costs
Up front infrastructure purchase costs are unique to all options except for full diesel and hybrid
introduction options. These costs relate to the up-front infrastructure costs required to support the
introduction of specific bus types.
The baseline has an up-front purchase cost of approximately $52m based on Wellington Electricity Lines
Limited estimates on the required upgrades to the existing network.
The diesel and trolley, diesel and dual, hybrid and trolley, and hybrid and dual options have estimated
up-front purchase costs of approximately $70m based on conversations with Greater Wellington.
The opportunity electric options have up-front purchase costs of approximately $13m based on desktop
research. Due to the relative infancy of opportunity electric buses, information was not widely available
on these costs.
The HFC options have up-front costs of approximately $50m based on desktop research. As per
opportunity electrics, information was not widely available on these costs.
Infrastructure annual renewal costs
Annual renewal costs for existing trolleys are assumed to be the same as the average annual renewal costs
from the last five years as provided by Greater Wellington.
Annual renewal costs for new trolleys are assumed to be half of the annual renewal costs from the last
five years as provided by Greater Wellington.
Annual renewal costs for HFC buses are assumed to be 2% of the up-front capital cost of HFC
infrastructure.
Annual renewal costs for opportunity electrics are assumed to be 4% of the up-front capital cost of
opportunity electric infrastructure.
Infrastructure annual maintenance costs
Annual maintenance costs for existing trolleys are assumed to be the same as the average annual
maintenance costs from the last five years as provided by Greater Wellington.
Annual maintenance costs for new trolleys are assumed to be half of the annual maintenance costs from
the last five years as provided by Greater Wellington.
Annual maintenance costs for HFC buses are assumed to be 3% of the up-front capital cost of HFC
infrastructure.
Annual maintenance costs for opportunity electrics are assumed to be 4% of the up-front capital cost of
opportunity electric infrastructure.

PwC Page 57
Operating expenditure
Fuel/electricity costs
Fuel/electricity costs have been estimated using Ministry of Business, Innovation and Employment
commercial forecasts and retail growth estimates.
The fleet mixes, efficiency of buses (as per Table 9) and total network kilometres (approximately 6.4m
kilometres) have been used to estimate total costs by option.
Maintenance costs
Per kilometre maintenance costs by bus type are summarised in Table 12.
Table 12 Maintenance costs per kilometre by bus type
Diesel costs have been estimated based on Canadian information on diesel maintenance costs per
kilometre. This has been assumed to be that of Euro V standard diesels.
Maintenance costs for each Euro standard bus are assumed to be approximately 2% less than the next
standard. For example, Euro IV maintenance costs per kilometre are assumed to be 2% higher than for
Euro Vs.
Current trolleys are assumed to have the same maintenance costs as Euro Vs. This is based on
conversations with Greater Wellington that maintenance costs for diesels and trolleys are broadly
similar.
Dual modes are assumed to have a weighted average per kilometre cost of Euro Vs and trolleys based on
the time that they spend attached to the overhead network (assumed to be 65%).
HFCs maintenance costs are based on information available on the Whistler fleet in Canada.
New trolleys, hybrids and opportunity electrics are assumed to have maintenance costs per kilometre
10% lower than Euro Vs.
Driver costs
Driver costs have been assumed to be $22.50 per hour based on MRCagney’s report Powering Public
Transport in New Zealand (2012). This has been assumed to be the same across all bus types.
These driver costs have been multiplied by the total service hours (approximately 330,000) of the
network to get total driver costs per annum.
Bus type Maintenance cost per km ($)
Current trolley 0.7 5
Euro I 0.81
Euro II 0.80
Euro III 0.7 8
Euro IV 0.7 7
Euro V 0.7 5
Euro VI 0.7 4
Dual mode (trolley /diesel) 0.7 0
Hy drogen fuel cell 1 .16
New trolley 0.68
Hy brid 0.68
Opportunity electric 0.68

PwC Page 58
Appendix D – Background to modelling
Defining the Golden Mile study area
The study area is summarised in Figure 24. It comprises four roads totalling approximately 2.1 kilometres that
run through the Wellington city centre and serve as a central artery for bus traffic: Lambton Quay, Willis Street,
Manners Street, and Courtenay Place.
As a result of its density and large volume of both bus traffic and pedestrian movements, this corridor is likely
to experience the largest impact from any change that results in an increased (or decreased) mix of noisier bus
types such as diesel buses.
Figure 24 Golden Mile study area
The Golden Mile has Wellington’s densest concentrations of both residential populations and employment.
Table 13 summarises some key data on the study area, which is enclosed by two Census area units.54 The study
area contains between 240 and 511 full-time equivalent employees per hectare and between 57 and 71 residents
per hectare.
To put it another way, the two area units enclosing the study area contain only 0.7% of Wellington City’s total
land area, but approximately 6.8% of its population and 53.1% of its employment. This is highlighted in Table
13.
54 The Lambton area unit covers Lambton Quay and parts of Willis Street, but also extends east to the waterfront and south to Abel SmithStreet. The Willis Street-Cambridge Terrace covers most of the Aro Flats – roughly speaking, the area bounded by Willis Street to the east,the waterfront to the north, Cambridge and Kent Terraces to the east, and Webb Street to the south.

PwC Page 59
Table 13 Population and employment in and around the study area (proportion of Wellington city)
A strong mix of residential and work uses supports Wellington’s busiest retail precincts55 and a high level of
pedestrian activity on the street. A 2010 study of pedestrian traffic on the Golden Mile counted around 36,000
pedestrian movements for the average weekday hour, peaking at over 43,000 pedestrians on Fridays.56
Pedestrian flows on Manners Mall, prior to its return to bus operations in 2010, were also reasonably high: a
2009 study counted almost 13,000 pedestrian movements during the daytime hours.57
The high level of street-level activity in the study area means that bus noise is likely to have an effect on a large
number of people. Increased (or decreased) bus noise on the Golden Mile will be highly noticeable – it will
affect Wellingtonians’ experience shopping on the street, talking with acquaintances, or having lunch outside of
their offices.
Bus movements on the Golden Mile
In order to develop an indicative estimate of bus noise levels throughout the day, it is necessary to develop a
detailed picture of daily bus movements through the study area. Data has been sourced on daily bus movements
throughout the day from GTFSExplorer, a tool developed by transport planning consultancy MRCagney to
analyse and visually represent data from public transport feeds.58
This data has been used to calculate the total (northbound and southbound) bus movements at four points
throughout the study area:
Lambton Quay, north end (near Bowen Street)
Lambton Quay, south end (near Kirkcaldie and Stains)
Willis Street
Courtenay Place (near the east end).
Table 14 summarises estimated average and maximum headways at these monitoring points.59 This data
indicates that the average headway across the entire period is less than one minute, indicating that bus
frequencies are consistently high on the Golden Mile. The maximum interval of time between two buses varies
between 4.4 minutes and 7.0 minutes, due to lower bus frequencies during the evening.
55 See Bayleys Research (2013), Wellington Retail Report for a discussion of recent trends and prices in the retail market. Prime retail onLambton Quay attracts rental prices up to ten times as high as those observed in Lower Hutt or Porirua, and over twice as high as priceson Courtenay Place.
56 Cited in GHD (2012), Pedestrian Crash Reduction Study: Wellington CBD Golden Mile, report to Wellington City Council.
57 Wellington City Council (2010), Pedestrian Effects of Restoring the Golden Mile. Retrieved from www.wellington.govt.nz
58 GTFSExplorer is available, in prototype form, at www.gtfs-explorer.net
59 “Headway” refers to the interval of time between bus arrivals. For example, a headway of 5 minutes means that a bus will arrive everyfive minutes.
Census area unit Area
(ha)
Usually
resident
population
Occupied
dwellings
Full-tim e
equivalent
em ployees
Business
units
57 3000 Lambton 0.3% 2.9% 2.8% 35.6% 17 .2%
57 3101 Willis Street-Cambridge Terrace 0.4% 3.8% 4.6% 17 .5% 12.8%
T otal 0.7 % 6.8% 7 .4% 53.1% 30.0%
Source: Statistics NZ, Pw C Regional Indus try Database

PwC Page 60
Table 14 Average and maximum headways in study area
Figure 25 summarises daily bus movements near the southern end of Lambton Quay, where overall bus
volumes were highest based on the public transport feed data. The chart breaks bus movements down into five-
minute intervals between 6am (when buses begin running) and midnight (when most bus services cease). It
also breaks out bus movements for the trolley bus-capable routes and the diesel-only routes60.
Bus volumes on Lambton Quay rise to their highest levels during the AM and PM peak – with some five minute
periods having 25 to 30 scheduled bus movements. Volumes remain large during the interpeak, when 10 to 15
buses are usually scheduled for each 5 minute period (these bus counts include both northbound and
southbound buses). Outcomes at other monitoring points are similar, with high peaks and large bus volumes
within the interpeak period.
Figure 25 Daily bus movements on Lambton Quay, by time of day
In practical terms, this data suggests that:
It is common for multiple buses to be travelling together through during the peak period. This means that
somebody standing on Lambton Quay could expect to hear noise from two, three, or even four buses at
the same time. This is exacerbated by the fact that buses tend to platoon along the Golden Mile due to the
lack of space to pass at stops
Consistent bus volumes throughout the interpeak period mean that it is common to hear noise from at
least one bus during most of the day. During the interpeak period, the next bus is seldom more than 30
seconds away, on average.
60 In doing so, we note that diesel buses are used to provide peak service on trolley bus routes, meaning that trolley buses will not accountfor all bus movements on these lines.
Monitoring point Average headway
(m in)
Maxim um
headway (m in)
Lambton Quay , north end 0.9 6.9
Lambton Quay , south end 0.6 4.4
Willis St 0.6 5.4
Courtenay Place 0.8 7 .0
Source: MRCagney, GTFSExplorer
0
5
10
15
20
25
30
35
6:0
06:4
07:2
08:0
08:4
09:2
010:0
010:4
011:2
012:0
012:4
013:2
014:0
014:4
015:2
016:0
016:4
017:2
018:0
018:4
019:2
020:0
020:4
021:2
022:0
022:4
023:2
0Bu
ses
per
five
min
ute
inte
rval
Total daily scheduled bus movements, by time of dayLambton Quay, south end
Total trolleybus lines Total diesel only Source: MRCagney, GTFS Explorer

PwC Page 61
Valuing and comparing noise impacts of bus traffic
We adapted NZTA’s recommended approach to valuing noise impacts, which is summarised at a high level in
the EEM and defined in more detail on acoustics.nzta.govt.nz.61 This approach focuses on estimating the change
in average daily noise levels as a result of changes to roads or public transport operations, quantifying the
number of properties affected by the noise change, and valuing the impact based on standard factors.
Here, we discuss the underlying assumptions and inputs that have been used to estimate bus noise levels.
Approach to calculating bus noise
Noise levels are measured in decibels (db), which is a base-ten logarithmic scale. This means that a relatively
small increase in the number of decibels can correspond to a relatively large increase in total noise. A three
decibel increase corresponds to a doubling in total noise levels. Similarly, increasing noise levels from 50 db to
60 db doesn’t imply a 20% increase in noise levels - it means increasing noise levels by 900%.
Noise levels have been estimated at five-minute intervals throughout bus operating hours (6am to 12am) based
on three factors:
The estimated number of buses passing through each of the four monitoring points at that time, based on
data from MRCagney’s GTFSExplorer.
The estimated breakdown of these buses by type of bus, based on the fleet mix options.
Estimates of minimum and maximum noise by bus type.
In order to calculate on-street bus noise at a particular point in time, the following formula was used to
calculate the total noise produced by multiple sounds occurring closely together (e.g. two buses moving down
the street in a platoon):62
� � � � ( � ) = 10 ∗log(∑ 10
� �� ���
� � � )
log(10)
Where:
i = index of sound sources from 1 to k
Li = volume of sound source i, in decibels
LAeq(n) = total cumulative volume of all sources, in decibels, at time n.
In line with NZTA’s evaluation methodology for noise impacts of transport projects63, we have calculated a
measure of the average noisiness of buses on the Golden Mile over the 18-hour operating period.
This measure, called LAeq, reflects the average noise level in decibels over the period. It can be calculated from
representative noise measurements taken at regular points over the day. In order to calculate LAeq, the
following equation has been used:64
� � � � = 10 ∗log(
∑ 10� � � � (� )
� ���� � �
�)
log(10)
61 NZ Transport Agency. Transport Noise and Vibration. Retrieved from www.acoustics.nzta.govt.nz.
62 NoiseMeter Inc. Retrieved from www.noisemeters.com
63 NZ Transport Agency. Transport Noise and Vibration. Retrieved from www.acoustics.nzta.govt.nz.
64 NZ Transport Agency. Transport Noise and Vibration. Retrieved from www.acoustics.nzta.govt.nz.
PwC Page 62
Where:
n = time period for which a noise measurement or estimate has been taken, from 1 to N
N = total number of measurements taken during the day
LAeq(n) = average noise level at time period n
LAeq = average noise level during whole study period.
Approach to determining noise impact of bus movements
The GTFSExplorer data allowed total bus movements throughout the day to be estimated. This data has been
used to estimate the average number of buses audible at a particular point based on estimates of the average
speed that buses are travelling, the size of buses, and the average distance that road noise can be expected to be
audible.65
Bus movements have been broken down by bus type using the evaluated options. These options as at 2030 are
summarised in Table 15.
Table 15: Bus mix under four options considered in case study
Indicative minimum and maximum bus noise, in decibels, has been estimated using data gathered from several
sources. This data is summarised in Table 16. We note that the available data suggests that bus noise can fall in
a quite high range depending upon bus speed, road surface, and the dynamics of stopping and starting.
Consequently, the range of indicative estimates of noise levels generated using this data should be treated with
caution, as it may fail to take into account detailed factors such as speed change cycles within the study area.
Table 16 Estimated range of bus noise for different bus types
Estimating the economic benefits (or disbenefits) of changes to bus noise levels
Appendix A8.2 of the EEM surveys the available evidence on the cost of road traffic noise, finding that “there is
evidence to suggest that road traffic noise levels of 53 to 62 dbA do encourage people to move out of an area
more quickly.” As this falls within the range of estimates of average daily bus noise, it is likely that changes to
the bus fleet will have a marginal effect on property values in the study area. The EEM continues:
“A reasonable figure for New Zealand is suggested as being 1.2% of value of properties affected per dB
of noise increase. Using average values for urban property of $450,000 and occupancy of 2.9
persons, this suggests a PV [present value] cost of $5,400 per dB per property and $1,860 per dB per
resident affected ($350 per household or $120 per person per year). This figure should be applied in
65 McCallum-Clark, Hardy and Hunt. (2006). Transportation and noise: land use planning options for a quieter New Zealand. NZTAresearch report 299 suggests that road noise will be audible at 80 metres unless barriers are put in place. Other sources (eg MarylandState Highway Administration, Sound Barriers Guidelines, retrieved from www.roads.maryland.gov, suggest a lower figure of 30 to 60metres.
Baseline All diesel
(option 1C)
Electric m ix
(option 3)
Hybrid m ix
(option 2C)
Diesels 7 8% 100% 68% 22%
Trolley /electrics 22% - 32% -
Hy brids - - - 7 8%
Bus type Min (dB) Max (dB)
Diesel 65 7 7
Trolley bus 60 7 0
Hy brid 64 7 0
Electric 60 7 0
HFC 60 7 0
PwC Page 63
all areas, since there is no reason to suppose that noise is less annoying to those in areas with low
house prices.”
However, applying this calculation to the study area is complicated by two factors. First, the available data on
residential population, dwellings, employees, and business units in the study area, which we summarise above,
is not finely grained enough to support a robust analysis of the number of properties affected. Second, as the
study area is highly built up, the degree to which bus noise will affect residences and businesses on higher levels
of buildings is unclear. Noise insulation and double glazing of windows may reduce or eliminate impacts
altogether for some buildings.
Consequently, we have not completed a full economic evaluation of the whole-of-life costs of bus noise under
different fleet mixes. However, we note that it would be possible to further develop this analysis using, for
example, property title data from Land Information New Zealand or data on property values from QV or
another source.
Summary of the impact of noise
Table 17 summarises the results of the analysis, including results for all four monitoring sites based on
minimum and maximum estimates of bus noise. We note that impacts tend to be consistent between
monitoring sites – for example, an all-diesel fleet would result in a 0.8 db increase in noise levels at all four
monitoring sites, assuming minimum bus noise. This analysis suggests the following impacts:
An increase of around 0.8 to 1 db, or a 19-25% increase in noise levels, resulting from switching to an all-
diesel fleet.
A slight reduction resulting from the 2030 fleet mix envisaged under option 3 (where electric buses are
introduced) - around 4-11% reduction in noise levels relative to the current fleet.
A more ambiguous effect from switching to a predominantly hybrid fleet (option 2C) - noise levels are
likely to fluctuate more depending upon whether hybrid buses are running diesel or using electric
motors, but sometimes fall below current levels.
Once again, we emphasise that a more finely grained analysis is necessary in order to fully understand noise
impacts – this is an indicative analysis only.
Table 17 Summary of range of estimates
Figure 26 and Figure 27 compare outcomes throughout the day under three fleet mixes. These charts suggest
that differences in noise are reasonably consistent throughout the day – if an option delivers noise increases
Scenario
Min Max Min Max Min Max Min Max
Average daily noise levels (LAeq), in decibels
Baseline 65.4 7 7 .3 66.6 7 8.4 66.4 7 8.3 65.8 7 7 .7
Diesel 66.2 7 8.2 67 .4 7 9.4 67 .2 7 9.2 66.6 7 8.6
Electric 65.1 7 6.9 66.3 7 8.1 66.2 7 8.1 65.4 7 7 .1
Hybrid 65.4 7 4.1 66.7 7 5.4 66.5 7 5.2 65.8 7 4.4
Difference in LAeq (db) relative to current fleet
Diesel 0.8 0.9 0.8 1.0 0.8 0.9 0.8 0.9
Electric (0.4) (0.4) (0.3) (0.4) (0.2) (0.2) (0.4) (0.5)
Hybrid 0.0 (3.2) 0.1 (3.0) 0.1 (3.1) 0.0 (3.2)
Percentage increase in noise levels relative to current fleet
Diesel 19% 23% 20% 25% 20% 24% 19% 23%
Electric (8%) (9%) (7 %) (8%) (4%) (4%) (9%) (11%)
Hybrid 0% (52%) 2% (50%) 2% (50%) 0% (53%)
Lam bton Quay,
north end
Lam bton Quay,
south end
Willis St Courtenay Pl

PwC Page 64
during the AM peak period, it is also likely to be noisier during the interpeak period. However, noise levels may
have spikes or troughs depending upon the number and composition of bus movements at any particular time.
Figure 26 Comparison of daily bus noise under the current fleet mix and an all diesel fleet
Figure 27 Comparison of daily bus noise under the current fleet mix and an electric fleet mix
60
64
68
72
6:0
06:4
07:2
08:0
08:4
09:2
010:0
010:4
011:2
012:0
012:4
013:2
014:0
014:4
015:2
016:0
016:4
017:2
018:0
018:4
019:2
020:0
020:4
021:2
022:0
022:4
023:2
0
Decib
els
Baseline Diesel
Comparison of daily bus noise based on minimum decibel ratingsLambton Quay, south end
70
74
78
82
6:0
06:4
07:2
08:0
08:4
09:2
010:0
010:4
011:2
012:0
012:4
013:2
014:0
014:4
015:2
016:0
016:4
017:2
018:0
018:4
019:2
020:0
020:4
021:2
022:0
022:4
023:2
0
Decib
els
Baseline Electric
Comparison of daily bus noise based on maximum decibel ratingsLambton Quay, south end
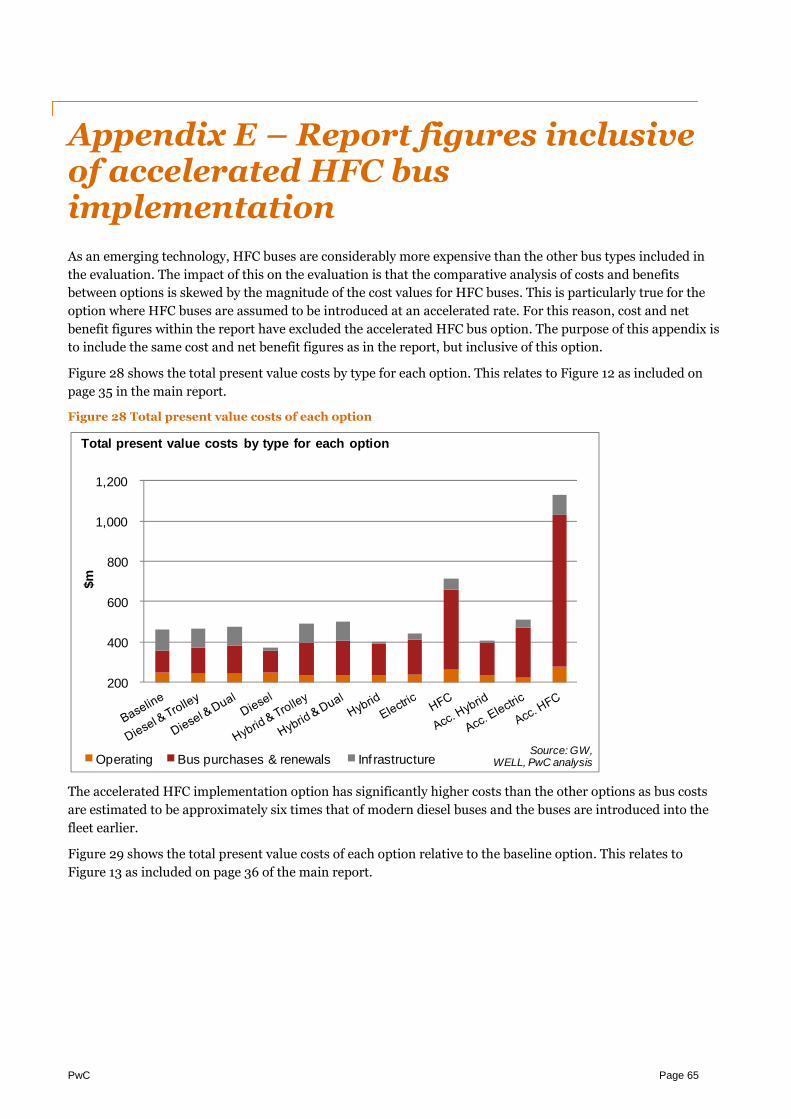
PwC Page 65
Appendix E – Report figures inclusiveof accelerated HFC busimplementation
As an emerging technology, HFC buses are considerably more expensive than the other bus types included in
the evaluation. The impact of this on the evaluation is that the comparative analysis of costs and benefits
between options is skewed by the magnitude of the cost values for HFC buses. This is particularly true for the
option where HFC buses are assumed to be introduced at an accelerated rate. For this reason, cost and net
benefit figures within the report have excluded the accelerated HFC bus option. The purpose of this appendix is
to include the same cost and net benefit figures as in the report, but inclusive of this option.
Figure 28 shows the total present value costs by type for each option. This relates to Figure 12 as included on
page 35 in the main report.
Figure 28 Total present value costs of each option
The accelerated HFC implementation option has significantly higher costs than the other options as bus costs
are estimated to be approximately six times that of modern diesel buses and the buses are introduced into the
fleet earlier.
Figure 29 shows the total present value costs of each option relative to the baseline option. This relates to
Figure 13 as included on page 36 of the main report.
200
400
600
800
1,000
1,200
$m
Operating Bus purchases & renewals Inf rastructure
Total present value costs by type for each option
Source: GW,WELL, PwC analysis

PwC Page 66
Figure 29 Costs relative to the baseline option
The accelerated HFC option is more expensive as HFC buses and the required infrastructure are expensive. As
these are introduced sooner, the present value costs are greater.
Figure 30 shows the net benefits of each option, including the accelerated HFC implementation option. This
relates to
Figure 4 and Figure 14 as included on pages 9 and 37 respectively in the main report.
Figure 30 Benefits net of costs of bus replacement options relative to the baseline option
(200)
(100)
-
100
200
300
400
500
600
700
800
$m
Costs relative to the baseline option
Source: GW, WELL, PwC analysisNB: Negative cost implies the option is cheaper than the baseline.
(700)
(600)
(500)
(400)
(300)
(200)
(100)
-
100
200
$m
Benefits net of costs relative to the baseline option
Source: GW, WELL, PwC analysis
Positive net benefits
Negative net benefits

PwC Page 67
Introducing HFC buses at an accelerated rate increases the present value costs of the option significantly. As the
increase in benefits that result from this introduction are not sufficient to offset the costs, the option shows a
significant negative net benefit.
PwC Page 68
Appendix F – Important Notice
This Report has been prepared solely for the purposes stated herein and should not be relied upon for any other
purpose.
This Report is strictly confidential and (save to the extent required by applicable law and/or regulation) must
not be released to any third party without our express written consent which is at our sole discretion.
To the fullest extent permitted by law, PwC accepts no duty of care to any third party in connection with the
provision of this Report and/or any related information or explanation (together, the “Information”).
Accordingly, regardless of the form of action, whether in contract, tort (including without limitation,
negligence) or otherwise, and to the extent permitted by applicable law, PwC accepts no liability of any kind to
any third party and disclaims all responsibility for the consequences of any third party acting or refraining to
act in reliance on the Information.
We have not independently verified the accuracy of information provided to us, and have not conducted any
form of audit in respect of the Company. Accordingly, we express no opinion on the reliability, accuracy, or
completeness of the information provided to us and upon which we have relied.
The statements and opinions expressed herein have been made in good faith, and on the basis that all
information relied upon is true and accurate in all material respects, and not misleading by reason of omission
or otherwise.
The statements and opinions expressed in this report are based on information available as at the date of the
report.
We reserve the right, but will be under no obligation, to review or amend our Report, if any additional
information, which was in existence on the date of this report was not brought to our attention, or subsequently
comes to light.
We have relied on forecasts and assumptions prepared by the Company about future events which, by their
nature, are not able to be independently verified. Inevitably, some assumptions may not materialise and
unanticipated events and circumstances are likely to occur. Therefore, actual results in the future will vary from
the forecasts upon which we have relied. These variations may be material.
This report is issued pursuant to the terms and conditions set out in our engagement letter and the Terms of
Business attached thereto.