evaluating stormwater control measures for linear highway ...€¦ · • an overlay (~2 inches...
TRANSCRIPT
www.bae.ncsu.edu/stormwaterwww.bae.ncsu.edu/stormwater
Evaluating Stormwater Control Measures for Linear Highway
Environments
Ryan J. Winston, William F. Hunt, and Shawn G. KennedyBiological and Agricultural EngineeringNorth Carolina State University, USA
Presented at the ASCE Low Impact Development ConferencePhiladelphia, PA
September 27, 2011

www.bae.ncsu.edu/stormwater
Stormwater Management in N.C.
• NC DOT is required to treat stormwater from its installations across N.C. due to federal permits
• Would like to optimize current treatment systems and implement new technologies
• N.C. regulations for stormwater are driven by TN, TP, and TSS
www.bae.ncsu.edu/stormwater
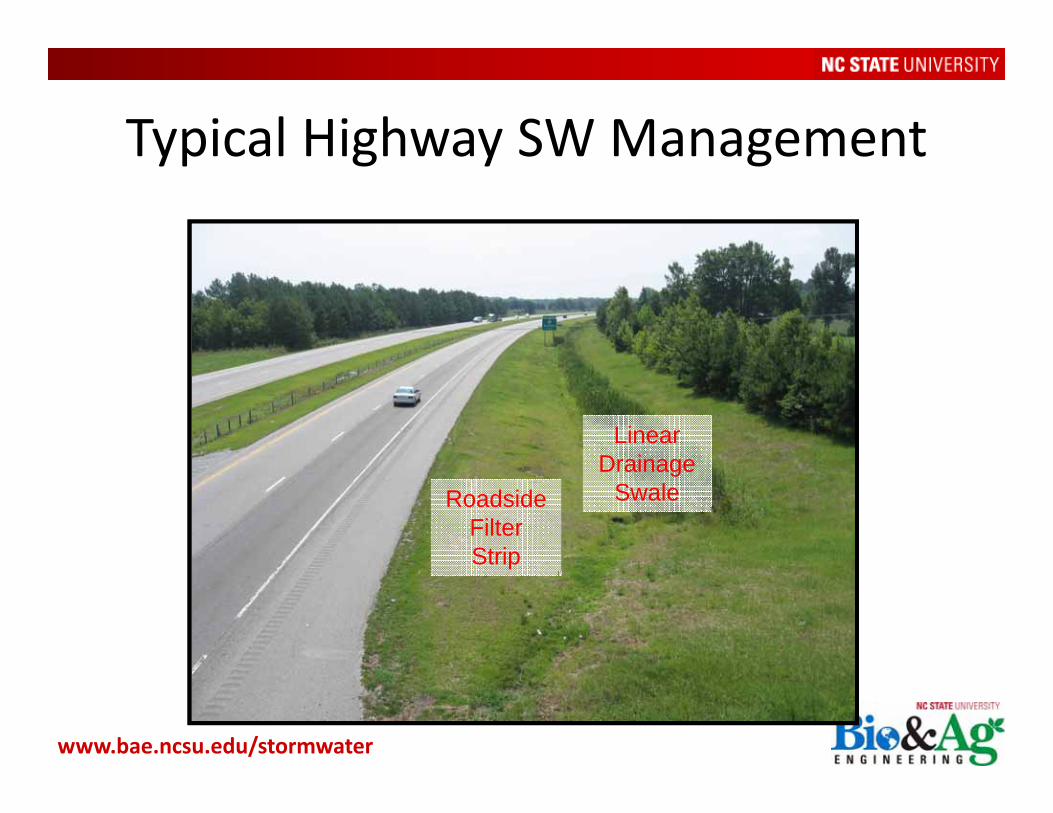
Typical Highway SW Management
Roadside FilterStrip
LinearDrainage
Swale

www.bae.ncsu.edu/stormwater
Development of the Study
• Are not those swales alongside major roads in N.C. treating runoff?
• Are all swales equal?– Wet vs. Dry
• What about roadside filter strips?
www.bae.ncsu.edu/stormwater
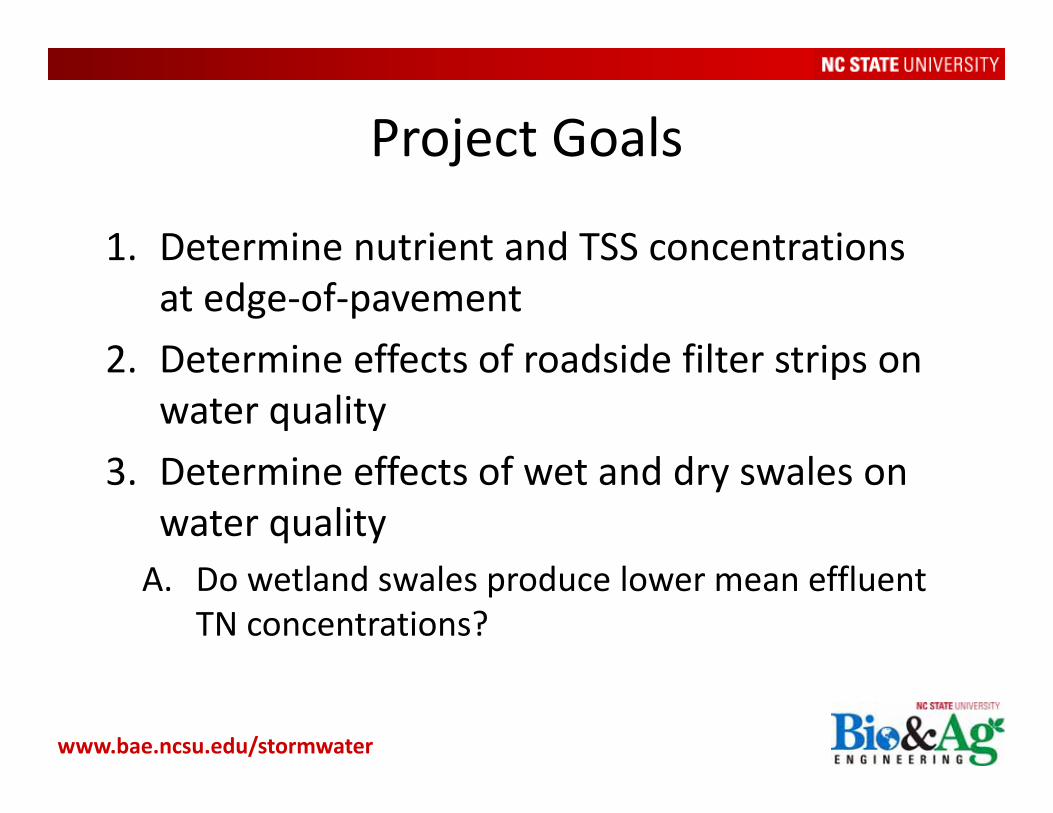
Project Goals
1. Determine nutrient and TSS concentrations at edge‐of‐pavement
2. Determine effects of roadside filter strips on water quality
3. Determine effects of wet and dry swales on water qualityA. Do wetland swales produce lower mean effluent
TN concentrations?

www.bae.ncsu.edu/stormwater
Two Types of Swales Studied along I‐40 in Eastern NC
Dry Swale Wetland Swale
Grassy (sites A/D) Vegetated (sites B/C)

www.bae.ncsu.edu/stormwater
Study Site Locations

www.bae.ncsu.edu/stormwater
Monitoring Design

www.bae.ncsu.edu/stormwater
Edge of Pavement Sampling
Structures approx. 30 ft from edge of shoulder

www.bae.ncsu.edu/stormwater
Filter Strip Monitoring
• Slot drains used to capture runoff from 22 ft long filter strips
• Monitored only at non‐wetland swale sites (sites A and D)

www.bae.ncsu.edu/stormwater
Swale Outlet Monitoring

www.bae.ncsu.edu/stormwater
Monitoring Equipment
Manual and Automatic Rain Gages
2-3 ISCO model 6712 WQ samplers with
bubbler inserts
Monitoring Equipment at each site:
Sampled for: TKN, NO2-3N, TN, NH4, TP, TSS

www.bae.ncsu.edu/stormwater
Results

www.bae.ncsu.edu/stormwater
Initial Edge‐of‐Pavement Results
Site NameTSS Concentration (mg/L)
Storm Event 1
Storm Event 2
Storm Event 3
Storm Event 4
Site A 6 5 7 6Site B 5 6 8 8Site C 5 6 8 10Site D 9 20 21 8
Why are TSS concentrations so low? PFC overlay over whole section of I-40 between Raleigh and Wilmington.

www.bae.ncsu.edu/stormwater
Permeable Friction Course (PFC)
• An overlay (~2 inches thick) of porous asphalt that is installed over a standard hot‐mix asphalt.
• Allows water to pass through (~20% voids)• Installed in 1999‐2000Property Permeable Friction
Course Standard Asphalt
% Passing 3/4” Sieve 100 100% Passing 1/2” Sieve 80‐100 100% Passing 3/8” Sieve 35‐60 90‐100% passing No. 4 sieve 1‐20 55‐85% passing No. 8 sieve 1‐10 32‐67% passing No. 200 sieve 1‐4 2‐10
Standard Asphalt
PFC Overlay

www.bae.ncsu.edu/stormwater
PFC Benefits
Source: Texas DOT Construction Division

www.bae.ncsu.edu/stormwater
Revised Project Goals
1. Determine effects of PFC on nutrient and TSS concentrations at edge‐of‐pavement
2. Determine effects of roadside filter strips on water quality
3. Determine effects of wet and dry swales on water quality
A. Do wetland swales produce lower mean effluent nutrient or sediment concentrations?
‐ Similar goals to Barrett et al. (2006) study (Water Environment Research, 78, 2177‐2185)

www.bae.ncsu.edu/stormwater
PFC PerformanceWu et al. (1998) found mean TSS concentrations of 283 mg/L and 93 mg/L for two highways in Charlotte, N.C.

www.bae.ncsu.edu/stormwater
NC and Texas PFC PerformancePFC has been shown to consistently release mean TSS concentrations of around 10 mg/L (N.C., Texas, France,
and the Netherlands)

www.bae.ncsu.edu/stormwater
PFC Performance over its Lifespan
No significant change in TSS effluent concentration over 10-yr lifespan(Eck et al., Journal of Environmental Engineering, Accepted)

www.bae.ncsu.edu/stormwater
Swale Performance
Other Metrics?
Often Percent Removals Don’t Tell the Whole Story…

www.bae.ncsu.edu/stormwater
Using Percent “Removal” Metric…
Research Site TN TP TSSSite A ‐12% ‐32% ‐96%Site B (wetland) 27% ‐6% 24%Site C (wetland) 43% 18% ‐115%Site D 38% ‐48% ‐400%
Different Metrics = Different Conclusionfor Overall Performance of the Swales
Wetland Swales do, however, outperform dry Swales for TN using effluent conc. metric
www.bae.ncsu.edu/stormwater
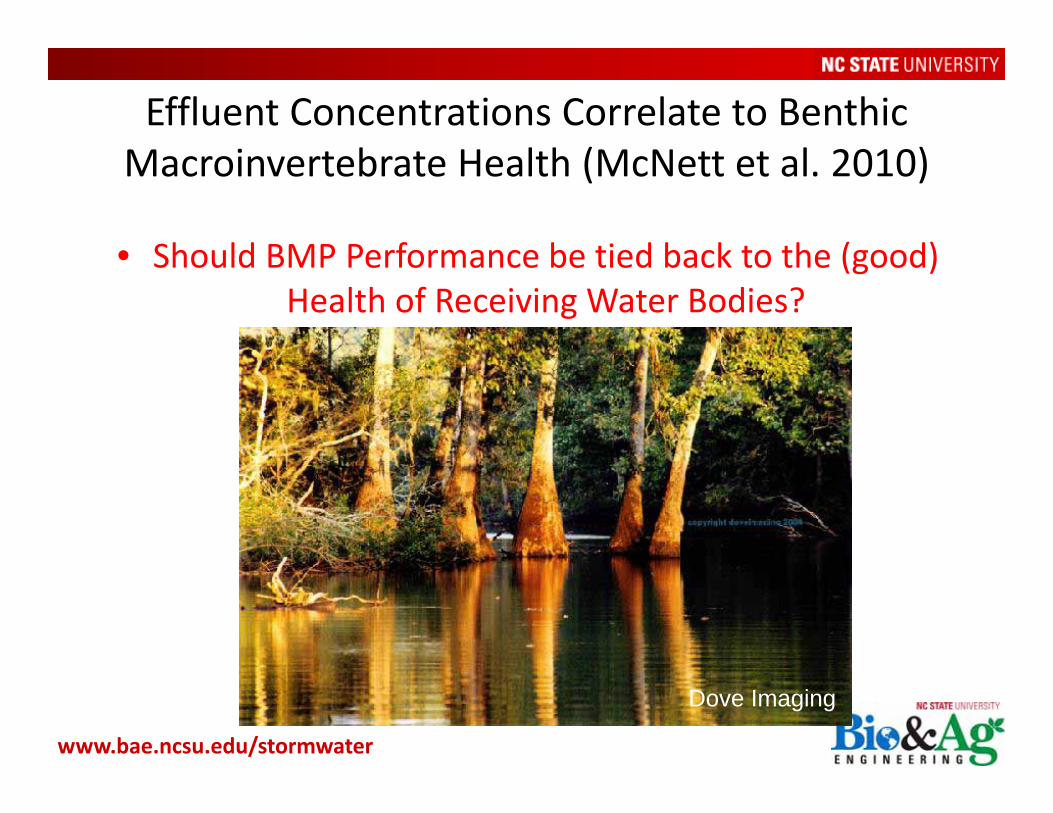
Effluent Concentrations Correlate to Benthic Macroinvertebrate Health (McNett et al. 2010)
• Should BMP Performance be tied back to the (good) Health of Receiving Water Bodies?
Dove Imaging

www.bae.ncsu.edu/stormwater
Rating Description of Benthos Sample Organisms by Scientific NameExcellent Very sensitive Ephemera Guttulata (mayfly), Litobrancha recurvata (mayfly)Good Sensitive Drunella allegheniensis (mayfly), Rhyacophila fuscula (caddisfly)Good‐Fair Semi‐tolerant Amnicola (snail), Elliptio complanata (mussel)Fair Tolerant Cambarus (crayfish), Crangonyx (crustacean)Poor Very tolerant Enchytraeidae (worm), Limnodrilus cervix (worm)
Rating Description of Benthos Sample Organisms by Scientific NameExcellent Very sensitive Ephemera Guttulata (mayfly), Litobrancha recurvata (mayfly)Good Sensitive Drunella allegheniensis (mayfly), Rhyacophila fuscula (caddisfly)Good‐Fair Semi‐tolerant Amnicola (snail), Elliptio complanata (mussel)Fair Tolerant Cambarus (crayfish), Crangonyx (crustacean)Poor Very tolerant Enchytraeidae (worm), Limnodrilus cervix (worm)
1. http://commons.wikimedia.org/wiki/Image:Water_snail_Rex_1.jpg2. http://www.adam-hart-davis.org/3. www.biol.andrews.edu/.../pond_crayfish_index.htm4. www2.mdbc.gov.au/.../invertebrates/mayfly.htm5. jimswan.com/111/aquaticinsects.htm

www.bae.ncsu.edu/stormwater
Piedmont Correlations

www.bae.ncsu.edu/stormwater0.0
0.5
1.0
1.5
2.0
2.5
3.0
3.5
4.0
Site A Site B Site C Site D
Concen
tration (m
g/L)
PFC FS Swale
Total Nitrogen Mean Concentrationsn ranges from 17 to 21
Target “Good” Condition

www.bae.ncsu.edu/stormwater
Swale TN Concentrations

www.bae.ncsu.edu/stormwater0.00
0.10
0.20
0.30
0.40
0.50
0.60
Site A Site B Site C Site D
Concen
tration (m
g/L)
PFC FS Swale
Total Phosphorus Mean Concentrationsn ranges from 17 to 21
Target “Good” Condition

www.bae.ncsu.edu/stormwater‐20
0
20
40
60
80
100
120
140
Site A Site B Site C Site D
Concen
tration (m
g/L)
PFC FS Swale
TSS Mean Concentrationsn ranges from 17 to 21
Target “Good” Condition

www.bae.ncsu.edu/stormwater
Head Cut at Site DLed to significantly higher effluent
concentrations of TSS when compared to sites A-C

www.bae.ncsu.edu/stormwater
Comparing Swale Outflow to Parking Lot Runoff in NC
Sampling Location TN (mg/L) TP (mg/L)Avg 8 Commercial PL’s * 1.57 0.19Site A 1.65 0.11Site B (wetland) 1.22 0.12Site C (wetland) 1.15 0.08Site D 1.62 0.19
* Passeport and Hunt (2009) – 8 Light to Moderate Use Institutional Parking Lots with no treatment

www.bae.ncsu.edu/stormwater
Roadside Filter Strips
• Using the Percent “Removal” Metricwhen compared to edge‐of‐pavement:
• Percent Volume Reduction:Site A: 12% Site D: 5%
Research Site TP TSS
Site A Filter Strip ‐227% ‐108%Site D Filter Strip ‐173% ‐156%

www.bae.ncsu.edu/stormwater
010002000300040005000600070008000
0 4 8 12 16 20 24 28 32 36
Cone
Inde
x (kpa
)
Depth (cm)
Site A, Location 1 Site A, Location 2
Site D, Location 1 Site D, Location 2
Site D, Swale
Filter Strip Soil Compaction
Above 300 psi = compacted

www.bae.ncsu.edu/stormwater
Filter Strip Vegetative Cover
Color Photos Color Analysis
Site A VFS: 70% vegetative cover
Site D VFS: 85% vegetative cover

www.bae.ncsu.edu/stormwater
Filter Strip Conclusions
• Tended to “make things worse”
• Performance similar to Barrett et al. (2006)
• Perhaps due to presence of bare spots? – Lack of vegetative establishment & maintenance

www.bae.ncsu.edu/stormwater
Final Thoughts…
• PFC works extremely well for removal of sediment‐bound pollutants (mean TSS concentrations ~10 mg/L)
• Wetland swales better than their dry counterparts for TN effluent concentrations
• Maintenance of vegetated highway stormwater practices is key in their long‐term functionality

www.bae.ncsu.edu/stormwater
Acknowledgements
• Jason Wright – Tetra Tech
• North Carolina Department of Transportation– Matt Lauffer– Brian Lipscomb– Ernie Hahn
• N.C. State Center for Applied Aquatic Ecology

www.bae.ncsu.edu/stormwater
Questions?
Publications resulting from this work:• Eck, B.J, Winston, R.J., Hunt, W.F., and Barrett, M.E. 2012. Water Quality of
Drainage from Permeable Friction Course. ASCE Journal of Environmental Engineering. Accepted.
• Winston, R.J., Hunt, W.F., Kennedy, S.G., Wright, J.D., and Lauffer, M.S. 2012. Field Evaluation of Stormwater Control Measures for Treatment of Highway Runoff in North Carolina. ASCE Journal of Environmental Engineering. In Press, January 2011.