whitetopping and hot-mix asphalt overlay treatments for flexible...
TRANSCRIPT

Whitetopping and Hot-Mix Asphalt Overlay Treatments for Flexible Pavement: A Minnesota Case History
Tom Burnham, Research Project Engineer
Minnesota Department of Transportation
Office of Materials and Road Research
1400 Gervais Avenue, Maplewood, MN 55109
Phone: (651) 779-5605, Fax: (651) 779-5616
e-mail: [email protected]
David Rettner, Geotechnical Engineering Manager
Minnesota Department of Transportation
Office of Materials and Road Research
1400 Gervais Avenue, Maplewood, MN 55109
Phone: (651) 779-5516, Fax: (651) 779-5616
e-mail: [email protected]
Total Number of Words: 7395
BURNHAM AND RETTNER 1
ABSTRACT In 1993, two hot-mix asphalt and four whitetopping overlay test sections were constructed on low volume TH 30 in southern Minnesota. A study was undertaken to examine the performance and costs associated with the test sections after nine years of service. The field testing and evaluation are described, and the costs incurred through 2001 are tabulated. The hot-mix asphalt overlay test sections are performing up to their design expectations. Both hot-mix asphalt test sections have had routine preventative maintenance applied to them, adding to their long-term cost of operation and ownership. The whitetopping test sections are performing very well at the midpoint of their design life of 20 years. Most distresses to date are related to poor construction and materials, rather than inherent design features. Some random longitudinal cracking has occurred in areas of the whitetopping control section. The doweled test section has numerous distressed transverse joints caused by dowels near the surface of the slabs. There is virtually no faulting of the transverse joints, and the ride quality has stabilized. No maintenance has been performed on the whitetopping sections through 2001. As of 2002, the most economical overlay design in this study is a 6 inch thick bonded whitetopping. Based on recent observations, it appears whitetopping is a good performing and economical rehabilitation option for low volume roads in Minnesota.

BURNHAM AND RETTNER 2
BACKGROUND The roadway systems in rural regions throughout the United States are an important link between agricultural products and their markets. The high cost of maintaining the rapidly aging pavements in these systems is driving the demand for more economical and predictable rehabilitation treatments.
In Minnesota, the typical rehabilitation treatment for an aging low volume flexible (hot-mix asphalt) pavement has been a thin hot-mix asphalt overlay. This treatment usually extends the pavement serviceability about 10 years (1). Many times, however, the distresses in the original pavement quickly reflect through the overlay, thus reducing its effective life. In the early 1990’s the Minnesota Department of Transportation (Mn/DOT) began exploring the use of whitetopping overlays as an alternative rehabilitation treatment for flexible low volume road pavements. Whitetopping is the placement of a bonded portland cement concrete (PCC) layer over a distressed hot-mix asphalt (HMA) pavement. The technique has been used extensively in Iowa for many years(2). In 1993, to build confidence and provide valuable information for future projects, Mn/DOT constructed several whitetopping test sections on TH 30, a low volume road in southern Minnesota. To gain further insight into the feasibility and cost effectiveness of whitetopping in Minnesota, the TH 30 project included both hot-mix asphalt and whitetopping overlays. While there has been some work reported in the literature on the influence of interlayer bond on the performance of PCC whitetopping(2,3), as well as numerous findings on the performance of hot-mix asphalt overlays over both HMA and PCC pavements(4-10), little has been written on side-by-side comparisons between HMA overlays and PCC whitetopping. This study will contribute to the knowledge base of most economical and best performing overlay options for Minnesota conditions.
PROJECT DESCRIPTION
History In 1992, Mn/DOT identified TH 30 as a low volume hot-mix asphalt roadway in need of urgent rehabilitation. Due to severe pavement deterioration caused by weak soils and an underlying soil-cement base layer, it was decided that a typical hot-mix asphalt overlay might not be the best engineering solution. Instead, it was thought that TH 30 might provide a good opportunity to study the performance of various types of overlays on flexible pavements with underlying soil-cement base layers. Due to an interest in exploring the feasibility of using whitetopping overlays in Minnesota, Mn/DOT reviewed the performance of several whitetopping projects in the state of Iowa. These projects, ranging from 3 to 21 years in age, appeared to be performing well, with little to no cracking or distress for similar site conditions. Following the investigation, it was decided a side-by-side comparison of HMA and whitetopping overlays would be worthwhile.
Location The test sections in this study were constructed in July 1993 on TH 30, approximately 35 miles (56 km) southwest of Mankato, Minnesota. The project is located in a rural area, with flat to slightly rolling topography. Soils are predominantly clays and silts.
TH 30 is a very low traffic volume road serving primarily as a local farm to market route. In 1992, the AADT (average annual daily traffic) was 385, with a 20 year projected AADT of

BURNHAM AND RETTNER 3
710. The HCADT (heavy commercial average daily traffic) in 1992 was 90, with a 20 year projected value of 110. Test Sections The TH 30 project consists of two hot-mix asphalt and four whitetopping overlay test sections constructed over approximately 11 miles (18 km). TABLE 1 lists the thickness, type, location, and special features for the test sections. With the exception of test sections 4 and 6 (TS-4 and TS-6), the test sections were at least 1 mile (1.6 km) in length. Before describing the test sections in more detail, a history of the previous construction and rehabilitation work on TH 30 is important. The section of TH 30 in this study entered the Minnesota trunk highway system as a gravel road in 1934. It was reconstructed in 1955 with a 6 inch (150 mm) thick soil-cement treated base and 1.5 inches (38 mm) thick hot-mix asphalt wearing surface. A 2.75 inch (70 mm) thick hot-mix asphalt overlay was then placed in 1973. The test sections in this study were constructed in July 1993.
Preliminary deflection testing indicated the in-place subgrade to be very wet and unstable. Edge drains were installed along all of the test sections to reduce the subgrade instability and extend the life of the overlays. Test sections 1 and 2 (TS-1 and TS-2) were designed to compare the performance of typical medium and thick hot-mix asphalt overlays. Design thicknesses were 3 inches (76 mm) and 5 inches (127 mm), respectively. They were also placed to allow a side-by-side comparison of HMA overlays and whitetopping under similar traffic and environmental conditions. Pavement width for these sections is 28 feet (8.5 m). Tests sections 3 through 6, and the control section, are whitetopping sections. Except for test section 5 (which will be described later), the design thickness was 6 inches (152 mm) average, with a minimum thickness of 5 inches (127 mm). The sections consist of two 12 foot (3.6 m) PCC lanes, with a 2 foot (0.6 m) hot-mix asphalt shoulder on each side. Panel length is 12 feet (3.6 m), and the transverse joints are skewed. Test section 3 (TS-3) and the control section were designed for lowest initial cost. The first 10 panels of TS-3 are doweled only to reinforce the transition from the HMA overlay to the whitetopping sections. Test section 4 was constructed with doweled transverse joints to examine the cost/benefit of doweled joints.
Whitetopping (WTP) is typically applied directly over the distressed surface of an existing flexible pavement. This results in variable thickness in the whitetopping as it conforms to different cross slopes and wheel path rutting that may be present. Test section 5 (TS-5) was designed to examine the benefit of milling the hot-mix asphalt to a constant profile and applying a more consistent thickness (6 inch [152 mm]).
The concept of whitetopping typically relies on the bonding between the concrete and existing hot-mix asphalt. While test sections 3, 4, and 5 were bonded to the best of the contractor’s ability, TS-6 was designed and constructed to be unbonded. The bond breaker consisted of two coats of curing compound applied to the HMA before the whitetopping was placed.
Several problems were encountered during the construction of the whitetopping sections. These included low concrete strengths, high dowel bars, and ride quality issues which required grinding shortly after paving.

BURNHAM AND RETTNER 4
FIELD EVALUATION AND TESTING
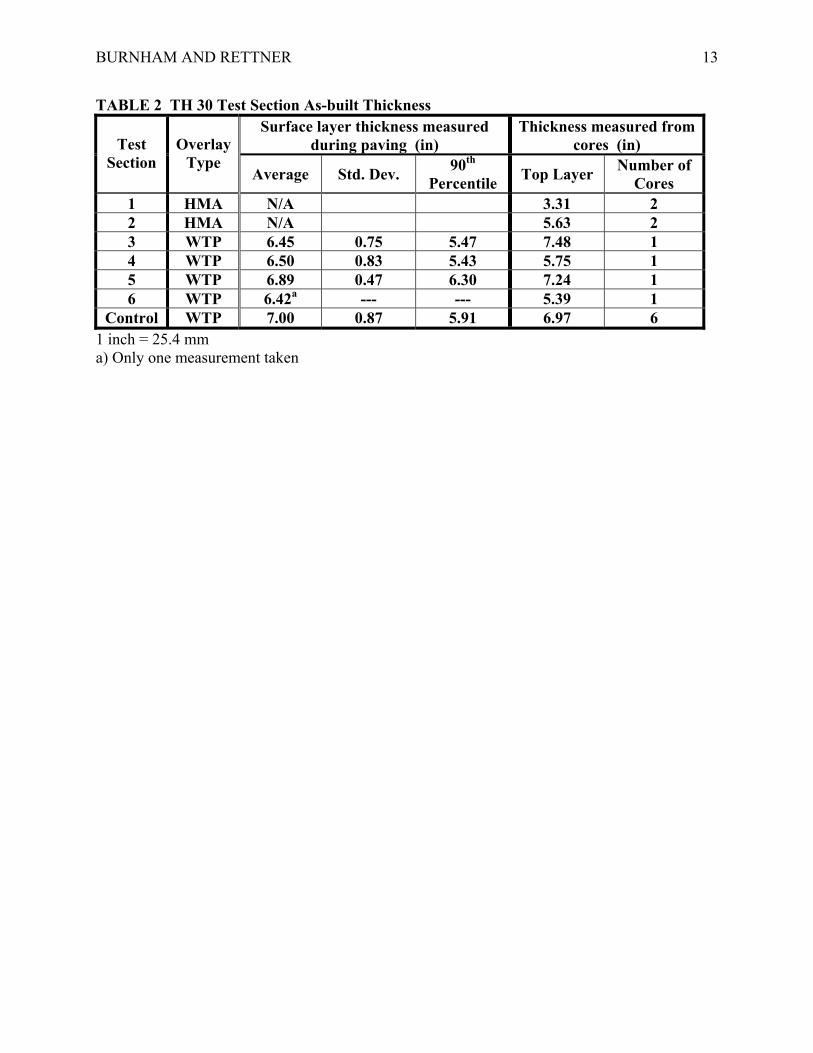
As-built Thickness As described before, whitetopping is typically applied directly over the distressed surface of an existing flexible pavement. This results in variable thickness in the whitetopping, which can have a significant effect on the performance of the section. Thickness measurements were taken during the construction of the whitetopping sections (using a depth probe) and from core samples taken more recently. See TABLE 2 for as-built thicknesses from each method. The overall as-built depth for all whitetopping sections is 6.6 inches (169 mm). This is over 0.5 inch (13 mm) higher than the average 6 inch (152 mm) thickness required. The thickness ranged from 5.25 – 9.75 inches (133-248 mm), demonstrating the potential variability in whitetopping thickness. Some of the excessive thickness is due to problems the contractor had with grade control during placement. Test section 5, placed over a milled surface, showed the lowest standard deviation in thickness.
Material Strength The quality of the concrete for whitetopping plays an important role in its performance. Unfortunately, the concrete produced for the TH 30 project was of substandard strength. The as-built 28-day compression strength (90th percentile) was 2972 psi (20.5 Mpa), compared to a design value of 3900 psi (26.9 Mpa). The as-built flexural strengths were also lower than specified design values. Table 3 summarizes the results from testing samples taken during the paving of TH 30 whitetopping sections.
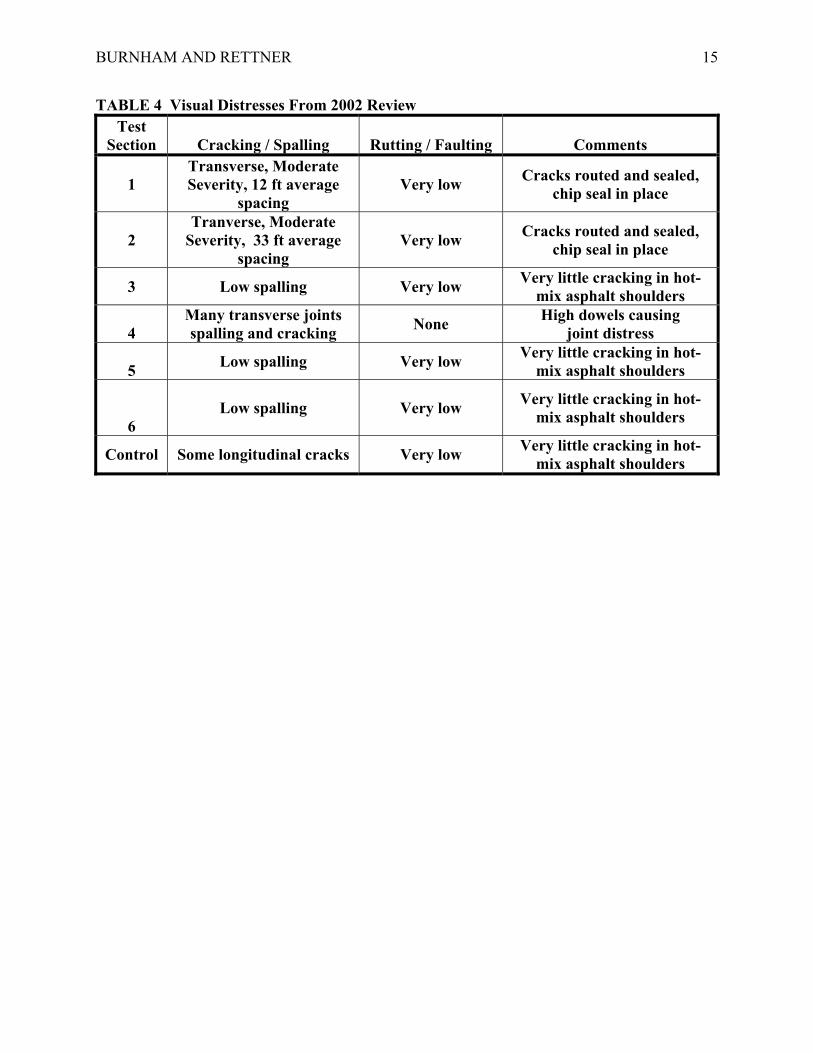
Core Samples To better characterize the as-built thicknesses and current condition of the overlays and underlying HMA layers, core samples were taken from each of the test sections on TH 30. Cores from HMA overlay test sections 1 and 2 reveal excellent bond and no deterioration between the new (1993) and old overlays (1973). Stripping and raveling are beginning to occur at the bottom of the 1973 overlay. Cores samples from the bonded whitetopping sections show excellent bond, with no deterioration at the interface of the concrete and hot-mix asphalt. Stripping and raveling are beginning at the bottom of the 1973 HMA overlay layer. A core sample from unbonded test section 6 revealed that it is indeed unbonded, with both HMA overlay layers below showing signs of stripping and raveling. Visual Distress Surveys The TH 30 test sections have had 4 recorded field reviews since their construction. Those took place in March 1994 (approximately 6 months after construction), September 1994, June 1999, and on June 28, 2002. Initial reports described a generally good ride, with a small number of random transverse cracks in the whitetopping sections. The most recent (2002) observations are summarized in TABLE 4 and described next. Test section 1 (HMA) has approximately 8 transverse thermal cracks per 100 feet (30 m). The cracks, which can be classified as moderate in severity, were routed and sealed in 1997. A chip seal coat was also placed in 2000. There is no observable rutting in the wheelpaths.
BURNHAM AND RETTNER 5
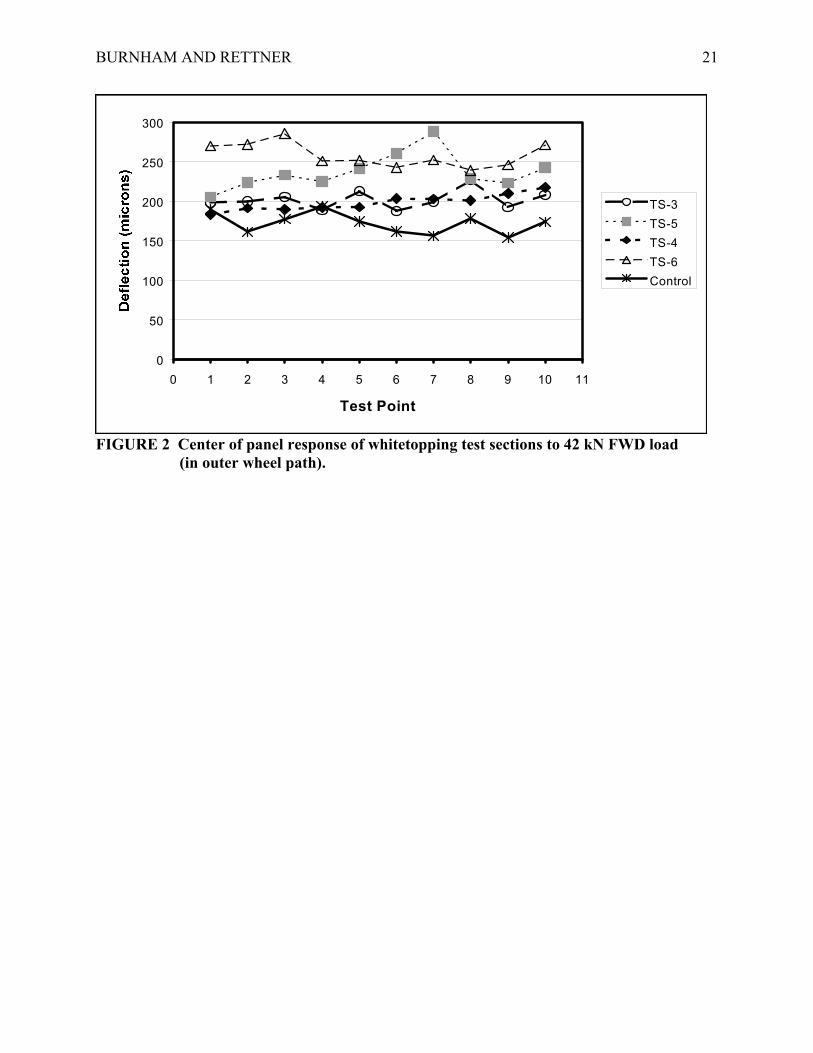
Test section 2 (HMA) appears to be very similar in condition to section 1. Transverse thermal cracking is much less, with approximately 3 cracks per 100 feet (30 m). Cracks were routed and sealed, and a chip seal was placed at the same time as test section 1. The WTP test sections 3, 5, 6, and the control section, all have very little visual distress. Test section 4 has numerous transverse joints that are cracking and spalling due to dowels ending up too high in the slabs. See PHOTO 1. A possible cause for this may have been insufficient anchorage of the dowel baskets to the existing asphalt pavement during paving. There is very little cracking in the narrow HMA shoulders adjacent to the whitetopping sections. Load Response Testing To further examine the performance of the test sections, falling weight deflectometer (FWD) testing was performed on July 9, 2002. The HMA sections were tested every 20 feet (6.1 m) in the outer wheelpath for a 200 foot (60 m) length. The whitetopping sections were tested in the outer wheelpath at the leave side of the joint and at the longitudinal center of the panel. Ten panels were tested in each WTP section. Each FWD test included 3 drops at 3 load levels. Deflections were normalized to load levels of 42, 56, and 76 kN. Most results demonstrated a linear deflection response with increased load level. FIGURES 1 and 2 show the deflection results for a 42 kN FWD load on the HMA and whitetopping sections, respectively. For comparison purposes, the x-axis values in FIGURES 1 and 2 correspond to test points from the beginning of each respective test section. Joint load transfer efficiency test results will be discussed later.
Joint Faulting Transverse joint fault measurements were taken on the whitetopping test sections in September 1994 (one year after construction) and June 2002. TABLE 5 shows the measurements obtained with a Georgia digital faultmeter. Overall, there is virtually no faulting of the joints after 9 years. Any changes in faulting have been less than 1 mm, which is within the range of surface texture effects on the fault measurements.
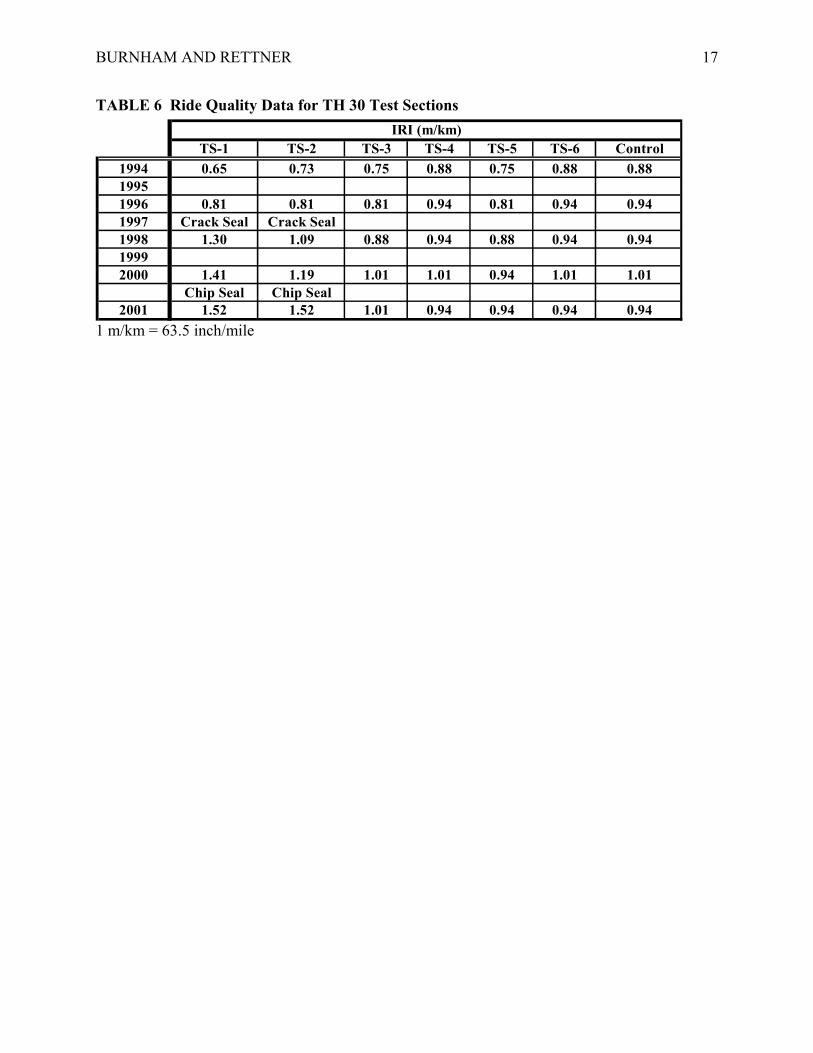
Pavement Ride History The Minnesota Department of Transportation (Mn/DOT) routinely measures the condition and ride quality of pavements in Minnesota using automated data collection equipment (Pathways/Pavetech vans). Every 2 years, each length of Minnesota highway is measured for ride (IRI) and videotaped for surface distress. Data from the pavement management database for TH 30 is shown in TABLE 6. For this study, ride comparison will be based on International Roughness Index (IRI)(11) measured in m/km.
Maintenance History The transverse and longitudinal cracks in the HMA overlay test sections 1 and 2 were routed and sealed in 1997. These test sections also had a chip seal applied to them in 2000. These treatments are typical preventative maintenance procedures carried out by most districts in Mn/DOT. The whitetopping test sections have had no maintenance performed on them to date.

BURNHAM AND RETTNER 6
PERFORMANCE AFTER 9 YEARS
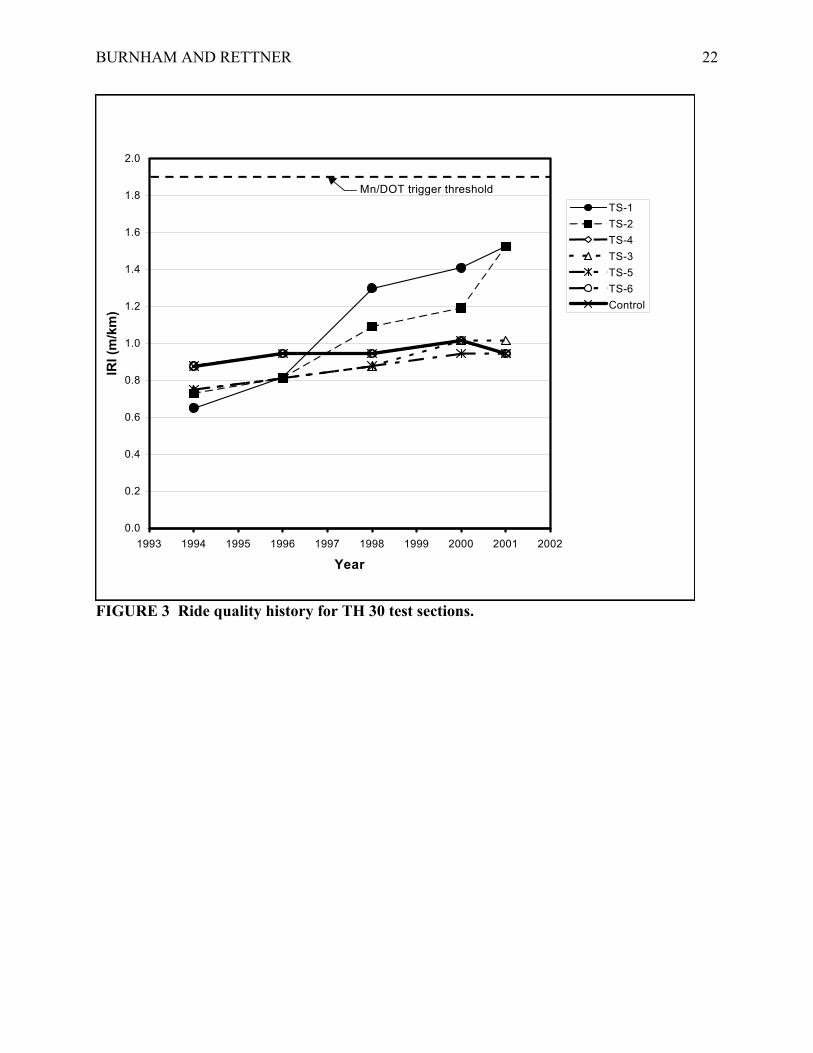
Hot-Mix Asphalt Overlay Sections After nine years of weather and traffic, the hot-mix asphalt overlays are performing very well. Test section 1, considered a medium thickness overlay by Mn/DOT guidelines, typically has a service life of 8 to 12 years for low traffic levels. Test section 2, a thick overlay according to Mn/DOT guidelines, typically has a service life of 11 to 15 years for low traffic levels. Certainly, it seems both test sections will meet or exceed their expected serviceability life. Examining surface condition, there is significantly more cracking in the thinner section, TS-1, than in TS-2. In TS-1 most of the cracking is thermal and reflective. As expected, with such low traffic amounts, fatigue cracking is not present in either section. The crack sealing and chip seal treatments are helping to slow deterioration of the HMA surface. Maintenance costs will invariably need to be included in the economic comparison of the HMA and whitetopping overlays in this study. With respect to load response, TS-1 has deflections approximately 1.5 times higher than TS-2. Thermal effects on the measured deflections were not an issue, since both were tested at similar temperatures. Even with the extensive transverse cracking, both sections have reasonably good ride quality in 2002 (IRI = 1.52 m/km). FIGURE 3 shows the trend of IRI for each of the test sections. Although not reflected in IRI measurements, the ride quality of TS-1 (with much more cracking) is definitely lower than TS-2 and the whitetopping sections. A substantial increase in IRI took place for TS-1 and TS-2 after the crack sealing in 1997. The crack sealing maintenance possibly contributed to this jump in values. The chip seal application in 2000 may have caused the latest readings to jump again, however it will take a few more years until Mn/DOT’s rehabilitation IRI trigger value of 1.90 m/km is reached. There is also virtually no rutting in TS-1 and TS-2 to date. This is not surprising, given the low amount of traffic on this road. Whitetopping Overlay Sections Despite the low strength concrete used to pave the whitetopping sections, their condition after 9 years is very good. Most of the distresses that have occurred can be attributed to construction problems, rather than design variables. The most noticeable distresses in the whitetopping sections to date are the longitudinal cracks near the centerline in a small number of panels in the control section, and the deterioration of several joints in test section 4, due to high dowel bars. Otherwise, there is little faulting, and the only maintenance has been minimal patching over culvert crossings that have settled. With regards to the load response of the whitetopping sections, the control section shows the lowest deflections for center of panel (wheel path) loadings. This is not surprising, since the average slab thickness for this section is the highest. Test section 6 demonstrated the highest overall deflection for the whitetopping sections. It is unsure at this time whether that is due to a lower average thickness or a result of having no bond to the underlying hot-mix asphalt. Test section 4, with doweled joints, shows the least variation in center of panel wheel path loading deflection throughout the tested area. The results from joint efficiency testing in July, 2002, show all the test sections having a joint efficiency of approximately 90%. This corresponds well with the lack of joint faulting throughout the whitetopping sections. It must be noted, however, that the minimum surface
BURNHAM AND RETTNER 7
temperature at the time of testing was 86° F (30° C), which may have caused some joints to be restrained, providing artificially high readings. Testing will be repeated at lower temperatures in the future to verify the results. Examining the trends in the small amount of faulting that has occurred to date in the whitetopping sections (TABLE 5), it appears TS-4 (doweled) and the control section have changed the least from 1994 to 2002. It must be noted that the amount of faulting being measured so far is within the range of surface roughness. Therefore, any faulting of the panels is still in its early stage. In terms of ride quality, test sections 3 and 5 seem to be have started out smoother, but their IRI measurements now match the other whitetopping sections (IRI = 0.94 m/km). Test section 5 was milled before the whitetopping was placed. Perhaps the even surface created by the milling is reflected in the smoother initial ride quality. The more noticeable rise in IRI for TS-3 in 1998 (FIGURE 3), may be caused by the bump that has developed at the transition between the HMA overlay and the whitetopping. The drop in IRI for test sections 4, 6, and the control sections probably has more to do with testing variability than behavior. Certainly, the ride quality of the whitetopping sections, base on IRI, has stabilized to a slow steady increase. At this rate, 20 years of service seems feasible.
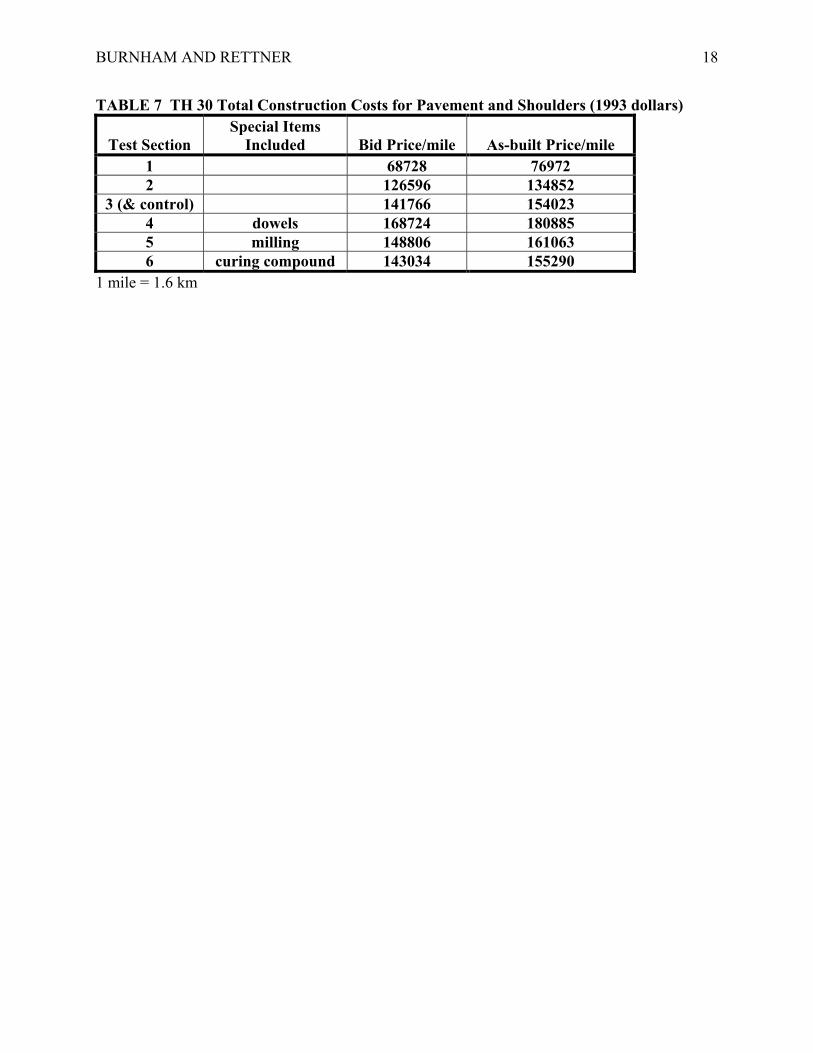
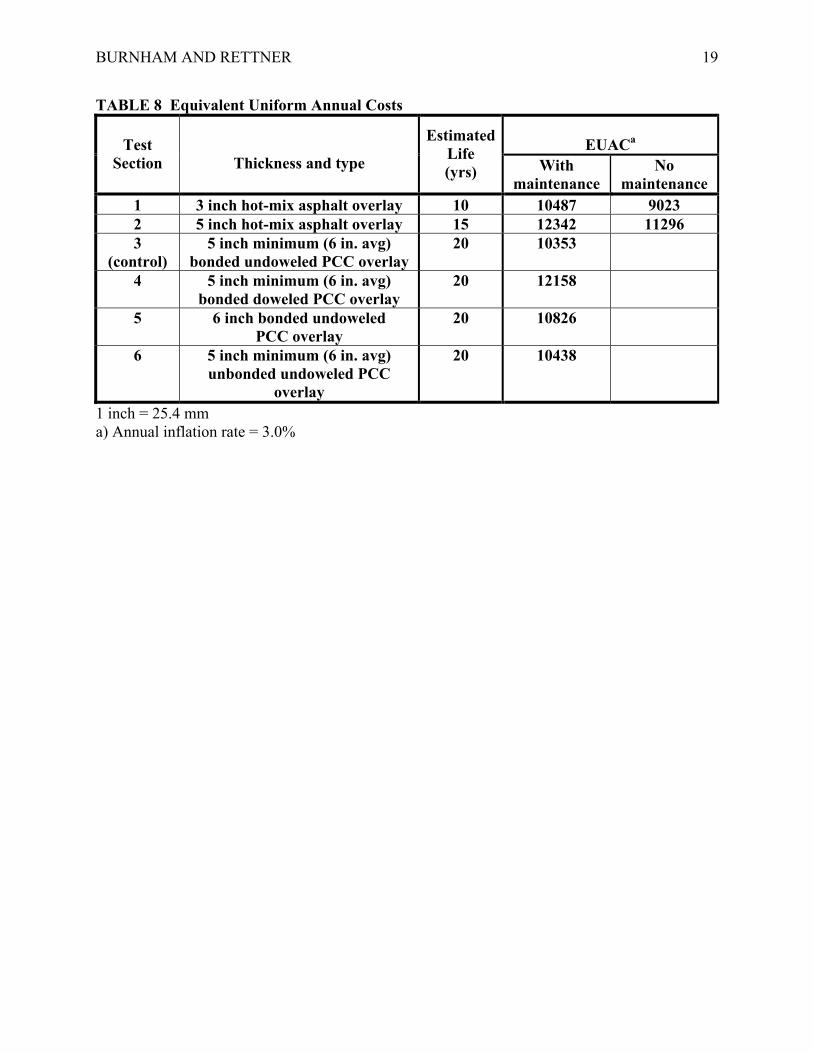
ECONOMICS Pavement engineers are ultimately interested in the cost of performance for any given design. Estimating the costs of new pavement designs is straight forward, since the depth of the layers is specified. In the case of overlays, quantifying the cost is certainly more of an approximation. For this study, the equivalent uniform annual cost (EUAC) per mile of roadway will be the means of economic comparison between each of the test sections. This will include initial construction costs plus any maintenance costs incurred up to July of 2002. Total construction costs for the pavement and shoulders in each test sections are listed in TABLE 7. The prices shown are in 1993 dollars. Equivalent uniform annual costs, including any maintenance costs incurred to date, are shown in TABLE 8. An average annual inflation rate of 3 percent was used, based on the 1993-2001 commodity price index (CPI) multiplier of 1.23 (12). From TABLE 8 it seems test section 3, which is the same as the control section, is the most economical rehabilitation option for TH 30. The next lowest cost option is test section 6, which is the unbonded whitetopping section. Based on the performance of the bonded whitetopping sections, it seems the extra cost to unbond the layers is unnecessary. The performance of TS-6 does indicate, however, that if bond is lost, the performance of the whitetopping will not be significantly lower. Bond strength would become more important with increased traffic loads and volumes.
While test section 5 has a slightly higher annual cost than the whitetopping control section, the lower standard deviation in thickness demonstrates the potential benefit of paving over a more consistent (milled) surface. Having a more predictable thickness during design and bidding can reduce the potential for cost overruns. For this project, the contractor was also able to build a smoother pavement in test section 5. It has been shown that initially smooth pavements perform better over their entire service lives(13).
The addition of dowels to the whitetopping in test section 4 added significant cost. Without the benefit of an even, milled surface, there were also construction problems that led to
BURNHAM AND RETTNER 8
significant joint distress. Given little evidence of any improvement over the undoweled sections, it seems transverse joint dowels are unnecessary for such low volume applications.
The annual cost of the hot-mix asphalt test sections (including maintenance costs) was slightly higher than all but test sections 4 and 5 of the whitetopping sections. Without the maintenance performed on test section 1, its annual cost per mile would have been the lowest. The cost of the thicker 5 inch (127 mm) HMA overlay without maintenance would be closer to the cost of a doweled whitetopping section.
CONCLUSIONS To better understand the performance and cost differences between conventional hot-mix asphalt overlays and concrete whitetopping overlays, Mn/DOT constructed side-by-side test sections on TH 30 in 1993. This study has examined the performance and costs associated with the test sections after nine years of service. The hot-mix asphalt overlay test sections 1 and 2 are performing up to their design expectations. The 3 inch thick test section 1 has much more thermal cracking than the 5 inch thick test section 2, but still has reasonable ride quality and will exceed its average design life of 10 years. Test section 2 has minimal thermal cracking, and at this point, looks like it will meet its design life of 15 years. Both HMA test sections have had routine preventative maintenance applied to them, which adds service life, but also an increase in the long-term cost of ownership. The whitetopping test sections are performing very well at the midpoint of their design life of 20 years. Most of the distresses to date are related to poor construction and materials, rather than inherent design features. Material testing after construction showed the average compressive and flexural strength of the concrete mix to be significantly below the specified design values. This may explain some of the random longitudinal cracking found in some areas of the control section. Test section 4, containing doweled joints, has numerous distressed transverse joints caused by dowels which ended up near the surface of the slabs. Despite those minor problems, there is virtually no faulting of the transverse joints in any of the whitetopping sections, and the ride quality in terms of IRI has stabilized at about 1 m/km (63 in/mile). There has been virtually no maintenance performed on the whitetopping sections through 2001. Comparing the costs (including maintenance) of the HMA and whitetopping overlay sections from 1993 to 2001, shows the most economical design on an annual basis would be a 6 inch thick bonded undoweled whitetopping (test section 3 and the control section). Discounting the routine preventative maintenance, the 3 inch thick hot-mix asphalt overlay test section 1 would have the lowest annual cost. This study shows that whitetopping is a good performing and economical rehabilitation option for low volume roads in Minnesota. Further monitoring of the test sections on TH 30 will provide valuable performance information for the development of improved design methods for whitetopping overlays. ACKNOWLEDGEMENTS The authors would like to thank Steve Oakey, Roger Olson, and the Mn/DOT District 7 field crews for their help with field measurements and historical information. Thanks also to the Mn/DOT Pavement Engineering Section for providing FWD testing and historical ride quality information.

BURNHAM AND RETTNER 9
DISCLAIMER The contents and opinions presented in this paper are those of the authors, who are responsible for the facts and accuracy of the data. The contents do not necessarily reflect the views or opinions of the Minnesota Department of Transportation. REFERENCES
1. Goetechnical and Pavement Manual, Part II, State of Minnesota, Department of Transportation, Appendix E, 1994.
2. Grove, J.D., Harris, G.K., and B.J. Skinner. Bond Contribution to Whitetopping
Performance on Low Volume Roads. Construction Report for Iowa Highway Research Board, Research Project HR-341, Highway Division, Iowa Department of Transportation, 1993.
3. Grove, J.D., Engle, E.J., and B.J. Skinner. Bond Enhancement Techniques for PCC
Whitetopping. Final Report for Iowa Highway Research Board, Research Project HR-341, Highway Division, Iowa Department of Transportation, 1996.
4. Cho, Y., Weissmann, J., and B.F. McCullough. Initial Performance of Asphalt
Overlays on Overlaid Jointed Concrete Pavement (JCP) and On Flexible Pavements In Field Test Sections in Lufkin, Texas. Research Report Number 987-4, Center for Transportation Research, University of Texas at Austin, 1995.
5. Schutzbach, A.M. Bituminous Overlay Policy – A Performance Evaluation.
Physical Research Report No. 116, Illinois Department of Transportation, Bureau of Materials and Physical Research, 1995.
6. Bernard, F., and J.H. Dobrosielski. Canadian Climate Tests Paving Fabric’s
Performance. Geotechnical Fabrics Report, April 1996.
7. Tighe, S., Haas, R., and Ningyuan Li. Overlay Performance in Canadian Strategic Highway Research Program’s Long-Term Pavement Performance Study. Transportation Research Record 1778, Design and Rehabilitation of Pavements 2001, Transportation Research Board, National Research Council, National Academy Press, Washington, D.C., 2001.
8. LTPP Tech Brief. Performance Trends of Rehabilitated AC Pavements. Publication
No. FHWA-RD-00-165, Federal Highway Administration, Turner-Fairbank Highway Research Center, Virginia, October 2000.
9. Reed, C.M. The Performance Evaluation of Single Pass Thin Lift Bituminous
Overlays. Physical Research Report No. 110, Illinois Department of Transportation, Bureau of Materials and Physical Research, 1992.
BURNHAM AND RETTNER 10
10. Cable, J. K. Impact of Pavement Type on County Road Systems. Portland Cement Association, Research and Development Information, RP340, 1996.
11. Sayers, M.W. On the Calculation of International Roughness Index from
Longitudinal Road Profile. Transportation Research Record 1501, Transportation Research Board, National Research Council, National Academy Press, Washington, D.C., 1995, pp. 1-12.
12. McCusker, J.J. Source Note for How Much is That Worth Today. Economic History
Services, 2001. http://www.eh.net/hmit/ppowerusd/dollarsource.php. Accessed July 24, 2002.
13. Smith, K.L., Smith, K.D., Evans, L.D., Hoerner, T.E., and M.I. Darter. Smoothness
Specifications for Pavements. Final Report for Project 1-31, Prepared for the National Cooperative Highway Research Program, Transportation Research Board, National Research Council, National Academy Press, Washington, D.C., 1997.
BURNHAM AND RETTNER 11
LIST OF TABLES AND FIGURES TABLE 1. TH 30 Test Sections TABLE 2. TH 30 Test Section As-built Thickness TABLE 3. Concrete strength test results TABLE 4. Visual Distresses From 2002 Review TABLE 5 TH 30 Whitetopping Test Section Faulting TABLE 6 Ride Quality Data for TH 30 Test Sections TABLE 7 TH 30 Total Construction Costs for Pavement and Shoulders (1993 dollars) TABLE 8 Equivalent Uniform Annual Costs FIGURE 1. Response of hot-mix asphalt test sections to 42 kN FWD load (outer wheel
path) FIGURE 2. Center of panel response of whitetopping test sections to 42 kN FWD load
(in outer wheel path) FIGURE 3. Ride quality history for TH 30 test sections PHOTO 1. Distressed joint due to high dowel bars in TH 30 test section 4

BURNHAM AND RETTNER 12
TABLE 1 TH 30 Test Sections Test
Section Thickness and type
Location (Mileage points)
Special features
1 3 inch hot-mix asphalt overlay 118.96 – 120.47 2 5 inch hot-mix asphalt overlay 120.47 – 121.98 3
5 inch minimum (6 in. avg) bonded undoweled PCC overlay
121.98 – 122.98
¾ in. dia. dowels 1st 10 panels
4
5 inch minimum (6 in. avg) bonded doweled PCC overlay
123.93 – 124.48
¾ in. dia. dowels throughout
5
6 inch bonded undoweled PCC overlay
122.98 – 123.93
placed over milled hot-mix asphalt
6
5 inch minimum (6 in. avg) unbonded undoweled PCC overlay
124.48 – 124.58
bond breaker = 2 coats of curing
compound
Control 5 inch minimum (6 in. avg) bonded undoweled PCC overlay 124.58 – 130.40
1 inch = 25.4 mm
BURNHAM AND RETTNER 13
TABLE 2 TH 30 Test Section As-built Thickness Surface layer thickness measured
during paving (in) Thickness measured from
cores (in) Test Section
OverlayType
Average Std. Dev. 90th Percentile Top Layer Number of
Cores 1 HMA N/A 3.31 2 2 HMA N/A 5.63 2 3 WTP 6.45 0.75 5.47 7.48 1 4 WTP 6.50 0.83 5.43 5.75 1 5 WTP 6.89 0.47 6.30 7.24 1 6 WTP 6.42a --- --- 5.39 1
Control WTP 7.00 0.87 5.91 6.97 6 1 inch = 25.4 mm a) Only one measurement taken

BURNHAM AND RETTNER 14
TABLE 3 Concrete strength test results Strength (psi)
Average Std. Dev. 90th Percentile 28-day Compression 3852 688 2972 a
3-day Flexural Strength 434 45 7-day Flexural Strength 491 60 28-day Flexural Strength 574 52 507 b
1 psi = 6.9 kPa a) Design 28-day compressive strength (90th percentile) = 3900 psi b) Design 28-day flexural strength (90th percentile) = 675 psi
BURNHAM AND RETTNER 15
TABLE 4 Visual Distresses From 2002 Review Test
Section
Cracking / Spalling
Rutting / Faulting
Comments
1 Transverse, Moderate Severity, 12 ft average
spacing Very low Cracks routed and sealed,
chip seal in place
2 Tranverse, Moderate
Severity, 33 ft average spacing
Very low Cracks routed and sealed, chip seal in place
3 Low spalling Very low Very little cracking in hot-mix asphalt shoulders
4
Many transverse joints spalling and cracking None High dowels causing
joint distress 5 Low spalling Very low Very little cracking in hot-
mix asphalt shoulders 6
Low spalling Very low Very little cracking in hot-mix asphalt shoulders
Control Some longitudinal cracks Very low Very little cracking in hot-mix asphalt shoulders

BURNHAM AND RETTNER 16
TABLE 5 TH 30 Whitetopping Test Section Faulting Average faulting (mm) Range of faulting (mm)Test
Section 1994 2002 1994 2002 Change (mm)
Comments
3 0.01 0.62 -0.6 - 0.9 -0.5 - 1.8 0.61 1st 10 joints excluded
4 -0.13 -0.29 -0.9 - 0.6 -0.9 - 0.4 -0.16 5 -0.21 0.6 -0.9 - 0.5 0.2 - 1.1 0.81 6 0.27 0.8 -0.2 - 0.6 0.2 - 1.3 0.53
Control 0.23 0.21 -0.7 - 0.7 -0.3 – 1.5 -0.02 1 inch = 25.4 mm
BURNHAM AND RETTNER 17
TABLE 6 Ride Quality Data for TH 30 Test Sections
1 m/km = 63.5 inch/mile
TS-1 TS-2 TS-3 TS-4 TS-5 TS-6 Control1994 0.65 0.73 0.75 0.88 0.75 0.88 0.8819951996 0.81 0.81 0.81 0.94 0.81 0.94 0.941997 Crack Seal Crack Seal1998 1.30 1.09 0.88 0.94 0.88 0.94 0.9419992000 1.41 1.19 1.01 1.01 0.94 1.01 1.01
Chip Seal Chip Seal2001 1.52 1.52 1.01 0.94 0.94 0.94 0.94
IRI (m/km)
BURNHAM AND RETTNER 18
TABLE 7 TH 30 Total Construction Costs for Pavement and Shoulders (1993 dollars)
Test Section Special Items
Included
Bid Price/mile
As-built Price/mile 1 68728 76972 2 126596 134852
3 (& control) 141766 154023 4 dowels 168724 180885 5 milling 148806 161063 6 curing compound 143034 155290
1 mile = 1.6 km
BURNHAM AND RETTNER 19
TABLE 8 Equivalent Uniform Annual Costs
EUACa
Test Section
Thickness and type
EstimatedLife (yrs) With
maintenance No
maintenance 1 3 inch hot-mix asphalt overlay 10 10487 9023 2 5 inch hot-mix asphalt overlay 15 12342 11296 3
(control) 5 inch minimum (6 in. avg)
bonded undoweled PCC overlay 20 10353
4 5 inch minimum (6 in. avg) bonded doweled PCC overlay
20 12158
5 6 inch bonded undoweled PCC overlay
20 10826
6 5 inch minimum (6 in. avg) unbonded undoweled PCC
overlay
20 10438
1 inch = 25.4 mm a) Annual inflation rate = 3.0%

BURNHAM AND RETTNER 20
FIGURE 1 Response of hot-mix asphalt test sections to 42 kN FWD load (outer wheel path).
0
100
200
300
400
500
600
0 1 2 3 4 5 6 7 8 9 10 11
Test Point
Def
lect
ion
(mic
rons
)
TS-1TS-2
BURNHAM AND RETTNER 21
FIGURE 2 Center of panel response of whitetopping test sections to 42 kN FWD load (in outer wheel path).
0
50
100
150
200
250
300
0 1 2 3 4 5 6 7 8 9 10 11
Test Point
TS-3TS-5TS-4TS-6Control
BURNHAM AND RETTNER 22
FIGURE 3 Ride quality history for TH 30 test sections.
0.0
0.2
0.4
0.6
0.8
1.0
1.2
1.4
1.6
1.8
2.0
1993 1994 1995 1996 1997 1998 1999 2000 2001 2002
Year
IRI (
m/k
m)
TS-1TS-2TS-4TS-3TS-5TS-6Control
Mn/DOT trigger threshold

BURNHAM AND RETTNER 23
PHOTO 1 Distressed joint due to high dowel bars in TH 30 test section 4.