evaluating benefits realisation management (brm
TRANSCRIPT

EVALUATING BENEFITS REALISATION MANAGEMENT (BRM)
METHODOLOGY AS A TOOL FOR IMPLEMENTING
MANUFACTURING EXECUTION SYSTEMS (MES)
Jovan Jevtic
A research report submitted to the Faculty of Engineering and the Built
Environment, University of the Witwatersrand, Johannesburg, in partial
fulfilment of the requirements for the degree of Master of Science in
Engineering.
Johannesburg, 2016

ii
DECLARATION
I declare that this research report is my own unaided work. It is being
submitted to the Degree of Master of Science to the University of the
Witwatersrand, Johannesburg. It has not been submitted before for any
degree or examination to any other University.
……………………………………
……….. day of …………….., ……………
25 September 2016
iii
ABSTRACT
This research report addresses the question: Is BRM (Benefits Realisation
Management) a valid method for MES (Manufacturing Execution Systems)
development and implementation?
While the technical aspect of implementing MES is standardised and well
documented, a clear approach to tackling the activity on a company
specific level is missing. Literature shows that there is ambiguity in where
ownership should lie and further details common organisational problems
that companies experience. Limited guidance is given to how these
problems can be tackled.
An evaluative case study is conducted at the WMMEA (WEIR Minerals
Middle East and Africa) machine shop to determine whether BRM
methodology is able to improve the MES system and its implementation by
adding a previously unexplored structure to the undertaking. The research
method focuses on two aspects of the case. The initiative, where the
researcher aims to identify whether BRM methodology is able to specify a
complete set of requirements for MES implementation. The outcomes,
where the researcher quantifies the benefits gained from the
implementation.
This report describes an adapted BRM methodology and the outcomes of
its application. These outcomes consist of the issues faced by the
company, the enablers developed to overcome these issues, and the
benefits derived from MES.
The BRM methodology is shown to be valid in the case of WMMEA by the
confirmed realisation of predicted benefits. The business objectives
achieved are an improved on-time delivery to customers and an increased
part value.

iv
CONTENTS
DECLARATION .......................................................................................... ii
ABSTRACT ................................................................................................ iii
CONTENTS ............................................................................................... iv
LIST OF FIGURES ................................................................................... vii
LIST OF TABLES ....................................................................................... ix
NOMENCLATURE ...................................................................................... x
1. INTRODUCTION....................................................................... 1
1.1. Background ............................................................................... 1
1.2. Research Question ................................................................... 2
1.3. Case Background and Context ................................................. 2
1.4. Propositions .............................................................................. 4
1.5. Scope Delimitations .................................................................. 5
1.5.1. Scope Delimitations of the MES System ................................... 5
1.5.2. Scope Delimitations of BRM ..................................................... 6
1.5.3. Delimitations of the Case Study ................................................ 7
1.6. Uncontrollable Events ............................................................... 7
1.7. Report Structure ........................................................................ 8
2. LITERATURE REVIEW ........................................................... 10
2.1. Review of Modern Manufacturing Implications ........................ 10
2.2. Review of Modern ERP and Database Structures .................. 12
2.3. Review of MES Structure ........................................................ 16
2.4. Alternatives to MES ................................................................. 17
2.5. Review of BRM ....................................................................... 18
2.6. Alternatives to BRM for MES .................................................. 20
3. THEORETICAL FRAMEWORK .............................................. 22
3.1. Standard BRM Theory ............................................................ 22
3.1.1. Strategy Map ........................................................................... 22
3.1.2. Stakeholder Management ....................................................... 23
3.1.3. Benefits Map ........................................................................... 23
3.1.4. Benefit Profiling ....................................................................... 25
3.1.5. Solution Management ............................................................. 25
v
3.1.6. Benefit Tracking and Reporting ............................................... 25
3.2. Adapted BRM Methodology .................................................... 26
3.2.1. Strategy Map ........................................................................... 26
3.2.2. Stakeholder Management ....................................................... 26
3.2.3. Benefits Map ........................................................................... 30
3.2.4. Benefit Profiles ........................................................................ 32
3.2.5. Solution Management ............................................................. 34
3.2.6. Benefit Tracking ...................................................................... 35
4. RESEARCH METHODOLOGY ............................................... 36
4.1. Participant Observation ........................................................... 37
4.2. Case Study Methodology ........................................................ 38
4.3. Case Study Design ................................................................. 39
4.4. Data Gathering ........................................................................ 39
4.5. Linking Data to Propositions ................................................... 40
4.6. Interpreting the Case Study’s Findings ................................... 41
4.7. Ethical Considerations ............................................................ 41
5. RESULTS ............................................................................... 43
5.1. Results – Proposition One ...................................................... 43
5.1.1. WMMEA-Specific Strategy Map .............................................. 43
5.1.2. WMMEA-Specific Benefits Dependency Map ......................... 45
Issues ...................................................................................... 48
System Misalignment...................................................... 48
Benefit Profiles ........................................................................ 51
5.1.3. Solution Management ............................................................. 52
Solutions Management Projects ............................................. 55
System Alignment ........................................................... 55
Sequence and Delegation ....................................................... 58
5.1.4. Benefit Tracking ...................................................................... 59
5.2. Results – Proposition Two ...................................................... 62
6. DISCUSSION .......................................................................... 69
6.1. Discussion on BRM Methodology ........................................... 69
6.2. Discussion on Proposition One ............................................... 71
6.3. Discussion on Proposition Two ............................................... 75
6.4. Validity and Reliability ............................................................. 83

vi
6.4.1. Construct Validity .................................................................... 83
6.4.2. Internal Validity ....................................................................... 84
6.4.3. External Validity ...................................................................... 86
6.4.4. Reliability ................................................................................. 86
6.4.5. Limitations of the Research ..................................................... 88
7. CONCLUSIONS ...................................................................... 90
8. RECOMMENDATIONS FOR FUTURE WORK ....................... 92
REFERENCES ........................................................................................ 93
APPENDIX A: Issue Themes (Root Causes) ........................................... 97
System Misalignment .............................................................. 97
Operator Buy-in ....................................................................... 99
Software Interface ................................................................. 100
Low-Quality Data Fed Into the System .................................. 101
Single Point of Control .......................................................... 102
Incomplete Functionality ....................................................... 103
Roles and Responsibilities .................................................... 104
Backup System ..................................................................... 105
APPENDIX B: Benefit Profiles ............................................................... 106
Lower-Level Benefits ............................................................. 106
Intermediate Benefits ............................................................ 116
Higher-Level Benefits ............................................................ 122
Company Objectives ............................................................. 128
APPENDIX C: Solutions Management Projects .................................... 132
System Alignment ................................................................. 132
Operator Buy-in ..................................................................... 134
Software Interface ................................................................. 135
Quality of Data ...................................................................... 136
Single Point of Control .......................................................... 136
Increased Functionality ......................................................... 138
Roles and Responsibilities .................................................... 139
Backup System ..................................................................... 139

vii
LIST OF FIGURES
Figure 2-1: Sources of manufacturing complexity [8]. .............................. 10
Figure 2-2: Process of adaptation [11]. .................................................... 11
Figure 2-3: Functional hierarchy [17]. ...................................................... 14
Figure 2-4: Four common ERP data integration styles [18]. .................... 15
Figure 2-5: Data modelling issues [19]. .................................................... 16
Figure 2-6: Querying and manipulation issues [19]. ................................. 17
Figure 2-7: Australian government benefits assurance review [24].......... 19
Figure 3-1: Benefits map template. .......................................................... 32
Figure 3-2: Benefit profile template. ......................................................... 33
Figure 3-3: Change action plan template. ................................................ 34
Figure 3-4: Benefit tracking template. ...................................................... 35
Figure 5-1: WMMEA derived strategy map extract. ................................. 44
Figure 5-2: Machine shop benefits map. .................................................. 47
Figure 5-3: Production systems diagram (original state). ......................... 50
Figure 5-4: Benefit L1. Decrease MES downtime impact. ........................ 52
Figure 5-5: Change action plan for MES. ................................................. 54
Figure 5-6: Preferred (end) state systems diagram. ................................. 57
Figure 5-7: WMMEA benefit tracker. ........................................................ 61
Figure 5-8: Example of data manipulation. .............................................. 64
Figure 5-9: Example of data gathered through primary observation. ....... 65
Figure 5-10: Questionnaire example. ....................................................... 67
Figure 5-11: Example of data gathered through structured interview. ...... 67
Figure 6-1: Unforeseen measurement. .................................................... 77
Figure 6-2: Early win. ............................................................................... 79
Figure 6-3: "Exciting" benefits. ................................................................. 80
Figure 6-4: Benefit chains of company objective "O1". ............................ 81
Figure 6-5: Trend in company objectives. ................................................ 82
Figure A-1: Production systems diagram (original state). ........................ 98
Figure B-1: Benefit L1. Decrease MES downtime impact. ..................... 107
Figure B-2: Benefit L2. Improve system reliability. ................................. 108

viii
Figure B-3: Benefit L3. Decrease number of complaints. ....................... 109
Figure B-4: Benefit L4. Increase accuracy of data. ................................ 111
Figure B-5: Benefit L5. Increase number of contact points. ................... 112
Figure B-6: Benefit L6. Increase manufacturing flexibility. ..................... 113
Figure B-7: Benefit L7. Reduce administrative workload. ...................... 115
Figure B-8: Supporting benefit S1. Decrease consulting costs. ............. 115
Figure B-9: Benefit I1. Increase usage. .................................................. 117
Figure B-10: Benefit I2: Improve decision making ability. ...................... 118
Figure B-11: Benefit I3. Increase usage for decision making. ................ 120
Figure B-12: Benefit I4. Decrease response time. ................................. 121
Figure B-13: Benefit H1. Improve schedule adherence. ........................ 123
Figure B-14: Benefit H2. Reduce the age of WIP. .................................. 124
Figure B-15: Benefit H3. Decrease production time variances............... 125
Figure B-16: Benefit H4. Increase machine availability. ......................... 127
Figure B-17: Objective O1. Maximise availability and OTD. .................. 129
Figure B-18: Objective O2. Maximise part value. ................................... 131
Figure C-1: Preferred (end) state systems diagram. .............................. 134
Figure C-2: Sample display - Production state overview. ....................... 137

ix
LIST OF TABLES
Table 5-1: System misalignment symptoms ............................................ 48
Table 5-2: Time periods ........................................................................... 60
Table 6-1: Common organisational issues ............................................... 72
Table A-1: System misalignment symptoms ............................................ 97
Table A-2: Operator buy-in symptoms ..................................................... 99
Table A-3: Software interface issue symptoms ...................................... 100
Table A-4: Low quality data fed into the system symptoms ................... 101
Table A-5: No single point of control symptoms ..................................... 102
Table A-6: Incomplete functionality symptoms ....................................... 103
Table A-7: Roles and responsibilities symptoms.................................... 104
Table A-8: Backup system issue theme symptoms ................................ 105

x
NOMENCLATURE
B2MML – Business to Manufacturing Markup Language
BPR – Business Process Re-engineering
BRM – Benefits Realisation Management
CIM – Computer Integrated Manufacturing
DIMS – Dynamically Integrated Manufacturing System
ERP – Enterprise Resource Planning
GAMP – Good Automated Manufacturing Practice
GUI – Graphical User Interface
HTML – HyperText Markup Language
IoT – Internet of Things
ISA – International Society of Automation
IT – Information Technology
JSE – Johannesburg Stock Exchange
KPI – Key Performance Indicator
MES – Manufacturing Execution Systems
MESA – Manufacturing Enterprise Solutions Association
MRP – Material Requirements Planning
MRPII – Manufacturing Resource Planning
MTO – Make to Order
MTS – Make To Stock
OEE – Overall Equipment Effectiveness
OTD – On Time Delivery
RCA – Root Cause Analysis
ROI – Return on Investment
S&OP – Sales and Operations Planning
SMS – Short Message Service
SQL – Structured Query Language
WIP – Work in Progress
WMMEA – Weir Minerals Middle East and Africa (Company)
XML – eXtensible Markup Language
ZAR – South African Rand

1
1. INTRODUCTION
1.1. Background
Manufacturing methods and processes evolve as materials, technology,
and customer needs develop. Bi et al. [1] state that computing technology
in particular has led to mass redevelopment of numerous manufacturing
and general enterprise functions.
The idea of integrated production systems began to pick up in the late
1970s. Attaran [2] highlights early success case studies from well-known
technology companies such as Motorola, Allen Bradley, and Texas
Instruments. His discussion however focuses on the high rate of
implementation failure and the technical and organisational reasons
behind these failures. The term Manufacturing Execution Systems (MES)
emerged in the early 1990s. The book by Meyer et al. [3] gives an
overview of all aspects of modern MES systems. They frame these as
production oriented Information Technology (IT) systems used to support,
in real time, processes in complex or dynamic environments. They also
explain the various integration standards and technologies that have,
since Attaran’s report (1997), emerged to overcome the technical
integration issues. Many of the organisational issues plaguing MES
implementations are however still present.
This report investigates whether Benefits Realisation Management (BRM)
is a valid methodology for MES development and implementation. BRM
(as defined by Bradley [4]) is a method used for specifying and monitoring
change initiatives (or projects). It is based on ensuring the required
benefits are derived from these initiatives. BRM usually focuses on higher-
level company objectives and draws a causal link between these and the
lower-level initiatives taking place in the company. While BRM is
applicable in the broad field of programme management, its chief
application has been in IT projects. Doherty et al. [5, p8] explain this
applicability saying: “Technologically-mediated organisational changes
(such as MES) come in all shapes and sizes. For example, an

2
organisation is far more likely to realise benefits from its new (Enterprise
Resource Planning) ERP implementation if it explicitly redesigns its
working practices to more closely reflect the process model embedded in
the system”.
The keystone of this evaluation is an MES implementation case study at
the Weir Minerals Middle East and Africa (WMMEA) machine shop.
1.2. Research Question
This research report addresses the question: Is BRM a valid method for
MES development and implementation?
The report addresses the question through a case study at WMMEA and
lays the groundwork towards answering the question on a generalised
scale. The results of this research could in turn contribute to the
development of a best practise methodology for MES implementation,
recognizing that a single case study is insufficient to generalize for all MES
implementations. The following sections of this chapter aim to put the
question into context by defining the case, its boundaries, and the
propositions posed.
1.3. Case Background and Context
This case study is based on an MES realignment project done in the
WMMEA machine shop.
WMMEA produces and maintains equipment used in the mining mill-
circuit. Major components of this circuit are slurry and dewatering pumps.
WMMEA manufactures key components for these pumps. The WMMEA
machine shop falls into the small lot and Make-To-Order (MTO) category
of manufacturing:

3
Average part weight = 141kg (Sample deviation = 214).
Average part cost = ZAR 7’306 (Sample deviation = 10’898).
Average batch size = 5.6 units (Sample deviation = 9.4).
[Order book snapshot for September 2014].
The machine shop where this takes place already had an MES system
installed but this system was perceived as not working optimally. An MES
realignment project was undertaken to identify the shortfalls of the system
and then bring it into line with the company’s business objectives. This
report avoids going into what went wrong in the initial implementation and
focuses only on the realignment initiative.
WMMEA manages its data and operations through a BAAN ERP system
from Infor. The underlying relational database management system is from
the Oracle Corporation. Integration with the MES system is achieved
through data staging tables. This method uses a query language to
populate an intermediate “staging” table with data that needs to be
processed into MES or into the ERP (also known as the remote procedure
invocation model to be described further in the “Literature Review”
chapter). The MES system features a HyperText Markup Language
(HTML) based Graphical User Interface (GUI) and the database is based
on Microsoft’s Structured Query Language (SQL) server software.
As noted earlier, BRM was selected as the preferred methodology for
implementing MES at WMMEA. While BRM has been generalised for
software implementation, it has never (based on the available literature)
been applied to the specific context of MES. WMMEA was willing to
consider BRM as an approach, warranted by the complex integration
specification required by MES systems.
Root Cause Analysis (RCA) was used extensively for identifying the
reasons for the initial unsatisfactory implementation. RCA will however not
be covered extensively in this report as it is not inherently a precursor to
BRM initiatives.
4
1.4. Propositions
Two propositions are presented. In order to answer the research question,
both have to be shown to be true.
1. It is possible to apply an adapted BRM methodology to specify the
requirements of MES systems for the WMMEA machine shop.
This proposition focuses on the initiative. It requires the report to track
the implementation from start to finish giving the reader insight into the
real event that took place over time, the people who were involved,
and the way tasks were handled. Most importantly, it evaluates
whether the company was able to apply the methodology and whether
the methodology was adhered to. The adaptation and reason for
adaptation is detailed in the “Theoretical Framework” chapter that
follows.
In order to determine if the methodology has been applied correctly,
the following must be met:
All of the steps specified by the methodology have been taken.
In the requirement specification, there is a causal link chain
between all enablers and WMMEA's company objectives.
Stakeholders work to execute the requirements at WMMEA,
until the system reaches a new baseline level. The details of the
requirements execution are out of the scope of this report.
2. The benefits predicted by the BRM methodology have been realised.
This proposition focuses on the outcomes. There is both a quantitative
and qualitative aspect to this proposition.
The quantitative perspective is a measurement of the extent to which
the benefits of MES at WMMEA have been realised. The report is
required to show that the change in the predicted benefits is in the
desired (and predicted) direction.
The following points need to be taken into account:

5
All benefit measurements are defined and put in place.
The frequency of measurements is not specified due to the
practicality of obtaining the measurements. More data points
are preferred but at least two are essential to show a trend.
Note any points in time when a step change in the system is
instated or an event that will influence system behaviour occurs.
From a qualitative perspective, the report needs to confirm the validity
and reliability of the predicted causal links.
The following points need to be taken into account:
Summarising the measurements on the benefit tracking
template in order to analyse the relationship between benefits
over a common time frame. While the main (quantitative)
analysis focuses on the trend of individual benefits, identifying
potential relationships between benefits gives added assurance
that these trends are not coincidental.
Although there are no benchmarks for the extent to which a
benefit should change, this extent should nevertheless be
considered for validity purposes.
The researcher, acting as a participant observer within the
company, is to give his opinion on any events or measurements
he feels could be misleading to the reader.
1.5. Scope Delimitations
This section presents the boundaries of the case study.
1.5.1. Scope Delimitations of the MES System
The Manufacturing Enterprise Solutions Association (MESA) [6] identifies
11 potential functions of MES systems. The system under consideration at
WMMEA however only performs the first four (a short elaboration is given
for how each function is handles at WMMEA):

6
Resource Allocation and Status – Handled by WMMEA’s MES
system.
Process Management – Handled by WMMEA’s MES system.
Performance Analysis – Handled by WMMEA’s MES system.
Data Collection/ Acquisition – Handled by WMMEA’s MES system.
Operations/ Detail Scheduling – Performed by a separate,
integrated, package. Queue length is an input from MES.
Dispatching Production Units – Performed by the ERP.
Document Control – Performed by the ERP.
Labour Management – Performed by a separate, standalone,
package.
Quality Management – Performed by a separate, integrated,
package.
Maintenance Management – Performed by a manual system.
Product Tracking and Genealogy – Not a machine shop
requirement.
1.5.2. Scope Delimitations of BRM
This report focuses on the application of an adapted BRM methodology for
MES system implementation and the measurement of derived benefits.
Generally however, a major aspect of BRM methodology is the Return On
Investment (ROI) calculation. ROI is a company specific analysis of the
cost associated in implementing the system, weighed out against the
benefits. ROI considerations will not be addressed in this report.

7
1.5.3. Delimitations of the Case Study
The initiative underlying this report is company specific. There was an
opportunity to study a single implementation at a single company. The
inputs and outcomes to the initiative are limited to only what was needed
to satisfy the company objectives; and as a result, considerations that may
be valid in other environments are not taken into account.
There is no control or alternative method under consideration. It is
therefore not possible to benchmark the relative effectiveness of the
methods described in this report against other methodologies.
No benchmark is specified for the benefits to be gained. MES system
providers do estimate the benefits their systems will bring. These
estimates are usually in the form of high level benefits such as productivity
or ROI. The researcher is unable to reliably compare these to the
company objectives. Benchmarks for the lower level benefits are
unavailable. In addition, Scholten [7] suggests that much of this data could
stem from biased sources.
1.6. Uncontrollable Events
Two major uncontrollable events affected the implementation of the MES
system under consideration.
The initiative was launched in November 2013. In March 2014,
while the project was underway, the company underwent a major
ERP change. This resulted in the majority of the MES system
having to be turned off for 3 months until the changes were
complete. Furthermore, there is a learning curve to the company
familiarising itself with the new ERP. The researcher suggests that
this may have had unknown effects on total system performance as
far as a year after implementation.
Strike action in July 2014 lasted 4 weeks during which time the
company fell behind on its targets. The MES system was online,

8
however the company focus had shifted from system
implementation to catching back lost production. Dedicated focus
on the MES initiative was only resumed at the start of January
2015.
1.7. Report Structure
This report is a case study evaluation. The aim of such a report is two-fold.
Firstly, it details the complex initiative and the environment in which it took
place. Because the case is not a completely controlled event, it is
important that the reader understands the shortfalls and opportunities that
lead to the described outcomes. Secondly, it details the results obtained in
the initiative and evaluates them using various methods. This is required
because there is no single, perfectly defined, mathematical relationship
which is able to capture complex social activity.
The structure is as follows:
Chapter 1 presents a discussion on the research question and its
importance. The question is stated formally, the case and its
limitations are defined, and propositions are developed against
which the question will be evaluated.
The literature review in Chapter 2 takes the reader through the
current state of the art with respect to modern manufacturing, ERP
& manufacturing data management, MES systems, and BRM. In
doing this, it highlights the integration gap that this research
addresses.
Two theoretical concepts dominate this report. MES systems and
BRM methodology. With regard to MES systems, this report
focuses mainly on the benefits that they provide. It does not detail
their working further than what is necessary for understanding the
concept. In order to evaluate the applicability of BRM methodology

9
however, it has been detailed in Chapter 3. These details dictate
each of the steps taken by the company during the initiative.
Chapter 4 explains case study research methodology for
evaluations. The use of appropriate methodology is essential for
ensuring the validity and reliability of research findings.
Chapter 5 details the results. For the first proposition, these are the
outcomes of the applied methodology. For the second, these are
the benefit measurements.
Chapter 6 discusses the results with respect to the propositions. It
also addresses issues of validity and reliability.
Chapter 7 concludes the outcomes of the research and answers the
research question.
Finally, Chapter 8 discusses the researcher’s ideas about where
this research could lead.

10
2. LITERATURE REVIEW
This literature review is structured such that it will lead the reader from the
current issues affecting the small lot and MTO manufacturing environment;
then through the uses and shortfalls of current ERP and database systems
employed by companies; and toward the requirements for MES system
implementation. The last part of the literature review summarises BRM
methodology and explains why it may have potential for use with system
implementation such as MES.
2.1. Review of Modern Manufacturing Implications
Increasing complexity is one of the biggest challenges facing
manufacturing today. El Maraghy et al. [8] summarise the various sources
of complexity in Figure 2-1, showing the four categories that drive
complexity:
External pressures such as standards and legislation
Market forces
Product & Hard Enablers
Process & Soft Enablers
Figure 2-1: Sources of manufacturing complexity [8].

11
Bullen [9] explains that the small batch plant MTO industry has largely
been hit with customer demand for smaller runs and custom-designed
products which favours agile and adaptive workplace models. What
follows are some methods and best practices being used by companies to
meet these sometimes conflicting, interrelated, and very complex
requirements.
Zhang et al. [10] show that historical practices are no longer adequate in a
rapidly changing manufacturing environment. Alternative system
configurations and structures must be considered when the current system
is no longer able to meet challenges in the market. Many technologies,
operating systems, and paradigms have been developed in response.
A paper by Belisario and Pierreval [11] outlines a framework to
characterise systems that aim at quickly or continuously modifying their
production facilities to changing environments. The framework is based on
the process of adaptation (Figure 2-2) which shows how the adaptation of
companies has a knock-on effect on its competition, environment, and
customer behaviour.
Their framework proposes a function consisting of seven parameters:
1. Change object(s). 2. Type(s) of change. 3. Information used. 4. Triggering strategy. 5. Organisational structure. 6. Changing mechanism. 7. Objectives.
Figure 2-2: Process of adaptation [11].

12
Bullen [9] mentions the following as enablers to achieving this state of
adaptability: Integrated Product Process Design; and Advanced Analytics
such as Multi-Disciplinary Design Analysis Optimization, Actionable
Intelligence, Factory Command and Control, and Expert Systems. An
example of a truly responsive system is a Dynamically Integrated
Manufacturing System (DIMS) as described by Zhang et al. [10]. Their
DIMS model allows tasks to be planned to satisfy delivery time at
optimised cost; and alternative system configurations and structures to be
considered when market conditions change. Al-Aomar [12] suggests that
due to the increasing complexity of operations, new techniques (such as
discrete event simulation) for creating and managing performance metrics
are required. All of these methodologies, paradigms, etc. add levels of
complex computer-based systems.
2.2. Review of Modern ERP and Database Structures
As companies get larger and increase in complexity, the number of
transactions and quantity of data they must process and store increases
beyond the management and communication ability of single-client
software. ERP software is generally a suite of tools used by businesses to
manage and "make sense" of the large amounts of data they generate.
Maedche [13] explains that one major goal of ERP systems is to integrate
all the relevant master and transactional data of the enterprise and let
people and processes operate on the same data.
Rashid et al. [14] detail the evolution of ERP systems saying they began in
the form of Material Requirements planning (MRP) and Manufacturing
Resource Planning (MRPII); that they were traditionally developed for
manufacturers; and that they were primarily for inventory and
manufacturing management. Hawking et al. [15] discuss the primary
benefits a modern packaged ERP business solution is expected to deliver.

13
These are:
1. Improved management decision making. 2. Improved financial management. 3. Improved customer service and retention. 4. Ease of expansion and increased flexibility. 5. Faster, more accurate, transactions. 6. Headcount reduction. 7. Cycle time reduction. 8. Improved inventory and asset management. 9. Fewer physical resources and better logistics. 10. Increased revenue.
They note that these benefits are however often not achieved in the initial
implementation due to lack of skill and experience with the new systems
(49% of companies considered ERP implementation as a continuous
process). Meyer et al. [3] however say that many of these goals are over
ambitious for MRP which has settled in as being software for automating
accounting and administrative systems.
In the previous section on modern manufacturing, it is noted that to remain
competitive, firms must be agile and responsive. This is however often in
conflict with ERP systems, which have evolved to have rigid structures (to
promote reliability) and which may not lend themselves well to the modern
manufacturing requirements. Bi et al. [1] identify the ultimate shortcomings
of modern enterprise systems noting that they are incapable of dealing
with change or uncertainty, have software and hardware that is not suited
to flexibility, do not allow for virtual collaboration, and are not designed for
sustainability. They suggest that the emerging Internet of Things (IoT)
infrastructure can support information systems of next generation
enterprises more effectively.
So far, the discussion on ERP has identified its purpose and also its
limitations. Beach et al. [16] explain that many suppliers of ERP software
now develop their systems around third-party industry standard database
engines. This enables enterprises to use common high-level query
languages like Microsoft SQL and Oracle SQL to develop or integrate
operational specific applications such as MES. The International Society of
Automation (ISA) [17] has compiled the ISA95 standard for Enterprise

14
Control System Integration. This standard defines a functional system
hierarchy (Figure 2-3) and the boundaries between each level in the
hierarchy. Typically, ERP systems would reside on level 4 while MES
systems would reside on level 3. A company that adheres to this standard
would therefore handle the functions that reside on level 4 using its ERP
and those that reside on level 3 using its MES. Purchasing an ISA95
compliant MES would not pose an integration issue to an ISA95 compliant
company, because all date inputs and outputs at the boundaries of the
systems match. It is however common to see companies deviating from
this standard (WMMEA is an example). There are many reasons. The
company, in its early days, may not have foreseen a need for adherence
to it; the company’s systems may predate the standard; or the company
may have had to customise its structure to accommodate other un-
adhering systems.
Figure 2-3: Functional hierarchy [17].

15
Integration between ERP systems and operational-specific applications
like MES can be done in numerous ways depending on the desired
outcome. RKL eSolutions [18] summarise four common methods for data
integration with the Sage 500 ERP, but they can be applied to any ERP
running on a relational database. These are:
1. File-based data exchange
2. Remote procedure invocation
3. Direct database integration
4. Messaging
They present the positive and negative aspects of each in Figure 2-4.
Figure 2-4: Four common ERP data integration styles [18].

16
2.3. Review of MES Structure
As defined before, MES are production oriented IT systems used to
support, in real time, processes in complex or dynamic environments.
Scholten [7] explains that due to unique requirements from various
manufacturing operations, MES solutions will usually require some level of
customisation. When picking vendors, an important aspect to consider is
the amount of customisation that will be needed. To this end, she provides
some useful tools for comparing customisation requirements between
vendors.
Typical MES systems use object-based data models in order to manage
the complex interrelationships between the various data parameters. This
in turn leads to database requirements that are not typical of most
business database models. Kappel and Vieweg [19] describe the key MES
database requirements. They refer to the systems as Computer Integrated
Manufacturing (CIM) but the functions they describe are predominantly
those of modern MES. Their paper was written in 1994 when MES was still
an emerging acronym. They discuss the following:
Data modelling requirements (Figure 2-5) – Extended attribute
domains, complex object support, relationships and dependencies,
and active consistency checking and knowledge base support.
Figure 2-5: Data modelling issues [19].

17
Querying and manipulation requirements (Figure 2-6) –
Advanced transaction management, flexible database access,
change management, and interfaces.
Integration requirements – Distributed data management, multi
data management, reverse engineering of data, and integrated data
and process modelling.
Meyer et al. [3] explain that to make their systems simpler to integrate into
a company’s existing structure, vendors will often aim to make their
systems platform independent, scalable, and compliant with various
integration standards. Scholten [7] adds that eXtensible Markup Language
(XML) is currently the most modern method of exchanging information.
Business to Manufacturing Markup Language (B2MML) is an XML based
approach that uses metadata specified by ISA95 in order to make
implementation intuitive.
2.4. Alternatives to MES
Christo and Cardeira [20] suggest that modern manufacturing systems
(such as MES) require high investments, long lead times, and complex
structures. This can lead to loss of flexibility, loss of reconfiguration
capabilities, and high costs to make small changes. This is opposing to the
needs of modern-day manufacturing. As an alternative, they highlight the
potential of intelligent fractal, bionic, or holonic systems. They motivate the
adoption of these systems, but recognise that there is still a need for
further development in the fields of intelligent mechatronic components,
software agents, and networks.
Figure 2-6: Querying and manipulation issues [19].

18
2.5. Review of BRM
The BRM methodology that will be applied in this research is based on
Bradley [4]. Bradley's aim is to shift culture from using BRM to justify the
business case to using it as a tool for driving benefits. He has compiled
over 20 years of his company's experience into a detailed framework for
approaching project, programme, and portfolio management. Bradley’s
approach BRM can be summarised as follows: BRM is a process that
engages stakeholders in order to first identify the cause and effect
relationships between the initiatives they are undertaking, the benefits they
expect from these, and the company high-level objectives; and then to
structure and measure the initiative with regard to the benefits.
The literature review found many additional views towards BRM which are
worth noting in order to compile a broader picture of the methodology and
its application:
Jenner [21, p1] identifies “a series of cognitive biases and
organisational factors that adversely impact the production of
accurate and reliable benefits forecasts and business cases”. He
suggests that this is a reason that organisations struggle to
demonstrate a return on their investments in change and therefore
need more formalised strategies. BRM is one such strategy.
Bolloni [22, 2] summarises the effect of BRM as follows: “BRM
provides a mechanism to lead the program always to be focusing
on the business benefits to be realized, on the influencing factors
and possible dependencies, on the required capabilities to achieve
the stated objectives, and only at the end the technical solution is
elaborated as a natural consequence of this progressive shift of
thinking from the strategic objectives to the program deliverables”.
BRM methodology can be adapted to various environments. Ashurst and
Doherty [23] outline an approach for benefits realisation in IT projects.
They explain the need for this by stating that IT development projects are
traditionally looked at as technical rather than socio-economic change.
This traditional approach fails to account for the necessary human and

19
organisational changes needed to deliver meaningful benefits. They use
the example of ERP introduction. Their approach is however generalised
and could be considered for IT projects such as the introduction of MES.
A related note regarding adaptability to various environments. The desired
outputs of the BRM process can vary based on an organisation’s need.
Figure 2-7 is a comprehensive benefits assurance review process as
compiled by the Australian government [24]. It shows the review process
along with the required outputs at each stage of an initiative.
Figure 2-7: Australian government benefits assurance review [24].

20
There is evidence to suggest that BRM methodology is gaining popularity
in the local (South African) environment. Marnewick and Labuschagne [25]
have analysed the adoption of BRM as part of program management in
JSE-listed South African companies. They conclude that while benefits
management is only partially practised in industry, program managers are
largely in support of introducing the theory.
Finally, it should be mentioned that literature also offers criticism of the
BRM methodology. Breese [26] suggests that the BRM process is open to
being played out in an ambiguous and contested manner which, in “the
real world” may undermine the solid scientific framework on which it was
designed. He comments [26, p34]: “unless theories underpinning BRM
develop beyond the scientific approach of the ‘modern paradigm’ there is a
danger that BRM methods will fail to reflect the complexity of the
management challenges facing organisations”.
2.6. Alternatives to BRM for MES
In the introduction it is mentioned that MES implementations have
traditionally been hampered by technical and organisational issues. The
literature review has explained some of the ways in which the technical
issues have been addressed. The organisational issues however have not
been addressed as extensively. The book by Scholten [7] goes into more
practical detail on what companies can expect from MES. She presents
the Good Automated Manufacturing Practice (GAMP) “V model” as the
accepted methodology for MES implementation. This is a technical
approach that doesn’t fully address organisational issues. She discusses a
number of issues including scope, customisation, and acceptance by
users. Her focal organisational concern is the blurred line between which
organisational departments need to be responsible for the various aspects
of the system.
While there are various potential approaches, the researcher is not able to
find any comparative or best practise information. One example of an

21
alternative methodology is presented by the information technology
provider Cognizant [27]. They suggest that agile methods, like Scrum, are
the best practise for MES rollout.
A paper that draws some similarities with the topic of this report is written
by Liu and Chen [28]. They investigate Business Process Re-engineering
(BPR) as a supplement to the technical implementation of CIM. This is an
important paper because it recognises that CIM implementation is unique
in that it requires elements of both “discontinuous” (step-like) and
continuous process change. BPR is referred to here as a management
discipline rather than a technical method; and it proposes similar
outcomes to those proposed by BRM methodology. Similarly to BRM, BPR
scopes implementation as requiring parallel process and system change.
The approach to stakeholder management is also similar with both
methods placing responsibility on employees directly involved in using or
implementing the system. While the methods have similarities, they differ
on how requirements are specified. The BPR method considered here
places much design consideration on customer requirements. BRM on the
other hand focuses primarily on company objectives, with cause and effect
measurements being done more strictly than in the BPR method. While
their paper is based on a case study, it does not mention the ultimate
outcomes of the CIM implementation. It also does not segment MES from
CIM in general. More information is therefore needed to perform a direct
comparison between BPR and BRM for MES implementation.
22
3. THEORETICAL FRAMEWORK
The “Literature Review” chapter discusses the various considerations to
MES systems. It converges onto the issue of integration, which while
technically well defined, fails to adequately address organisation specific
issues that commonly arise during the MES implementation. On a
separate note, the “Literature Review” chapter discusses BRM
methodology and its applicability in managing programs where technical
and social considerations need to be dealt with in parallel. This chapter
expands on BRM methodology, which is used in this case study, to
implement MES at WMMEA.
From this point forward, any time that standard BRM methodology is
mentioned, it will refer to the methodology as described by Bradley [4].
The chapter consists of two parts. The first summarises accepted standard
BRM theory. The second part is an adaptation of this methodology,
compiled by the researcher, for the purpose of MES system development
and implementation.
3.1. Standard BRM Theory
BRM theory is well defined and extensive. For the purpose of this report,
the researcher summarises the aspects of theory that are most relevant to
this report. A summary of the key stages in the BRM methodology follows
in sections 3.1.1 to 3.1.6.
3.1.1. Strategy Map
The strategy map outlines the goals of the company on a macro scale.
These are goals such as compliance with certain environmental
regulations, profit targets, or accreditation requirements. These would then
be linked to numerous strategies which contribute to these targets in a
cause and effect relationship.
23
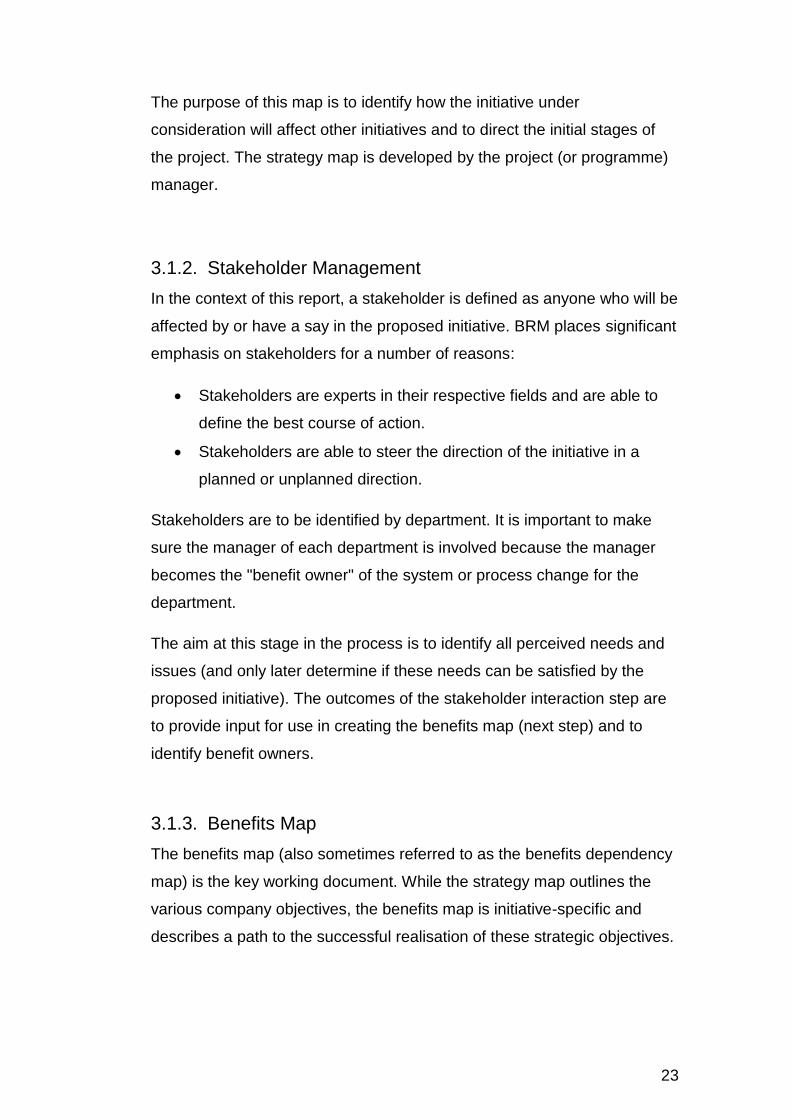
The purpose of this map is to identify how the initiative under
consideration will affect other initiatives and to direct the initial stages of
the project. The strategy map is developed by the project (or programme)
manager.
3.1.2. Stakeholder Management
In the context of this report, a stakeholder is defined as anyone who will be
affected by or have a say in the proposed initiative. BRM places significant
emphasis on stakeholders for a number of reasons:
Stakeholders are experts in their respective fields and are able to
define the best course of action.
Stakeholders are able to steer the direction of the initiative in a
planned or unplanned direction.
Stakeholders are to be identified by department. It is important to make
sure the manager of each department is involved because the manager
becomes the "benefit owner" of the system or process change for the
department.
The aim at this stage in the process is to identify all perceived needs and
issues (and only later determine if these needs can be satisfied by the
proposed initiative). The outcomes of the stakeholder interaction step are
to provide input for use in creating the benefits map (next step) and to
identify benefit owners.
3.1.3. Benefits Map
The benefits map (also sometimes referred to as the benefits dependency
map) is the key working document. While the strategy map outlines the
various company objectives, the benefits map is initiative-specific and
describes a path to the successful realisation of these strategic objectives.

24
While the strategic objectives might be measurable, it is often impractical
to determine whether the achievement of the strategic goal is due to a
specific initiative or due to factors outside of the scope of the initiative.
However, the measured benefits on the benefits map are more directly
related to the implementation of the initiative. The benefits map is created
in three stages:
1. The benefits. These start from higher-level benefits that have a direct
correlation with the strategic objective (likely to be the benefits that
upper management would consider when creating the business case
for an initiative). These then filter down to lower-level benefits (such as
local department Key Performance Indicators (KPIs)) until they link in
with the enablers in stage 3 below.
2. The proposed system to be implemented. The system's elements
are described. Example: In the case of an ERP system
implementation, this section would list the various modules that the
system is comprised of (purchasing, warehousing, etc.).
3. The business changes required to integrate the system into the
company, and so realise the benefit (this section is done in parallel
with the solution management stage to be discussed below). These are
the link between the systems and the benefits.
To make it easier for the user when creating the benefit map, BRM
methodology recommends the use of colour coding for links, enablers,
benefits, and strategic objectives. For example a blue link would indicate a
positive relationship to the benefit and a red link would indicate a negative
relationship (a dis-benefit).

25
3.1.4. Benefit Profiling
A benefit profile is created for each benefit. This includes a detailed
description of the benefit, its related benefits, its target state, the benefit
owner(s), and it specifies how the benefit is to be measured.
3.1.5. Solution Management
The solutions (or the enablers) then need to be detailed (before they can
be implemented in a company to create positive benefits). The solution
management template details the enabler, system change, supporting
initiatives, benefit owners, and the associated benefits and dis-benefits.
The enablers are then incorporated into the benefits map along with links
to their associated benefits.
3.1.6. Benefit Tracking and Reporting
Benefits must be measured and monitored. The measurement criteria form
part of the benefit profile.
Ideally, benefits are defined in such a way that they are measurable
(quantitative data). I.e. benefits are usually described with words
like "increased", "reduced", "achieve", "maintain", etc.
They are usually initiative-specific, meaning that any change in the
measurement can be attributed to the initiative taking place.
It generally isn’t necessary to track each benefit, but the more benefits that
are tracked, the easier it becomes to identify failure mechanisms and
control outcomes. Tracking intermediate benefits makes it easier to
pinpoint where in the benefits map problems (or broken links) lie. Typical
deterrents to extensive tracking measures are time to implement and the
cost of measurement.

26
3.2. Adapted BRM Methodology
In section 3.2.1 – 3.2.6 the researcher specifies his adaptations to the
BRM methodology. This is done to make the method better suited for the
specific case of MES system development and implementation. The
researcher furthermore narrows the broad body of BRM knowledge into a
specific, step like, methodology which can be applied in companies that do
not have a BRM program. The adaptations in the methodology follow.
3.2.1. Strategy Map
The strategy map is not so much an adaptation as it is an extraction of the
company strategy map. Using an extract shortens the process while still
giving sufficient information to work with. This extract includes the strategic
objectives that are the key focus of MES as well as any objectives which
will be affected by (or have an effect on) MES. This is done to give the full
picture of the cause and effect relationships in play during the
implementation. This step is done by the project or programme manager.
The resulting objectives will be used to develop the benefits map.
Note: the company objectives are set at the highest levels of management
at the company, and are assumed correct. The setting of these objectives
is outside the scope of this initiative.
3.2.2. Stakeholder Management
This section identifies the stakeholders typically affected by the MES
system. It also details the recommended interaction with these
stakeholders and the expected support from these stakeholders.
Scholten [7] explains that the ultimate ownership of MES systems lies with
the production department. Responsibilities during implementation are
however not clear. A focal point of BRM is to create benefit owners who
are both responsible for and involved in daily system operation. The

27
adapted methodology aims to identify the ultimate benefit owners up front
so that they are not left out of the initial system justification and design.
This way the ownership of the system is never passed over.
Stakeholders are identified by department and interactions are conducted
via workshops. They are referred to as workshops rather than meetings
because of the amount of participation and development that is expected
to take place.
Regarding the initial workshops:
They are department-specific and include at least one member
responsible for each of the department’s tasks. It is important to
make sure the department manager is involved because he will
become the MES benefit owner for that department.
The context of the workshop is set, but the workshop should be
conducted as a brainstorming session. The aim is to identify all
perceived needs and issues, and only later determine if these
needs can be satisfied by the MES system.
The issues and needs are ultimately to be consolidated into
themes and benefits. These form the issues and lower-level
benefits sections of the benefits map (see “Benefits Map” section).
Regarding the subsequent workshops:
These sessions are used to present the compiled benefits map to
all the initial workshop participants.
They are cross-departmental so as to put the map into context
across the company.
They provide a platform to do finishing touches such as closing any
gaps that have been left open or resolving any clashing
requirements that have been created.

28
They create an understanding of the mechanisms in which MES
will benefit the company.
All this in turn will lay the foundation for the solution management
section of the work (see “Solution Management” section).
The stakeholder list below is compiled by department. Each department
will have a number of key stakeholders (those who will have an impact on
the development or running of the system) and a benefit owner (the one
who will be accountable for the realisation of the predicted benefits relating
to his area of work).
General management: This will typically be the project sponsor.
General management is likely responsible for the final form and
format of the strategy map. Note that general management does
not need to be involved in the development and implementation of
the system. General management will likely be responsible for the
budget allocation and be interested in the higher-level benefits that
the system will deliver.
Continuous improvement (lean or projects) department: This
department will take on the project management responsibilities of
the MES implementation. They facilitate and provide resources. No
system requirements should be specified by this department above
what was developed in the workshops. Stakeholders at this level
are:
o Project or programme manager (benefit owner): Tasked
with the continuous monitoring of all benefits and addressing
major issues that arise.
o Process engineer(s) (key stakeholder(s)): Tasked with
assisting departments complete their projects. These will
deal with project details, procurement, and interdepartmental
collaboration. They also manage software development and
collaboration with the software providers.

29
Planning department: This department will be responsible for
designing the system flow diagram (how information flows
throughout the system) and for integration of planning (e.g.
scheduling) systems with the MES system. Stakeholders are:
o Planning manager (benefit owner): Tasked with ensuring
company systems integrate with MES and with maintaining
data integrity.
o Systems engineer(s) (key stakeholder(s)): Tasked with
integrating company systems with MES.
IT department: This department oversees the enabling functions.
They will provide hardware, software, and data (E.g. servers,
terminals, user credentials, and supporting software). Stakeholders
are:
o IT Manager (benefit owner): Tasked with approving and
communicating the service agreement with the IT team.
o IT Support (key stakeholders): Tasked with responding to
system requests.
Finance department: This department is responsible for designing
the system’s hours reporting rules and procedures. They would
ensure accurate integration between the MES and ERP (or other
similar) systems. Stakeholders are:
o Finance (or costing) manager (benefit owner): Tasked
with designing and auditing the costing integration process.
o Costing administrator(s) (key stakeholder(s)): Tasked
with capturing, reconciling, and reporting on the daily system
outputs.
Machine shop production department: This department will be
the system owner. They are charged with the day-to-day operations
of the system and ensuring that it runs at optimum capacity at all
times. Stakeholders are:

30
o Machine shop manager (benefit owner): Tasked with
ensuring all applicable processes and procedures run
through the MES system. He ensures that all the front line
users are trained and enabled to use the MES system.
o Machine shop administrator(s) or shift leader(s) (key
stakeholder(s)): Tasked with addressing day to day system
issues, highlighting problems, as well as maintaining clean
system data (housekeeping).
o Machine shop operator(s) (key stakeholder(s)): Tasked
with the daily usage of the system as well as to participate in
certain development activities.
3.2.3. Benefits Map
The benefits map (or benefits dependency map) (See template in Figure
3-1) is to become the key working document. Decision making and
solution design will be based on the information on the map.
The benefits map is compiled as follows:
The benefits map(s) is designed in an easily-sharable format (e.g.
A3 format) to facilitate collaboration and present an amount of
information that can be easily recalled by all stakeholders.
The objectives that lead out of the strategy map are to be placed in
the objectives section on the far right.
The issues taken down during the workshops are summarised into
issue themes. Each issue theme forms a block in the far left
"issues" section. The individual issues that form that specific issue
theme are summarised inside the block (these could also be looked
at as a root cause with accompanying symptoms). The issues
section replaces the traditional systems section, where a generic
predefined system would typically be described. This section of the
benefits map is the key adaptation of the map for the purpose of

31
MES development and implementation. This is because MES
systems are not purely off-the-shelf products. They need to be
highly customised towards the requirements and the infrastructure
of the company. These customisations are scoped considering the
issues that need to be resolved.
The needs documented during the workshops are summarised into
benefits and placed into blocks in the benefits section of the
benefits dependency map. The benefits need to be measurable and
have a preferred direction of change or a target. Benefits fall into
three main categories. Lower-level benefits are those found within
the MES system. Intermediate-level benefits are those that describe
the outputs of the system. Higher-level benefits are the KPIs of a
specific department.
The benefits need to be linked by a cause-and-effect relationship,
through higher-level benefits, to one of the desired business
objectives. If they do not, then they are not benefits to those
objectives (They may however still be spin-off benefits affecting an
objective outside the scope of the project).
A solved issue also needs to link to some benefit. If there is no
benefit to resolving a perceived issue then it should be regarded as
not a genuine issue and should be discarded from further
consideration.
The enablers form the links between the issues and the benefits.
These are grouped by projects which will be defined in the "Solution
Management" section. They are placed into blocks in the enablers
section. Each enabler is composed of a number of required
business and system changes. These are listed in a block for each
enabler. A first draft of the required business changes and systems
will have been developed in the workshops. These may be updated
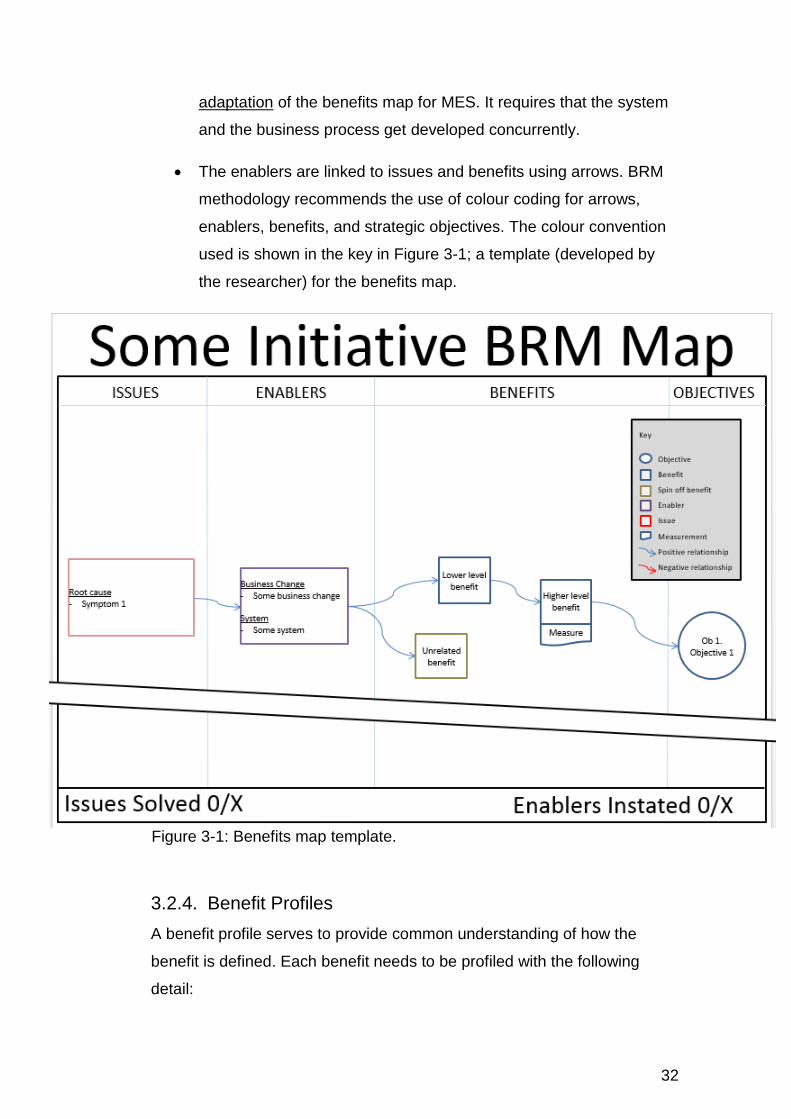
as the projects are elaborated. Note that this is the second major
32
Figure 3-1: Benefits map template.
adaptation of the benefits map for MES. It requires that the system
and the business process get developed concurrently.
The enablers are linked to issues and benefits using arrows. BRM
methodology recommends the use of colour coding for arrows,
enablers, benefits, and strategic objectives. The colour convention
used is shown in the key in Figure 3-1; a template (developed by
the researcher) for the benefits map.
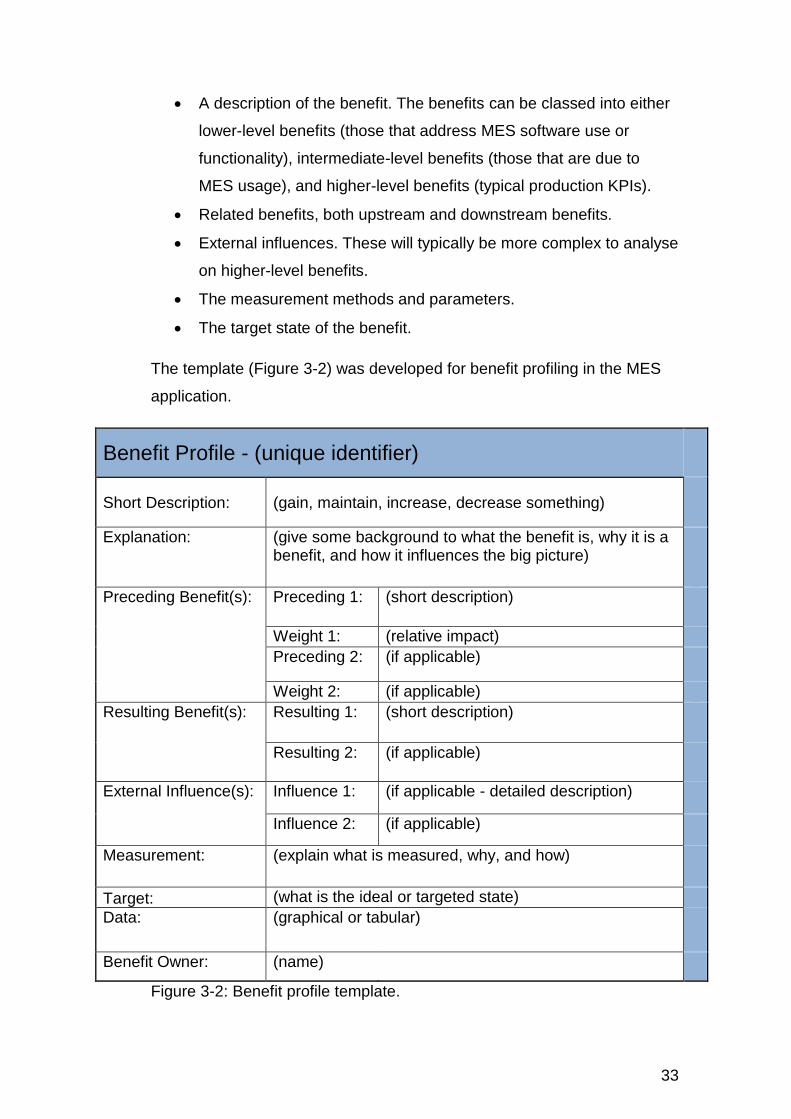
3.2.4. Benefit Profiles
A benefit profile serves to provide common understanding of how the
benefit is defined. Each benefit needs to be profiled with the following
detail:
33
A description of the benefit. The benefits can be classed into either
lower-level benefits (those that address MES software use or
functionality), intermediate-level benefits (those that are due to
MES usage), and higher-level benefits (typical production KPIs).
Related benefits, both upstream and downstream benefits.
External influences. These will typically be more complex to analyse
on higher-level benefits.
The measurement methods and parameters.
The target state of the benefit.
The template (Figure 3-2) was developed for benefit profiling in the MES
application.
Benefit Profile - (unique identifier)
Short Description: (gain, maintain, increase, decrease something)
Explanation: (give some background to what the benefit is, why it is a benefit, and how it influences the big picture)
Preceding Benefit(s): Preceding 1: (short description)
Weight 1: (relative impact)
Preceding 2: (if applicable)
Weight 2: (if applicable)
Resulting Benefit(s): Resulting 1: (short description)
Resulting 2: (if applicable)
External Influence(s): Influence 1: (if applicable - detailed description)
Influence 2: (if applicable)
Measurement: (explain what is measured, why, and how)
Target: (what is the ideal or targeted state)
Data: (graphical or tabular)
Benefit Owner: (name)
Figure 3-2: Benefit profile template.

34
3.2.5. Solution Management
Solution management is an elaboration of the enablers described in the
benefits map. The enablers are composed of the business changes
(processes) and the systems that need to be put in place in order to solve
the issues and create positive benefits.
Once the enabler is defined, projects (or work packages) are specified
which aim to bring about the required business changes and systems.
These projects are summarised on a change action plan template (Figure
3-3). The purpose of the change action plan is to summarise and allocate
the projects. It states all the business changes and requirements that the
project will address as well as the key benefit(s) that will be achieved. The
project is then allocated to the benefit owner(s).
One project may address multiple enablers or it may take multiple projects
to address a single enabler. The template summarises each projects
supporting project (or supporting initiative). The template in Figure 3-3 was
developed specifically for the MES application.
Figure 3-3: Change action plan template.

35
Figure 3-4: Benefit tracking template.
3.2.6. Benefit Tracking
The benefit measurement methodology, along with its desired direction of
change, is defined in the benefits profile of each benefit. Measurement of
benefits is highly dependent on a company’s system structure and is not
specified in detail in this methodology. The only requirement posed is that
all measurement data needs to be quantitative.
Benefits however need to be tracked in relation to one another. The
developed benefit tracking template (Figure 3-4) is used to carry out this
tracking. Its purpose is to take the developed tracking measurements and
places them in sequence from lower-level benefits to higher-level benefits.
This allows the benefit owners to track, not only the individual benefit
changes, but also the effect of a change in one benefit on another.
As far as possible, data will be structured to fit onto an x-y plot (with x
representing a common time range) so that trends can be easily
compared.

36
4. RESEARCH METHODOLOGY
The aim of this research report is to evaluate the validity of the BRM
methodology for the implementation of MES systems at WMMEA. To do
this, the most recent implementation of such a system at WMMEA is
considered. It is important to note that the researcher evaluating the BRM
methodology is the same person responsible for the adaptation and
application of the BRM methodology at WMMEA. The researcher further
supports the implementation by providing various stakeholders with the
measurement data specified by the BRM methodology. While the
researcher participates in the implementation (a contemporary event), he
is not in control of many of the aspects of the event. With this in mind,
action research could be considered as the research methodology. The
following three additional considerations however suggest that case study
research is the better suited methodology. Firstly, the research is an
evaluation and not an exploration. As explained by McNiff and Whitehead
[29], a major aspect of action research is the iterative action-reflection
cycle (planning, acting, observing, and reflecting). This is contrary to the
applied method which is based on a pre-existing framework. Secondly, the
researcher’s involvement in the implementation was circumstantial. The
researcher could have conducted the research in the same manner had
his role in the implementation been performed by a BRM practitioner.
Thirdly, it is the researcher’s feeling that the evaluative tools offered by
Yin’s [30] case study research methodology are more rigorous as well as
better suited for the evaluation under consideration. This feeling is not the
researcher’s alone. In a paper comparing action and case study research,
Blichfeldt and Andersen [31, p3] note: “Several authors argue that action
research should rely on the case-study method”. In light of the
circumstances described, the research method chosen is the case study
for evaluation, where the researcher is positioned as a participant
observer.
With regard to the adaptation of the BRM methodology; it should be noted
that this is not a design report. While some aspects of the methodology
37
were adapted to better handle MES system implementation, the
fundamental concepts of BRM have stayed the same. It can be reasoned
that since BRM is a generalised methodology, its application will have to,
to some extent, be adapted to whatever situation it is being applied in. The
adaptation is detailed in the “Theoretical Framework” chapter for the
purpose of research reliability. The research is however concerned with
evaluating the applicability of the BRM methodology.
4.1. Participant Observation
While a researcher as a participant in case study research is a common
occurrence, the potential for bias needs to be addressed. This section will
rely on the considerations presented by Iacono et al. [32]. Their paper is
chosen because of the similarities in the environment the authors
describes to the environment in which this research was conducted. She
points out two sources of bias attributed to participant observation:
The influence of the researcher on participant behaviour. In both
cases; while the participants were made aware that the research
was taking place, data collection was done discreetly during the
course of business. Participants were professionals going about
daily business in a professional environment.
The impact of the researcher’s beliefs on the findings. In both
cases, there is a combination of enquiry from the inside and enquiry
from the outside. All measurement data is quantitative (gathered
from company records). This constitutes inquiry from the outside
since the researcher is acting as a historian (gathering data over
which he has no influence). The data demonstrates trends which
are not open to interpretation. The researcher then (from the point
of a professional within the company) discusses the results. This
constitutes inquiry form the inside. In all situations where the
researcher wishes to present his opinion regarding a result, he
distinguishes his opinion from the result obtained. This is done in

38
situations where the researcher wishes to present an alternative
explanation which he has no data to substantiate.
It is ultimately important to recognise that a participant observer role is not
a less desired one. Conducting inquiry from the inside means that the
researcher is able to put results into the context of company culture and
business processes which an outside observer may not be privy to.
4.2. Case Study Methodology
This research is based on the case study methodology presented by Yin
[30]. The following points reinforce the decision for selecting case study
methodology as the research method for the evaluation:
The research question is an empirical enquiry into a contemporary
event with no clear contextual boundaries.
The propositions derived from the research question require the
identification of cause and effect relationships between benefits
which are not mathematically defined.
With specific regard to evaluations:
o This case study details the initiative. I.e. how benefits were
derived. To this point, Yin [30, p5319] makes the following
statement: “Because of the strength of case study research
in capturing the complexity of a case as well as changes in
the case over time, case study research is the conventional
way for doing process or implementation evaluations.”
o The previous point is related to the prediction of an outcome
(I.e. the benefits). The second proposition requires the
identification of the direction and change in magnitude of
each benefit. To this point, Yin [30, p5352] makes the
following statement: “Case study outcome evaluations also
can be useful when the outcomes of interest already have
been identified. Now, the more challenging task would be to

39
collect the outcome data and to draw conclusions about the
direction or magnitude of the outcome trends”.
4.3. Case Study Design
In order for a case study to be complete and satisfy the test for reliability
(discussed later in this chapter), Yin [30] highlights the importance of
setting out propositions and defining the case.
Two propositions are identified and detailed in the “Propositions” section of
Chapter 1. In order to answer the research question, these propositions
have to be shown to be true. The propositions are defined such that they
can be addressed using the data the researcher aims to obtain.
Furthermore, they are defined such that their validity will infer a positive
answer to the research question.
The case (or unit of analysis) is the MES realignment project at WMMEA.
It is detailed in the “Case Background and Context” section. All activity
resulting from the project forms part of the case. External influences, while
discussed, do not form part of the case. In order to maintain focus on the
propositions, certain concepts had to be bound. Bounding is detailed in the
“Scope Delimitations” section. MES is bound to a number of key functions
(the functions present in WMMEA’s system). BRM methodology is bound
to exclude the ROI considerations. Limitations are put on the case study
method. These are certain aspects of case study methodology which are
important to ascertaining validity and reliability, but are not in the
company’s interest. Major uncontrollable events are discussed in the same
chapter due to the limitations they impose on the research.
4.4. Data Gathering
Measurement of benefits is dependent on a company’s system structure
and is not specified in the derived methodology. In order to avoid biased
tracking and measuring of benefits, all data gathered is quantitative. This

40
means that the researcher is not put in a position where he needs to make
a judgement (potentially insufficiently informed or open to interpretation)
about the meaning of the data. Data gathering is to be done as follows:
Where raw data is available (as historic, master, or transactional
data stored on the company’s main database), it will be mined
directly and frozen as a snapshot at a set point in time. It will then
be manipulated to satisfy the derived measurement’s requirement.
Only where raw data is not available, data will be gathered through
primary observation (where the researcher notes what actually
happened) of the parameter specified in the benefits tracking
section of the BRM methodology.
Only where raw data is not available, and direct observation is not
possible, data will be gathered through structured interviews with
the benefit owners. A structured interview asks all participants the
same predetermined questions. For this research, the interview (per
benefit) consists of asking the benefit owner (or a key stakeholder)
a direct question regarding the state of the benefit. For example:
“What, in your expert opinion, is the current state of the benefit?”
4.5. Linking Data to Propositions
The analytic strategy relies on the propositions derived from the research
question. Because the propositions are based on interpreting quantitative
benefits (as discussed in the theoretical framework), the selection of data
to be used becomes synonymous with the data required to measure
benefits. The situation is simplified by noting that quantitative benefit
measurement is a BRM methodology requirement. This means that the
data gathering task was handled in the implementation project itself and
no further data gathering is called for by the propositions.
Three analytic techniques, Yin recommends [30, p3648], are employed in
this research. Because BRM methodology is based on the principle of
cause and effect, the logic model will be used to determine whether the
predicted cause and effect relationships between benefits were valid.

41
Within the logic model, pattern matching has been used to identify the
positive or negative prediction of individual benefits. Chronological
sequence time series analysis is used both for explaining the behaviour of
individual benefit trends as well as the relationship between benefits.
4.6. Interpreting the Case Study’s Findings
This aspect of the work continues to rely on the proposition based analytic
strategy. The outcome of the propositions is evaluated against the
research question in a qualitative fashion. The researcher addresses
issues of:
Construct validity by discussing the selection of measurements and
the approach to measurement.
Internal validity by discussing convergence of evidence and rival
explanations.
External validity by discussing the adaptations made to the BRM
theoretical framework.
Reliability by discussing the research protocol and case study
database.
Based on this, an answer to the research question is presented.
4.7. Ethical Considerations
Ethics clearance was obtained from the School Ethics Clearance
Committee (ethics clearance number: MIAEC 046/15). Key ethical
considerations addressed are:
Permission to do research – In order to conduct the research certain data
had to be made available to the researcher and certain extracts from this
data have to be presented in this report. Furthermore, the research will to
an extent involve interaction with certain employees. Written permission
was given by the factory manager for the research to take place.

42
Data collection methodology from human participants – The majority of
data was gathered through data mining on the company database. Certain
data was however not stored formally by the company and was acquired
through structured interviews. The participants were selected based on
their participation in the MES development and implementation. Data from
participants was collected through a formal questionnaire. The purpose of
the questions is to identify trends in data and not to gather personal
information. Participants were told that the researcher is gathering
information for the purpose of this research. A simple verbal explanation
was given of the purpose of the questionnaire and was followed by a sign
off on the information given.
Confidentiality and anonymity – The company has approved this
questioning. Participants were told (and signed on the questionnaire in
agreement) that confidentiality and anonymity would not be given.
Confidentiality is not considered because the data gathered is a direct
requirement for deriving the results of this report. No sensitive data was
requested. Anonymity is not guaranteed because positions are such that
only one person could have answered those questions.
Due to the large volume of raw data, all raw data used (including signed
questionnaires) is available on the digital media accompanying this report.

43
5. RESULTS
This chapter summarises the data gathered for the purpose of satisfying
the two propositions laid out.
5.1. Results – Proposition One
The first proposition serves to confirm that the specified BRM methodology
was, completely, applied in the “real world” context (i.e. in this case study).
Completely, in this case, implies that all the steps specified in the
“Adapted BRM Methodology” section were performed at the company.
As stated in the “Propositions” section, this proposition focuses on the
initiative. Rather than simply ticking off a list of deliverables (from each
step), the researcher aims to give the reader a “feel” for the real events
that took place during the implementation. The approach taken is to do
this by detailing the deliverables derived by the stakeholders in the initial,
workshop, and project execution stages of the BRM methodology.
5.1.1. WMMEA-Specific Strategy Map
The strategy map (Figure 5-1) is derived from the WMMEA company-wide
deployment policy. Only the nodes of the map which were the focus of the
MES implementation and the affected adjacent nodes are mapped.
The two downstream nodes which the implementation will address are:
1. Increase Make-To-Stock (MTS) availability and On Time Delivery
(OTD) to customer – Availability is a measure of “is MTS classified
stock available on the shelf at the time when the customer requires his
delivery” and OTD is a measure of “has an MTO part been delivered to
the customer in the time promised to him”.
These are high-level company objectives which can be traced down to
the performance of the machining operation (i.e. the measurement is

44
filtered on internally machined parts only). The company target for both
of these measures is 89% (as of 1st February 2015).
2. Increase output value – Because the machine shop doesn’t sell at a
profit, it uses throughput rate to determine how much value it is
generating for the company. Throughput rate is a monetary value-per-
hour generated measure on parts where there is genuine short-term
demand. It is used to ensure that the highest quantity of the most
profitable parts is made. Increase in throughput rate is a temporary
measure as an increase will ultimately result in a cost-roll
(readjustment of standard run times) for the affected parts. There will
be no cost-roll over the term of the measurement in this report.
It should be noted that strategic objectives are usually affected by
numerous activities throughout the company and that a change in their
measure may not be entirely related to the activity under investigation. The
strategy map shows two major upstream objectives which will have an
impact on the measured objectives described.
Section of the strategy map that will be covered in this report
Routing and time study
programme
Plant load optimisation programme
Increase Kanban
availability and OTD
Increase
output value
Implement S&OP
programme
Machine shop
productivity programme
Increase company
profitability
Implement MES
system
Figure 5-1: WMMEA derived strategy map extract.

45
5.1.2. WMMEA-Specific Benefits Dependency Map
The benefits map in Figure 5-2 was derived in workshops which are
detailed in the “Adapted BRM Methodology” section. The following
outcome are noted:
A total of 48 unique issues were summarised into 8 themes (or root
causes).
A total of 15 potential benefits were identified (7 lower-level, 4
intermediate, and 4 higher-level). 1 spin-off benefit was identified.
A total of 8 enablers were specified (comprising of 20 business
changes and 13 system changes).
The rest of this section details how the issues and benefit profiles were
compiled. The enablers are detailed in the “Solution Management” section
that follows.

46

47
Figure 5-2: Machine shop benefits map.

48
Issues
The eight issue themes (or root causes) were identified as follows:
System Misalignment
Operator Buy-in
Software Interface
Low-Quality Data Fed Into the System
Single Point of Control
Incomplete Functionality
Roles and Responsibilities
Backup System
The first of these, “System Misalignment”, is representatively shown here.
All eight are included in “APPENDIX A: Issue Themes (Root Causes)”.
System Misalignment
The perceived symptoms for this issue theme (as they were described in
the workshops) are summarised in Table 5-1.
Table 5-1: System misalignment symptoms
Multiple Systems: Three separate systems, auxiliary to the ERP, are used to manage production. They do not communicate between themselves.
Planning done in Excel: Most of the communication from the planning department is distributed through non-standard Excel spreadsheets.
Unclear role on who updates MES data: There is no designated person or standard operating procedure.
No procedure for updating schedule: There are no set rules and timelines for production schedule release.
Soft system: Machine shop does not need MES to function. Urgent or inconvenient work can bypass MES.
No systems link: There is incomplete communication between systems. Data regularly has to be transferred manually.
Operators work on jobs not available in MES: Jobs that are delivered to or selected by operators are not planned in MES.
Operators can’t punch jobs into MES every time: Various technical issues prevented the clocking of jobs into MES.
There are too many instances of clocking on paper: Where an operator cannot (for any reason) clock work on the MES system he will instead just note it on paper.
Too many jobs in the MES: Invalid work is entering the system making navigation difficult.
Actual times are skewed by operators to seem closer to standard times: Operators can cheat on their performance figures by entering any time values they chose.
Completed jobs showing in system: Jobs previously completed by the operator are returning to MES and showing as to-be-machined.
Material not at machine: There is no material available for the job which MES specifies as next in line.
Operators don’t know what to produce: Operators receive so many mixed messages that they no longer know what they need to produce.

49
It was identified that three distinct systems (see Figure 5-3) supplemented
the MRP with scheduling, shop floor control, and production execution.
There was no logic dictating flow or interrelationship between the systems.
Furthermore, there was no hard link between MES and any other system.
Using the original (more entrenched) systems, MES could be completely
bypassed.
Figure 5-3 shows that work instructions did not have to pass through either
the Kanban or MES system before machining. This is depicted by no solid
black arrow link (these links are required and the process cannot continue
without them being actioned). On the other hand, unavoidable soft links
are depicted as dashed black arrows (the overall process can continue
without the link being actioned, but the operations following that link
cannot be), and avoidable soft links are depicted as red arrows (both the
overall process and the operations following the link can continue without
them being actioned). The MES system is linked entirely by dashed arrows
and runs in parallel with Kanban system. The ramification of this is that
when only some of the production data is captured by each system,
neither of the systems is able to accurately account for the current state of
production. This can be reconciled by the ERP but the process falls behind
real-time by a number of days making the information far less valuable
once it is finally made available.
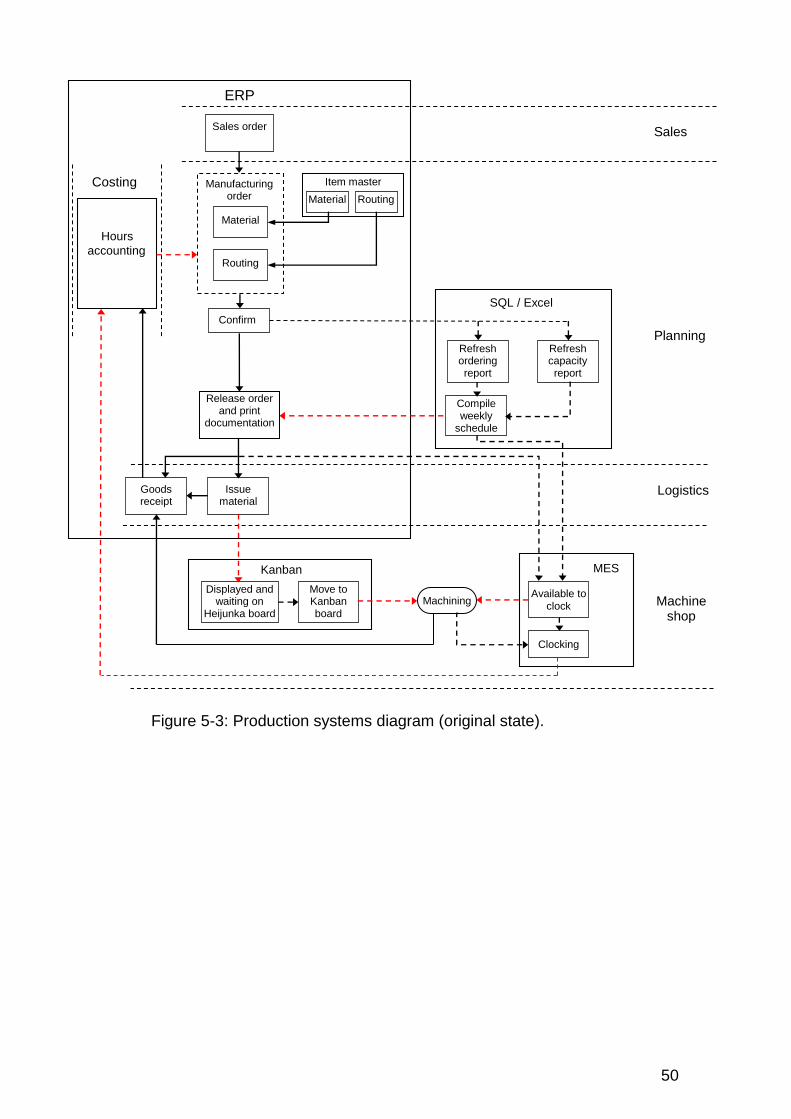
50
Figure 5-3: Production systems diagram (original state).
ERP
Sales order Sales
Planning
Confirm
Refresh ordering report
SQL / Excel
Compile weekly
schedule
Logistics
Machine shop
Goods receipt
Hours accounting
Release order and print
documentation
Refresh capacity report
Material
Manufacturing order
Routing
Routing
Item master
Material
Issue material
Displayed and waiting on
Heijunka board
Kanban Move to Kanban board
Machining
MES
Available to clock
Clocking
Costing
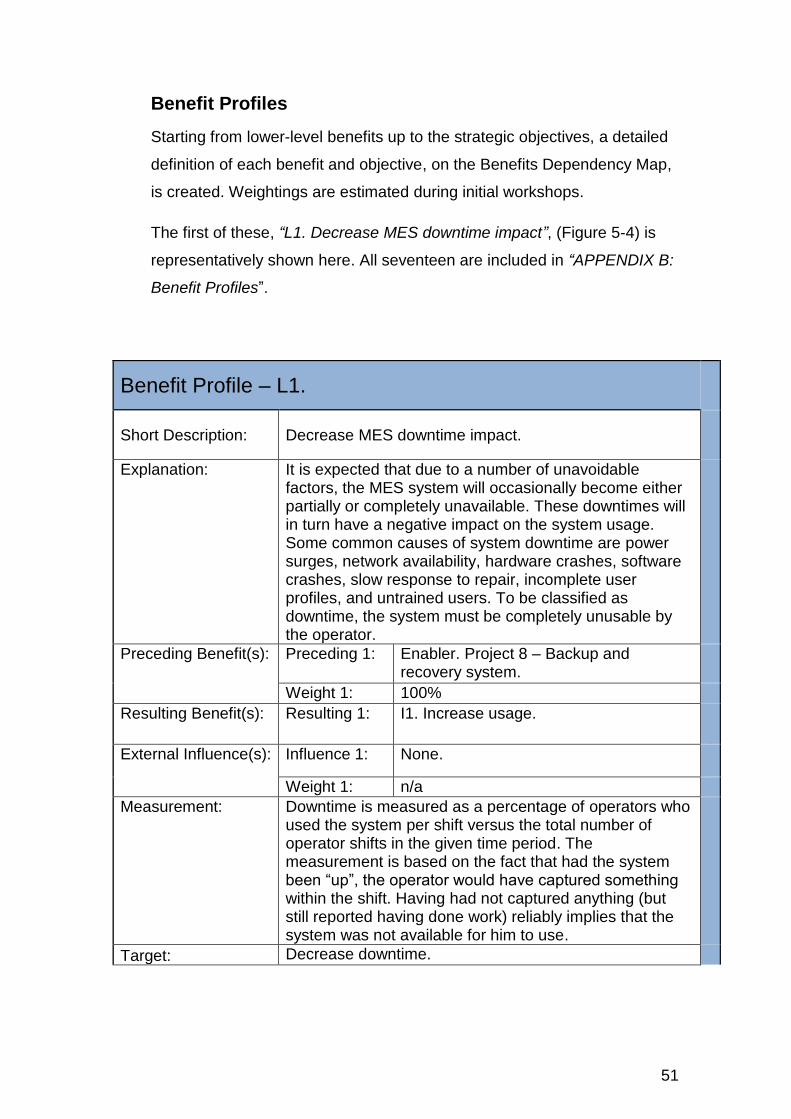
51
Benefit Profiles
Starting from lower-level benefits up to the strategic objectives, a detailed
definition of each benefit and objective, on the Benefits Dependency Map,
is created. Weightings are estimated during initial workshops.
The first of these, “L1. Decrease MES downtime impact”, (Figure 5-4) is
representatively shown here. All seventeen are included in “APPENDIX B:
Benefit Profiles”.
Benefit Profile – L1.
Short Description: Decrease MES downtime impact.
Explanation: It is expected that due to a number of unavoidable factors, the MES system will occasionally become either partially or completely unavailable. These downtimes will in turn have a negative impact on the system usage. Some common causes of system downtime are power surges, network availability, hardware crashes, software crashes, slow response to repair, incomplete user profiles, and untrained users. To be classified as downtime, the system must be completely unusable by the operator.
Preceding Benefit(s): Preceding 1: Enabler. Project 8 – Backup and recovery system.
Weight 1: 100%
Resulting Benefit(s): Resulting 1: I1. Increase usage.
External Influence(s): Influence 1: None.
Weight 1: n/a
Measurement: Downtime is measured as a percentage of operators who used the system per shift versus the total number of operator shifts in the given time period. The measurement is based on the fact that had the system been “up”, the operator would have captured something within the shift. Having had not captured anything (but still reported having done work) reliably implies that the system was not available for him to use.
Target: Decrease downtime.

52
Data:
Period Downtime Percentage
1 #N/A
2 92%
3 27%
4 22%
5 #N/A
6 30%
7 20%
8 5%
9 4%
10 11%
Benefit Owner: Machine shop manager.
Figure 5-4: Benefit L1. Decrease MES downtime impact.
5.1.3. Solution Management
A set of eight projects (Figure 5-5) was compiled in order to instate the
required enablers. One project was devised for each enabler, each
addressing one of the issue themes outlined above.
System Alignment
Operator Buy-in
Software Interface
Low-Quality Data Fed Into the System
Single Point of Control
Increased Functionality
Roles and Responsibilities
Backup and Recovery System
The projects were then delegated to the benefit owners and sequenced to
determine the timing plan of the projects.
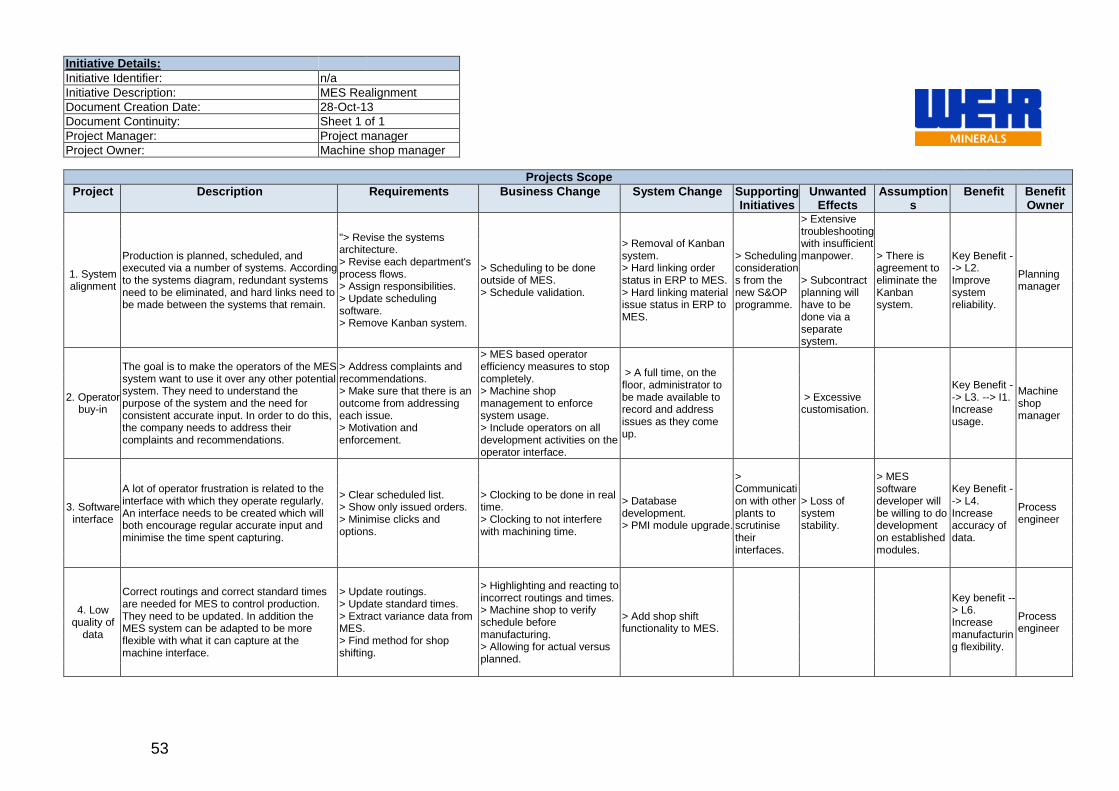
53
Initiative Details: Initiative Identifier: n/a Initiative Description: MES Realignment Document Creation Date: 28-Oct-13 Document Continuity: Sheet 1 of 1 Project Manager: Project manager Project Owner: Machine shop manager
Projects Scope
Project Description Requirements Business Change System Change Supporting Initiatives
Unwanted Effects
Assumptions
Benefit Benefit Owner
1. System alignment
Production is planned, scheduled, and executed via a number of systems. According to the systems diagram, redundant systems need to be eliminated, and hard links need to be made between the systems that remain.
"> Revise the systems architecture. > Revise each department's process flows. > Assign responsibilities. > Update scheduling software. > Remove Kanban system.
> Scheduling to be done outside of MES. > Schedule validation.
> Removal of Kanban system. > Hard linking order status in ERP to MES. > Hard linking material issue status in ERP to MES.
> Scheduling considerations from the new S&OP programme.
> Extensive troubleshooting with insufficient manpower. > Subcontract planning will have to be done via a separate system.
> There is agreement to eliminate the Kanban system.
Key Benefit --> L2. Improve system reliability.
Planning manager
2. Operator buy-in
The goal is to make the operators of the MES system want to use it over any other potential system. They need to understand the purpose of the system and the need for consistent accurate input. In order to do this, the company needs to address their complaints and recommendations.
> Address complaints and recommendations. > Make sure that there is an outcome from addressing each issue. > Motivation and enforcement.
> MES based operator efficiency measures to stop completely. > Machine shop management to enforce system usage. > Include operators on all development activities on the operator interface.
> A full time, on the floor, administrator to be made available to record and address issues as they come up.
> Excessive customisation.
Key Benefit --> L3. --> I1. Increase usage.
Machine shop manager
3. Software interface
A lot of operator frustration is related to the interface with which they operate regularly. An interface needs to be created which will both encourage regular accurate input and minimise the time spent capturing.
> Clear scheduled list. > Show only issued orders. > Minimise clicks and options.
> Clocking to be done in real time. > Clocking to not interfere with machining time.
> Database development. > PMI module upgrade.
> Communication with other plants to scrutinise their interfaces.
> Loss of system stability.
> MES software developer will be willing to do development on established modules.
Key Benefit --> L4. Increase accuracy of data.
Process engineer
4. Low quality of
data
Correct routings and correct standard times are needed for MES to control production. They need to be updated. In addition the MES system can be adapted to be more flexible with what it can capture at the machine interface.
> Update routings. > Update standard times. > Extract variance data from MES. > Find method for shop shifting.
> Highlighting and reacting to incorrect routings and times. > Machine shop to verify schedule before manufacturing. > Allowing for actual versus planned.
> Add shop shift functionality to MES.
Key benefit --> L6. Increase manufacturing flexibility.
Process engineer
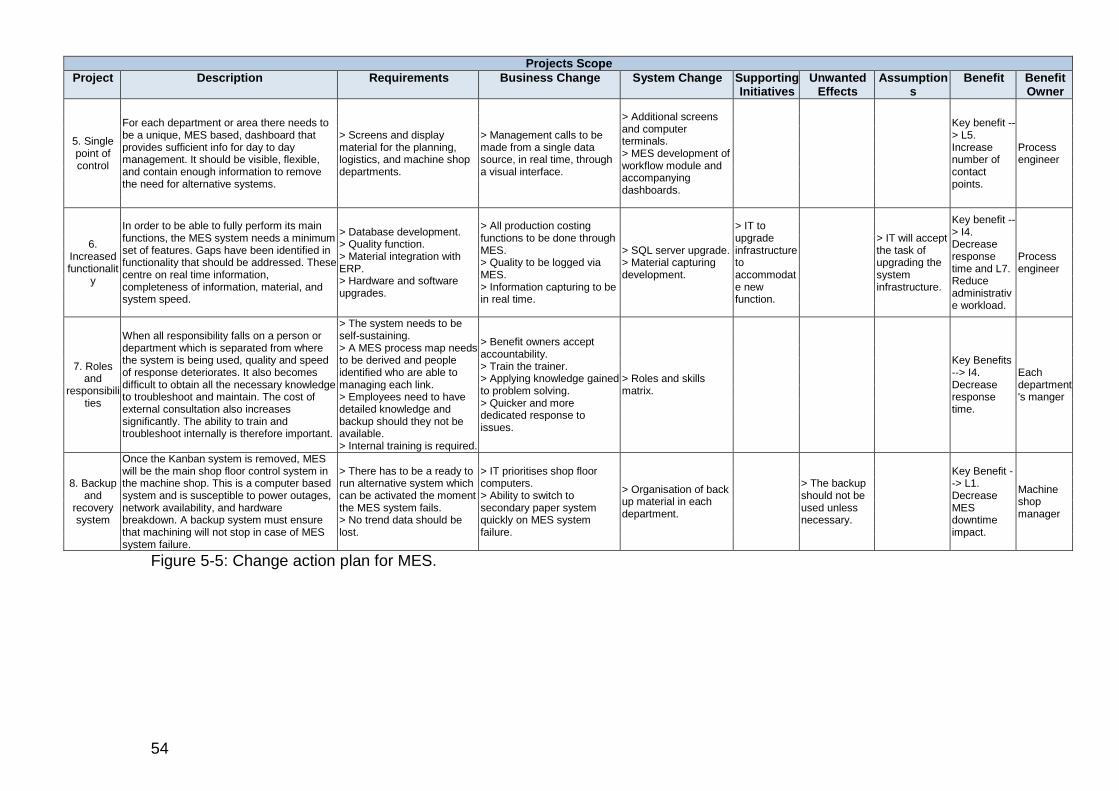
54
Projects Scope
Project Description Requirements Business Change System Change Supporting Initiatives
Unwanted Effects
Assumptions
Benefit Benefit Owner
5. Single point of control
For each department or area there needs to be a unique, MES based, dashboard that provides sufficient info for day to day management. It should be visible, flexible, and contain enough information to remove the need for alternative systems.
> Screens and display material for the planning, logistics, and machine shop departments.
> Management calls to be made from a single data source, in real time, through a visual interface.
> Additional screens and computer terminals. > MES development of workflow module and accompanying dashboards.
Key benefit --> L5. Increase number of contact points.
Process engineer
6. Increased functionalit
y
In order to be able to fully perform its main functions, the MES system needs a minimum set of features. Gaps have been identified in functionality that should be addressed. These centre on real time information, completeness of information, material, and system speed.
> Database development. > Quality function. > Material integration with ERP. > Hardware and software upgrades.
> All production costing functions to be done through MES. > Quality to be logged via MES. > Information capturing to be in real time.
> SQL server upgrade. > Material capturing development.
> IT to upgrade infrastructure to accommodate new function.
> IT will accept the task of upgrading the system infrastructure.
Key benefit --> I4. Decrease response time and L7. Reduce administrative workload.
Process engineer
7. Roles and
responsibilities
When all responsibility falls on a person or department which is separated from where the system is being used, quality and speed of response deteriorates. It also becomes difficult to obtain all the necessary knowledge to troubleshoot and maintain. The cost of external consultation also increases significantly. The ability to train and troubleshoot internally is therefore important.
> The system needs to be self-sustaining. > A MES process map needs to be derived and people identified who are able to managing each link. > Employees need to have detailed knowledge and backup should they not be available. > Internal training is required.
> Benefit owners accept accountability. > Train the trainer. > Applying knowledge gained to problem solving. > Quicker and more dedicated response to issues.
> Roles and skills matrix.
Key Benefits --> I4. Decrease response time.
Each department's manger
8. Backup and
recovery system
Once the Kanban system is removed, MES will be the main shop floor control system in the machine shop. This is a computer based system and is susceptible to power outages, network availability, and hardware breakdown. A backup system must ensure that machining will not stop in case of MES system failure.
> There has to be a ready to run alternative system which can be activated the moment the MES system fails. > No trend data should be lost.
> IT prioritises shop floor computers. > Ability to switch to secondary paper system quickly on MES system failure.
> Organisation of back up material in each department.
> The backup should not be used unless necessary.
Key Benefit --> L1. Decrease MES downtime impact.
Machine shop manager
Figure 5-5: Change action plan for MES.
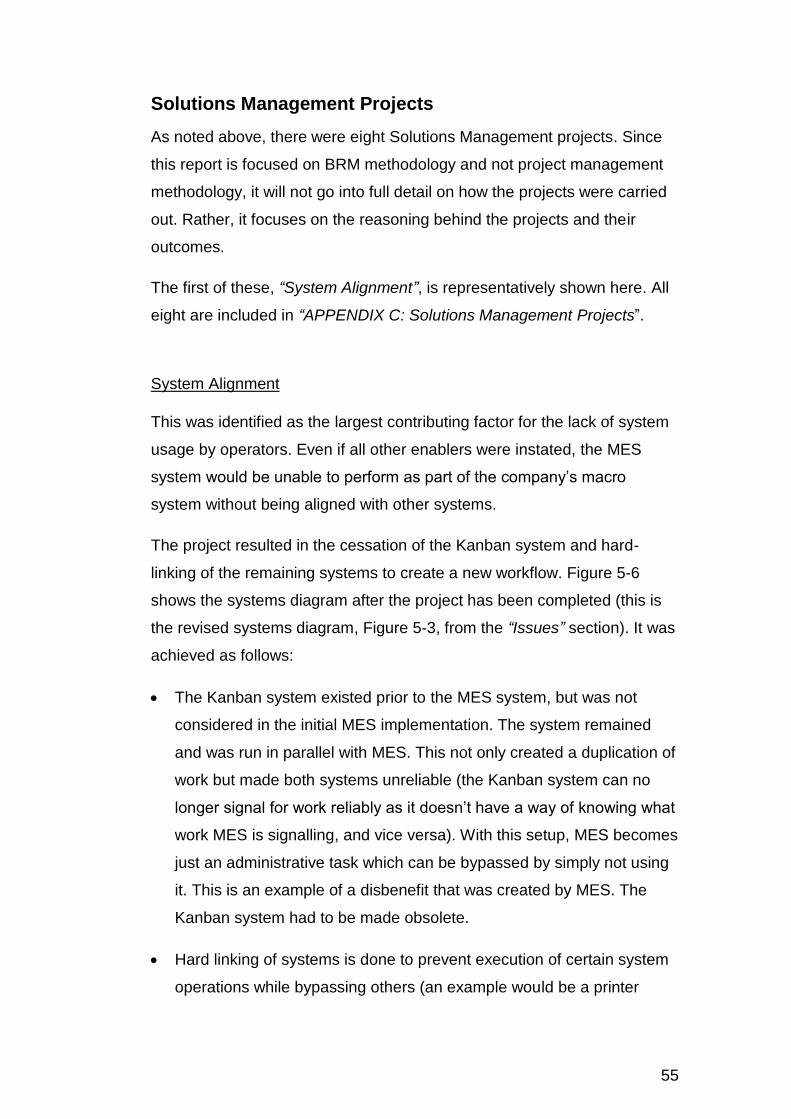
55
Solutions Management Projects
As noted above, there were eight Solutions Management projects. Since
this report is focused on BRM methodology and not project management
methodology, it will not go into full detail on how the projects were carried
out. Rather, it focuses on the reasoning behind the projects and their
outcomes.
The first of these, “System Alignment”, is representatively shown here. All
eight are included in “APPENDIX C: Solutions Management Projects”.
System Alignment
This was identified as the largest contributing factor for the lack of system
usage by operators. Even if all other enablers were instated, the MES
system would be unable to perform as part of the company’s macro
system without being aligned with other systems.
The project resulted in the cessation of the Kanban system and hard-
linking of the remaining systems to create a new workflow. Figure 5-6
shows the systems diagram after the project has been completed (this is
the revised systems diagram, Figure 5-3, from the “Issues” section). It was
achieved as follows:
The Kanban system existed prior to the MES system, but was not
considered in the initial MES implementation. The system remained
and was run in parallel with MES. This not only created a duplication of
work but made both systems unreliable (the Kanban system can no
longer signal for work reliably as it doesn’t have a way of knowing what
work MES is signalling, and vice versa). With this setup, MES becomes
just an administrative task which can be bypassed by simply not using
it. This is an example of a disbenefit that was created by MES. The
Kanban system had to be made obsolete.
Hard linking of systems is done to prevent execution of certain system
operations while bypassing others (an example would be a printer

56
which doesn’t allow printing without the paper tray being loaded first).
Automation is also a consequence of hard linking. The hard links
created in this case were:
o Between the scheduling system and ERP
o Between ERP and MES
o Between MES and the machining operation
The resulting process is summarised as follows:
ERP generates orders
All orders have to be scheduled in the scheduling system
Scheduling system writes the schedule to ERP
ERP releases the scheduled (sequenced) orders to MES
MES dictates machining and material flow
MES feeds the results back to the ERP costing module
In Figure 5-6, hard links are shown as solid black arrows (these are
required and the process cannot continue without them being actioned)
and avoidable soft links as dashed red arrows (both the overall process
and the operations following the link can continue without the previous
being actioned). The new red link is a backup in the event that the MES
system fails.

57
Figure 5-6: Preferred (end) state systems diagram.
ERP
Sales order Sales
Planning
Confirm
Refresh ordering report
SQL / Excel
Compile weekly
schedule
Logistics
Machine shop
Goods receipt
Hours accounting
Release order and print
documentation
Refresh capacity report
Material
Manufacturing order
Routing
Routing
Item master
Material
Issue material
Machining
MES
Available to clock
Clocking
Bypass for
backup system
Costing
58
Sequence and Delegation
Projects were delegated to benefit owners based on the affected lower-
level benefits for which they are responsible. Sequence was based on the
specific outcomes of each project. Where resources allow, projects can
overlap. The sequence was as follows:
1. Single point of control: This was chosen as the starting project
because its outcomes ensure all stakeholders have access to the
system’s outputs at all times at all points. This visibility sheds light
on system flaws and inaccuracies. It also places pressure on all
parties for the timely completion of the projects to follow.
2. Backup system: This was a prerequisite for both getting rid of the
original system and for monitoring the usage and uptake of the new
system. For example, the number of occasions where the backup
system has been used is a direct indicator of where the new system
has failed. The company can analyse these events and strive to
reduce their frequency.
3. System alignment: The first and largest systems modification. It
eliminates the previously-used Kanban system and lays the ground
work for any other system developments. Any developments made
before system alignment will fail to work reliably.
4. Software interface, incomplete functionality, and operator buy-
in: These were all grouped together because they share an
implementation process. In order to change both the interface and
to add functionality the software developers had to be brought in to
reprogram the software. At the same time operators worked on
testing and providing feedback on the developments.
5. Low quality data fed into the system: This project requires the
system to be running and gathering data.
6. Roles and responsibilities: This project aims to entrench and
improve on the above developments.

59
5.1.4. Benefit Tracking
Benefits are gained or lost throughout the MES system development and
implementation. Each benefit’s measurement requirement is specified in
its benefit profile. The benefit tracker is a template that consolidates the
measurements of all benefits and company objectives. It is populated
continuously throughout the initiative and used to measure the success of
the initiative, as well as areas of concern which need to be revisited.
Figure 5-7 shows the benefit tracker as it looked at the point in time when
this report was compiled. On each graph, a green trend line signifies a
change in the predicted (desired) direction. A red trend line signifies the
opposite.
The following immediate observations with regards to measurement data
can be noted:
It is possible to ascertain a trend for all 15 benefits and both
company objectives.
o Benefit measures all have between 5 and 10 data points.
14 of 15 benefit measurements have a trend in the predicted
direction.
Both measurements of the company objectives trend in the
predicted direction.
Before ending this section, a few comments should be made on the
selection of time periods (summarised in Table 5-2):
Period 1. A version of the MES system did exist at WMMEA for
many years prior to the initiative described by this case study (the
initiative launched in November 2013). The system was however
not in use. From the start of the initiative until 10 March 2014, the
system was mainly used for investigative purposes.
Period 2. The start of this period (10 March 2013) coincides with the
company’s implementation of a new ERP system. Most data before
this period was either deleted or achieved, making data mining

60
impractical. The more significant implication of the ERP introduction
was that it resulted in the majority of the MES system having to be
turned off for roughly three months. The system was slowly restored
towards the end of June 2014.
Period 3. Strike action in July brought the machine shop to a halt for
4 weeks. The system was running but all focus was shifted towards
recovering from the strike action. The researcher estimates this
period to have lasted until October 2014.
Period 4. Some focus was placed back onto the MES initiative but
many key stakeholders were unavailable, “chasing end of year
targets” that the company had fallen behind on due to the two
events mentioned above. The company began to close its
operations from 12 December for the end of year holidays.
Periods 5 to 10. Complete focus was placed back onto the MES
initiative. Benefits were measured every 2 weeks.
Table 5-2: Time periods
Time Period Description
1 - Prior to 10 Mar 2014
2 - 10 Mar 2014 to 1 Jul 2014
3 - 1 Jul 2014 to 1 Oct 2014
4 - 1 Oct 2014 to 12 Dec 2014
5 - 05 Jan 2015 to 16 Jan 2015
6 - 16 Jan 2015 to 30 Jan 2015
7 - 30 Jan 2015 to 13 Feb 2015
8 - 13 Feb 2015 to 27 Feb 2015
9 - 27 Feb 2015 to 13 Mar 2015
10 - 13 Mar 2015 to 27 Mar 2015

61
Figure 5-7: WMMEA benefit tracker.

62
5.2. Results – Proposition Two
The second proposition serves to verify that benefits from the
implementation, as predicted by the BRM methodology, have been
realised. As stated in the “Propositions” section, the focus is on the
outcomes. These outcomes are determined from benefit measurement
data. These measurements are defined on the benefits profiles and
summarised on the benefit tracker template shown in the results for
proposition one.
This section explains how the measurements were derived. As explained
in the “Data Gathering” section, three methods were used for data
gathering. Due to the large amount of data gathered, only one example of
each method will be given in this section. A complete summary of each
benefit measurement (along with data points) is available in “APPENDIX
B: Benefit Profiles”. The raw data used is available in digital format
accompanying this report. The raw data is structured such that the data
manipulation steps are visible. A guide to the data manipulation
accompanies the data.
The majority of measurements (12 of 17) are made with data mined from
the company’s digital database. The measurement data for benefit “L1.
Decrease MES downtime impact” will be detailed here as an example. The
purpose of the measurement is described in its benefit profile and is not
discussed here.
The benefit profile describes the measurement as: “Downtime is measured
as a percentage of operators who used the system per shift versus the
total number of operator shifts in the given time period”.
The data is derived and manipulated as follows (Figure 5-8 summarises
the steps):
Two SQL queries are devised. One calls historic production order
data from the MES system and the other from the ERP system.

63
The data in each is pivoted in order to group operator login entries
by date and filter out machines not associated with the ERP
system.
For each time period “n”, the number of logins is counted. For the
MES system count, call this number “Xn”. For the ERP count, “Yn”.
Because the MRP data is reconciled weekly, no operator logins are
omitted (this reconciliation is done so that operators would get paid
for the days which they work). Evaluating the count of MES logins
against this count gives the downtime percentage. For each period
“n”, calculate the downtime percentage:
Downtime Percentage = (1-Xn/Yn)*100
Graph the percentage against period and insert linear trend line.
If the trend is in the predicted direction, colour the line green, else
colour it red.
The specifics (query details, field names, formulae used, and file
names) of the manipulation are found on the digital media
accompanying the report.
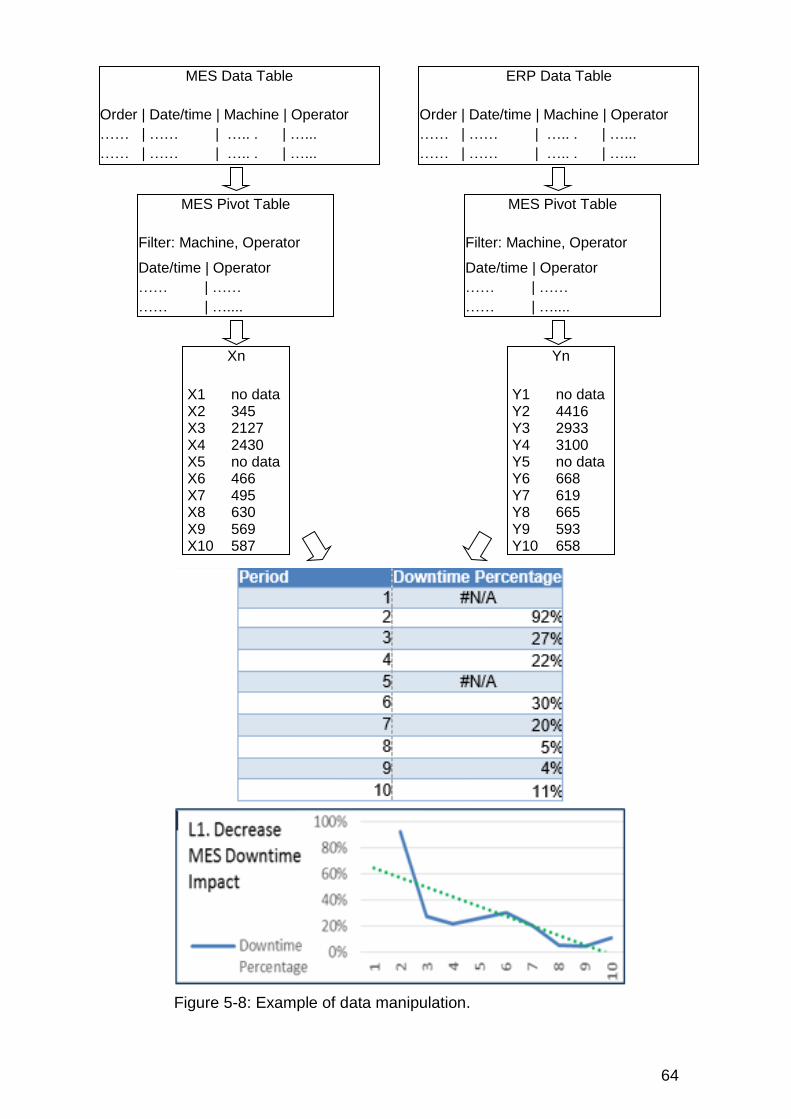
64
MES Data Table
Order | Date/time | Machine | Operator
…… | …… | ….. . | …...
…… | …… | ….. . | …...
ERP Data Table
Order | Date/time | Machine | Operator
…… | …… | ….. . | …...
…… | …… | ….. . | …...
MES Pivot Table
Filter: Machine, Operator
Date/time | Operator
…… | ……
…… | …....
MES Pivot Table
Filter: Machine, Operator
Date/time | Operator
…… | ……
…… | …....
Xn
X1 no data X2 345 X3 2127 X4 2430 X5 no data X6 466 X7 495 X8 630 X9 569 X10 587
Yn
Y1 no data Y2 4416 Y3 2933 Y4 3100 Y5 no data Y6 668 Y7 619 Y8 665 Y9 593 Y10 658
Figure 5-8: Example of data manipulation.

65
One measurement (“L5. Increase number of contact points”) was made
through primary observation.
The benefit profile describes the measurement as: “A Count of the number
of contact points that management has available to interact with the
system. Multiple contact points of the same kind are not counted”.
The following contact points are observed by the researcher:
1. PC program – The interface initially supplied by the vendor.
2. Workflow PC program – A dashboard like interface, launched in
December 2013, for signalling work release to logistics.
3. Status indicators – An interdepartmental dashboard, launched in
March 2014, which conveys a machine status to the department
which needs to address it.
4. Tablet access – July 2014 software customisation allowing access
to certain modules by phone or tablet. Tablets were purchased.
5. Cell phone access – July 2014 software customisation allowing
access to certain modules by phone or tablet.
6. SMS notification – November 2014 upgrade to the status indicator
dashboard, allowing it to SMS status escalations to relevant people.
7. Operator terminal – A screen saver like addition to operator
terminals, launched in November 2014, which displays a machine
state summary to passers-by while the terminal is not in use.
Figure 5-9 shows the cumulative number of contact points across the time
periods. A green trend line indicates change in the predicted direction.
Figure 5-9: Example of data gathered through primary observation.

66
The third data gathering method was the structured interview. 4 of 17
benefits were measured in this manner. The measurement data for benefit
“I2. Improve decision making ability” will be detailed here as an example.
The benefit profile describes the measurement as: The improvement in
management’s decision making ability as experienced by the process
engineer and the machine shop manager. These stakeholders were asked
to comment on whether their ability to make decisions has increased,
stayed the same, or decreased over the given time period. Each
“increased” answer is given a 1, “stayed the same” is given a 0, and
“decreased” is given a -1. The answers from the two stakeholders are then
summed together and plotted cumulatively”.
Figure 5-10 shows the questionnaires completed and signed by the two
stakeholders. Two points need to be clarified. Firstly, the company
employees refer to the MES system as CIM. This is why the word CIM is
used on the questionnaire. Secondly, the title of this research report has
changed since the questionnaires were completed. The old name is visible
on the questionnaire.
Figure 5-11 shows the questionnaire answers summarised in a table and
graphed as described in the benefit profile (green trend indicates change
in the predicted direction). The following is an example of how this is done:
The first period starts at an arbitrary point (0). This is the result of
the researcher having created a quantitative scale for a qualitative
measurement.
For the second period, the stakeholders responded with “No
change” and “Declined” respectively. As per the measurement
definition this is converted to “0 + (-1) = -1”
For the third period, the stakeholders responded with “No change”
and “No change” respectively. As per the measurement definition
this is converted to “0 + 0 = 0”. Because the measurement is
cumulative, the third point remains -1.
The remaining periods are calculated by repeating the above step.

67
Figure 5-10: Questionnaire example.
Figure 5-11: Example of data gathered through structured interview.

68
In summary, this chapter has detailed the case, initially defined in the
“Introduction” chapter. In the results for proposition one, the reader is
taken through the deliverables of the applied BRM methodology. This
includes the strategy map which was used to initially find a place for the
MES system in the company. The benefits dependency map then
summarises the issues and benefits uncovered in the stakeholder
workshops. Appendix A and B contain the details of this summary. While
these details are not crucial for satisfying the proposition, they give the
reader an understanding for the issues the stakeholders had to deal with
and the benefits that they wanted to achieve. The solution management
template summarises the projects that the stakeholders devised in order to
address the issues and realise the benefits they wanted. Appendix C
details the outcomes of these projects. Finally, the benefit tracking
template gives the reader a feel for the sort of feedback that stakeholders
had throughout the implementation. The second proposition is concerned
with the measurement outcomes for each benefit. Since these were
summarised in proposition one, the results for proposition two go into
more detail on how the measurements were derived.

69
6. DISCUSSION
This chapter is a critique of the BRM methodology and of the results
obtained in this research. It serves as a platform for the researcher to put
the results into context by relying on knowledge gained through ongoing
participation in the company’s activities. Opinions which the researcher
cannot verify, but feels should be considered, are highlighted.
This chapter begins with a discussion on BRM methodology. Here the
adaptation of the method and the reasons behind why the approach is
taken are revisited. The details of the initiative are then evaluated against
the requirements of proposition one. The aim is to see whether the
approach taken by the company was as specified by BRM. The outcomes
of the approach are the benefits realised, which are measured
quantitatively. These measurements are evaluated against proposition
two. Finally, the reliability and validity of the approach taken by this
research report are tested.
6.1. Discussion on BRM Methodology
It is important that the reader does not confuse the established research
methodology applied in this report (single case study evaluation) with the
BRM methodology under examination. This report is the first documented
attempt at applying BRM methodology for MES system development and
implementation. The “Literature Review” chapter identifies a case where
Business Process Re-engineering (BPR) is used for a similar purpose.
While this process has many similarities with BRM, sufficient differences
are identified to call this case study unique.
BRM methodology is selected due to its stated applicability in large scale
IT system implementations. In particular it is able to specify system
requirements from a company objective (rather than a supplier module)
perspective; and it is able to align stakeholders to these requirements.
This presents an organisation centred approach to implementation which

70
the “Literature Review” chapter has identified as an important gap in MES
system implementations.
Although this report specifies BRM methodology, some adaptations had to
be made by the researcher in order to streamline the broad body of BRM
knowledge into a, MES specific, step like methodology which can be
applied in companies that do not have a BRM program. The methodology
is able to derive:
The business requirements (or benefits) from MES systems.
The hurdles (or issues) to implementing MES systems.
The business changes and systems that need to be put in place
to overcome the issues and realise the benefits.
The outcomes (identified necessary for MES development and
implementation) of the adapted methodology are:
A strategy map.
Stakeholder management methodology.
A benefits (dependency) map.
Benefit profiles.
A solution management template.
A benefits tracking template.
The following are some key adaptations made and the reasoning behind
them (The full details are available in the “Theoretical Framework”
chapter):
Stakeholders and the required interaction between these
stakeholders has been predefined. This eliminates the need to dive
into BRM theory which details stakeholder selection and
management.
An “issues” section replaces the traditional BRM “systems” section.
BRM is usually used to implement existing systems (these would
fall under the traditional “systems” section). MES however
implements highly customised systems and the “issues” section

71
helps to specify their requirements by highlighting which issues
they need to address.
The traditional BRM “systems” and “business changes” sections
have been batched into one “enablers” section. This encourages
projects to be specified which concurrently address system
implementations as well as the process changes which need to
accompany them.
The adapted methodology has no company specific or environment
specific references. Any references to teams and stakeholders could be
considered applicable in numerous companies.
6.2. Discussion on Proposition One
This section refers to the initiative specific results of applying the adapted
BRM methodology at WMMEA. Application of the BRM methodology is an
extensive exercise that derives the company specific requirements for
MES systems development and implementation; and then measures the
benefits gained from these systems. The measurement of benefits is not
done only to gauge success, but also to identify and remedy shortfalls in
the implementation.
The results related to this proposition aim to tell the reader a “story” about
the events that took place during the implementation. To satisfy the
proposition, results do not have to be presented through this “story”
approach. This is done to expose the reader to events he may otherwise
not have been able to anticipate. While the researcher recognises that
these events cannot be generalised to all companies, he believes that
detailing them will be of value to most readers planning to embark on a
similar initiative. This belief is backed by observing that both Meyer et al.
[3] and Scholten [7] identify organisational issues (Table 6-1) common with
those identified in this case study. Neither of these texts however give
“real world” examples of how these issues occurred or how they were
handled.
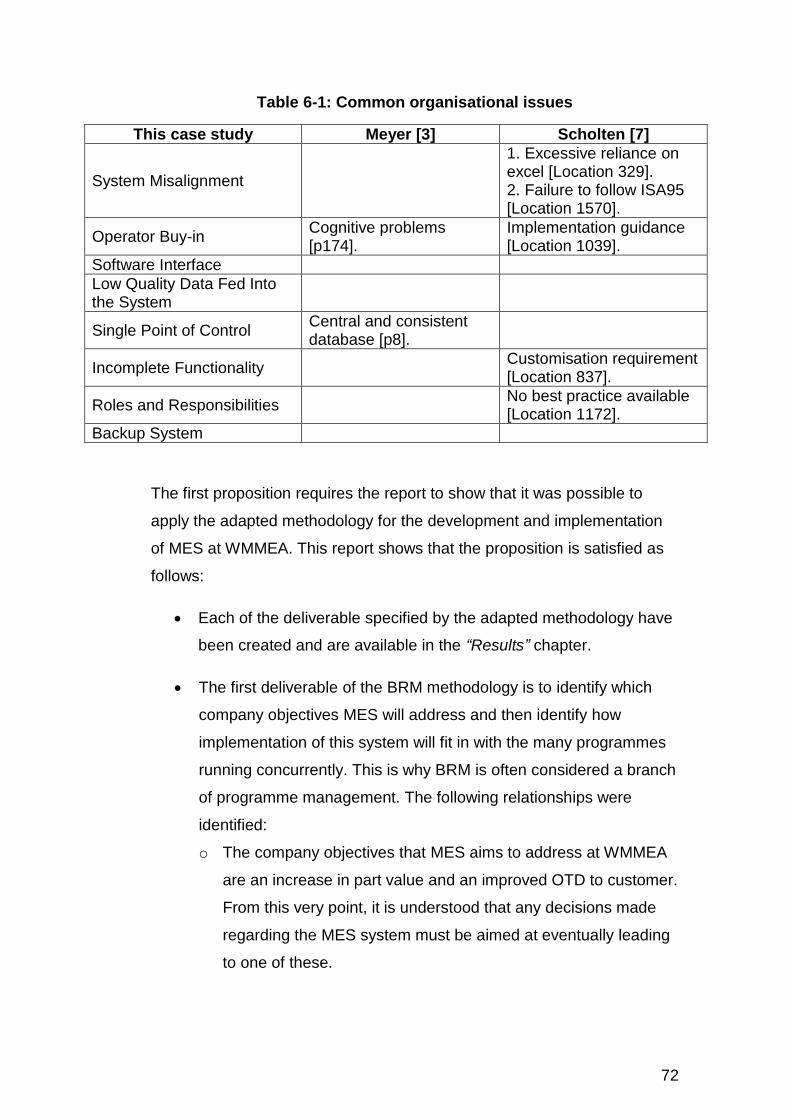
72
Table 6-1: Common organisational issues
This case study Meyer [3] Scholten [7]
System Misalignment
1. Excessive reliance on excel [Location 329]. 2. Failure to follow ISA95 [Location 1570].
Operator Buy-in Cognitive problems [p174].
Implementation guidance [Location 1039].
Software Interface
Low Quality Data Fed Into the System
Single Point of Control Central and consistent database [p8].
Incomplete Functionality Customisation requirement [Location 837].
Roles and Responsibilities No best practice available [Location 1172].
Backup System
The first proposition requires the report to show that it was possible to
apply the adapted methodology for the development and implementation
of MES at WMMEA. This report shows that the proposition is satisfied as
follows:
Each of the deliverable specified by the adapted methodology have
been created and are available in the “Results” chapter.
The first deliverable of the BRM methodology is to identify which
company objectives MES will address and then identify how
implementation of this system will fit in with the many programmes
running concurrently. This is why BRM is often considered a branch
of programme management. The following relationships were
identified:
o The company objectives that MES aims to address at WMMEA
are an increase in part value and an improved OTD to customer.
From this very point, it is understood that any decisions made
regarding the MES system must be aimed at eventually leading
to one of these.

73
o These objectives are further influenced by the machine shop
productivity programme and the Sales and Operations Planning
(S&OP) programme running concurrently to the MES
implementation. The weighted impact of the various
programmes on the downstream objectives was estimated
during the BRM workshops, but their ultimate contribution to the
benefit measurements could not be identified. This is discussed
further in the “Validity and Reliability” section that follows.
Stakeholders (referred to as benefit owners in BRM methodology)
participated as per the guideline set out in the adapted
methodology. They were made accountable for realisation of
benefits in their area of influence and were responsible for instating
the enablers that led to these benefits.
The second deliverable of the adapted BRM methodology is the
benefits map. This is the key working document, used in workshops
to specify the enablers (projects) that must be instated and to
identify the causal links between these and the company objectives.
There are no broken causal links in the benefits map (I.e. it was
possible to predict all the relationships between the enablers to be
instated and the company objectives to be achieved). This shows
that the adapted methodology is able to specify a complete set of
requirements for the MES system at WMMEA.
The requirements specified for the system and their timing are
detailed in the “Solution Management” section; the third deliverable
of the adapted BRM methodology (details of project execution are
out of the scope of this report). The key requirements (specific to
WMMEA) were identified as follows:
o System alignment: Four systems were involved in shop floor
control. Of these, the MES and the Kanban systems handled
similar data interchangeably. Without either of the systems
having the full data set, neither could accurately account for
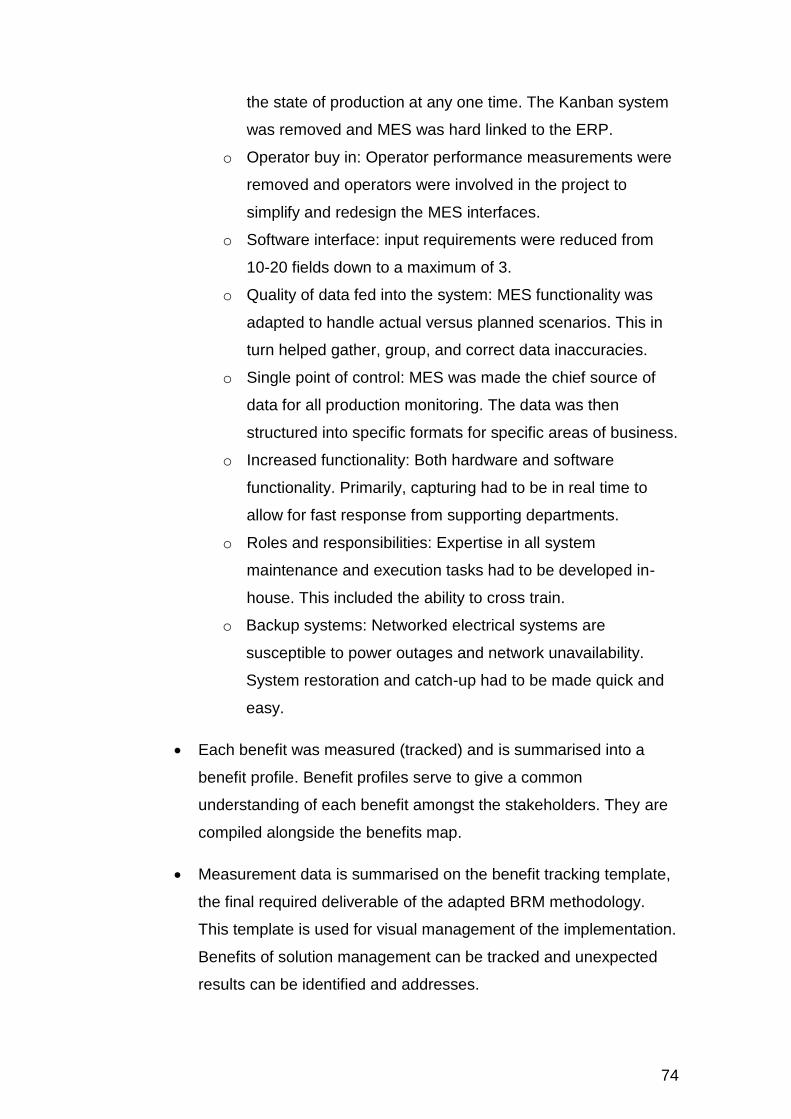
74
the state of production at any one time. The Kanban system
was removed and MES was hard linked to the ERP.
o Operator buy in: Operator performance measurements were
removed and operators were involved in the project to
simplify and redesign the MES interfaces.
o Software interface: input requirements were reduced from
10-20 fields down to a maximum of 3.
o Quality of data fed into the system: MES functionality was
adapted to handle actual versus planned scenarios. This in
turn helped gather, group, and correct data inaccuracies.
o Single point of control: MES was made the chief source of
data for all production monitoring. The data was then
structured into specific formats for specific areas of business.
o Increased functionality: Both hardware and software
functionality. Primarily, capturing had to be in real time to
allow for fast response from supporting departments.
o Roles and responsibilities: Expertise in all system
maintenance and execution tasks had to be developed in-
house. This included the ability to cross train.
o Backup systems: Networked electrical systems are
susceptible to power outages and network unavailability.
System restoration and catch-up had to be made quick and
easy.
Each benefit was measured (tracked) and is summarised into a
benefit profile. Benefit profiles serve to give a common
understanding of each benefit amongst the stakeholders. They are
compiled alongside the benefits map.
Measurement data is summarised on the benefit tracking template,
the final required deliverable of the adapted BRM methodology.
This template is used for visual management of the implementation.
Benefits of solution management can be tracked and unexpected
results can be identified and addresses.

75
Measurement data was mined directly from the company’s main
database and then manipulated to the measurement’s requirement.
Only when data was not available in the company’s database, was
it gathered through direct observation or structured interview. It is
necessary that all data be quantitative so that trends could be
identified in the benefit measurements.
5-10 data points were captured for each measurement. It is
possible to derive a linear trend for each.
6.3. Discussion on Proposition Two
The second proposition focused on the outcomes of the MES system
implementation. As discussed in the “Literature Review” chapter, a key
strength of the BRM method is its ability to link an enabler (such as a
process or system change) to a number of high level company objectives
through, sometimes unintuitive, cause and effect relationships. Identifying
these relationships is key to understanding the mechanics behind how a
system behaves within a company. This in turn helps to remove doubt and
bias from the development of business cases. MES system
implementation is tracked through measurement of the benefits it is
predicted to create at various levels in the company. It is required that a
benefit be defined as a measurable parameter. This way, the change in
the benefit is the benefit gained. A few points on interpreting benefit
measurements in this case study:
There are no targets for the magnitude of the benefit gained
because no benchmark could be identified in the setting out of this
research report. For the purpose of this report therefore, a benefit
change in the desired direction, regardless of magnitude, is
considered a positive gain for the company.
o The benefits gained could become a benchmark if the
initiative is to be repeated.

76
Some measurements have no values on the vertical axis. Due to
the method of data collection only a direction of change and a
relative rate is identified (sufficient to satisfy the second
proposition). The detail of each measurement is defined in the
relevant benefit profile.
The second proposition requires the report to show that changes in the
benefit measures happen in the predicted (desired) manner. Observing
measurement data, this report shows that the proposition is satisfied as
follows:
It is possible to ascertain a trend for all fifteen benefits and both
company objectives.
o Benefit measures all have between 5 and 10 data points.
14 of 15 measurements have a trend in the predicted direction.
o The exception (highlighted in Figure 6-1) is benefit “I4.
Decrease Response Time”. It shows that the time it takes
supporting departments to respond to downtime events has
increased.
This is against expectation as this benefit leads from
the following lower level benefits and enablers:
Project 7 – Roles and responsibilities for
addressing downtimes have been defined.
Project 6 – System functionality for signalling
downtime causes has been improved.
Benefit L5 – The number of contact points that
supporting departments have to interact with
the system has increased.
Benefit L6 – The ability of the system to handle
unplanned work has improved.
All the causes that are predicted to have an impact on
this benefit are trending in the desired direction. This

77
typically indicates that there may be a factor that has
been overlooked.
To add to the above reason for why this measurement
is unexpected, the resulting benefit “H4. Increase
Machine Shop OEE” can be noted. It trends in the
desired direction even though its causal benefit “I4”
does not.
The following is the researcher’s unproven opinion.
The benefit measure, not the benefit itself, may have
been influenced negatively by benefit “L4. Increase
Accuracy of Data”. To explain practically:
Operators have been empowered to capture
what happens on the floor in far more detail
than they previously could (it was previously
only practical to report downtimes with major
impact).
Short, yet regular, downtimes would previously
go unreported. The time lost would be bundled
into the run time of the operation (a speed
loss).
Figure 6-1: Unforeseen measurement.
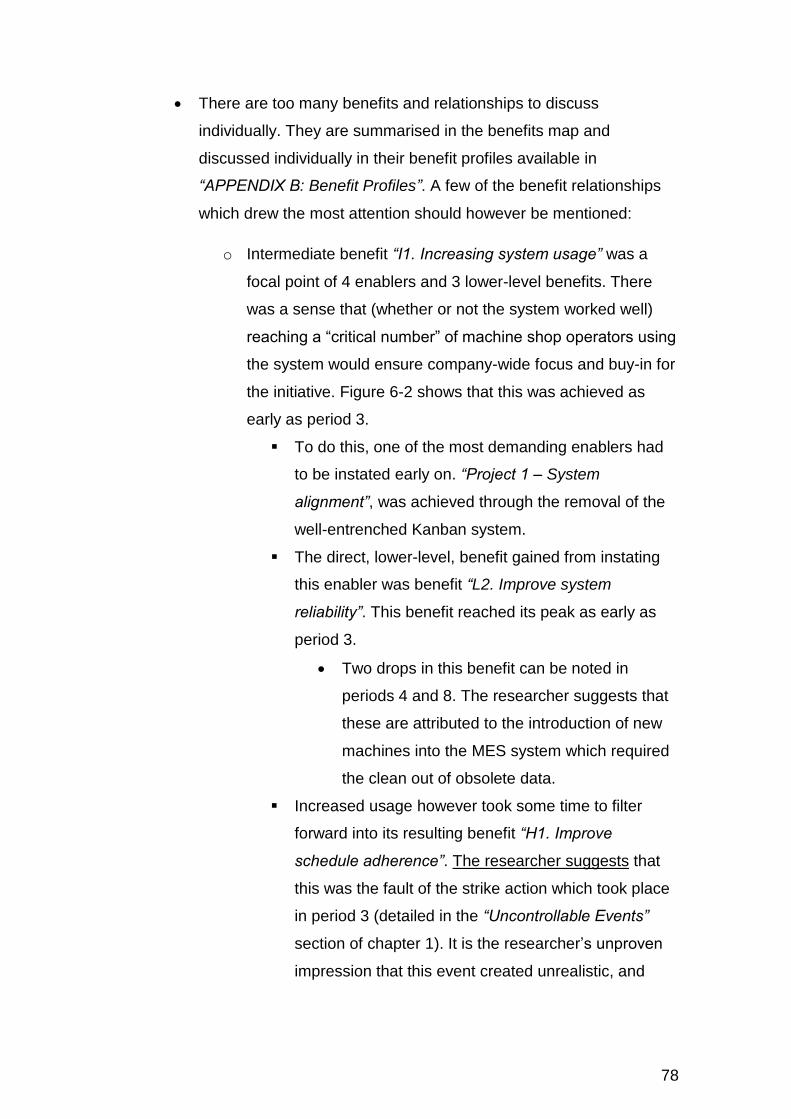
78
There are too many benefits and relationships to discuss
individually. They are summarised in the benefits map and
discussed individually in their benefit profiles available in
“APPENDIX B: Benefit Profiles”. A few of the benefit relationships
which drew the most attention should however be mentioned:
o Intermediate benefit “I1. Increasing system usage” was a
focal point of 4 enablers and 3 lower-level benefits. There
was a sense that (whether or not the system worked well)
reaching a “critical number” of machine shop operators using
the system would ensure company-wide focus and buy-in for
the initiative. Figure 6-2 shows that this was achieved as
early as period 3.
To do this, one of the most demanding enablers had
to be instated early on. “Project 1 – System
alignment”, was achieved through the removal of the
well-entrenched Kanban system.
The direct, lower-level, benefit gained from instating
this enabler was benefit “L2. Improve system
reliability”. This benefit reached its peak as early as
period 3.
Two drops in this benefit can be noted in
periods 4 and 8. The researcher suggests that
these are attributed to the introduction of new
machines into the MES system which required
the clean out of obsolete data.
Increased usage however took some time to filter
forward into its resulting benefit “H1. Improve
schedule adherence”. The researcher suggests that
this was the fault of the strike action which took place
in period 3 (detailed in the “Uncontrollable Events”
section of chapter 1). It is the researcher’s unproven
impression that this event created unrealistic, and
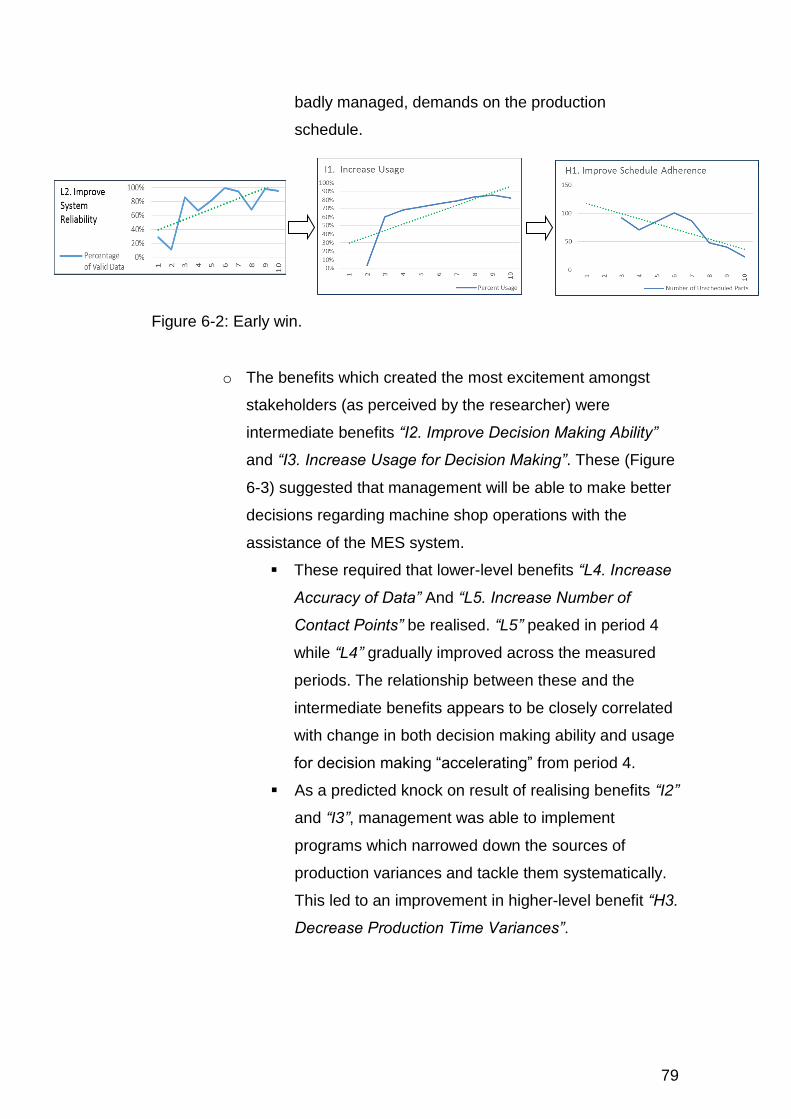
79
badly managed, demands on the production
schedule.
o The benefits which created the most excitement amongst
stakeholders (as perceived by the researcher) were
intermediate benefits “I2. Improve Decision Making Ability”
and “I3. Increase Usage for Decision Making”. These (Figure
6-3) suggested that management will be able to make better
decisions regarding machine shop operations with the
assistance of the MES system.
These required that lower-level benefits “L4. Increase
Accuracy of Data” And “L5. Increase Number of
Contact Points” be realised. “L5” peaked in period 4
while “L4” gradually improved across the measured
periods. The relationship between these and the
intermediate benefits appears to be closely correlated
with change in both decision making ability and usage
for decision making “accelerating” from period 4.
As a predicted knock on result of realising benefits “I2”
and “I3”, management was able to implement
programs which narrowed down the sources of
production variances and tackle them systematically.
This led to an improvement in higher-level benefit “H3.
Decrease Production Time Variances”.
Figure 6-2: Early win.

80
Higher-level benefits generally trail after lower-level benefits. Figure
6-4 shows the benefit chains that lead to objective “O1. Maximise
availability and OTD”.
o The greatest improvement in objective “O1” happens in the
last two periods.
o “O1” is dependent on higher-level benefits “H1” and “H2”
which similarly show improvement in the later periods
(periods 7 to 10 and 8 to 10 respectively).
o Intermediate benefits fittingly show improvement in the
intermediate periods. “I1” from period 2 onwards and “I2” and
“I3” from period 4 onwards.
o Lower-level benefits “L1” and “L2” peak as early as period 3.
“L5” peaks in period 4. They remain stagnant from there on.
Lower-level benefit “L4” similarly shows a sharp
improvement up to period 5, but then continues
improving steadily over the later periods. This
behaviour falls in line with its unique dependence on
intermediate benefit “I1”, which improves consistently
over time.
Figure 6-3: "Exciting" benefits.

81
o The causal relationships are not always as evident as the
ones described in the previous points. Lower-level benefit
“L3. Decrease the Number of Complaints” is a clear
exception. The researcher wishes to note that exact
mathematical relationships between measurements are not
known and so interpretations are speculative. To this point,
the researcher speculates that the number of complaints
(“L3”) can be expected to increase as system usage (“I1”)
increases. Only once usage begins to peaks, can it be
expected that addressing complaints will cause their number
to decrease.
Figure 6-4: Benefit chains of company objective "O1".
82
Both measurements of the company objectives (shown in Figure
6-5) trend in the predicted (desired) direction.
o This means that the company is performing better than it did
at the start of the project.
o The impact from supporting initiatives on the company
objectives is unknown. These are discussed further in the
“Validity and Reliability” section.
Figure 6-5: Trend in company objectives.

83
6.4. Validity and Reliability
This section is separated from the rest of the discussion because the
researcher wants the reader to dedicate his focus to the results of the
study. Adding comments to validate the method in between points in the
discussion would repeatedly bounce the reader between considering the
topic of research and the research approach. However, in order to
demonstrate that the approach taken is both methodologically sound and
sufficiently rigorous; the following four tests are discussed:
6.4.1. Construct Validity
Cases are often complex and take place in uncontrolled environments.
This may give a researcher various avenues for collecting data and
specifying measurements for addressing a research question. This creates
opportunity for the researcher to specify poor measurements and use
subjective judgement in collecting data.
In this case, all measurements were agreed on with stakeholders in the
system. This is a form of participant validation which Yin [30] recommends.
Furthermore, the company objectives that the system addresses are not
new measurements specified for the case. They are established business
metrics.
Data collected is quantitative. It was collected from the main company
database and the values are not subjected to interpretation. The direction
of trends is therefore also not open to interpretation.
All points made by the researcher, which are unsupported by the
evidence, are highlighted as the researcher’s opinion.

84
6.4.2. Internal Validity
Because this case study is an evaluation, internal validity is particularly
important. I.e. it doesn’t present information to be pondered or interpreted
by the reader, it presents a quantitative conclusion (in the form of trend
data). Internal validity is the need to prove that the trends and
relationships obtained, are not a matter of coincidence or due to aspects
not considered by the researcher. In case study research, it is often the
case that it is not possible to collect sufficient data to determine statistical
validity. This case study suffers from the same problem. There are
however alternative techniques, used in case study research, to determine
internal validity. Three analytical techniques are applied to validate the
results.
Pattern matching evaluates the measurements derived in the case study
to those predicted at the start of the study. This is a particularly good
technique to use for validating BRM methodology, because BRM
methodology relies heavily on predicting the benefits of initiatives base on
predicting cause and effect relationships at play within the company. 14 of
15 benefits were predicted correctly. In the discussion, the researcher
suggests that this benefit is predicted correctly but that the measurement
method is flawed.
In pattern matching, it is important to consider that no major underlying
variable (for example: a swing in the market conditions) is responsible for
a general shift in all measurements (a rival theory). In this case it is
important to note that the external conditions affecting lower level benefits
are different to those affecting high level company objectives. It is
therefore unlikely that a single variable will create this sort of effect. I.e.
Low level benefits are affected by fewer things that generally happen on
the shop floor, while high level objectives are affected by more factors,
some of which may be far outside the company. Some factors however do
need to be considered and these are discussed in the following two
paragraphs.

85
Chronological sequence time series analysis matches data points with the
events taking place at the time the data point is taken. Because case
studies are usually not done under controlled conditions, fluctuations in the
measurement data can often be explained by considering major events
that took place during data collection. The data captured in this research is
separated into periods. Each period presents different considerations to
the case (e.g. a period in which there was strike action) and the effect of
these considerations is visible in the trend data.
The logic model aims at unearthing cause and effect relationships. Like
pattern matching, it too relies on predicting the relationship between data.
Unlike pattern matching however, it spans across measurements. It
identifies causal links between measurements which may be based on
different data. In this report, the method is used to validate the relationship
between benefits at different levels. It may for example be posed that
while pattern matching validates the majority of the predicted benefits, a
certain high level benefit may have conveniently been a result of an
unexplained external effect. The BRM model has predicted that a benefit
will be obtained, as an effect of actions taken by the project teams. These
actions were taken and pattern matching showed that the benefit was
obtained. In the discussion the researcher further shows that benefits
occur at logical points in time. I.e. A higher level, knock on, benefit only
occurs after a lower level benefit has occurred. If the opposite had been
the case, the report would have had to conclude that the prediction was
invalid. Unfortunately, this effect is not clear between all benefits. The
researcher suggests that complex relationships are at play and provides
scenarios that potentially lead to the observed effects. Analysing the data
from this (second) perspective is a form of triangulation of findings. I.e.
coming up with the same result when looking at the case from a different
perspective.

86
6.4.3. External Validity
A good case study presents conclusions, methods, or explanations which
are of interest or importance to others. This report aims at presenting a
methodology that will improve MES system development and
implementation. The report recognises that the findings presented cannot
be generalised across all industries. It further recognises that the method
presented is not compared to potential alternative methods. A case study
is however generalizable to its theoretical propositions. In this case, it can
be said that the findings are valid for any MES implementation WMMEA
chooses to undertake in the future or in another branch. All WMMEA
branches undertake the same activities using the same business model. It
can further be said that the same is valid in manufacturing throughout the
WEIR group which shares its resources and management practices. This
is the group that may find this research of importance.
The researcher however hopes that attempts will be made to extrapolate
the findings further. The adaptation to BRM methodology was made in
order to accommodate MES systems. No company specific adaptations
were made. There is therefore potential for companies in similar industries
(i.e. small lot manufacturing) to attempt the method. As the nature of the
industry changes, the likelihood of applicability will decrease.
6.4.4. Reliability
Reliability considerations exist to reduce error and bias in a case study
research. There are two focus areas.
Case study protocol needs to be based on established (validated)
methodology. This is detailed in the research methodology (establishing
propositions, bounding the case, etc.). The methodology applied in this
report is case study research for evaluation, as described by Yin [30]. The
case study specific protocol also needs to be documented in detail.
Sufficient detail implies that a later researcher will be able to follow the
same protocol and repeat the study. The specific methodology applied in

87
this case study is the adapted BRM methodology. Considering that BRM
methodology is a body of knowledge too large to be detailed in this report,
the researcher summarises the main points and references the further
reading necessary to obtain a working knowledge of the methodology. The
adaptations made to the methodology are explained in detail in the
“Theoretical Framework” chapter. The reasoning behind these adaptations
is discussed both in the “Theoretical Framework” and “Results” chapters.
The researcher needs to maintain a case study database. This is a record
of all the data (or evidence) he’s obtained throughout the research. A
reader, should he choose, should be able to separate out and evaluate the
raw data used in the report. He can in this way, validate that the
researcher’s manipulation of data is unbiased. While the above protocol
dictates how data is to be gathered, this database should go into more
detail about the exact source of data.
This report contains a few forms of data. All the information detailing the
activities that took place (the data used to satisfy the first proposition) is
presented in the “Results” chapter of this report. For proposition two, only
a summary of the measurement data is presented in this report. In the
form of graphs, in the “Results” chapter; and as tabulated data (the value
of the graphed data points) in Appendix B. The raw data, which is
manipulated to get these results, is too large to fit into the report. This data
accompanies the report in digital format. The data extracted is clearly
labelled, however the queries used to extract it are not detailed. The code
behind these queries may be confidential, but it is also likely to be of no
use to anyone without a map of the company data structure. The queries
used are identified by name. It is a company requirement to store the
detail of these named queries indefinitely in a secure location on tape. It is
therefore always possible to retrieve this information if necessary.
Because the data manipulation is done computationally (using excel
formulas, pivot tables, etc.), the digital format of the data is, as far as
possible, structured to demonstrate the manipulation process. Where this
is not clear, instructions for computational manipulation of the raw data are

88
presented alongside the data. A final two points should be mentioned. 1 of
the 17 measurements was made by direct observation (a count by the
researcher) and can only be validate by repeated direct observation on
site. 4 of the 17 measurements were made through structured
questionnaires. Copies of these signed questionnaires are available in
digital format as part of the accompanying data.
6.4.5. Limitations of the Research
The following are some limitations that the researcher was unable to
overcome:
Unknown data accuracy – Due to the volume of data and time over
which it was captured, the researcher is unable to audit individual
data points for accuracy. The requirement for accuracy is satisfied
by recognising that it is only necessary to identify a trend (increase
or decrease). All changes in measurement data exceeded 4%.
Considering that company master data is used (the same data used
for financial reporting) and that this data comes from an audited
ERP; the researcher has chosen to assume that any potential data
inaccuracy could not be significant enough to alter the results of the
research.
No experimental control and external influences – Ideally the
researcher would have cordoned off a number of machines on
which to not implement MES. These would serve as a control
against which to gauge the machines using MES. This action is
however not in the interest of the company under consideration.
This control would have been a great boost to validity as it would
have been able to isolate the effects of the unknown factors that
influenced the measurements. For example: It was known that
objective O2 would be influenced by the machine shop productivity
programme. The result of this influence could have been measured
on the control and factored out of the measurement data.
89
Statistical validation – Statistical validity adds to internal validity. In
this report, measurement sample sizes are limited and distributions
are unknown. This makes determining statistical validity impossible.
Lack of direction – There is no set measure for determining how
many benefits have to be achieved, out of the total predicted, in
order to say that the adapted methodology is valid. The researcher
is fortunate that a large majority (16 out of 17) are achieved; and
that he is able to present a plausible explanation for why the
remaining one is not. The researcher is also unable to identify a
reliable benchmark for the magnitude of the benefit to be achieved.
Unknown cause and effect relationship – Relationships between
benefits were predictions made by the stakeholders. No
mathematical relationship can be attributed to these. While an
observed relationship “seems” causal, the causality cannot be
confirmed in all situations. For example: It was predicted that
addressing operator complaints will increase system usage. The
effect of increased usage by operators can however lead to more
complaints. The lower-level measurement for complaints may then
seem stagnant while usage increases. When using visual
inspection, as is done in this report, this effect will mask the causal
link between the two.

90
7. CONCLUSIONS
This research report investigated the question “Is BRM a valid method for
MES development and implementation?” through a case study conducted
at WMMEA.
It is understood that due to the limitations of single case study research, it
is not possible to answer this question in a generalised manner. It is
however possible to generalise the case to the theoretical propositions
posed.
Two theoretical propositions have been posed:
The first proposition required the report to show that it was possible to
apply the adapted methodology for the development and implementation
of MES at WMMEA; and to show that the methodology was applied. The
proposition is shown to be true with all the deliverable specified by the
adapted methodology being derived. These deliverables include:
A company specific strategy map shows that the objectives to be
achieved are an increase in part value and an improved OTD to
customer.
A company specific benefits map details the cause and effect
relationships between all the benefits that need to be realised in
order to achieve the company objectives. Having no broken causal
links in the benefits map shows that the adapted methodology is
able to specify a complete set of requirements for the MES system
at WMMEA.
The specification of requirements was followed by projects
executed to achieve them. Requirements were specified as:
o System alignment.
o Creating operator buy-in.
o Software interface improvement.
o Improved quality of data fed into the system.

91
o Creation of a single source of data for shop floor
management.
o Increased hardware and software functionality.
o Defining of roles and responsibilities.
o Development of a backup system.
The second proposition required the report to show that changes in the
benefit measures happened in the predicted (desired) manner.
Measurement data shows that this proposition is satisfied as follows:
It is possible to ascertain a trend for all fifteen benefits and both
company objectives.
The majority of benefit measurements (14 of 15) have a trend in the
predicted direction.
Higher-level benefits generally trail after lower-level benefits.
Both measurements of the company objectives trend in the
predicted direction.
These results pass the test for reliability and the three tests for validity.
The limitations are found to be insufficient to invalidate the results.
Based on the acceptance of the propositions and tests of validity and
reliability, it can be concluded that: In the case of WMMEA “BRM is a valid
method for MES development and implementation”.

92
8. RECOMMENDATIONS FOR FUTURE WORK
This report provides evidence that BRM is a valid method for MES
development and implementation at WMMEA. The researcher hopes it will
motivate further research in the fields of BRM and MES. The researcher
has considered the following potential research topics:
Answering the same question on a generalised (not specific to any
one company) scale. The work requirement to gain a statistically
valid sample number may however be limiting. Additionally, there
may be little industrial requirement for validating the method
statistically.
The methodology developed here could be used to identify critical
success factors for the implementation of MES in companies. This
would be done by collating the following from a significant number
of companies:
o The most common company objectives that MES aims to
achieve.
o The most common issues that MES aims to address.
o The likely enablers that a company will have to instate in
order to address the issues and achieve the objectives.
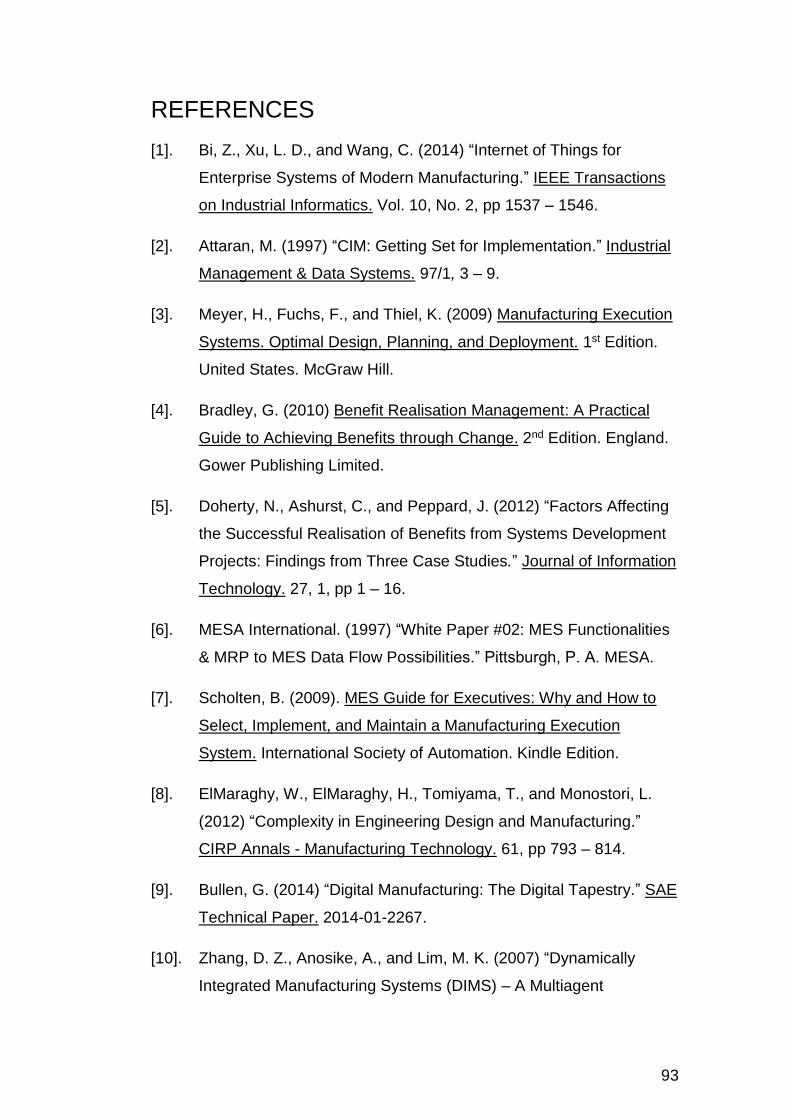
93
REFERENCES
[1]. Bi, Z., Xu, L. D., and Wang, C. (2014) “Internet of Things for
Enterprise Systems of Modern Manufacturing.” IEEE Transactions
on Industrial Informatics. Vol. 10, No. 2, pp 1537 – 1546.
[2]. Attaran, M. (1997) “CIM: Getting Set for Implementation.” Industrial
Management & Data Systems. 97/1, 3 – 9.
[3]. Meyer, H., Fuchs, F., and Thiel, K. (2009) Manufacturing Execution
Systems. Optimal Design, Planning, and Deployment. 1st Edition.
United States. McGraw Hill.
[4]. Bradley, G. (2010) Benefit Realisation Management: A Practical
Guide to Achieving Benefits through Change. 2nd Edition. England.
Gower Publishing Limited.
[5]. Doherty, N., Ashurst, C., and Peppard, J. (2012) “Factors Affecting
the Successful Realisation of Benefits from Systems Development
Projects: Findings from Three Case Studies.” Journal of Information
Technology. 27, 1, pp 1 – 16.
[6]. MESA International. (1997) “White Paper #02: MES Functionalities
& MRP to MES Data Flow Possibilities.” Pittsburgh, P. A. MESA.
[7]. Scholten, B. (2009). MES Guide for Executives: Why and How to
Select, Implement, and Maintain a Manufacturing Execution
System. International Society of Automation. Kindle Edition.
[8]. ElMaraghy, W., ElMaraghy, H., Tomiyama, T., and Monostori, L.
(2012) “Complexity in Engineering Design and Manufacturing.”
CIRP Annals - Manufacturing Technology. 61, pp 793 – 814.
[9]. Bullen, G. (2014) “Digital Manufacturing: The Digital Tapestry.” SAE
Technical Paper. 2014-01-2267.
[10]. Zhang, D. Z., Anosike, A., and Lim, M. K. (2007) “Dynamically
Integrated Manufacturing Systems (DIMS) – A Multiagent

94
Approach.” IEEE Transactions on Systems, Man, and Cybernetics –
Part A: Systems and Humans. Vol. 37, No. 5, pp 824 – 850.
[11]. Belisario, L. S. and Pierreval, H. (2013) “A Conceptual Framework
for Analyzing Adaptable and Reconfigurable Manufacturing
Systems.” Presented at the 5th IESM Conference. Rabat, Morocco.
[12]. Al-Aomar, R. (2002) “A Methodology for Determining Process and
System-Level Manufacturing Performance Metrics.” Powertrain &
Fluid Systems Conference & Exhibition. California. SAE
International.
[13]. Maedche, A. (2010) “An ERP-centric Master Data Management
Approach.” AMCIS 2010 Proceedings. Paper 384. Lima, Peru.
AMICS.
[14]. Rashid, M. A., Hossain, L., Patrick, J. D. (2002) “The Evolution of
ERP Systems: A Historical Perspective.” Enterprise Resource
Planning: Global Opportunities and Challenges. USA. Idea Group
Publishing, pp 1 – 16.
[15]. Hawking, P., Stein, A., and Foster, S. (2004) “Revisiting ERP
Systems: Benefit Realisation.” Proceedings of the 37th Hawaii
International Conference on System Sciences. Hawaii, USA. IEEE.
[16]. Beach, R., Muhlemann, A. P., Price, D. H. R., Paterson, A., Sharp,
J. A. (2000) “The Selection of Information Systems for Production
Management: An Evolving Problem.” Int. J. Production Economics.
64, pp 319 – 329.
[17]. ISA. (2000) “Enterprise-Control System Integration. Part 1: Models
and Terminology.” ANSI/ ISA– 95.00.01– 2000. Research Triangle
Park. ISA.
[18]. RKL eSolutions. (2014) Sage 500 Integration Styles. [Online]
Available at: http://www.rklesolutions.com/blog/sage-500-
integration-1/ [Accessed 20 October 2014].
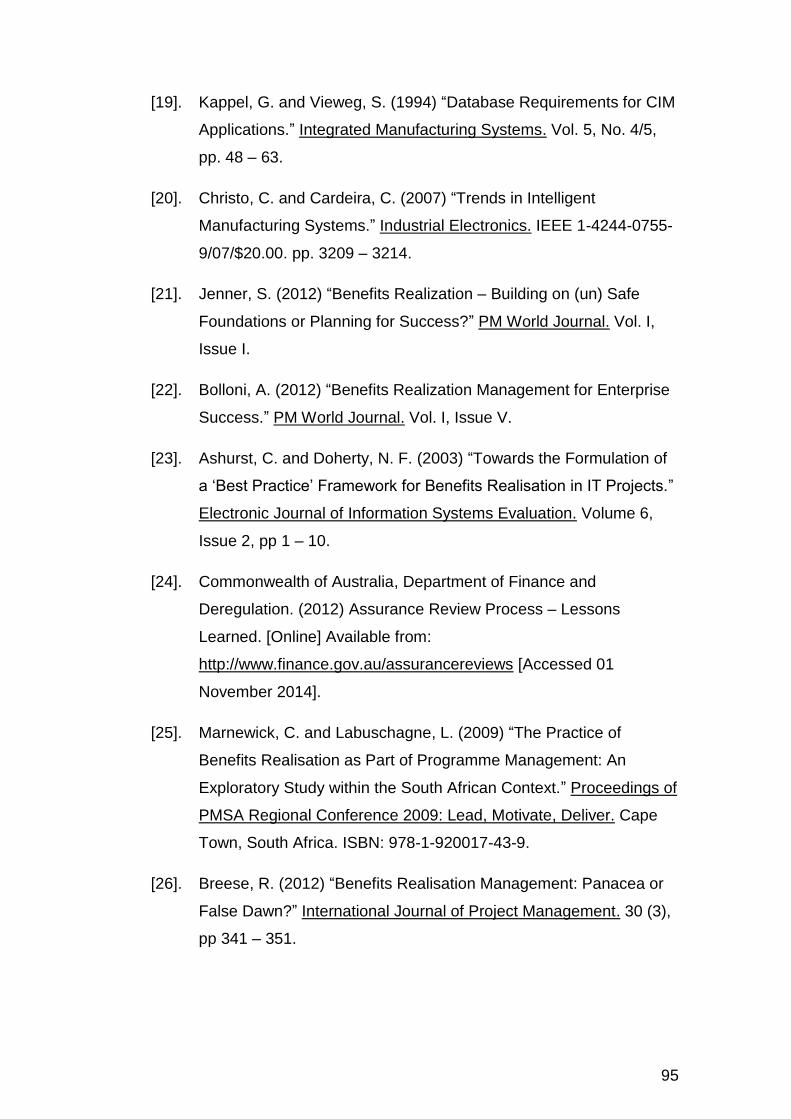
95
[19]. Kappel, G. and Vieweg, S. (1994) “Database Requirements for CIM
Applications.” Integrated Manufacturing Systems. Vol. 5, No. 4/5,
pp. 48 – 63.
[20]. Christo, C. and Cardeira, C. (2007) “Trends in Intelligent
Manufacturing Systems.” Industrial Electronics. IEEE 1-4244-0755-
9/07/$20.00. pp. 3209 – 3214.
[21]. Jenner, S. (2012) “Benefits Realization – Building on (un) Safe
Foundations or Planning for Success?” PM World Journal. Vol. I,
Issue I.
[22]. Bolloni, A. (2012) “Benefits Realization Management for Enterprise
Success.” PM World Journal. Vol. I, Issue V.
[23]. Ashurst, C. and Doherty, N. F. (2003) “Towards the Formulation of
a ‘Best Practice’ Framework for Benefits Realisation in IT Projects.”
Electronic Journal of Information Systems Evaluation. Volume 6,
Issue 2, pp 1 – 10.
[24]. Commonwealth of Australia, Department of Finance and
Deregulation. (2012) Assurance Review Process – Lessons
Learned. [Online] Available from:
http://www.finance.gov.au/assurancereviews [Accessed 01
November 2014].
[25]. Marnewick, C. and Labuschagne, L. (2009) “The Practice of
Benefits Realisation as Part of Programme Management: An
Exploratory Study within the South African Context.” Proceedings of
PMSA Regional Conference 2009: Lead, Motivate, Deliver. Cape
Town, South Africa. ISBN: 978-1-920017-43-9.
[26]. Breese, R. (2012) “Benefits Realisation Management: Panacea or
False Dawn?” International Journal of Project Management. 30 (3),
pp 341 – 351.

96
[27]. Cognizant. (2013) Best Practices for Global MES Rollouts.
Cognizant 20-20 Insights. [Online] Available from:
http://www.cognizant.ch/InsightsWhitepapers/Best-Practices-for-
Global-MES-Rollouts.pdf [Accessed 15 December 2015].
[28]. Liu, S. and Chen, R. (1998) “Understanding and Implementing CIM
through BPR.” International Journal of Operations & Production
Management. Vol. 18, No. 11, pp 1125 – 1133.
[29]. McNiff, J. and Whitehead, J. (2002) Action Research: Principles
and Practice. Second Edition. London. Routledge Falmer.
[30]. Yin, R. K. (2013). Case Study Research: Design and Methods
(Applied Social Research Methods). Fifth Edition. SAGE
Publications. Kindle Edition.
[31]. Blichfeldt, B. S. and Andersen, J. R. (2006) “Creating a Wider
Audience for Action Research: Learning from Case Study
Research.” Journal of Research Practice. Vol 2, Issue 1, Article D2.
[32]. Iacono, J., Brown, A., and Holtham, C. (2009) “Research Methods –
a Case Example of Participant Observation.” The Electronic Journal
of Business Research Methods. Vol 7, Issue 1, pp.39 – 46.

97
APPENDIX A: Issue Themes (Root Causes)
System Misalignment
The perceived symptoms for this issue theme (as they were described in
the workshops) are summarised in Table A-1.
Table A-1: System misalignment symptoms
Multiple Systems: Three separate systems, auxiliary to the ERP, are used to manage production. They do not communicate between themselves.
Planning done in Excel: Most of the communication from the planning department is distributed through non-standard Excel spreadsheets.
Unclear role on who updates MES data: There is no designated person or standard operating procedure.
No procedure for updating schedule: There are no set rules and timelines for production schedule release.
Soft system: Machine shop does not need MES to function. Urgent or inconvenient work can bypass MES.
No systems link: There is incomplete communication between systems. Data regularly has to be transferred manually.
Operators work on jobs not available in MES: Jobs that are delivered to or selected by operators are not planned in MES.
Operators can’t punch jobs into MES every time: Various technical issues prevented the clocking of jobs into MES.
There are too many instances of clocking on paper: Where an operator cannot (for any reason) clock work on the MES system he will instead just note it on paper.
Too many jobs in MES: Invalid work is entering the system making navigation difficult.
Actual times are skewed by operators to seem closer to standard times: Operators can cheat on their performance figures by entering any time values they chose.
Completed jobs showing in system: Jobs previously completed by the operator are returning to MES and showing as to-be-machined.
Material not at machine: There is no material available for the job which MES specifies as next in line.
Operators don’t know what to produce: Operators receive so many mixed messages that they no longer know what they need to produce.
It was identified that three distinct systems (see Figure A-1) supplemented
the MRP with scheduling, shop floor control, and production execution.
There was no logic dictating flow or interrelationship between the systems.
Furthermore, there was no hard link between MES and any other system.
Using the original (more entrenched) systems, MES could be completely
bypassed.
Figure A-1 shows that work instructions did not have to pass through
either the Kanban or MES system before machining. This is depicted by
no solid black arrow link (these links are required and the process cannot
continue without them being actioned). On the other hand, unavoidable
soft links are depicted as dashed black arrows (the overall process can

98
Figure A-1: Production systems diagram (original state).
continue without the link being actioned, but the operations following that
link cannot be), and avoidable soft links are depicted as red arrows (both
the overall process and the operations following the link can continue
without them being actioned). The MES system is linked entirely by
dashed arrows and runs in parallel with Kanban system. The ramification
of this is that when only some of the production data is captured by each
system, neither of the systems is able to accurately account for the current
state of production. This can be reconciled by the ERP but the process
falls behind real-time by a number of days making the information far less
valuable once it is finally made available.
ERP
Sales order Sales
Planning
Confirm
Refresh ordering report
SQL / Excel
Compile weekly
schedule
Logistics
Machine shop
Goods receipt
Hours accounting
Release order and print
documentation
Refresh capacity report
Material
Manufacturing order
Routing
Routing
Item master
Material
Issue material
Displayed and waiting on
Heijunka board
Kanban Move to Kanban board
Machining
MES
Available to clock
Clocking
Costing

99
Operator Buy-in
The perceived symptoms for this issue theme (as they were described in
the workshops) are summarised in Table A-2.
Table A-2: Operator buy-in symptoms
Irregular clocking: Operators need to be put under pressure to clock otherwise the task gets abandoned.
Not synchronising: Operators do not post work at regular intervals but rather in batches.
All events are not logged: Operators log events selectively.
Frustration due to inconsistencies: Operators express their dislike for the system and their unwillingness to use it, citing some issue they would commonly experience.
Task does not feel like part of the operator’s job: Operators state that interfacing with the system is not part of their job and they feel that they shouldn’t have to do it.
Operators would not only express their dissatisfaction with the system but
would also find ways to circumvent it whenever possible. With incorrect
and irregular clocking, the data gathered from the system becomes difficult
to interpret. When probed further, they explained that they were
dissatisfied about being measured using an inaccurate system.
The operators have only a very limited understanding of the purpose of the
system, and many have concluded that its purpose is to measure their
performance. This in turn creates an additional frustration in that using the
system actually detracts from their performance because of the added
administrative burden.
With no operator buy-in, continuous improvement and troubleshooting
faults becomes difficult. In addition, rather than addressing problems when
they arise, operators will drop the system and revert to the previous one.

100
Software Interface
The perceived symptoms for this issue theme (as they were described in
the workshops) are summarised in Table A-3.
Table A-3: Software interface issue symptoms
Inputting data is complicated: There are too many variables for operators to capture.
Difficult navigation: It is not easy to pinpoint the job being worked on in the system.
Standardised input: Different operators will input different codes for the same task.
The software interface was repeatedly customised in order for the operator
to be able to log and handle every variation of every scenario conceivable
on the shop floor. This led to an excessively complicated input interface.
Even with extensive training operators could not agree on how to interpret
various scenarios. To add to the complexity, operators were discouraged
from clocking certain activities because of the negative impact they had on
departments outside of the machine shop.
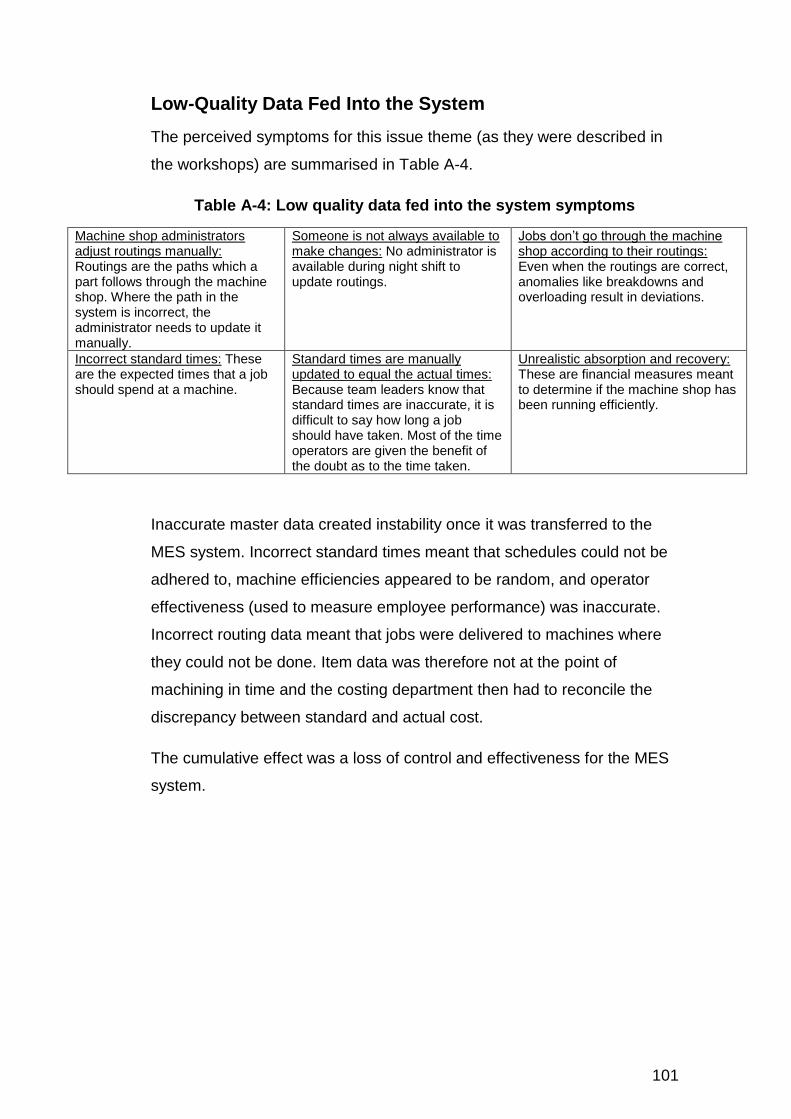
101
Low-Quality Data Fed Into the System
The perceived symptoms for this issue theme (as they were described in
the workshops) are summarised in Table A-4.
Table A-4: Low quality data fed into the system symptoms
Machine shop administrators adjust routings manually: Routings are the paths which a part follows through the machine shop. Where the path in the system is incorrect, the administrator needs to update it manually.
Someone is not always available to make changes: No administrator is available during night shift to update routings.
Jobs don’t go through the machine shop according to their routings: Even when the routings are correct, anomalies like breakdowns and overloading result in deviations.
Incorrect standard times: These are the expected times that a job should spend at a machine.
Standard times are manually updated to equal the actual times: Because team leaders know that standard times are inaccurate, it is difficult to say how long a job should have taken. Most of the time operators are given the benefit of the doubt as to the time taken.
Unrealistic absorption and recovery: These are financial measures meant to determine if the machine shop has been running efficiently.
Inaccurate master data created instability once it was transferred to the
MES system. Incorrect standard times meant that schedules could not be
adhered to, machine efficiencies appeared to be random, and operator
effectiveness (used to measure employee performance) was inaccurate.
Incorrect routing data meant that jobs were delivered to machines where
they could not be done. Item data was therefore not at the point of
machining in time and the costing department then had to reconcile the
discrepancy between standard and actual cost.
The cumulative effect was a loss of control and effectiveness for the MES
system.

102
Single Point of Control
The perceived symptoms for this issue theme (as they were described in
the workshops) are summarised in Table A-5.
Table A-5: No single point of control symptoms
There is no way to see where issues lie: There is no structured data format for use by decision makers.
Simple visual representation: While data on the day’s activities could be derived, it is not represented functionally.
Quick response: The lag in data availability does not make MES a useful tool for addressing real time issues.
Management needs to be able to draw graph data from MES: Management is not able to identify trends from system use.
When investigating how the above requirements were currently being met
(or partially met), numerous methods of data representation were
identified. They were all methods developed internally, in an unaudited
manner. Both the calculations behind the data were unverified and the
source of the data was unverified. Certain individuals used various
sources because they know that there were discrepancies in the results.
This issue was separated from misalignment because it dealt with data
representation rather than data derivation as the system misalignment
issue did.
To be useable, data from MES has to be extracted from the system and
manipulated. Only a few individuals are able to do this. Furthermore, this
data is not available in real time for quick decision-making.
The MES system developer did provide a module for data representation
but the data was either irrelevant for WMMEA’s purpose or the methods of
calculating parameters (although not incorrect) are not aligned to WMMEA
standards.

103
Incomplete Functionality
The perceived symptoms for this issue theme (as they were described in
the workshops) are summarised in Table A-6.
Table A-6: Incomplete functionality symptoms
System does not have automatic data cleaning and updating: Data must be micro managed or it crowds the system.
System does not take into account scrap and rework: These factors need to get accounted for in a separate system.
Software lags or hangs during high usage: The operator spends excessive time at the MES terminal.
System doesn’t accommodate alternative routings: Alternative routings do exist but are preselected and cannot be changed once in the MES system.
Parts are not always loaded according to the routings: Machine constraints and urgency often create a need to make alternative plans for machining.
Quality issues not recorded at the point of machining: Downtimes caused by quality issues go unnoticed.
No real time clocking: Capturing of work follows the work done. In order to have a live system capturing must happen ahead of the work.
No material management: The software does not align the material in production to the ERPs warehousing functionality.
No accompanying calibration data available on the system: this information has to be delivered through other means.
The following functionality gaps were identified:
1. Real time clocking: The software supplier stated that the system
provided real time clocking. However on analysis, it was determined
that for practical purposes, the data clocking was not in real time
but rather was always lagging by one operation; the data was
reflected in real time but the system did not make provision for
capturing that data in real time.
2. JIT delivery: By not communicating material data with the ERP
system, the MES system is unable to dictate where and when
material is needed on the shop floor.
3. Capturing quality issues: Not being able to account for quality
issues leaves blind spots in the day’s activity making MES data
inaccurate. This has to be reconciled outside of the system creating
a delay in the reporting of quality issues.
4. Response speed and stability: System lag had a noticeable impact
on the time spent clocking work. After investigation, this was
determined to be due to poor IT infrastructure. Operators spend on
104
average 15 per shift minutes capturing work, 10 minutes due to
slow system response, and 5 minutes addressing other system
issues (such as system crashes and network inconsistencies).
Roles and Responsibilities
The perceived symptoms for this issue theme (as they were described in
the workshops) are summarised in Table A-7.
Table A-7: Roles and responsibilities symptoms
No access for key users: Key users have been identified who have no access to or knowledge of the system
No skills matrix: It is unclear who is able to perform which functions. Employees need to know who can replace who and who can train in each area.
Operators understanding: Operators do not know and disagree on what their roles are in respect to the MES system. Simple tasks get neglected.
Breakdowns take too long to resolve: Breakdowns get reported in an inefficient manner having to escalate slowly over time until an external consultant is brought in to troubleshoot.
Issues that arise in this issue theme are hard to identify, communicate,
and take a long time to address.
For example:
1. A terminal at a machine will stop working.
2. The operator will notify the shift leader and continue his work
outside the system.
3. The shift leader will eventually notify IT who are not responsible for
the system.
4. The issue will go unaddressed.
5. When somebody eventually takes the initiative to correct the issue,
the corrective measure is usually to contact the MES system
supplier.
6. The supplier will come to site (at high cost) only to discover a trivial
error (e.g. the cable is unplugged).

105
Additionally, everybody who is involved is only responsible to action his
department’s workload. There is no combined responsibility to ensure the
system functions as a whole. This leads to bad and inconsistent data
overwhelming the MES system over time.
All this in turn created a slow and illegible system that is difficult to
troubleshoot. Bad system logic and incomplete integration is hidden
behind the clutter of bad data.
Backup System
The perceived symptoms for this issue theme (as they were described in
the workshops) are summarised in Table A-8.
Table A-8: Backup system issue theme symptoms
Computers go down often: Technical hardware issues prevent system use.
System gives errors to users: Technical software or network issues prevent system use.
Too much manual clocking: Lack of knowledge prevents system use.
It was determined during the solution management stage (that follows)
that the older Kanban system for managing production would have to be
removed. This means that the old way of managing the machine shop
would no longer be available. Considering that MES is highly dependent
on factors with known limited stability (such as power supply or network
availability), a quick-to-implement backup system is needed.
In addition to this, an action plan for getting MES back on track quickly
needs to be available.
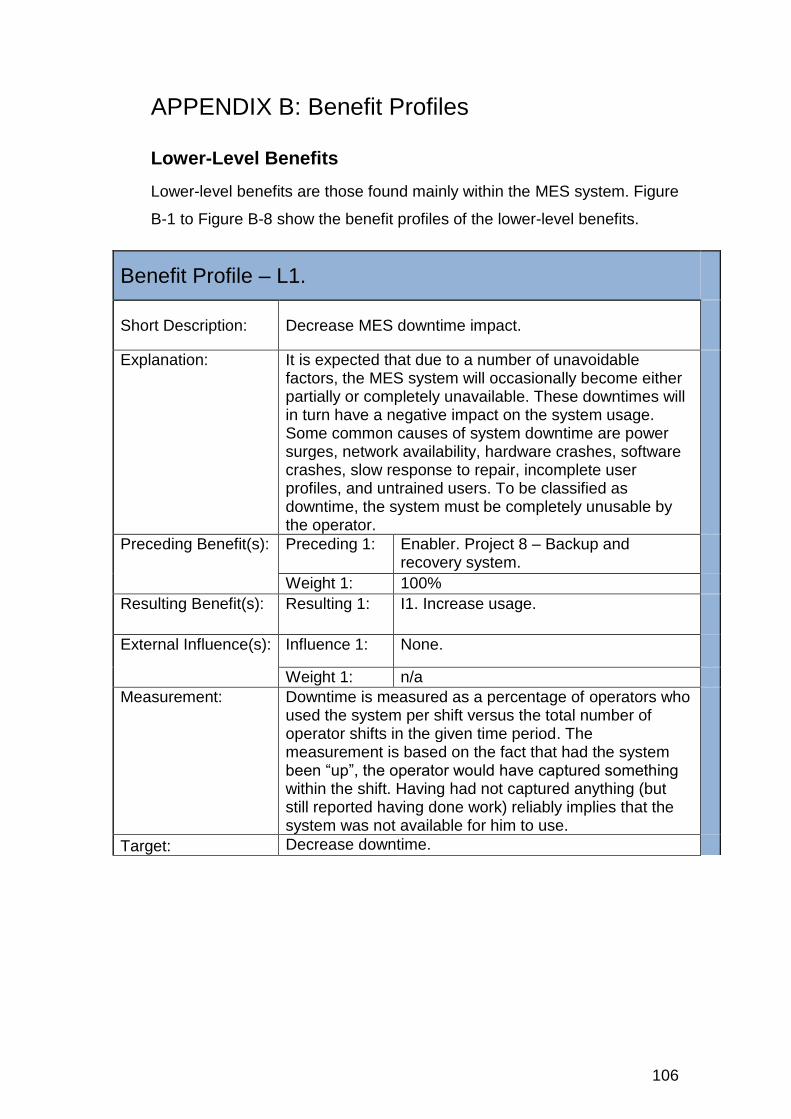
106
APPENDIX B: Benefit Profiles
Lower-Level Benefits
Lower-level benefits are those found mainly within the MES system. Figure
B-1 to Figure B-8 show the benefit profiles of the lower-level benefits.
Benefit Profile – L1.
Short Description: Decrease MES downtime impact.
Explanation: It is expected that due to a number of unavoidable factors, the MES system will occasionally become either partially or completely unavailable. These downtimes will in turn have a negative impact on the system usage. Some common causes of system downtime are power surges, network availability, hardware crashes, software crashes, slow response to repair, incomplete user profiles, and untrained users. To be classified as downtime, the system must be completely unusable by the operator.
Preceding Benefit(s): Preceding 1: Enabler. Project 8 – Backup and recovery system.
Weight 1: 100%
Resulting Benefit(s): Resulting 1: I1. Increase usage.
External Influence(s): Influence 1: None.
Weight 1: n/a
Measurement: Downtime is measured as a percentage of operators who used the system per shift versus the total number of operator shifts in the given time period. The measurement is based on the fact that had the system been “up”, the operator would have captured something within the shift. Having had not captured anything (but still reported having done work) reliably implies that the system was not available for him to use.
Target: Decrease downtime.
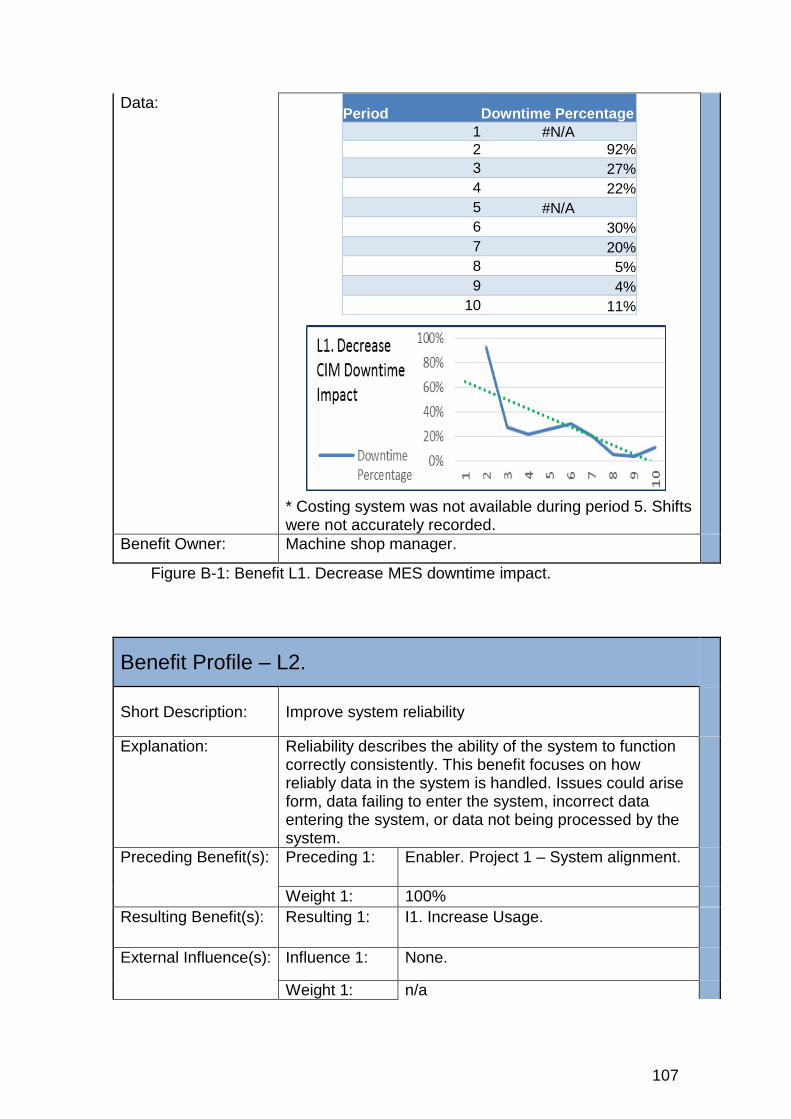
107
Data: * Costing system was not available during period 5. Shifts were not accurately recorded.
Period Downtime Percentage
1 #N/A
2 92%
3 27%
4 22%
5 #N/A
6 30%
7 20%
8 5%
9 4%
10 11%
Benefit Owner: Machine shop manager.
Figure B-1: Benefit L1. Decrease MES downtime impact.
Benefit Profile – L2.
Short Description: Improve system reliability
Explanation: Reliability describes the ability of the system to function correctly consistently. This benefit focuses on how reliably data in the system is handled. Issues could arise form, data failing to enter the system, incorrect data entering the system, or data not being processed by the system.
Preceding Benefit(s): Preceding 1: Enabler. Project 1 – System alignment.
Weight 1: 100%
Resulting Benefit(s): Resulting 1: I1. Increase Usage.
External Influence(s): Influence 1: None.
Weight 1: n/a
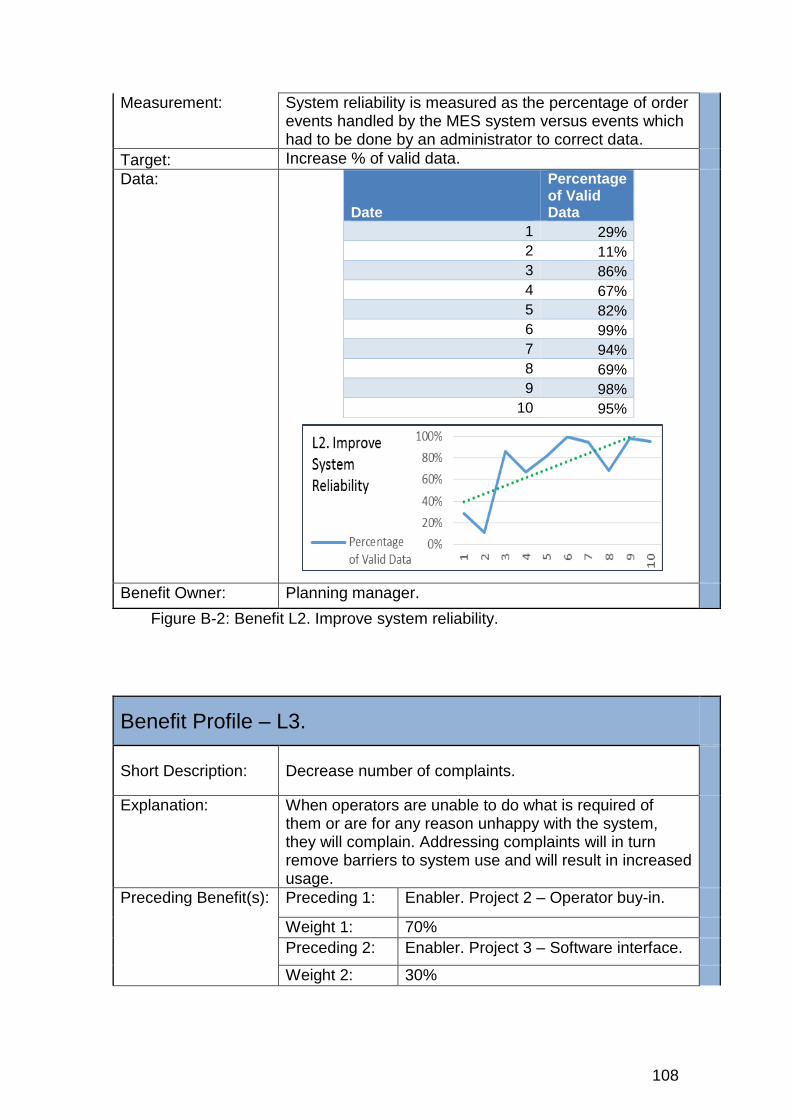
108
Measurement: System reliability is measured as the percentage of order events handled by the MES system versus events which had to be done by an administrator to correct data.
Target: Increase % of valid data.
Data:
Date
Percentage of Valid Data
1 29%
2 11%
3 86%
4 67%
5 82%
6 99%
7 94%
8 69%
9 98%
10 95%
Benefit Owner: Planning manager.
Figure B-2: Benefit L2. Improve system reliability.
Benefit Profile – L3.
Short Description: Decrease number of complaints.
Explanation: When operators are unable to do what is required of them or are for any reason unhappy with the system, they will complain. Addressing complaints will in turn remove barriers to system use and will result in increased usage.
Preceding Benefit(s): Preceding 1: Enabler. Project 2 – Operator buy-in.
Weight 1: 70%
Preceding 2: Enabler. Project 3 – Software interface.
Weight 2: 30%
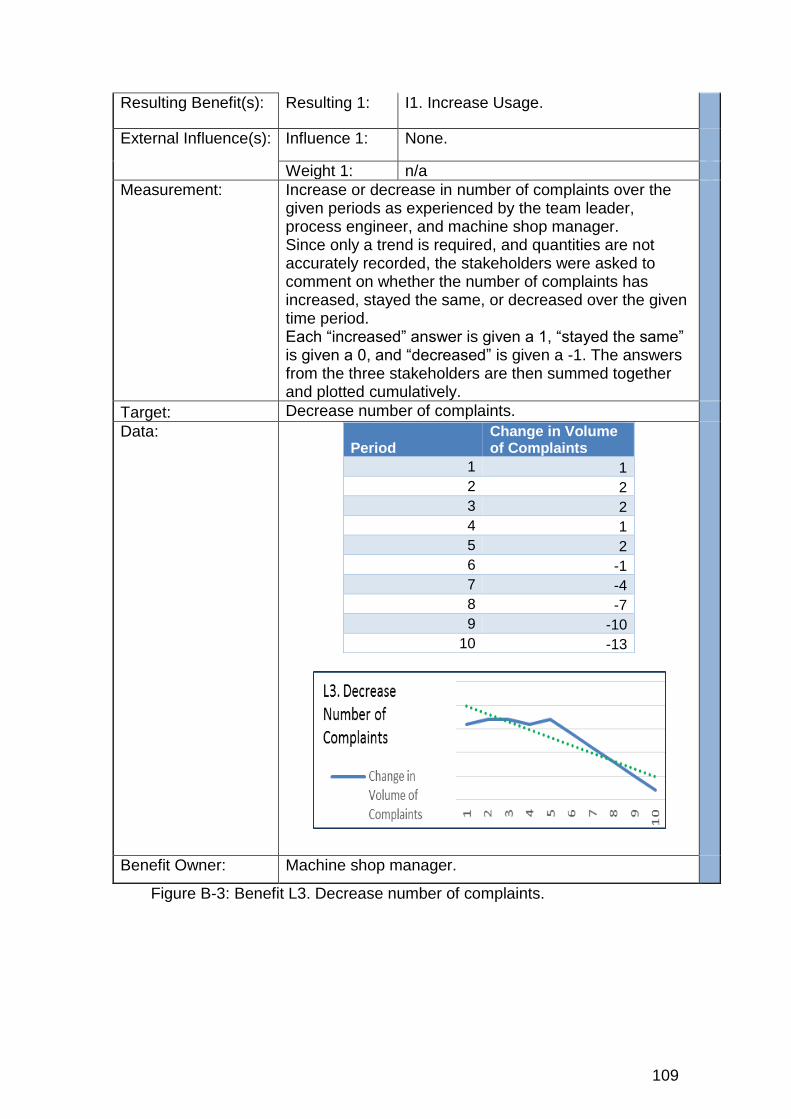
109
Resulting Benefit(s): Resulting 1: I1. Increase Usage.
External Influence(s): Influence 1: None.
Weight 1: n/a
Measurement: Increase or decrease in number of complaints over the given periods as experienced by the team leader, process engineer, and machine shop manager. Since only a trend is required, and quantities are not accurately recorded, the stakeholders were asked to comment on whether the number of complaints has increased, stayed the same, or decreased over the given time period. Each “increased” answer is given a 1, “stayed the same” is given a 0, and “decreased” is given a -1. The answers from the three stakeholders are then summed together and plotted cumulatively.
Target: Decrease number of complaints.
Data: Period
Change in Volume of Complaints
1 1
2 2
3 2
4 1
5 2
6 -1
7 -4
8 -7
9 -10
10 -13
Benefit Owner: Machine shop manager.
Figure B-3: Benefit L3. Decrease number of complaints.

110
Benefit Profile – L4.
Short Description: Increase accuracy of data.
Explanation: When data is incorrectly captured by operators, the picture that gets painted down the line becomes less and less valuable. Part actual costs become skewed, production variations become hard to analyse, and trends are skewed. This benefit differs from the system reliability benefit in that the inaccuracies in data come from operator mistakes. System data needs to represent the true state of the shop floor at any time.
Preceding Benefit(s): Preceding 1: Enabler. Project 3 – Software interface.
Weight 1: 70%
Preceding 2: I1. Increase usage.
Weight 2: 30%
Resulting Benefit(s): Resulting 1: I2. Improve decision making ability.
External Influence(s): Influence 1: None.
Weight 1: n/a
Measurement: Accurately captured data as a percentage of all data captured over a period. This measurement is achieved by comparing raw data from MES with the reconciled data in the ERP.
Target: Increase % of accurately captured data.
Data:
Period
Percentage Accurately Captured
1 #N/A
2 30%
3 44%
4 52%
5 62%
6 60%
7 68%
8 64%
9 73%
10 73%

111
Benefit Owner: Process engineer.
Figure B-4: Benefit L4. Increase accuracy of data.
Benefit Profile – L5.
Short Description: Increase number of contact points.
Explanation: In order for management and support staff to interact with the MES system and obtain the necessary information for decision making, contact points need to be readily available and easy to use. Data needs to be from the same source but displayed in the most relevant manner for the task at hand.
Preceding Benefit(s): Preceding 1: Enabler. Project 5 – Single point of control.
Weight 1: 100%
Resulting Benefit(s): Resulting 1: I3. Increase usage for decision making.
Resulting 2: I4. Decrease response time.
External Influence(s): Influence 1: None.
Weight 1: n/a
Measurement: Count of the number of contact points that management has available to interact with the system. Multiple contact points of the same kind in the same area are not counted.
Target: Increase number of contact points.
Data: Contact points and date made available: 8. Laptop program, Initial. 9. Workflow management, Dec 2013. 10. Status indicators, Mar 2014. 11. Tablet access, Jul 2014. 12. Cell phone access, Jul 2014.

112
13. SMS notification, Nov 2014. 14. Operator terminal, Nov 2014*.
Total number of contact points: 7 *while the operator terminals were always available, the interface was upgraded to signal a full screen machine status report while the terminal was not being operated.
Period Number of Contact Points
1 2
2 3
3 5
4 7
5 7
6 7
7 7
8 7
9 7
10 7
Benefit Owner: Process engineer.
Figure B-5: Benefit L5. Increase number of contact points.
Benefit Profile – L6.
Short Description: Increase manufacturing flexibility.
Explanation: In order to maintain steady (efficient) flow of parts the machine shop requires accurate capacity scheduling. It is not always possible to adhere to the schedule as unforeseen events occur regularly (machine breakdowns or urgent orders for example). To make the problem

113
worse, inaccurate routing data also regularly derails production plans. In order to be able to handle these interruptions, the MES system needs to be flexible enough to account for and adjust to the deviation from the planned state.
Preceding Benefit(s): Preceding 1: Enabler. Project 4 – Quality of data.
Weight 1: 100%
Resulting Benefit(s): Resulting 1: I4. Decrease response time.
External Influence(s): Influence 1: None.
Weight 1: n/a
Measurement: The percentage of variances that pass through the machining process without the need for manual system intervention during or after manufacturing. All orders with a variance to the standard routing were analysed. The percentage of these that the system was able to handle is measured.
Target: Increase the % of scheduled work that passes through the machining process without manual intervention.
Data:
Period
Percentage of Work not Needing Intervention
1 #N/A
2 #N/A
3 #N/A
4 81%
5 84%
6 85%
7 83%
8 85%
9 88%
10 86%
Benefit Owner: Process engineer.
Figure B-6: Benefit L6. Increase manufacturing flexibility.

114
Benefit Profile – L7.
Short Description: Reduce administrative workload.
Explanation: An operator’s shift lasts 8 hours. He however only adds value to a product during the time he spends working on a job (value-adding time). Various forms of administrative work detract from this available time for value adding operations. Interacting with the MES system is non-value-adding time. This time must therefore be minimised as much as possible as it is presents an opportunity cost to the machine shop.
Preceding Benefit(s): Preceding 1: Enabler. Project 6 – Increased functionality.
Weight 1: 100%
Resulting Benefit(s): Resulting 1: H4. Increase machine availability.
External Influence(s): Influence 1: None.
Weight 1: n/a
Measurement: The time that operators spend interacting with the system as experienced by the team leader and process engineer. Since only a trend is required, and quantities are not accurately recorded, the stakeholders were asked to comment on whether the administrative workload has increased, stayed the same, or decreased over the given time period. Each “increased” answer is given a 1, “stayed the same” is given a 0, and “decreased” is given a -1. The answers from the two stakeholders are then summed together and plotted cumulatively.
Target: Decrease interaction time.
Data:
Date
Change in Time Spent Interacting with System
1 1
2 1
3 2
4 0
5 0
6 -2
7 -2
8 -4
9 -6
10 -8

115
Benefit Owner: Process engineer.
Figure B-7: Benefit L7. Reduce administrative workload.
Benefit Profile – S1.
Short Description: Decrease consulting costs.
Explanation: All training and system updates provided by a supplier are charged at an hourly rate. Therefore, any training or system update that can be done in-house is an equivalent cost saving at the same rate.
Preceding Benefit(s): Preceding 1: Enabler. Project 7 – Roles and responsibilities.
Weight 1: 100%
Resulting Benefit(s): Resulting 1: None.
External Influence(s): Influence 1: None.
Weight 1: n/a
Measurement: The monthly equivalent cost of training and updating the system had it been done by the software supplier.
Target: Any positive value
Data: Not measured. This supporting benefit does not form part of the requirements for this report.
Benefit Owners: Project manager.
Figure B-8: Supporting benefit S1. Decrease consulting costs.

116
Intermediate Benefits
Intermediate benefits are those mainly found outside the MES system but
within the machine shop system. Figure B-9 to Figure B-12 show the
benefit profiles of the intermediate benefits.
Benefit Profile – I1.
Short Description: Increase usage.
Explanation: When the MES system was launched, the machine shop didn’t switch overnight over to the radically-different method of production. The system ran in parallel to the original Kanban system, employees were trained to use the system over time, and functions were added gradually. In addition, technical issues hampered the complete function of the system. As the system matures and issues are resolved, usage needs to increase.
Preceding Benefit(s): Preceding 1: L1. Decrease MES downtime impact.
Weight 1: 20%
Preceding 2: L2. Improve system reliability.
Weight 2: 50%
Preceding 3: L3. Decrease number of complaints.
Weight 3: 30%
Resulting Benefit(s): Resulting 1: H1. Improve schedule adherence.
Resulting 2: L4. Increase accuracy of data.
External Influence(s): Influence 1: None.
Weight 1: n/a
Measurement: Increase the % of total work which is done through the MES system. Measured by comparing order-operations captured in MES vs captured in Hours Accounting (ERP costing module). Counted even if captured incorrectly.
Target: Increase in % of work.

117
Data: Date
Percent Usage
1 #N/A
2 3%
3 60%
4 68%
5 #N/A
6 75%
7 79%
8 84%
9 86%
10 82%
* Costing system was not available during period 5. Shifts were not accurately recorded.
Benefit Owner: Machine shop manager.
Figure B-9: Benefit I1. Increase usage.
Benefit Profile – I2.
Short Description: Improve decision making ability.
Explanation: This benefit falls in the same group as benefit I3 – decision making. By having an accurate, data-driven, picture of the true state of production, management is able to reliably make decisions that will improve the performance of the machine shop.
Preceding Benefit(s): Preceding 1: L4. Increase accuracy of data.
Weight 1: 100%
Resulting Benefit(s): Resulting 1: H2. Reduce age of WIP.
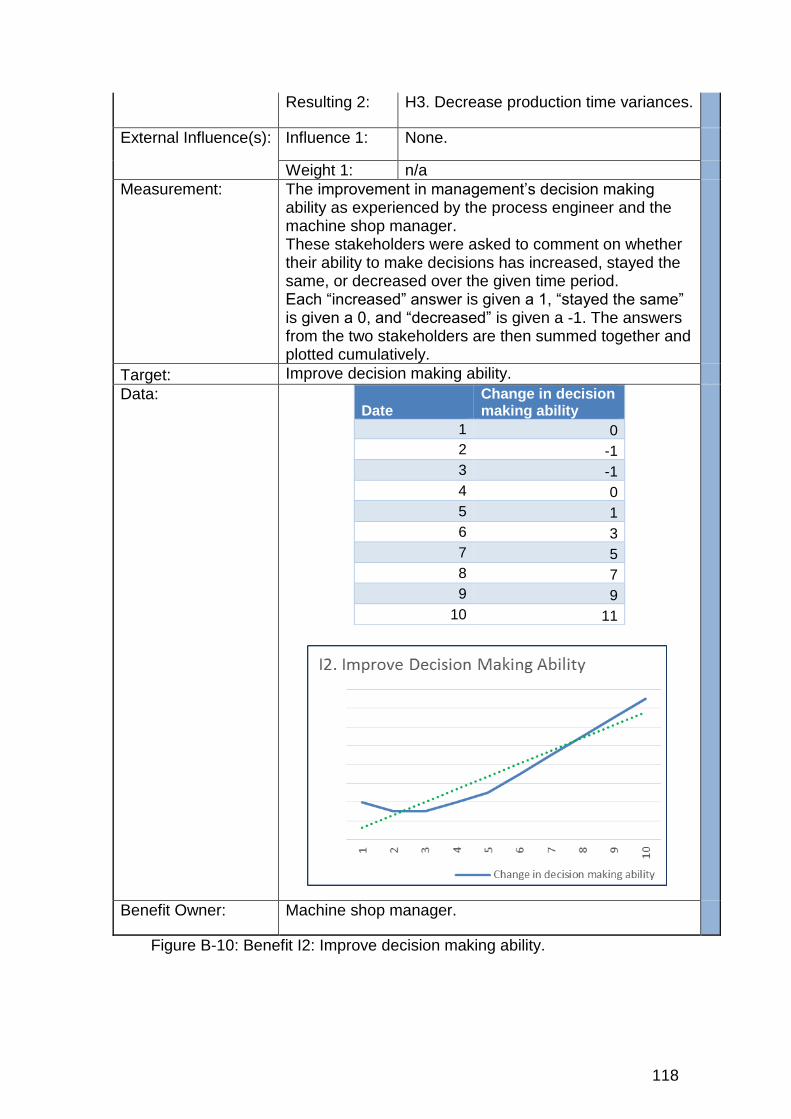
118
Resulting 2: H3. Decrease production time variances.
External Influence(s): Influence 1: None.
Weight 1: n/a
Measurement: The improvement in management’s decision making ability as experienced by the process engineer and the machine shop manager. These stakeholders were asked to comment on whether their ability to make decisions has increased, stayed the same, or decreased over the given time period. Each “increased” answer is given a 1, “stayed the same” is given a 0, and “decreased” is given a -1. The answers from the two stakeholders are then summed together and plotted cumulatively.
Target: Improve decision making ability.
Data: Date
Change in decision making ability
1 0
2 -1
3 -1
4 0
5 1
6 3
7 5
8 7
9 9
10 11
Benefit Owner: Machine shop manager.
Figure B-10: Benefit I2: Improve decision making ability.
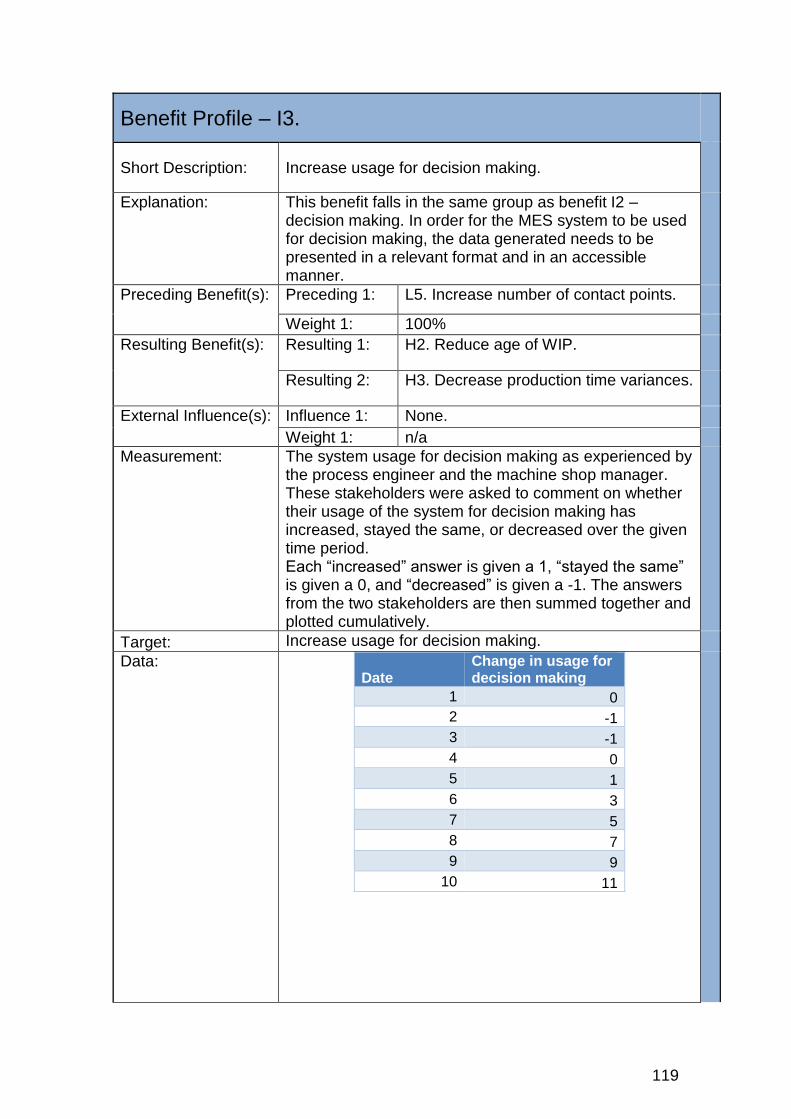
119
Benefit Profile – I3.
Short Description: Increase usage for decision making.
Explanation: This benefit falls in the same group as benefit I2 – decision making. In order for the MES system to be used for decision making, the data generated needs to be presented in a relevant format and in an accessible manner.
Preceding Benefit(s): Preceding 1: L5. Increase number of contact points.
Weight 1: 100%
Resulting Benefit(s): Resulting 1: H2. Reduce age of WIP.
Resulting 2: H3. Decrease production time variances.
External Influence(s): Influence 1: None.
Weight 1: n/a
Measurement: The system usage for decision making as experienced by the process engineer and the machine shop manager. These stakeholders were asked to comment on whether their usage of the system for decision making has increased, stayed the same, or decreased over the given time period. Each “increased” answer is given a 1, “stayed the same” is given a 0, and “decreased” is given a -1. The answers from the two stakeholders are then summed together and plotted cumulatively.
Target: Increase usage for decision making.
Data: Date
Change in usage for decision making
1 0
2 -1
3 -1
4 0
5 1
6 3
7 5
8 7
9 9
10 11
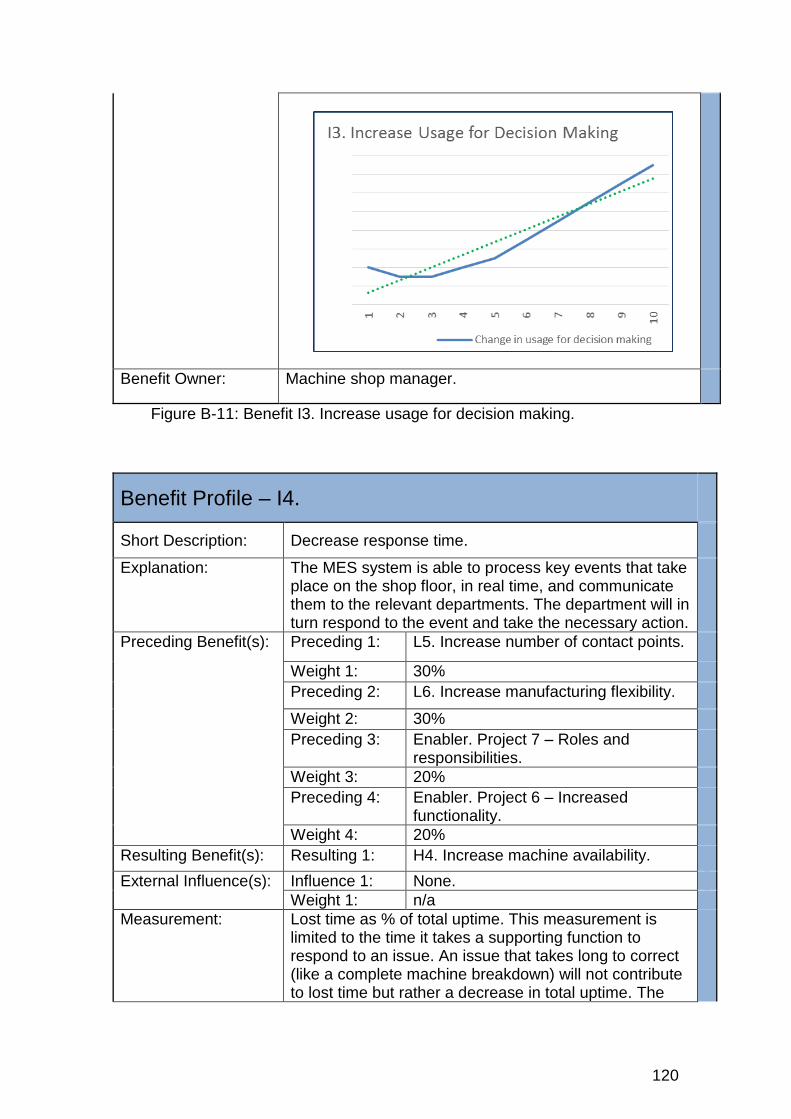
120
Benefit Owner: Machine shop manager.
Figure B-11: Benefit I3. Increase usage for decision making.
Benefit Profile – I4.
Short Description: Decrease response time.
Explanation: The MES system is able to process key events that take place on the shop floor, in real time, and communicate them to the relevant departments. The department will in turn respond to the event and take the necessary action.
Preceding Benefit(s): Preceding 1: L5. Increase number of contact points.
Weight 1: 30%
Preceding 2: L6. Increase manufacturing flexibility.
Weight 2: 30%
Preceding 3: Enabler. Project 7 – Roles and
responsibilities.
Weight 3: 20%
Preceding 4: Enabler. Project 6 – Increased
functionality.
Weight 4: 20%
Resulting Benefit(s): Resulting 1: H4. Increase machine availability.
External Influence(s): Influence 1: None.
Weight 1: n/a
Measurement: Lost time as % of total uptime. This measurement is limited to the time it takes a supporting function to respond to an issue. An issue that takes long to correct (like a complete machine breakdown) will not contribute to lost time but rather a decrease in total uptime. The
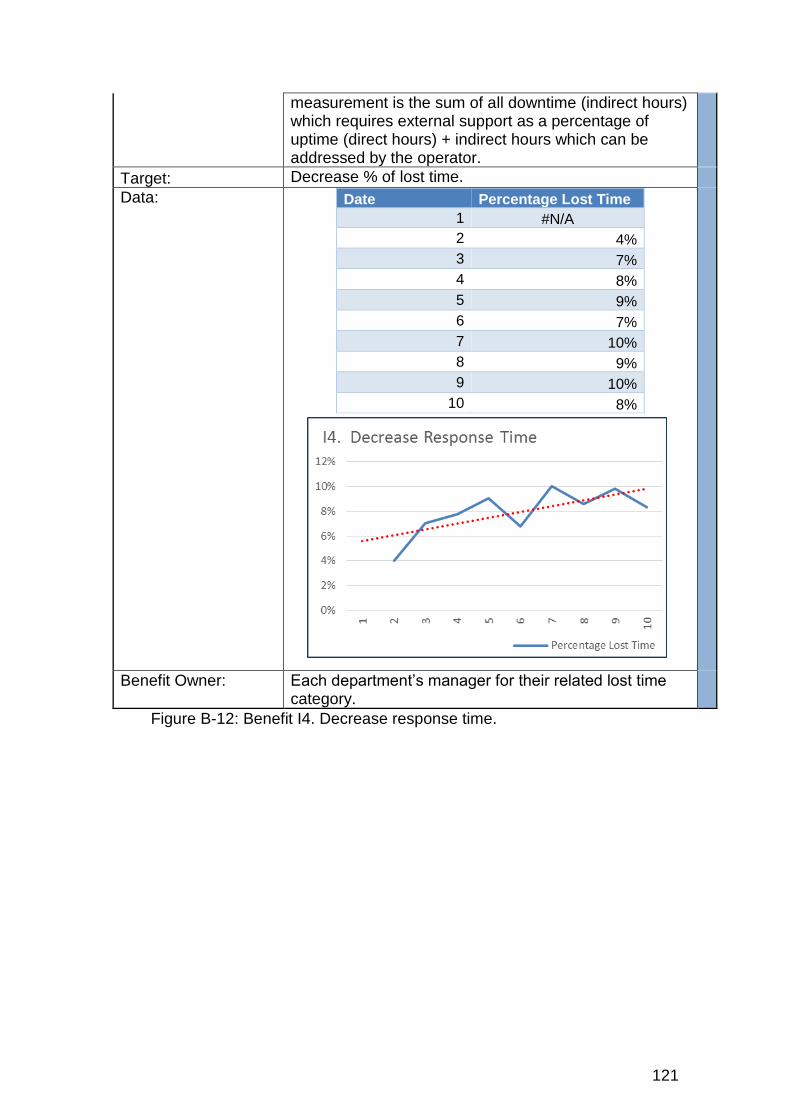
121
measurement is the sum of all downtime (indirect hours) which requires external support as a percentage of uptime (direct hours) + indirect hours which can be addressed by the operator.
Target: Decrease % of lost time.
Data: Date Percentage Lost Time
1 #N/A
2 4%
3 7%
4 8%
5 9%
6 7%
7 10%
8 9%
9 10%
10 8%
Benefit Owner: Each department’s manager for their related lost time category.
Figure B-12: Benefit I4. Decrease response time.

122
Higher-Level Benefits
Higher-level benefits are those mainly found to be the outcomes of the
machine shop system (such as KPI measurements). Figure B-13 to Figure
B-16 show the benefit profiles of the higher-level benefits.
Benefit Profile – H1.
Short Description: Improve schedule adherence.
Explanation: To produce what is required and achieve a favourable OTD, the machine shop produces to a finite-capacity schedule. Deviations from schedule happen due to both technical and operational reasons. While deviations are acceptable, the risk of failing to deliver on-time to a customer increases when the schedule is not adhered to. The MES system guides production according to the schedule it receives.
Preceding Benefit(s): Preceding 1: I1. Increase usage.
Weight 1: 80%
Resulting Benefit(s): Resulting 1: Objective. O1. Maximise availability and OTD.
External Influence(s): Influence 1: Supply chain may (for strategic reasons or through bad management) place urgent orders (in the form of spike loading or reduced lead time) that will necessitate a disruption in the planned production schedule. This leads to decreased schedule adherence. Frequency is however low.
Weight 1: 20%
Measurement: The average number of weekly manufactured not-on-schedule parts for the given date range.
Target: Decrease number of unscheduled parts.
Data: Date Number of Unscheduled Parts
1 #N/A
2 #N/A
3 92
4 71
5 #N/A
6 101
7 87
8 48
9 40
10 23

123
* There was no scheduled production at the start of the year (period 5).
Benefit Owner: Planning manager.
Figure B-13: Benefit H1. Improve schedule adherence.
Benefit Profile – H2.
Short Description: Reduce age of Work In Progress (WIP).
Explanation: The machine shop has an allowable lead time on production of two weeks. Problem items can however take longer and if not managed will pile up. Reducing the age of WIP not only reduces the cost of WIP but also facilitates good flow through the machine shop.
Preceding Benefit(s): Preceding 1: I2 & I3. Decision making group.
Weight 1: 100%
Resulting Benefit(s): Resulting 1: Objective. O1. Maximise availability and OTD.
External Influence(s): Influence 1: None
Weight 1: n/a
Measurement: Total age of WIP at the end of each time period.
Target: Decrease the age of WIP.
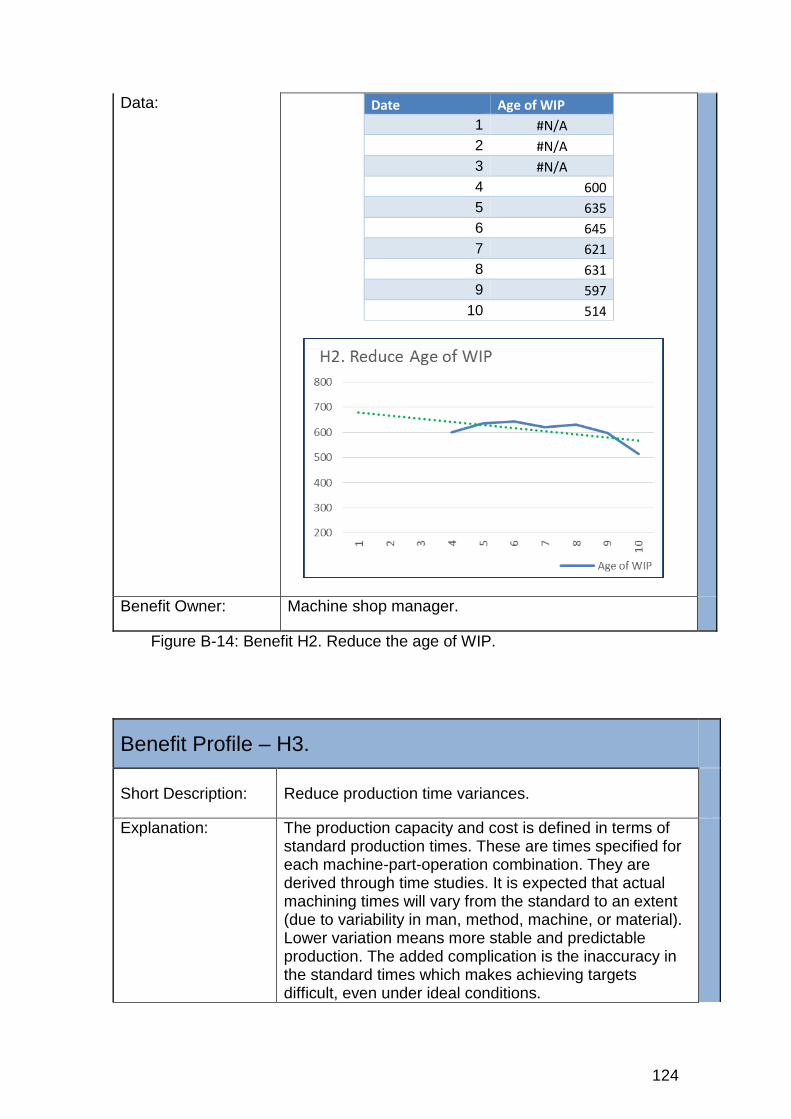
124
Data: Date Age of WIP
1 #N/A
2 #N/A
3 #N/A
4 600
5 635
6 645
7 621
8 631
9 597
10 514
Benefit Owner: Machine shop manager.
Figure B-14: Benefit H2. Reduce the age of WIP.
Benefit Profile – H3.
Short Description: Reduce production time variances.
Explanation: The production capacity and cost is defined in terms of standard production times. These are times specified for each machine-part-operation combination. They are derived through time studies. It is expected that actual machining times will vary from the standard to an extent (due to variability in man, method, machine, or material). Lower variation means more stable and predictable production. The added complication is the inaccuracy in the standard times which makes achieving targets difficult, even under ideal conditions.

125
Preceding Benefit(s): Preceding 1: I2 & I3. Decision making group.
Weight 1: 100%
Resulting Benefit(s): Resulting 1: Objective. O2. Maximise part value.
External Influence(s):
Influence 1: None
Weight 1: n/a
Measurement: The average positive overrun. Measurement is the actual run time minus the standard time as a percentage of standard time.
Target: Decrease variance.
Data: Date Positive Variance %
1 #N/A
2 #N/A
3 #N/A
4 #N/A
5 #N/A
6 24%
7 23%
8 22%
9 15%
10 17%
Benefit Owner: Machine shop manager.
Figure B-15: Benefit H3. Decrease production time variances.

126
Benefit Profile – H4.
Short Description: Increase machine shop Overall Equipment Effectiveness (OEE).
Explanation: OEE is an indicative measure of the % of time during which the machine adds value to the products it machines. Machines do not add value to a product throughout the day. They need to be stopped for various reasons (such as changing tools), they fall behind on speed (when material is too hard), and they occasionally scrap work.
Preceding Benefit(s): Preceding 1: I4. Decrease response time.
Weight 1: 75%
Preceding 2: L7. Reduce administrative workload.
Weight 2: 25%
Resulting Benefit(s): Resulting 1: Objective. O2. Maximise part value.
External Influence(s):
Influence 1: None over the period under measurement.
Weight 1: n/a
Measurement: The OEE measurement definition presented here is differs from the standard OEE definition. The measurement is the minimum of standard hours and actual hours plant output as a percentage of total labour hours available. Machine setup time is considered a lost time only to the extent by which it exceeds the standard allowable setup hours.
Target: Increase availability %.
Data: Date OEE
1 #N/A
2 #N/A
3 39%
4 56%
5 46%
6 58%
7 62%
8 62%
9 60%
10 60%
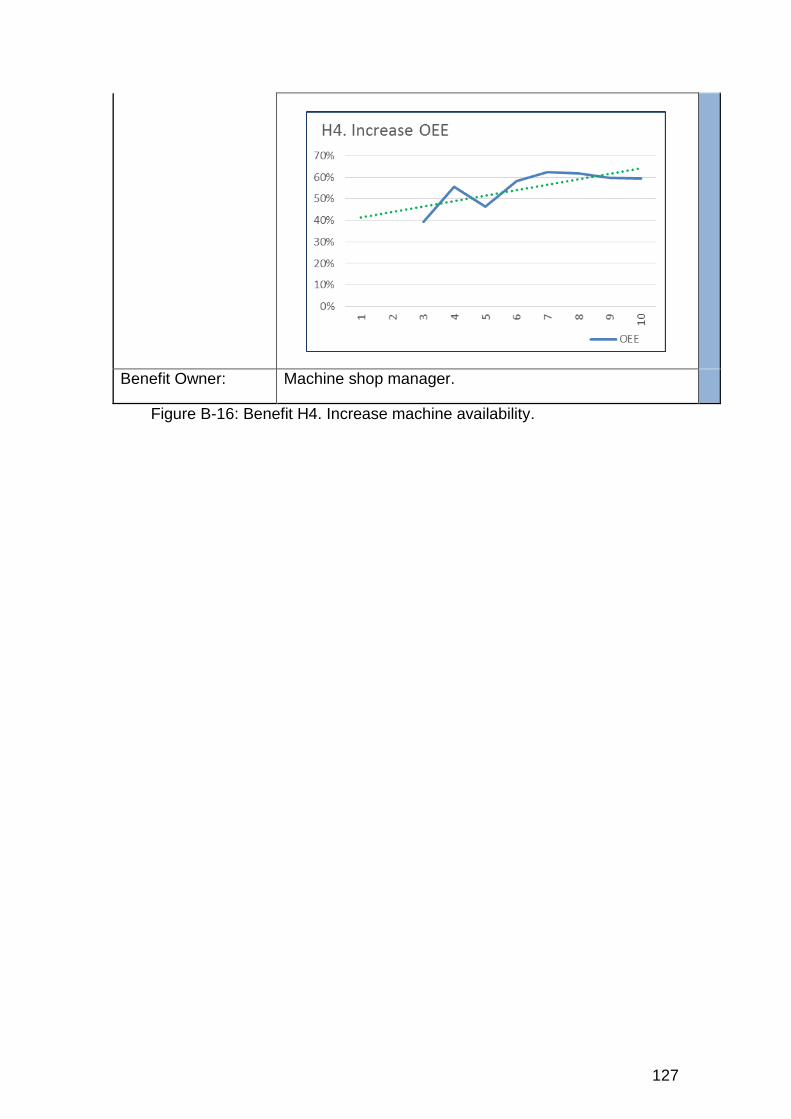
127
Benefit Owner: Machine shop manager.
Figure B-16: Benefit H4. Increase machine availability.

128
Company Objectives
Company objectives may well be outside the influence of the machine
shop alone. They are usually affected by activities from various areas of
the business. Figure B-17 and Figure B-18 show the benefit profiles of the
company objectives.
Benefit Profile – O1.
Short Description: Company Objective: Maximise availability and OTD.
Explanation: In order to satisfy customer expectations, the company has decided to keep finished goods stock on a range of fast moving parts (MTS parts). The customer is told that he can expect delivery on any of these parts within 24 hours. The company targets to uphold this promise 89% of the time (Feb 2015 target). For items that do not move quickly (MTO parts), the company has committed to manufacture and deliver within 6 weeks of order placement. The company targets to also uphold this promise 89% of the time (Feb 2015 target).
Preceding Benefit(s): Preceding 1: H1. Improve schedule adherence.
Weight 1: 20%
Preceding 2: H2. Reduce age of WIP.
Weight 2: 20%
Resulting Benefit(s): Resulting 1: n/a
External Influence(s):
Influence 1: This objective is heavily influenced by the S&OP programme running in parallel to the MES initiative. The S&OP programme aims to improve delivery to customer by sharing and level loading the input demand on production from the very point of order placement.
Weight 1: 60%
Measurement: Availability is a measure of MTS part performance. It measures the percentage of MTS items for which stock is available at the time of order placement. OTD is a measure of MTO part performance. It measures the percentage of orders that have been completed within the promised 6 week lead time. The final measure is the average of the 2 percentages.
Target: Increase the average of availability and OTD.
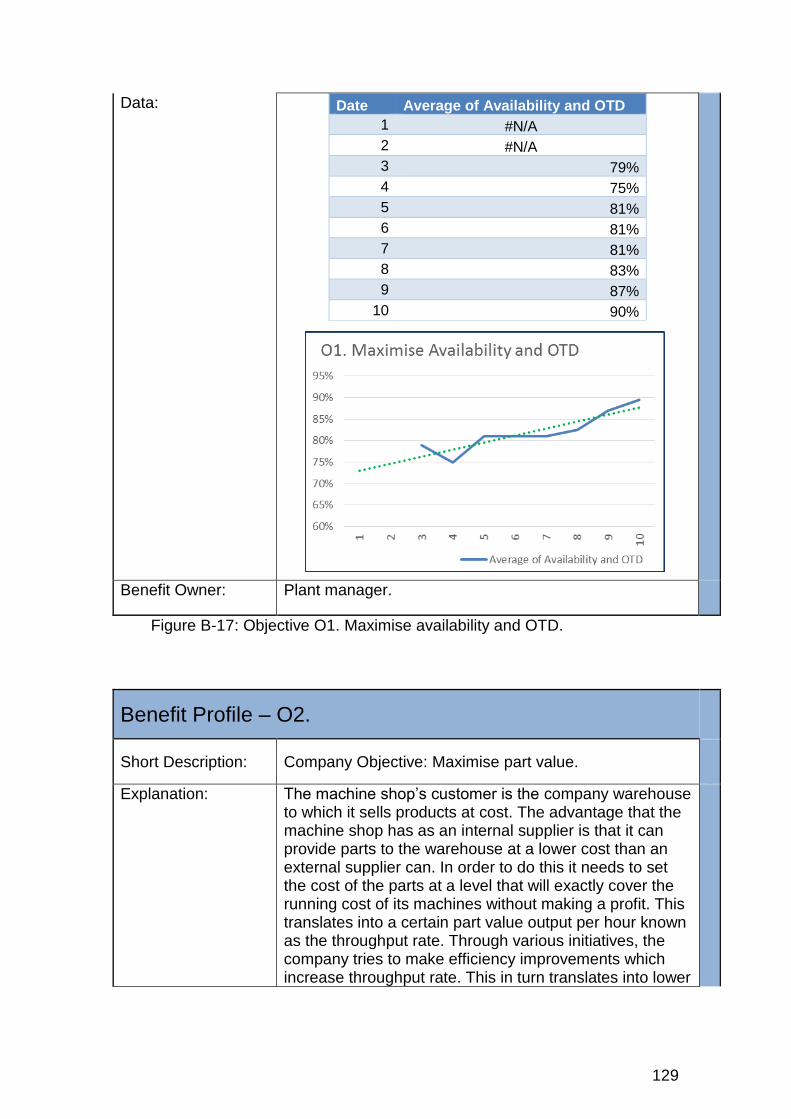
129
Data: Date Average of Availability and OTD
1 #N/A
2 #N/A
3 79%
4 75%
5 81%
6 81%
7 81%
8 83%
9 87%
10 90%
Benefit Owner: Plant manager.
Figure B-17: Objective O1. Maximise availability and OTD.
Benefit Profile – O2.
Short Description: Company Objective: Maximise part value.
Explanation: The machine shop’s customer is the company warehouse to which it sells products at cost. The advantage that the machine shop has as an internal supplier is that it can provide parts to the warehouse at a lower cost than an external supplier can. In order to do this it needs to set the cost of the parts at a level that will exactly cover the running cost of its machines without making a profit. This translates into a certain part value output per hour known as the throughput rate. Through various initiatives, the company tries to make efficiency improvements which increase throughput rate. This in turn translates into lower

130
part cost and increased capacity to machine parts. The increased capacity in turn provides a cost saving in terms of reducing the amount of work that needs to be done by external suppliers.
Preceding Benefit(s): Preceding 1: H3. Decrease production time variances.
Weight 1: 30%
Preceding 2: H4. Increase machine availability.
Weight 2: 30%
Resulting Benefit(s): Resulting 1: n/a
External Influence(s):
Influence 1: This objective is heavily influenced by the machine shop productivity programme. The productivity programme aims to increase machine shop capacity and throughput rate by (among others) upgrading machine capability, increasing availability of specialised tooling, and improving manning schedules.
Weight 1: 40%
Measurement: Throughput rate is a monetary value generated per hour measure on parts where there is genuine short term demand. The value generated are calculated on the amount of standard hours of work produced, in a period, at an hourly machine rate. The measurement is the standard time as a percentage of actual time averaged out within the period. Machine downtime and scrap are included in the calculation.
Target: Increase average throughput rate.
Data: Date
Percentage of Standard Throughput Rate
1 #N/A
2 #N/A
3 78%
4 78%
5 73%
6 77%
7 88%
8 89%
9 89%
10 83%

131
Benefit Owner: Plant manager.
Figure B-18: Objective O2. Maximise part value.

132
APPENDIX C: Solutions Management Projects
System Alignment
This was identified as the largest contributing factor for the lack of system
usage by operators. Even if all other enablers were instated, the MES
system would be unable to perform as part of the company’s macro
system without being aligned with other systems.
The project resulted in the cessation of the Kanban system and hard-
linking of the remaining systems to create a new workflow. Figure C-1
shows the systems diagram after the project has been completed (this is
the revised systems diagram, Figure A-1, from Appendix A). It was
achieved as follows:
The Kanban system existed prior to the MES system but was not
considered in the initial MES implementation. The system remained
and was run in parallel with MES. This not only created a duplication of
work but made both systems completely unreliable (the Kanban system
can no longer signal for work reliably as it doesn’t have a way of
knowing what work MES is signalling, and vice versa). With this setup,
MES becomes just an administrative task which can be bypassed by
simply not using it. This is an example of a disbenefit that was created
by MES. The Kanban system had to be made obsolete.
Hard linking of systems is done to prevent execution of certain system
operations while bypassing others (an example would be a printer
which doesn’t allow printing without the paper tray being loaded first).
Automation is also a consequence of hard linking. The hard links
created in this case were:
o Between the scheduling system and ERP
o Between ERP and MES
o Between MES and the machining operation
The resulting process is summarised as follows:
ERP generates orders

133
All orders have to be scheduled in the scheduling system
Scheduling system writes the schedule to ERP
ERP releases the scheduled (sequenced) orders to MES
MES dictates machining and material flow
MES feeds the results back to the ERP
In Figure C-1, hard links are shown as solid black arrows (these are
required and the process cannot continue without them being actioned)
and avoidable soft links as dashed red arrows (both the overall process
and the operations following the link can continue without them being
actioned). The new red link is a backup in the event that the MES system
fails.
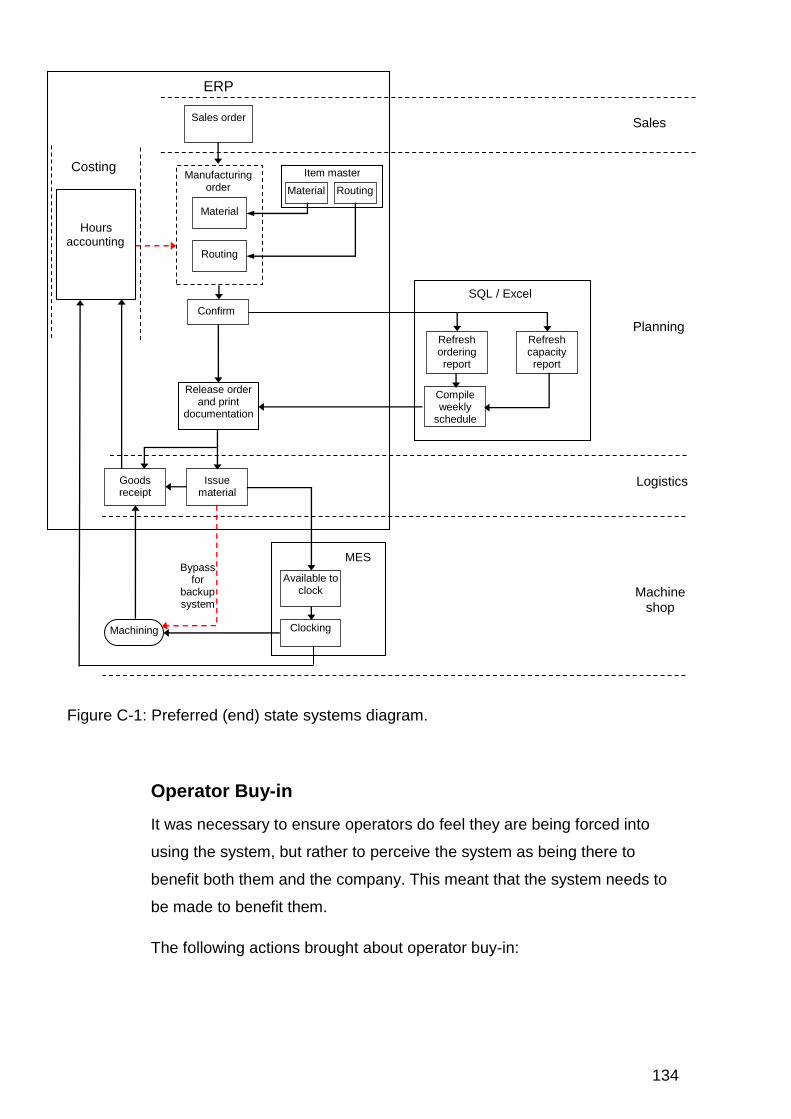
134
Figure C-1: Preferred (end) state systems diagram.
Operator Buy-in
It was necessary to ensure operators do feel they are being forced into
using the system, but rather to perceive the system as being there to
benefit both them and the company. This meant that the system needs to
be made to benefit them.
The following actions brought about operator buy-in:
ERP
ERP
Sales order
Sales order
Sales
Sales
Planning
Planning
Confirm
Confirm
Refresh ordering report
Refresh ordering report
SQL / Excel
SQL / Excel
Compile weekly
schedule
Compile weekly
schedule
Logistics
Logistics
Machine shop
Goods receipt
Goods receipt
Hours
accounting
Release order and print
documentation
Release order and print
documentation
Refresh capacity report
Refresh capacity report
Material
Material
Manufacturing order
Routing
Routing
Routing
Routing
Item master
Item master
Material
Material
Issue material
Issue material
Machining
Machining
MES
CIM
Available to clock
Available to clock
Clocking
Clocking
Bypass for
backup system
Bypass for
backup system
Costing

135
Formal operator performance measurement was removed from the
system and moved to the ERP costing function (while operators
understood that they had to be measured, measuring them through
MES created too much pressure for objective co-operation in system
design).
System functions had to benefit the operator. The following functions
were identified as beneficial: Simplified clocking, short-term schedule
visibility, communication on specific job issues, and providing a
summary of the day’s work.
Involvement in software interface and functionality design. The majority
of new function and design testing was done alongside the operators.
This gave them a chance to input their own ideas into how the software
should look and then to see how it was progressing with each iteration.
Training was continually repeated and elaborated on. Continuous
retraining created confidence and familiarity with the system. In order
to viably run the extended trainings that were planned, many users
were trained as (uncertified) trainers. The system providers conducted
only a few training sessions for the purpose of formalisation.
Software Interface
This project aimed to speed up, simplify, and standardise input to the
system. It was broken down into the following two sections:
Input requirement: This was reduced from 10 to 20 fields to a maximum of
3 fields. Some were deemed as not worth spending time on, while many
other could be automated (e.g. starting a new action implies the previous
was completed).
Layout design: The interface was completely redesigned to be intuitive
and minimise the number of clicks (and screens) needed to achieve a
result.

136
Quality of Data
Incorrect standard times and routings could be worked around in the
Kanban system because of the high level of human interaction (i.e. a
planner would never bring a job to the incorrect machine because the ERP
tells him to do so). In order to ensure MES routes and delivers the work
accurately two actions were taken:
Shop shift functionality was developed to allow cross-machine
capturing of work. This is fed back to the ERP as a planned vs. actual
variance. This both allows the system to function without assistance
and creates a new set of data useful for troubleshooting inaccurate
routing data.
The statistical data collected by MES was used to target routing
inconsistencies and improve standard times.
Single Point of Control
Shop floor management needed to be based on reliable information. It
was decided that all production data should originate from the same
source. This source was to be the MES database. With this concept
agreed upon, the purpose of this project was achieved in two parts:
Parameters that needed to be reported (or displayed) by the software
were selected and verified for accuracy. Standard reports and
dashboards were designed to be as user friendly and informative as
possible. The meaning of these standardised reports and dashboards
was carefully explained so that all parties using them will have a
thorough, deep understanding of what is being communicated.
Methods and hardware needed for interaction with the MES system
were specified and developed. These differed broadly between
departments and job descriptions. Upper management level
employees were given tablet PCs (and smartphone interfaces) which
they could use to access the MES interface. All employees can access
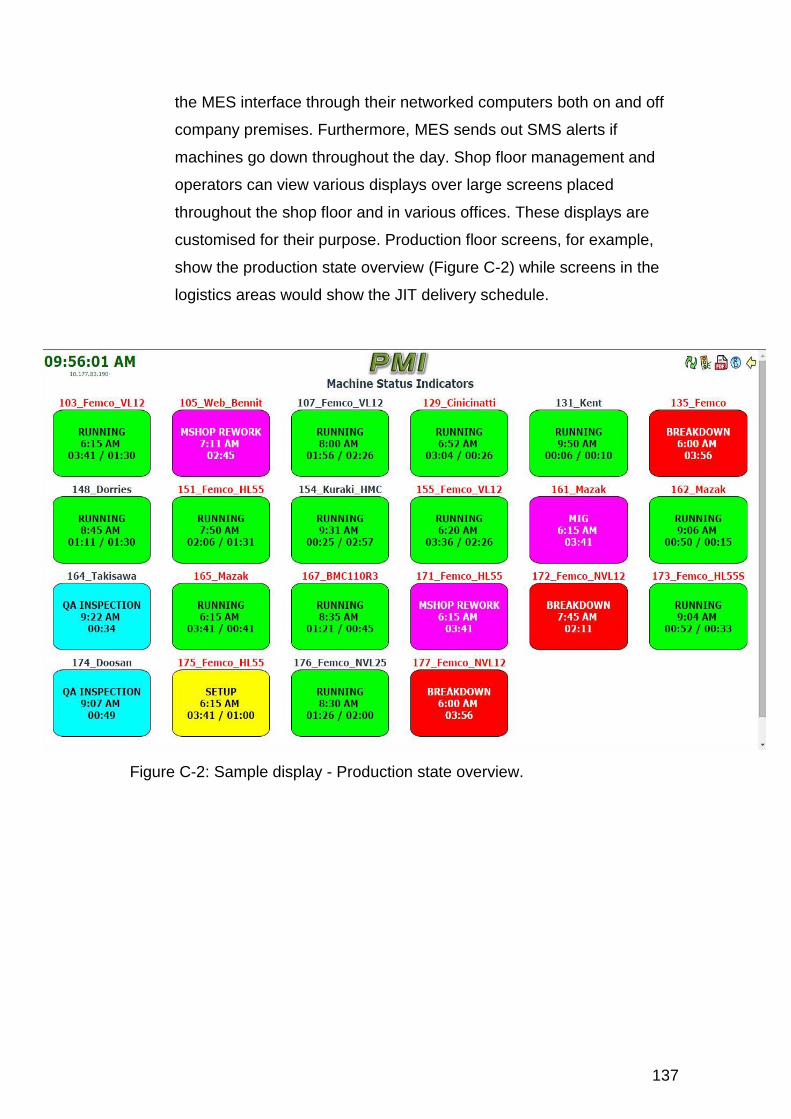
137
the MES interface through their networked computers both on and off
company premises. Furthermore, MES sends out SMS alerts if
machines go down throughout the day. Shop floor management and
operators can view various displays over large screens placed
throughout the shop floor and in various offices. These displays are
customised for their purpose. Production floor screens, for example,
show the production state overview (Figure C-2) while screens in the
logistics areas would show the JIT delivery schedule.
Figure C-2: Sample display - Production state overview.

138
Increased Functionality
This functionality was not part of the standard software design and had to
be put forward for development. As per the four incomplete functionality
issues identified, the following developments were carried out:
Real time clocking: All capturing of data had to be done in real time. To
accommodate this the underlying MES database structure and input
methods had to be updated so that operators capture the work they intend
to start on, rather than what work they had just performed. This in turn
gave a real time view of the current state of production, enabling support
departments to react to issues immediately.
JIT delivery: The MES database was updated to account for the current
state of material on the shop floor. Having a real time view of the material
on the floor allows the yard to deliver work when and where it is needed,
as opposed to flooding the shop with work in order "to be on the safe
side".
Capturing quality: The function to capture quality-related activities was
added to the MES system. This completed the picture in terms of giving
visibility on what was happening to each part at any time.
Hardware and software upgrade: With the MES system adding additional
strain to the IT infrastructure as it grew, functions were slowing down. The
solution chosen was to upgrade the infrastructure rather than make the
software less demanding:
Database management software was upgraded
Server processing speed was increased
Terminal processing power was optimised
139
Roles and Responsibilities
The department specific roles were extended to include both working in
the system as well as providing training. Each system user therefore
became responsible for training those that could replace him. Shop floor
operator training was particularly difficult because of the number of
operators, the shift patterns that they worked, their level of computer
literacy, and the extent of their function.
Continuous "train the trainer"-style training was necessary to maintain a
satisfactory competence level. Continuous training to this extent also
means users over time become system administrators who are able to
troubleshoot basic issues and maintain data integrity.
Backup System
The backup system needed to ensure production continues, and data
relating to production is not lost. The planning department developed a
manual means to release work to production without having to go through
either the scheduling tool or through MES. Operators were given a pen
and paper based system to capture all the necessary machining
information. While the system is inefficient, its simplicity ensures that no
time is lost in the switch over.
Note that the key focus of the backup enabler was not to have an efficient
way to work outside of MES, but rather to be able to get MES back online
as quickly as possible when it goes down. This was done by giving MES
system downtime a higher priority than any other IT-related tasks and
ensuring backup hardware was always available on-site.