eusoballoon optics test baptiste mot, gilles roudil, camille catalano, peter von ballmoos test...
TRANSCRIPT
eusoballoon optics test
Baptiste Mot, Gilles Roudil, Camille Catalano, Peter von Ballmoos
Test configuration
Calibration of the light beam
Exploration of the focal plan with the NIST
PSF with the CCD camera
1 - Configuration of the optics tests
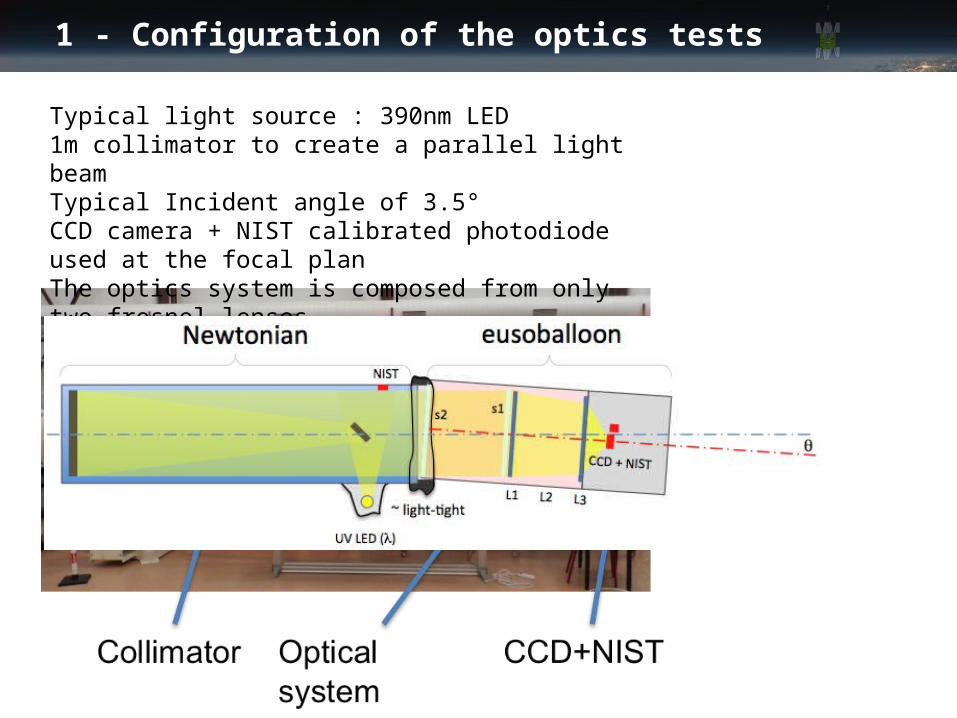
Typical light source : 390nm LED1m collimator to create a parallel light beamTypical Incident angle of 3.5°CCD camera + NIST calibrated photodiode used at the focal planThe optics system is composed from only two fresnel lenses
The optics efficiency
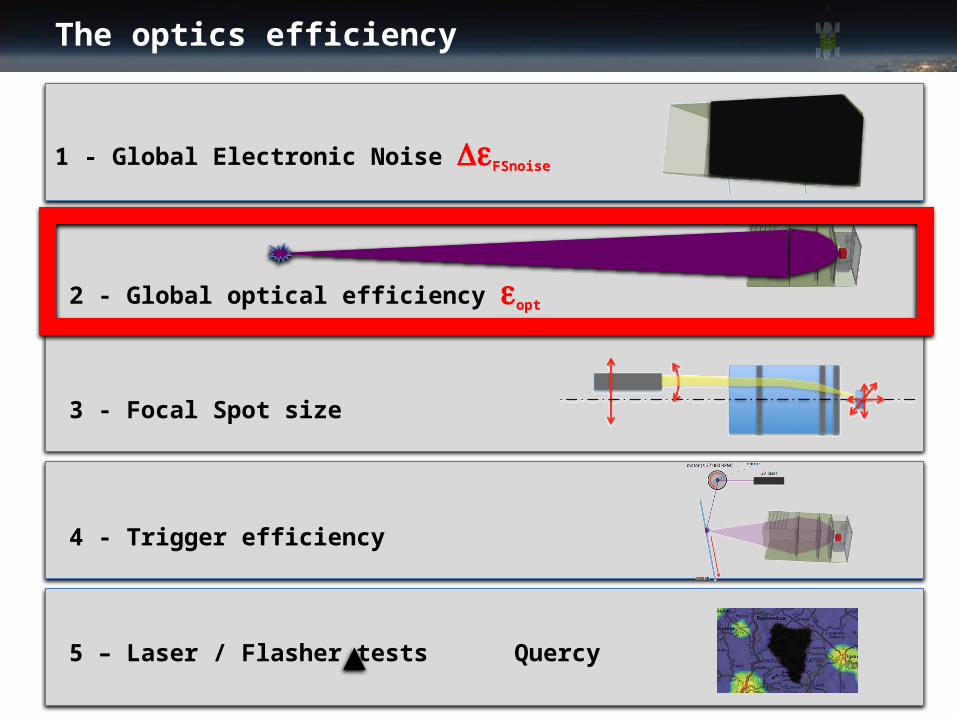
3 - Focal Spot size
4 - Trigger efficiency
5 – Laser / Flasher tests Quercy
2 - Global optical efficiency eopt
1 - Global Electronic Noise DeFSnoise
2 – Calibration of the collimated beam
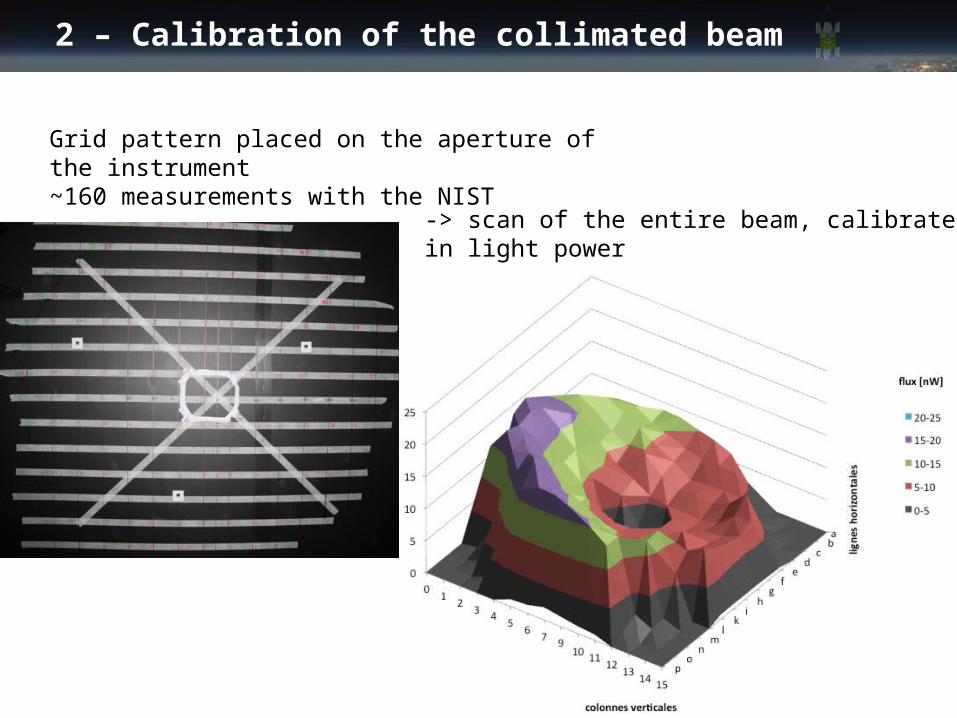
Grid pattern placed on the aperture of the instrument~160 measurements with the NIST
-> scan of the entire beam, calibrated in light power
2 – Calibration of the collimated beam
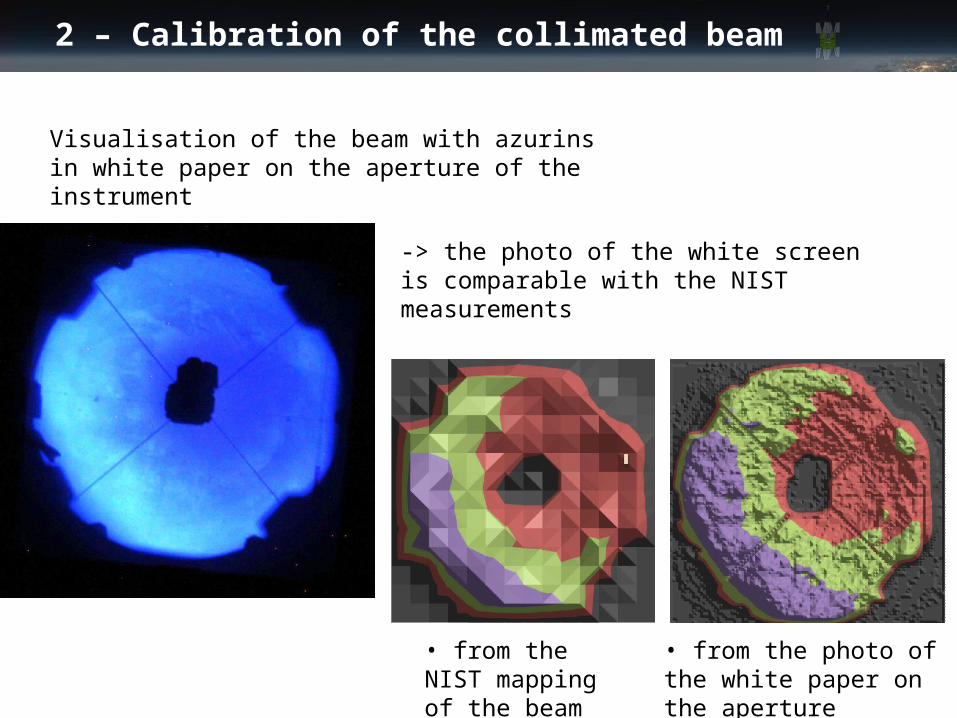
Visualisation of the beam with azurins in white paper on the aperture of the instrument
-> the photo of the white screen is comparable with the NIST measurements
• from the NIST mapping of the beam
• from the photo of the white paper on the aperture
2 – Calibration of the collimated beam
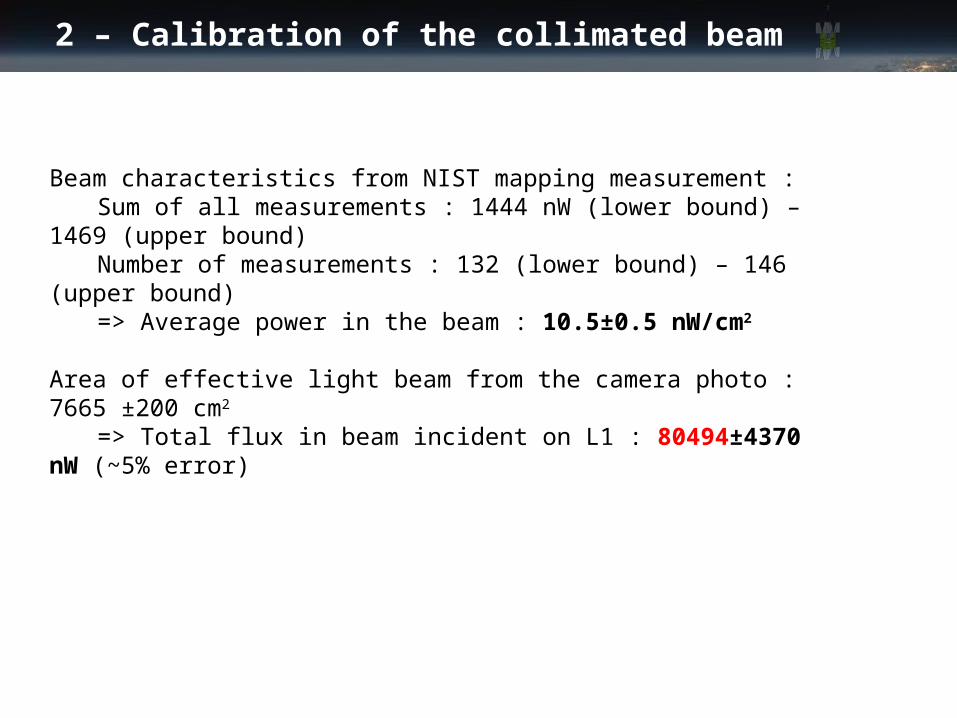
Beam characteristics from NIST mapping measurement :Sum of all measurements : 1444 nW (lower bound) – 1469 (upper
bound)Number of measurements : 132 (lower bound) – 146 (upper bound)=> Average power in the beam : 10.5±0.5 nW/cm2
Area of effective light beam from the camera photo : 7665 ±200 cm2
=> Total flux in beam incident on L1 : 80494±4370 nW (~5% error)
3 – Exploration of the focal plan
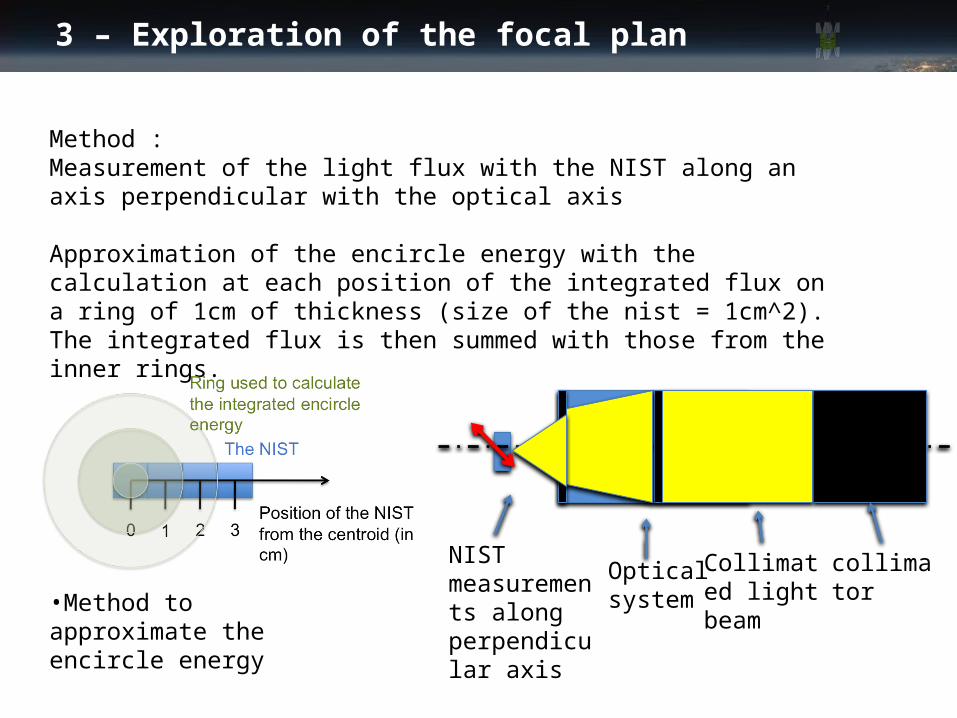
Method : Measurement of the light flux with the NIST along an axis perpendicular with the optical axis
Approximation of the encircle energy with the calculation at each position of the integrated flux on a ring of 1cm of thickness (size of the nist = 1cm^2). The integrated flux is then summed with those from the inner rings.
•Method to approximate the encircle energy
collimatorCollimated light beam
Optical system
NIST measurements along perpendicular axis
3 – Exploration of the focal plan
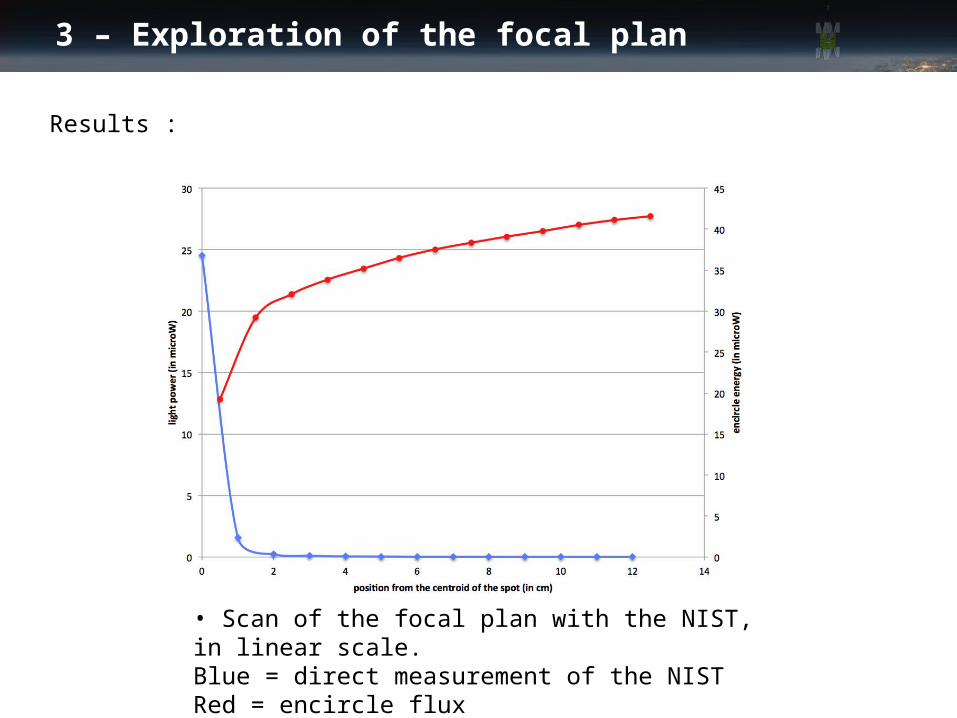
• Scan of the focal plan with the NIST, in linear scale.Blue = direct measurement of the NISTRed = encircle flux
Results :
3 – Exploration of the focal plan
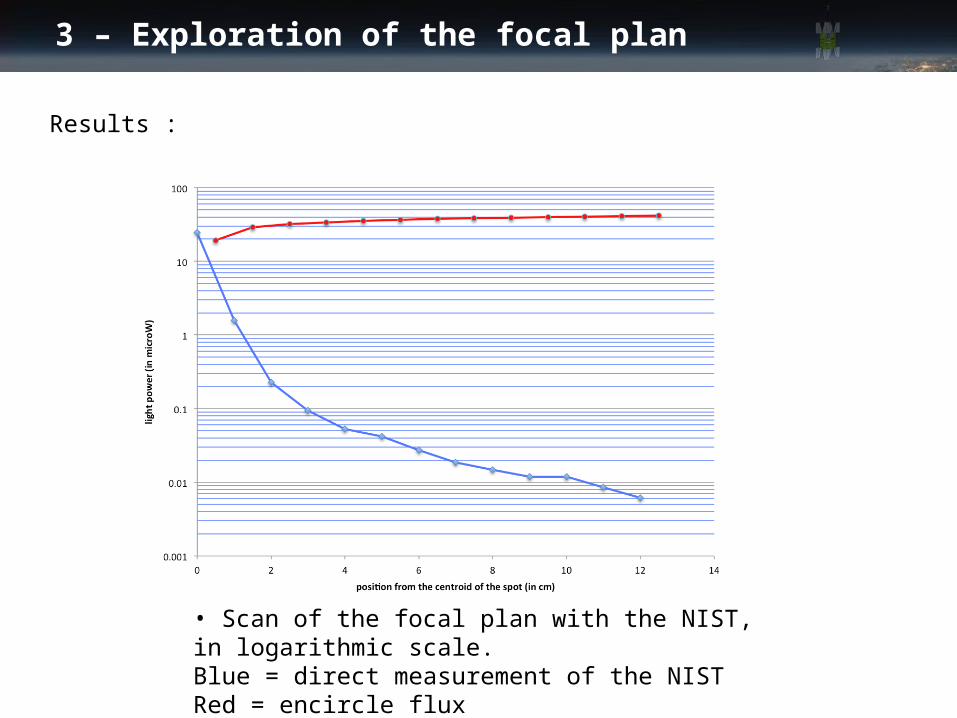
• Scan of the focal plan with the NIST, in logarithmic scale.Blue = direct measurement of the NISTRed = encircle flux
Results :
3 – Exploration of the focal plan
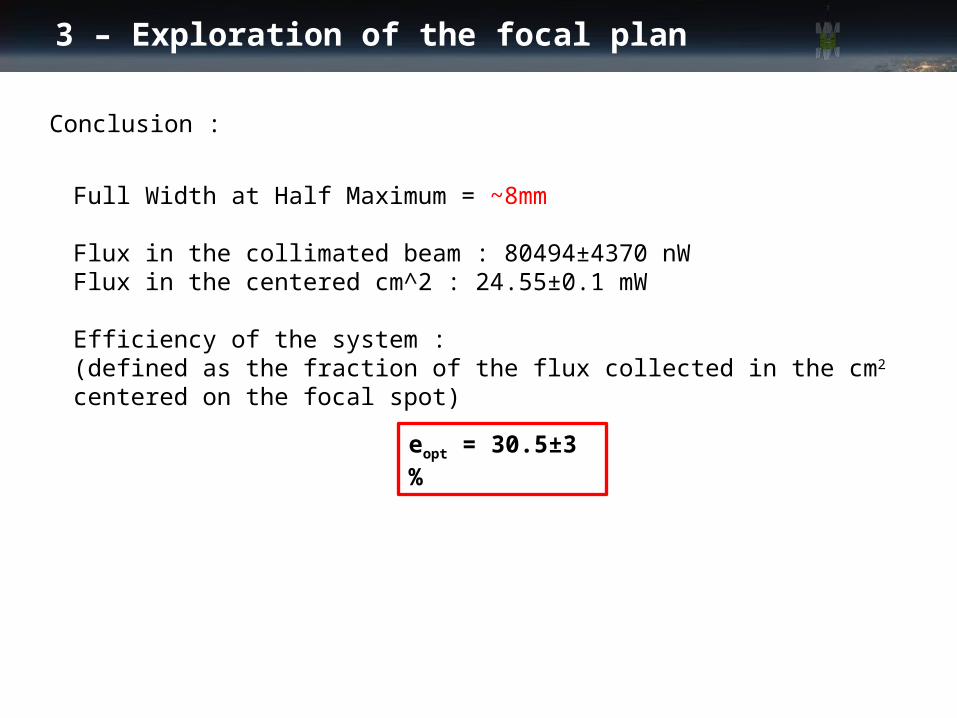
Conclusion :
Full Width at Half Maximum = ~8mm
Flux in the collimated beam : 80494±4370 nWFlux in the centered cm^2 : 24.55±0.1 mW
Efficiency of the system :(defined as the fraction of the flux collected in the cm2 centered on the focal spot)
eopt = 30.5±3 %
3 – Exploration of the focal plan
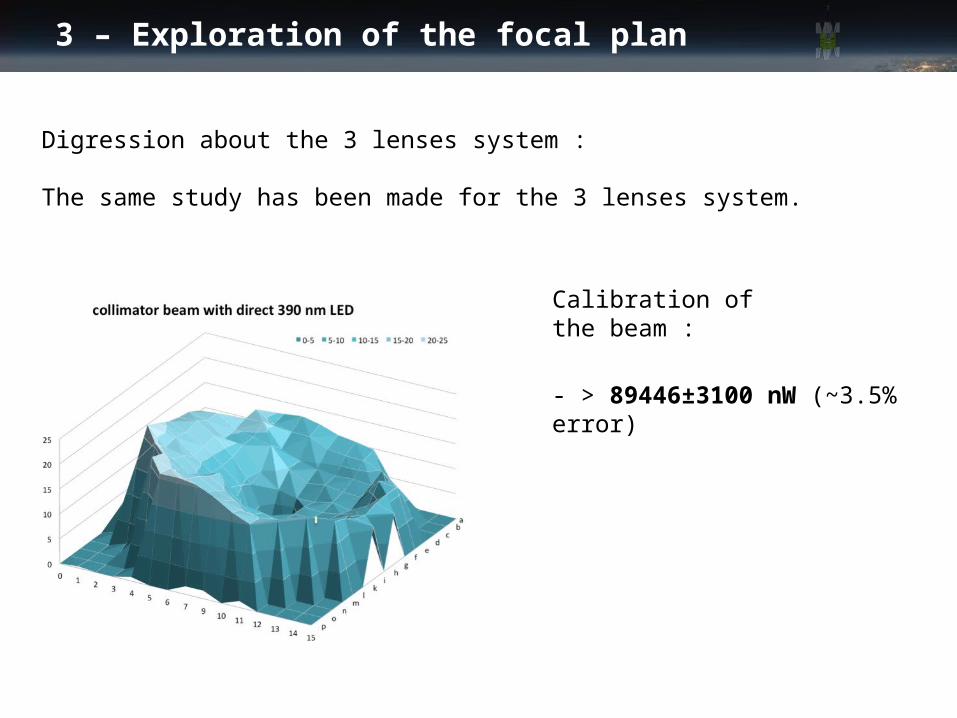
Digression about the 3 lenses system :
The same study has been made for the 3 lenses system.
- > 89446±3100 nW (~3.5% error)
Calibration of the beam :
3 – Exploration of the focal plan
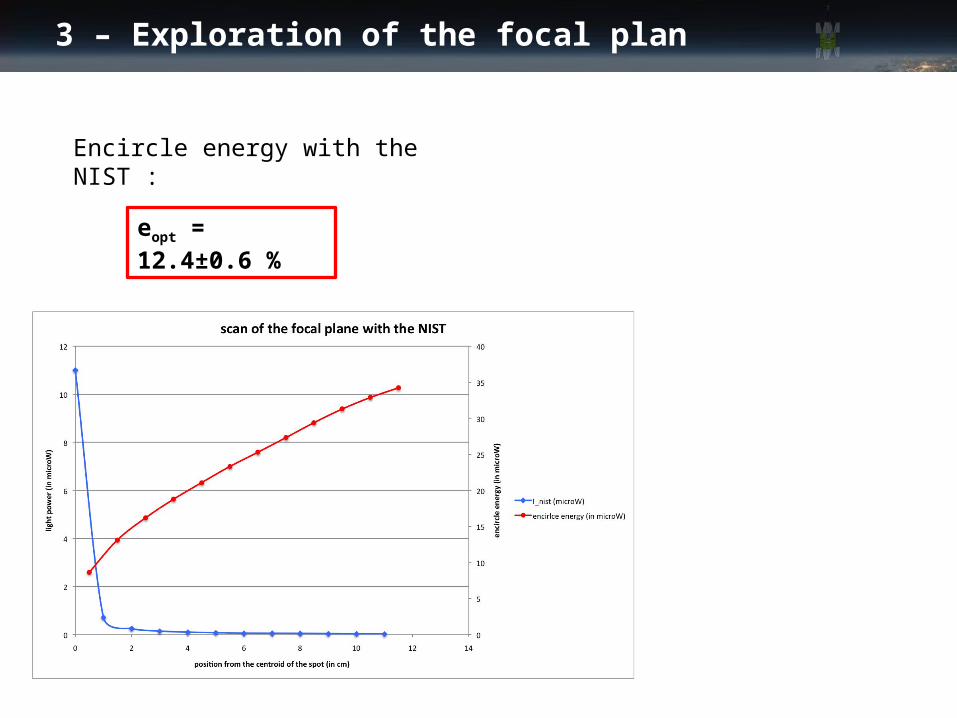
Encircle energy with the NIST :
eopt = 12.4±0.6 %
3 – Exploration of the focal plan
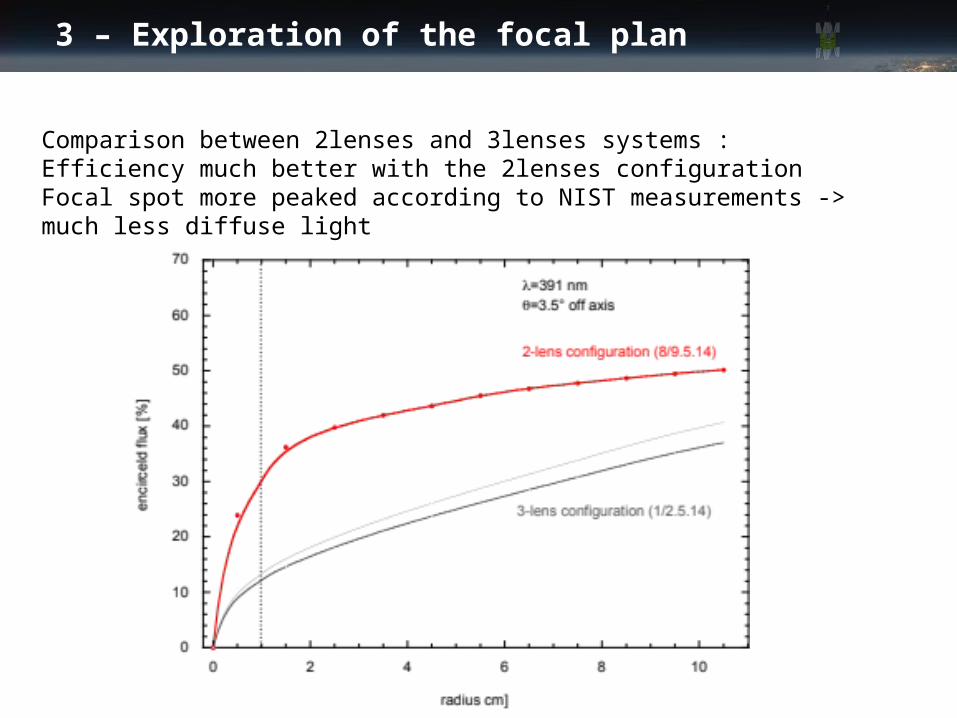
Comparison between 2lenses and 3lenses systems :Efficiency much better with the 2lenses configurationFocal spot more peaked according to NIST measurements -> much less diffuse light
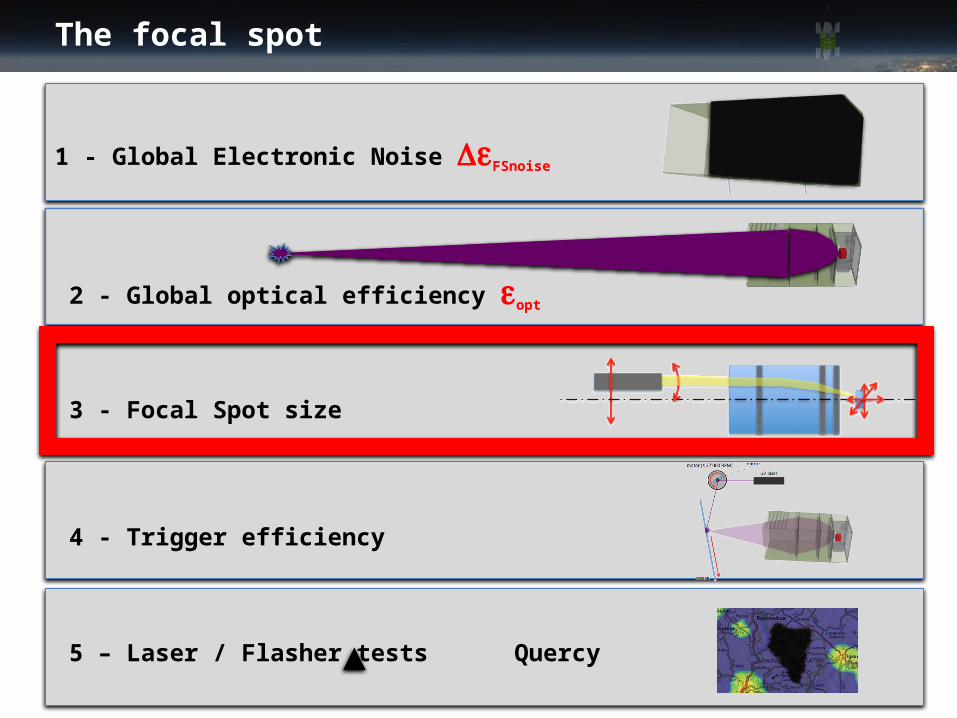
The focal spot
3 - Focal Spot size
4 - Trigger efficiency
5 – Laser / Flasher tests Quercy
2 - Global optical efficiency eopt
1 - Global Electronic Noise DeFSnoise
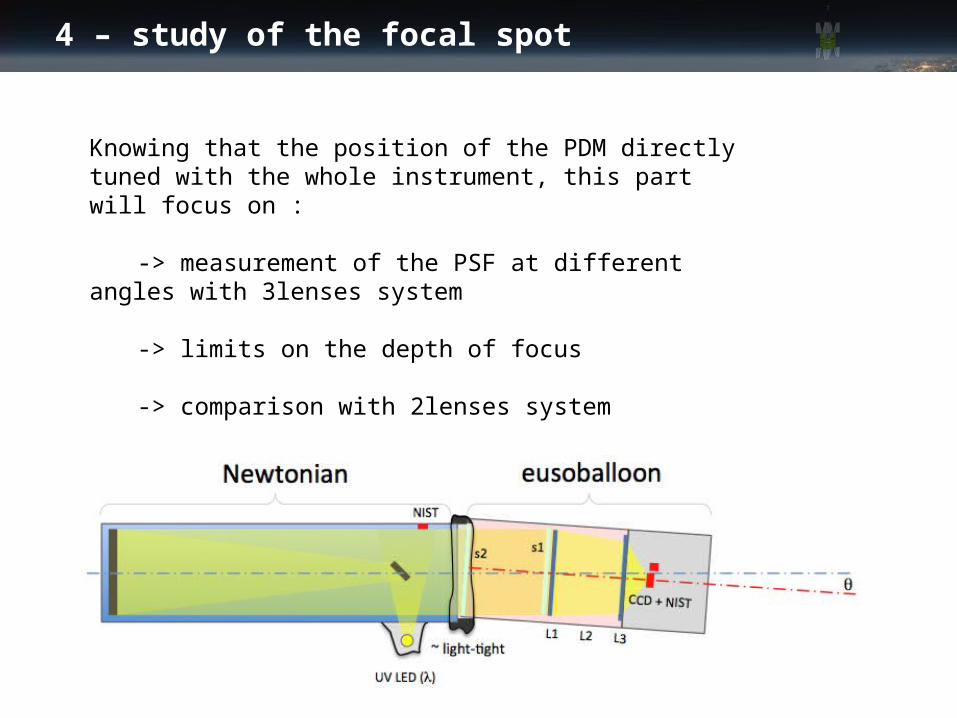
4 – study of the focal spot
Knowing that the position of the PDM directly tuned with the whole instrument, this part will focus on :
-> measurement of the PSF at different angles with 3lenses system
-> limits on the depth of focus
-> comparison with 2lenses system
Same test setup than for the efficiency, moving the CCD along the optical axis for different incidence angles
4 – study of the focal spot
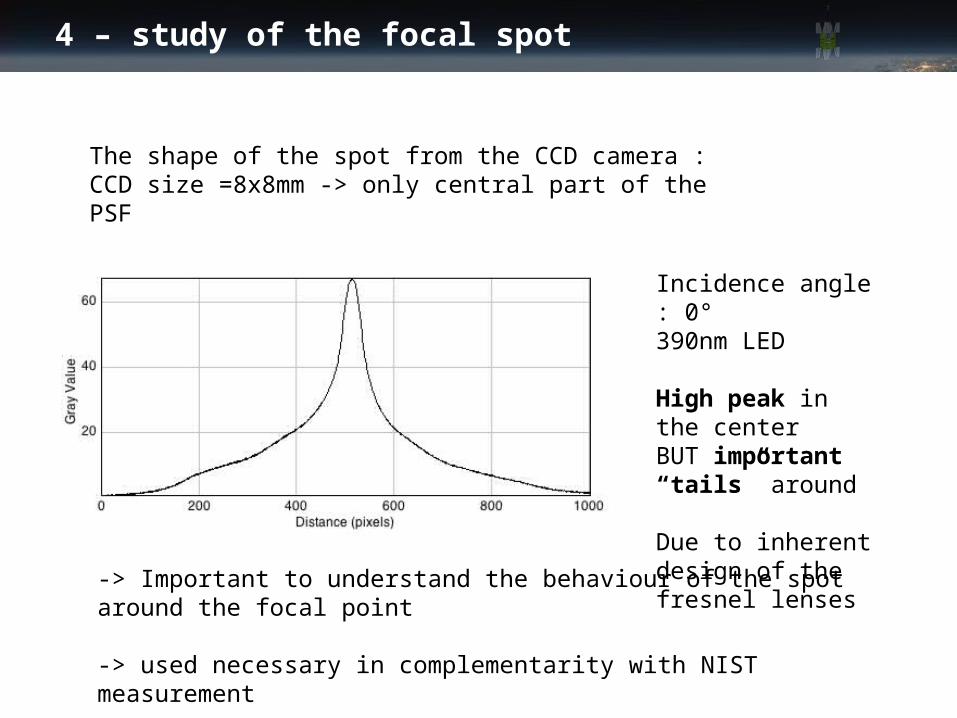
The shape of the spot from the CCD camera :CCD size =8x8mm -> only central part of the PSF
-> Important to understand the behaviour of the spot around the focal point
-> used necessary in complementarity with NIST measurement
Incidence angle : 0°390nm LED
High peak in the centerBUT important “tails” around
Due to inherent design of the fresnel lenses

4 – study of the focal spot
Gaussian fit on each spot image to have Full Width at Half Maximum
typical CCD image of the focal spot for the 3 lenses system :
pixe
ls ADU unit
ADU unit
4 – study of the focal spot
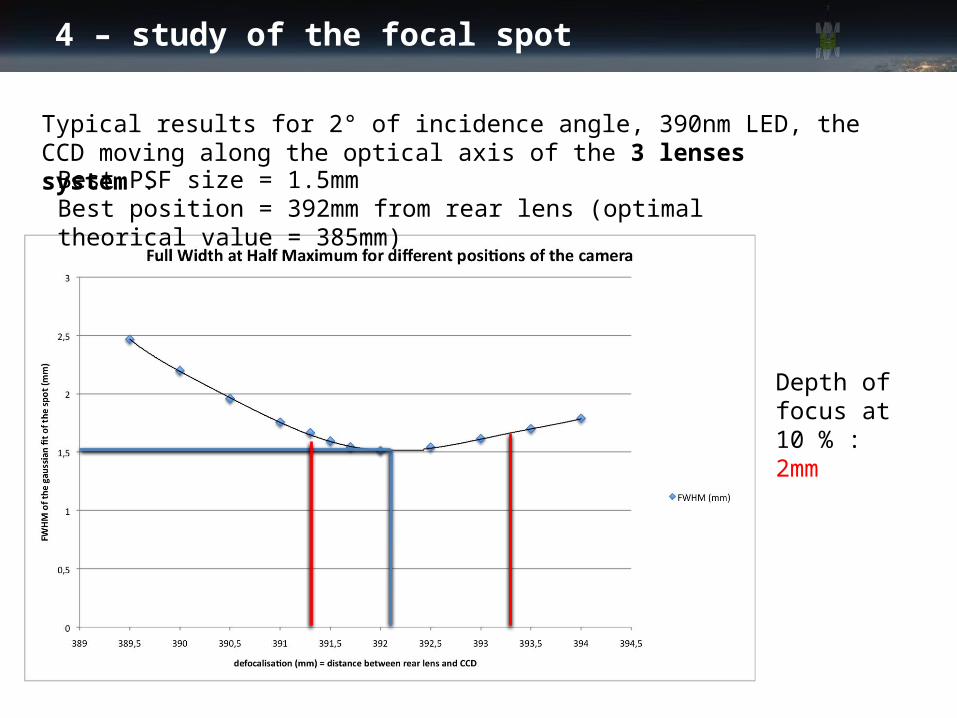
Typical results for 2° of incidence angle, 390nm LED, the CCD moving along the optical axis of the 3 lenses system :
Best PSF size = 1.5mmBest position = 392mm from rear lens (optimal theorical value = 385mm)
Depth of focus at 10 % :2mm
4 – study of the focal spot
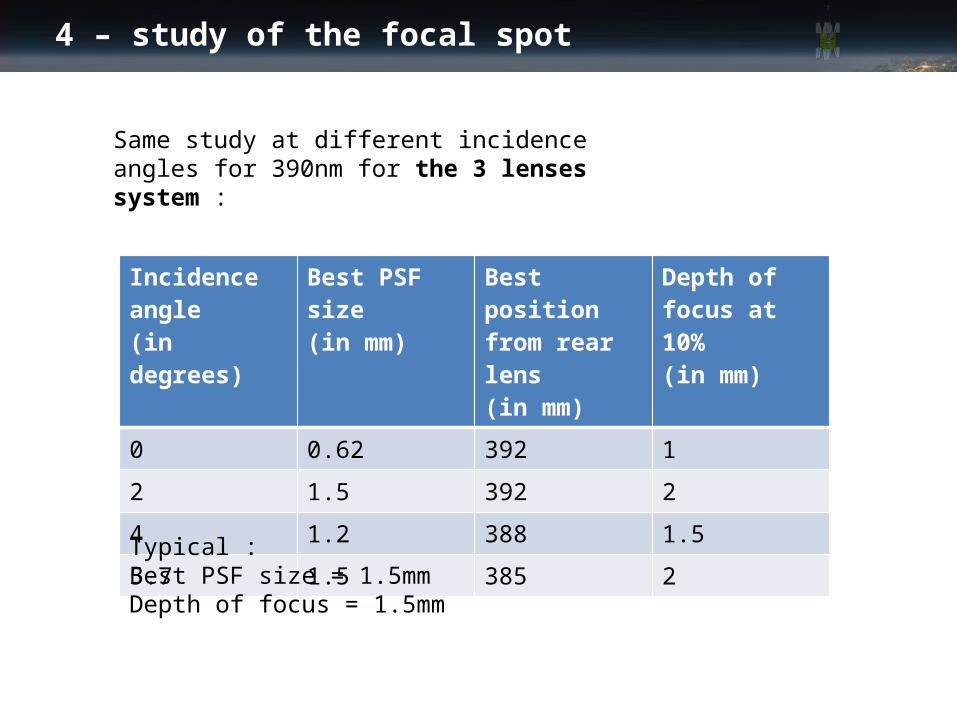
Incidence angle(in degrees)
Best PSF size(in mm)
Best position from rear lens(in mm)
Depth of focus at 10%(in mm)
0 0.62 392 1
2 1.5 392 2
4 1.2 388 1.5
5.7 1.5 385 2
Same study at different incidence angles for 390nm for the 3 lenses system :
Typical :Best PSF size = 1.5mmDepth of focus = 1.5mm
4 – study of the focal spot
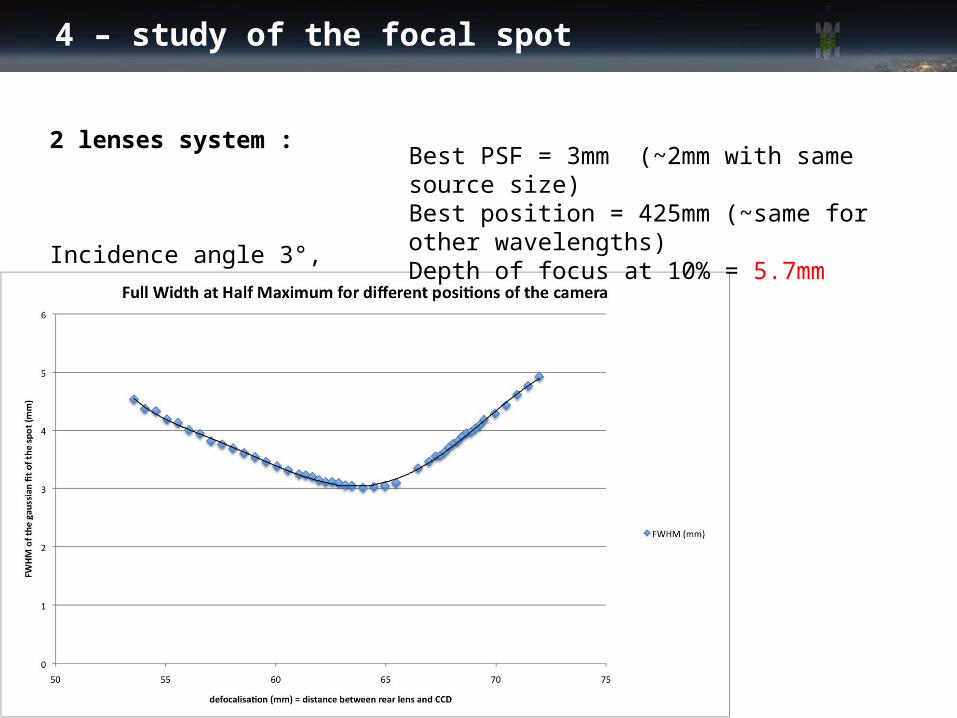
2 lenses system :
Incidence angle 3°, 390nm
Best PSF = 3mm (~2mm with same source size)Best position = 425mm (~same for other wavelengths) Depth of focus at 10% = 5.7mm
In a conclusion
The PSF of the system has a narrow peak in the center (typically 2mm size) in a focusing range of ~5mm
-> this will not be seen by the PDM (pixel size of 3mm)-> But FWHM of 8mm from NIST measurement yes.
The NIST study showed that there is much less diffuse light in the 2 lenses system than in the 3 lenses system (encircle energy more steep at center and less after)
-> better focusing power of the 2lenses system
Much better efficiency for the 2lenses system :
eopt = 30.5±3 %