europa xxi 2007 16 : regional development in central...
TRANSCRIPT
POLISH ACADEMY OF SCIENCES
STANISŁAW LESZCZYCKI
INSTITUTE OF GEOGRAPHY AND SPATIAL ORGANIZATION
POLISH GEOGRAPHICAL SOCIETY
EUROPA XXI16
REGIONAL DEVELOPMENT IN CENTRAL EUROPE –
– COHESION OR COMPETITIVENESS
WARSZAWA 2007

VOLUME REVIEWED BY:Miroslav Marada, Mirosław Grochowskia and Mariusz Kowalski
VOLUME CO-FINANCED BY:Ministry of Science and Higher Education
The Committee on Geographical Sciences, Polish Academy of Sciences
EDITORIAL OFFICE:Insitute of Geography and Spatial Organization, PAS
00-818 Warszawa
ul. Twarda 51/55
tel. (48-22) 69 78 851
fax (48-22) 62 02 221
www.igipz.pan.pl
e-mail: [email protected]
PREPARED FOR PRINT BY:
Sebastian Borkowski Jacek Majerczak
PRINTED IN:Drukarnia Klimiuk
ul. Foksal 11
00-372 Warszawa
© Copyright by Stanisław Leszczycki Institute of Geography and Spatial Organization, PAS
Warszawa 2007
ISSN 1429-7132
http://rcin.org.pl

CONTENTS
TOMASZ KOMORNICKI - Editorial ................................................................................................5
TOWARDS COMPETITIVE METROPOLITAN AREAS AND CLUSTERSTADEUSZ STRYJAKIEWICZ – The development of a creative knowledge sector in metropo-
litan regions: the case of Poznań .............................................................................................9
SVEN ILERIS – Clusters in an age of increasing internationalisation, highlighted by the cloth-
ing cluster of Herning, Denmark ..........................................................................................19
AGNIESZKA CIEŚLA – City shrinking as a challenge for new EU Member States – learning
from the Eastern German experience ..................................................................................31
KATARZYNA ALICJA KUĆ-CZAJKOWSKA – Warsaw, Prague, Budapest – metropolitan
functions comparison .............................................................................................................39
PIOTR TRZEPACZ, JOANA WIĘCŁAW-MICHNIEWSKA – Infrastructural determinants of
spatial structure in Cracow’s suburban zone – a case study of the Michałowice and Zabie-
rzów communities ...................................................................................................................63
TOWARDS A COMMON EUROPEAN TRANSPORT SYSTEMJUSTYNA BAGIŃSKA – Towards a common European passenger railway system ................81
DANIEL MICHNIAK – Direct international public transport connections of regional centres
in Slovakia ...............................................................................................................................87
ROMAN SZUL – Whose is Rospuda? Local, regional, national, EU and global perspectives
of a confl ict between environment protection and infrastructure building in Augustów
(Poland) .................................................................................................................................101
TOWARDS DEEPER COHESION OF BORDER AREASDAVID BOGATAJ, MARIJA BOGATAJ – Free Zones on the EU borders as the response on
reduction of daily commuting through the southern EU border .....................................109
GIANCARLO COTELLA – The importance of the operational dimension in Cross-border
Cooperation Initiatives: Italy looks South-East ................................................................131
SYWIA DOŁZBŁASZ, ANDRZEJ RACZYK – New versus old cross-border cooperation prog-
rammes in the example of Polish – Czech and Polish – German border areas................153
MARIA BEDNAREK – Rural areas along the eastern border of the European Union – problems
and perspectives of development with special consideration of tourism (on the example of
three Polish municipalities) .................................................................................................167
KEIJI SATO – The rebirth of sovereign states and fi rst challenge to national interests of
Republics of Soviet Union (1989) .......................................................................................181
JURAJ MAJO, MARCEL HORŇÁK – Ethnic diversity of Slovakia .........................................191
http://rcin.org.pl

http://rcin.org.pl
EDITORIAL
In the view of many, the alternative options of cohesion versus competitiveness represent one
of the most important dilemmas underpinning development in today’s Europe. It remains
unclear whether we will be able to reconcile the ambitious goals of the Lisbon Strategy with
the desire that all regions of the European Union should develop cohesively. What is more, we
may even encounter diffi culties in understanding the nature of the cohesion being referred to.
These issues are particularly pertinent in the newly acceded member states, whose relatively
rapid overall economic growth coincides with increasing internal disparities from region to
region. This problem is noted inter alia in the EU’s Territorial Agenda adopted at Leipzig in
spring 2007, but it would seem that the curtailment of disparities between regions may not
be treated as an end in itself in the countries in question. Rather, what would seem to be of
the greatest importance is that a relatively high rate of growth be maintained in all regions.
For this reason, any striving for equality (or cohesion) ought to relate less to the level of GDP
and growth indices therefore, and more to what can be broadly conceived as spatial accessi-
bility and the state of human capital. In the same way, the efforts should be taken to denote prio-
rity status for infrastructure (in transport and telecommunications) and the decentralisation
of education (affording equality of opportunity). Beyond that, the depicting of disparities
in the Central European countries is often very much more complicated than is the case at
the main levels on which statistical data are gathered, i.e. the so-called NUTS-2 or NUTS-3.
In conditions of impaired accessibility plus limited migrational mobility, regions themselves
are found to be differentiated internally, ensuring the establishment of a mosaic of towns and
communes more or less developed and offering better or worse living standards for inhabitants.
It is this lack of cohesion to be observed on various spatial scales that constitutes the lead
theme in this next (16th) volume in the Europa XXI series. Thus, this volume brings together
scientifi c papers devoted to metropolitan areas and industrial clusters on the one hand, and
to peripheral near-border areas in need of support on the other. These are supplemented by
texts on European transport linkages, while each of the parts mentioned also includes a study
uncovering such additional problems as declining towns and cities, the confl ict between infra-
structural development and environmental protection, and the ethnic diversity to be found in
near-border areas. Some of the articles in question draw upon the papers given and discussions
held during the Third Warsaw Regional Forum convened in October 2007.
Specifi cally, then, the fi rst part of the volume concerns itself with the development of actu-
ally or potentially competitive areas. Most of the articles deal with Central Europe. In this
region, the initial phase of transformation saw main centres of economic growth largely being
confi ned to national capitals, and hence to urban areas concentrating administrative func-
tions (A. Kuć-Czajkowska). With time, the competitiveness of second-order metropolitan
centres also began to increase, these including the Polish cities of Poznań (T. Stryjakiewicz)
and Kraków (P. Trzepacz and J. Więcław-Michniewska). Equally, not all urban centres can be
pointed to as benefi ciaries of change. Some have witnessed degradation of their settlement
systems, losing demographic and economic potential, in spite of efforts at countermeasures.
A famous example here is provided by the cities of Germany’s eastern Länder (A. Cieśla).
http://rcin.org.pl
Joining the large centres as highly-competitive regional structures in today’s Europe are the in-
dustrial clusters. However, in line with the prevalent economic cycles and the economic integ-
ration of the Central European countries, these have been subject to both delocalisation and
structural transformation (S. Ileris).
A condition if centres and regions are to avail themselves of a competitive position is that
they should have good transport linkages; these translating into a high level of mutual acces-
sibility on both the national and international scales. The achievement of the goals of cohesion
policy requires improvements in both road and rail accessibility (J. Bagińska). Furthermore,
the connections present in passenger transport serve in portraying the spatial breakdown
to international relations of both a social and economic nature within different countries
(e.g. Slovakia – D. Michniak). However, the desired development of transport infrastructure
in the new Member States often seems to come up against diffi culties, as confl icts with nature
conservation functions (e.g. in NATURA 2000 areas) arise. One such confl ict exists in Poland,
along the Via Baltica route linking Lithuania, Latvia and Estonia with the rest of the European
Union (R. Szul).
The regions to which cohesion policy is traditionally addressed are the near-border areas,
in particular those located along what is now the external frontier of the European Union as
a whole. While it is true that such a location is increasingly likely to be seen in terms of oppor-
tunity, inter alia as regards the development of broader dimensions to cooperation (G. Cotella)
or the obtainment of structural funding (e.g. from the INTERREG Community Initiative;
S. Dołzbłasz and A. Raczyk), it may also hold socioeconomic development back signifi cantly
where a border is of limited permeability (as in the case of tourism – M. Bednarek). There may
even be a disruption of interactions that were shaped under previous conditions, as in the case
of commutes to work across the Slovenian-Croatian border (D. and M. Bogataj). In addition
to all this, ethnic diversity remains a factor conditioning the situation in near-border areas
(J. Majo and M. Horňák), as does political instability in the case of Eastern European coun-
tries once part of the USSR (K. Sato).
To sum up, the studies brought together here can be said to demonstrate that social and
economic differentiation and disparities present in Central Europe can in some cases run
counter to the traditional divisions underpinning the Western European paradigm on cohe-
sion policy that has been put in place. They thus show how necessary further discussion on
that policy’s future is, along with an indication of how the relative strength of areas that have
emerged as “transformation winners” may nevertheless prove unequal to the task of compet-
ing with the regions of Western Europe that are economically the strongest. In these terms,
even the capitals of the Central European states are seen to be in need of some kind of cohe-
sion policy (inter alia in the context of a desire that the so-called “Pentagon” be decentralised).
However, in this case, what is fi rst, and foremost being sought is improved functional cohe-
sion, as manifested in the way that certain Central European centres of growth are better
interlinked mutually and externally. On the other hand, more traditional assistance for certain
peripheral (including near-border) areas, remains desirable. The weighing up of the two types
of support remains a challenge in respect of yet another EU fi nancing period (2014–2020).
Tomasz Komornicki
http://rcin.org.pl

TOWARDS COMPETITIVE METROPOLITAN AREAS AND CLUSTERS
http://rcin.org.pl

http://rcin.org.pl
THE DEVELOPMENT OF A CREATIVE KNOWLEDGE SECTOR
IN METROPOLITAN REGIONS: THE CASE OF POZNAŃ
TADEUSZ STRYJAKIEWICZ
Institute of Socio-Economic Geography and Spatial Management
Adam Mickiewicz University
Dzięgielowa 27, 61-680 Poznań, Poland
e-mail: [email protected]
Abstract. The emergence of a creative knowledge sector is one of the features
of both a structural change of the world economy and society as well as the process
of advancing metropolitanisation. Metropolitan areas are among those where this
sector develops especially dynamically, and is turning into one of the most important
markers of their competitiveness. The identifi cation of mutual interdependencies
between the process of accommodating creative knowledge and a competitiveness
of metropolitan regions within the enlarged European Union has become a subject
of an international research project called ACRE, implemented within the EU Sixth
Framework Programme. The project’s central question is: What are the conditions
(in particular, the role of so-called “soft” factors) for creating or stimulating “crea-
tive knowledge regions”? The article presents:
a) an outline of the above mentioned project in the context of R. Florida’s concept
of a creative class and a creative city; and
b) preliminary results of the project on the example of the Poznań metropolitan
region.
Key words: creative knowledge sector, metropolitan regions, competitiveness,
Poznań
INTRODUCTION
The emergence of a creative knowledge sector is one of the features of both a structural
change in the world economy and society as well as the process of growing metropolitanisation.
Its spatial consequences are not fully recognised yet. For instance, the research results obtained
to date do not provide an unequivocal answer to the question of whether the growth of creative
sectors and creative regions undermines social cohesion or offers new chances for marginalised
social groups and peripheral areas to participate in economic and social progress. There is no
doubt, however, that metropolitan areas are among those where the creative knowledge sector
develops especially dynamically, turning into one of the most important markers of their com-
EUROPA XXI2007, 16: 9-17
http://rcin.org.pl

10 Tadeusz Stryjakiewicz
petitiveness. To be more precise, there is an interdependence (or feedback) between the proc-
ess of accommodating creative knowledge and the competitiveness of metropolitan regions.
The identifi cation of this interdependence has become a subject of an international research
project called ACRE (which is the acronym of its title, “Accommodating Creative Knowledge:
Competitiveness of European Metropolitan Regions within the Enlarged Union”). The aim of
the article is to present the outline of this project and its preliminary results, using the case of
the Poznań metropolitan region (PMR).
THE OUTLINE OF THE ACRE PROJECT AND ITS THEORETICAL FOUNDATIONS
The ACRE project has been implemented under Priority 7 “Citizens and governance in
a knowledge-based society”, within the EU Sixth Framework Programme. It was launched in
October 2006 and its anticipated implementation time is 48 months. It involves a consortium
of 13 partners from different parts of Europe: Amsterdam, Barcelona, Birmingham, Budapest,
Dublin, Helsinki, Leipzig, Milan, Munich, Poznań, Riga, Sofi a, and Toulouse. As can be seen,
the list of metropolitan regions does not include obvious success stories like London or Paris.
The aim is to fi nd if and how ordinary, lower-ranking European cities can be competitive in
the fi eld of creative knowledge, and to identify the factors that promote or prevent success
in this respect. The project is co-ordinated by Professor Sako Musterd from the Amsterdam
Institute for Metropolitan and International Development Studies (AMIDSt). The research
in Poznań is conducted by the team of the Institute of Socio-Economic Geography and Spatial
Management, Adam Mickiewicz University, under the supervision of the present author.
The project is based on different theoretical inspirations. As Musterd et al. (2007) state,
the traditional agglomeration concept, introduced by Marshall (1890) and used to explain
the rise of new urban-economic clusters, no longer applies in its original sense in the post-
-industrial (or post-Fordist) era. A signifi cant progress in the discussion on the importance of
knowledge and creativity in regional development was made in the 1980s by Törnqvist (1983),
who drew attention to the role of the creative environment (or creative milieu). However,
it is Richard Florida’s concept of a creative class and a creative city (Florida 2002, 2005a,
2005b) which seems most inspiring for the ACRE project. In many circles this concept is be-
ing criticised, vulgarised and reduced merely to an analysis of the gay index (with sensational
overtones – see e.g. Stűber 2007). I am among those who share the opinion that one should
also see its valuable ideas that offer progress, and it is those ideas that are being adopted in
the project. They can be summarised as follows:
1. Creativity is becoming a basic source of social and economic development.
2. A creative class has emerged as a new form of social stratifi cation. According to Florida
(2005, p. 34) “the distinguishing characteristic of the creative class is that its members
engage in work whose function is to create meaningful new forms.” Hence, a signifi cant part
of value added of such work is non-material.
3. The creative class looks for locations characterised by 3 x T: Technology – Talent – Tole-
rance. There has appeared new global competition for talent, and the areas winning this
competition can be called creative regions (or – as in the ACRE project – creative know-
ledge regions).
http://rcin.org.pl

11The development of a creative knowledge sector in metropolitan regions: the case of Poznań
American data show that the creative-sector workers account for 30.1% of total US
employment but as much as 47.0% of total wages, with the average salary being about twice
that paid in the manufacturing and service sectors (Table 1). The ACRE project seeks to relate
the American experience to the European context.
The project’s central question is: What are the conditions for creating or stimulating crea-
tive knowledge regions in the context of the extended European Union? More particularly,
what is the role of so-called ‘soft’ factors in creating and stimulating creative knowledge
regions? (Musterd et al. 2007). One of the major research issues is, for example, to what extent
such factors as the attractiveness of the residential environment, public space and meeting
places, the diversity of the local population, a tolerant atmosphere, the cultural heritage,
a subjective feeling of security, and job satisfaction, affect the creativity of both individuals
and metropolitan regions. To answer this question, a wide-ranging empirical research has been
instituted which rests on questionnaires, surveys and interviews, and embraces the following
target groups: higher school graduates, workers and managers in creative and knowledge-
intensive industries, and transnational migrants. It is too early, though, to present full results,
as the work is still in progress.
CREATIVE KNOWLEDGE SECTOR AND ITS SPATIAL DIMENSION
Before presenting some preliminary conclusions following from the fi rst stage of the research,
it is necessary to give a more precise defi nition of the very notion of the creative knowledge
sector and its scope. This notion is not unequivocal, and similar to other concepts listed in
Table 2. Their wider discussion can be found in Musterd et al. (2007). In the ACRE project,
and consequently in the present article, the creative knowledge sector is taken to fall into two
sub-sectors: (1) creative industries, and (2) knowledge-intensive industries.
Creative industries (according to the defi nition of the UK Department of Culture, Media
and Sport) include:
• advertising,
• architecture,
• arts and antiques,
• artistic crafts,
• design and designer fashion,
• video, fi lm, music and photography,
Table 1. The creative sector in USA
SECTORWorkers Wages Average salary
(in USD)number % billion USD %
Creative sector 38,893,360 30.1 1,993 47.0 51,244
Manufacturing sector 33,498,670 26.0 966 22.8 28,852
Service sector 56,171,370 43.5 1,273 30.0 22,657
TOTAL 129,024,100 100.0 4,241 100.0 32,869
Source: Florida (2005, p. 4)
http://rcin.org.pl

12 Tadeusz Stryjakiewicz
• visual and performing arts and music,
• publishing, and
• radio and TV.
Knowledge intensive industries, in turn, embrace:
• information and communication technologies (ICT),
• fi nancial services,
• law and other business services (e.g. accounting, market research, consultancy), and
• R&D and higher education.
The preliminary conclusions stemming from the fi rst stage of the research emphasise that
the spatial behaviour of the creative class and its spatial concentration are connected with
the processes of (1) urban renewal/revitalising, and (2) suburbanisation. In the latter case,
the research has revealed a shift in the location of both, some creative fi rms and residential
areas to the suburbs. This concerns especially those cities, which have not worked out a rene-
wal policy. This example shows that the future of metropolitan regions largely depends
on policies focusing on the development of their creativity and innovativeness (at the EU,
national, regional and local levels).
The success stories of creative regions, can be divided into those that are more business-
and technology-oriented and those that are more culture-oriented. The question that arises
is whether those two orientations are complementary or whether the predominance of one
weakens the other.
CREATIVE KNOWLEDGE SECTOR IN THE POZNAŃ METROPOLITAN REGION ON THE BACKCLOTH OF OTHER METROPOLITAN REGIONS IN EUROPE
Poznań is one of the oldest, largest and fastest-growing cities in Poland, located in
the west-central part of the country on the Warta river, halfway between Warsaw and Berlin.
Table 2. Creative knowledge sector – different defi nitions
Creative
industries
Copyright
industries
Content industries Cultural industries Digital content
Largely
characterized by
nature of labour
inputs: ‘creative
individual’
Defi ned by nature
of asset and
industry output
Defi ned by focus of
industry production
Defi ned by public
policy function and
funding
Defi ned by
combination of
technology and
focus of industry
production
Advertising
Architecture
Design
Interactive
Software
Film and TV
Music
Publishing
Performing Arts
Commercial art
Creative arts
Film and Video
Music
Publishing
Recorded media
Data-processing
Software
Pre-recorded music
Recorder music
Music retailing
Broadcasting and
fi lm
Software
Multimedia services
Museums and galleries
Visual arts and crafts
Arts education
Broadcasting and fi lm
Music
Performing Arts
Literature
Libraries
Commercial arts
Film and video
Photography
Electronic games
Recorded media
Sound recording
Information
storage and
retrieval
Source: Hartley (2005, p. 30)
http://rcin.org.pl
13The development of a creative knowledge sector in metropolitan regions: the case of Poznań
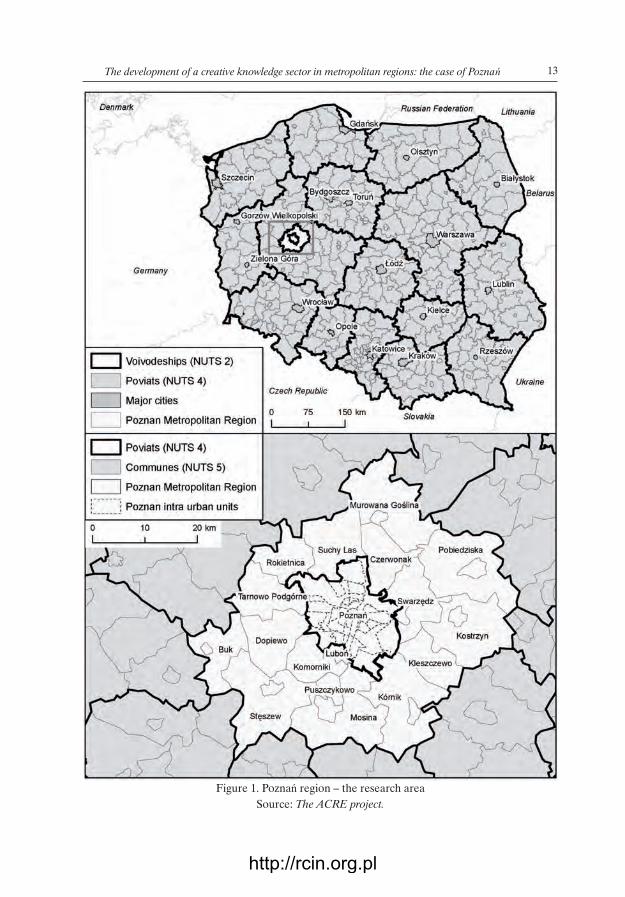
Figure 1. Poznań region – the research area
Source: The ACRE project.
http://rcin.org.pl
14 Tadeusz Stryjakiewicz
It is the capital of the Wielkopolska (Greater Poland) region where the Polish statehood origi-
nated more than 1,000 years ago. With its 568,000 inhabitants (2005), Poznań is the fi fth larg-
est city in Poland (after Warsaw, Łódź, Cracow, and Wrocław). The population of the Poznań
metropolitan region (PMR) is about 856,000. The spatial range of the region adopted in
the ACRE project, apart from the city, coincides with the boundaries of the administrative unit
called Poznan poviat (district). It corresponds to the NUTS 4 level and includes the adjacent
towns and communes (gmina) (Figure 1).
The position of Poznań, in the European network of metropolitan regions is defi ned by
the following features:
1. In comparison with the biggest European cities, Poznań’s metropolitan functions are not
fully formed yet.
2. Poznań’s location halfway between Warsaw and Berlin puts the city under strong competi-
tive pressure from those two capitals.
3. The discontinuity of the city’s development path and its inability to keep up with global
processes under the communist system (like in other cities of the Eastern bloc) have serious
implications for accommodating creative knowledge.
4. In spite of all the above-mentioned reservations, Poznań is one of the most dynamic Polish
cities, a leader in the process of social and economic transformation. It also has assets that
can make it into a creative and knowledge-based metropolitan region. So far, this type of
development path has been far from common in post-communist East-Central Europe.
There are signs, however, that this unfavourable situation is gradually changing. Poznań provides many examples of this change.
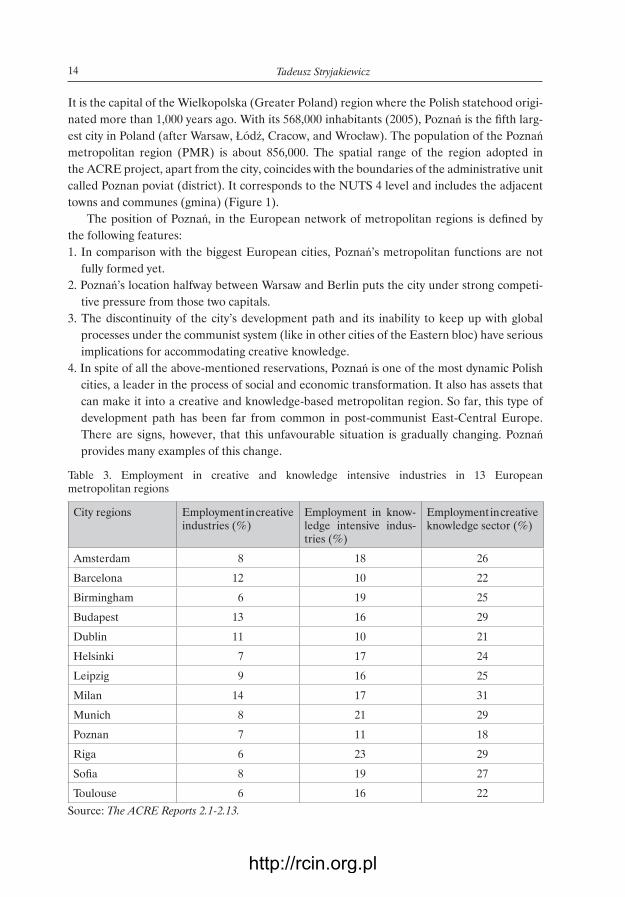
Table 3. Employment in creative and knowledge intensive industries in 13 European metropolitan regions
City regions Employment in creative industries (%)
Employment in know-ledge intensive indus-tries (%)
Employment in creative knowledge sector (%)
Amsterdam 8 18 26
Barcelona 12 10 22
Birmingham 6 19 25
Budapest 13 16 29
Dublin 11 10 21
Helsinki 7 17 24
Leipzig 9 16 25
Milan 14 17 31
Munich 8 21 29
Poznan 7 11 18
Riga 6 23 29
Sofi a 8 19 27
Toulouse 6 16 22
Source: The ACRE Reports 2.1-2.13.
http://rcin.org.pl
15The development of a creative knowledge sector in metropolitan regions: the case of Poznań
At present, Poznań’s share of the creative knowledge sector in total employment is the lowest
among the 13 European metropolitan regions participating in the ACRE project (Table 3).
Still, the fi gures listed in the table should be treated with caution owing to less-than-full com-
patibility of statistics in the different countries. Moreover, metropolises housing state capi-
tals are generally characterised by a higher proportion of employment in the creative sectors
(especially the media) than regions not performing national-capital functions.
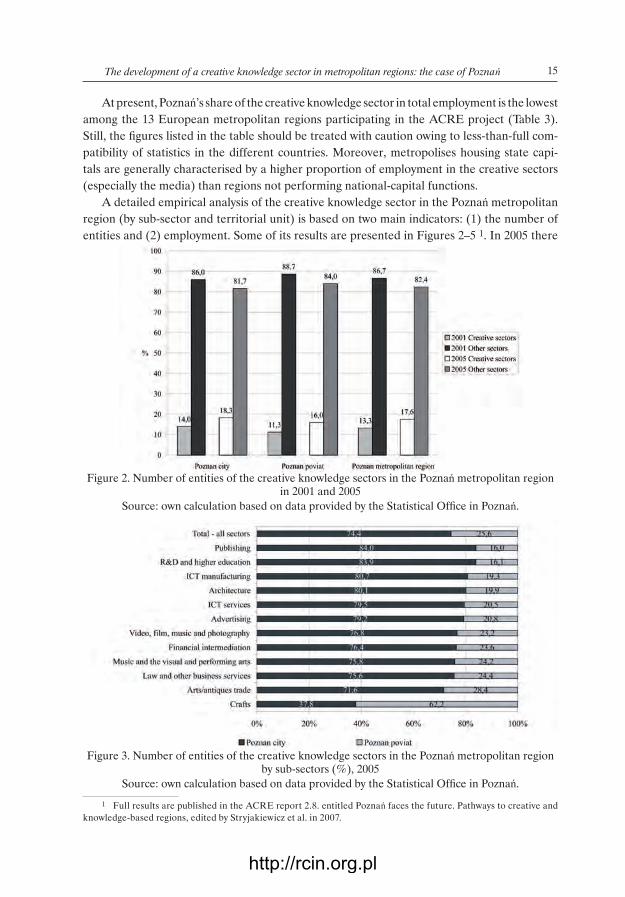
A detailed empirical analysis of the creative knowledge sector in the Poznań metropolitan
region (by sub-sector and territorial unit) is based on two main indicators: (1) the number of
entities and (2) employment. Some of its results are presented in Figures 2–5 1. In 2005 there
1 Full results are published in the ACRE report 2.8. entitled Poznań faces the future. Pathways to creative and
knowledge-based regions, edited by Stryjakiewicz et al. in 2007.
Figure 2. Number of entities of the creative knowledge sectors in the Poznań metropolitan region in 2001 and 2005
Source: own calculation based on data provided by the Statistical Offi ce in Poznań.
Figure 3. Number of entities of the creative knowledge sectors in the Poznań metropolitan region by sub-sectors (%), 2005
Source: own calculation based on data provided by the Statistical Offi ce in Poznań.
http://rcin.org.pl
16 Tadeusz Stryjakiewicz
were 22,200 entities of the discussed sector, or 17.6 % of all businesses in the region, whereas
the employment fi gure was 94,260, or 17.5 % of total employment. Those fi rms show a high
growth dynamics. In 2001–2005 their number increased by 45 %, which contributed substan-
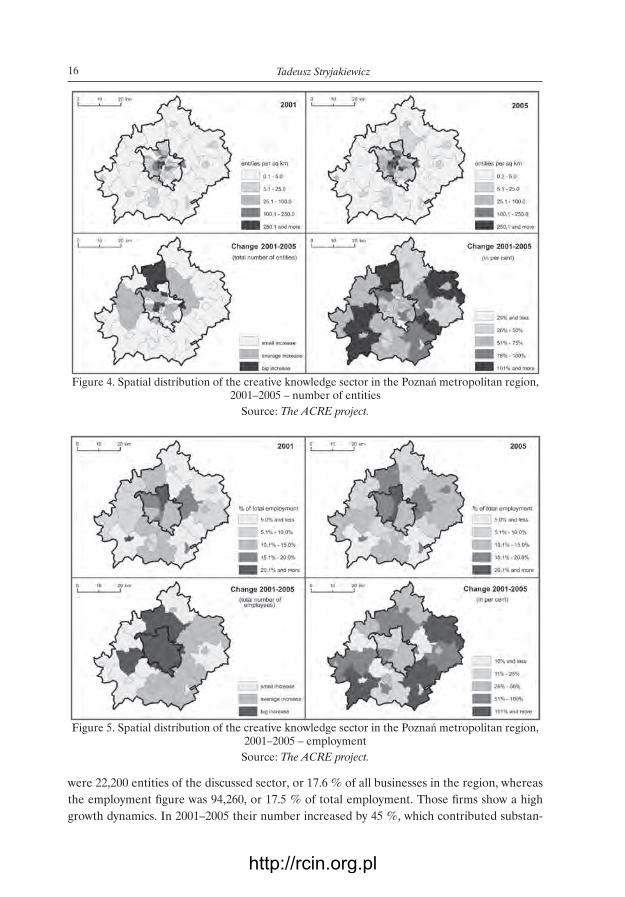
Figure 4. Spatial distribution of the creative knowledge sector in the Poznań metropolitan region, 2001–2005 – number of entities
Source: The ACRE project.
Figure 5. Spatial distribution of the creative knowledge sector in the Poznań metropolitan region, 2001–2005 – employment
Source: The ACRE project.
http://rcin.org.pl

17The development of a creative knowledge sector in metropolitan regions: the case of Poznań
tially to the increase in the total number of economic entities over that period (two-thirds of
the new businesses were those in the creative sector). Also employment dynamics was high-
er in the creative and knowledge-intensive industries than in the economy as a whole. Over
the years 2001–2005 those industries increased their employment in the Poznań metropolitan
region by 31.9 % as against a rise in total employment of 10.3 %, with the increase being higher
in the suburban communes than in the city. The highest dynamics was recorded in ICT services,
in which employment grew by 137.3 %, followed by law and other business services – by 84.7 %.
A characteristic structural feature is a huge number of small businesses (with under
10 employees), which constitute 95.6 % of the total number of creative fi rms. Almost 75 %
of them are located within the city limits (mostly in the downtown and the densely popu-
lated areas around it). The highest concentration in the city is characteristic of publishing,
R&D and higher education, whereas crafts are located mostly in the suburbs (which is largely
determined by the cluster of traditional carpenters’ handicraft in Swarzędz resembling to some
extent the ‘Third Italy’ model – for details see Stryjakiewicz 2005).
The creative knowledge sector is represented in Poznań primarily by business and ICT-
-oriented fi rms as well as institutions of higher education. The role of cultural industries
(including the media) has so far been mediocre. Among the factors stimulating the develop-
ment of the creative and knowledge-based industries, ‘hard’ factors still seem to predominate
over ‘soft’ ones. This statement can be reconsidered after completion of the next Work Pack-
ages of the ACRE project. It seems, however, that the Poznań metropolitan region is one of
those emerging metropolises in the European arena which seek to associate their future with
the development of the creative knowledge sector.
REFERENCES
Florida R. (2002) The rise of the creative class and how it’s transforming work, leisure, community
and everyday life, Basic Books, New York.
Florida R. (2005a) Cities and the creative class, Routledge, New York.
Florida R. (2005b) The fl ight of the creative class, Harper, New York.
Hartley J. (ed.) (2005) Creative industries, Blackwell, Malden, Mass.
Marshall A. (1890) Principles of economics, Macmillan, London.
Musterd S., Bontje M., Chapain C., Kovacs Z., Murie A. (2007) Accommodating creative
knowledge. A literature review from a European perspective, AMIDSt, Amsterdam.
Stryjakiewicz T. (2005) Contrasting experiences with business networking in a transition economy:
the case of Poland, in: Alvstam C.G. and Schamp E.W. (eds), Linking industries across the
world. Processes of global networking, Aldershot, Ashgate, 197–219.
Stryjakiewicz T., Kaczmarek T., Męczyński M., Parysek J.J., Stachowiak K. (2007) Poznań faces
the future. Pathways to creative and knowledge-based regions, AMIDSt, Amsterdam.
Stűber M. (2007) Diversity. Das Potenzial von Viellfalt nutzen – den Erfolg durch Offenheit
steigern, Forum, 20, 32–39.
Tőrnqvist G. (1983) Creativity and the renewal of regional life, in: Buttimer A. (ed.), Creativity
and context. Lund Studies in Geography, Series B, 50, 91–112.
http://rcin.org.pl

http://rcin.org.pl
CLUSTERS IN AN AGE OF INCREASING INTERNATIONALISATION,
HIGHLIGHTED BY THE CLOTHING CLUSTER OF HERNING, DENMARK
SVEN ILLERIS
Roskilde University
P.O.Box 260, DK-4000 Roskilde, Denmark
e-mail: [email protected]
Abstract. The paper examines the textile and clothes production cluster of Hern-
ing in western Jutland, Denmark, which came into existence from the 1930s and
expanded successfully after World War II. Meeting competition from the low wage
countries of Central-Eastern Europe and East Asia after 1990, it has survived with
virtually no unemployment. On this background, three problems are discussed:
The meeting of globalisation by openness, innovation and entrepreneurship. Cur-
rent cluster theories, which are critiqued, in particular socio-cultural attitudes, are
argued to be more important than trade relations between fi rms, and regional poli-
cies, which cannot be based on the creation of clusters.
Key words: clusters, industrial districts, clothes production, globalisation, regional
policy, off-shoring
INTRODUCTION
This paper addresses some of the most important contemporary public and scientifi c problems:
- Increasing globalisation, and in particular its impact in the rich western world;
- Clusters or industrial districts, by which is meant geographical concentrations of similar or
related fi rms. Though this phenomenon has existed for a long time, it was not until late 1970s
that Italian economists (e.g. Becattini 1990) became aware of its importance in the “Third
Italy”, and not until 1990 that the American economist Michael Porter mapped it in several
countries. Since then, most of the scientifi c debate on regional development has focussed on
clusters and the building of cluster theory.
- The role of clusters in regional policy. On the background of a certain unoffi cial dissatisfac-
tion with the regional policies conducted by national governments and the European Union–
– not thought to produce value for money – cluster-building was seized by many authorities
responsible for regional policy as a “miracle solution”.
EUROPA XXI2007, 16: 19-30
http://rcin.org.pl

20 Sven Illeris
Hence, there is a need to understand better, how and under what conditions clusters come
into existence and develop, especially clusters which the increasing globalisation has exposed
to international competition.
The fi rst part of this paper is devoted to a case study of the textile and clothing district
of Herning, a town with 60,000 inhabitants in the County of Ringkoebing (western Jutland).
The case has been studied over two decades by an array of sources – statistics, interviews,
scientifi c literature, memoirs of persons involved, newspapers, reports from various authori-
ties. In the second part of the paper, the results will be related to the ways in which rich
countries handle the contemporary wave of internationalisation, to current theoretical debates
about clusters, and to regional policies based on cluster-building.
THE HERNING CLOTHING DISTRICT UP TO 1990
In the Herning area, the origins of the clothing production can be traced back to the poor
farmers of the sandy, heath-covered western Jutland of the 17th century. The farmers started
knitting wool clothes, which were sold all over Denmark and Norway by ambulant stocking
vendors.
In the second half of the 19th century, the heathlands were recultivated, the population
increased rapidly, and in the former townless district, Herning grew up at a highway crossings
and railway junction. Herning was primarily a service town, but both in the town and in the
surrounding district, some manufacturing enterprises were established, including textile and
clothing production.
Figure 1. The situation of Herning, the Herning clothing district, and the County of Ringkoebing
http://rcin.org.pl

21Clusters in an Age of Increasing Internationalisation ...
Under the protectionist umbrella of the 1930s, entrepreneurs saw their chance to expand
the textile and clothing industry. During World War II – with no imports and scarcity of raw
materials – all that could be produced could be sold. After the war, international trade was
liberalized in western Europe. Much of the West European textile and clothes production
succumbed to the increased competition – including that of the previously leading Danish
industry in Copenhagen, see Figure 2.
The Herning fi rms, however, seized the liberalisation to expand their sales. In the 1950s,
they started to export to the Scandinavian countries, and the Danish EC-membership in 1973
was used to start an export to West Germany. Table 1 shows the changing employment in
the manufacturing of textiles and clothing.
While the County of Ringkoebing before World War II was one of the least industrialized
in Denmark, in 1970 it had become the relatively most industrialized. This was largely due to
Figure 2. Employment in the Textile, Clothing and Leather Production in the countries of Copenhagen and RingkØbing 1914–2005
Herning County of Ringkoebing Denmark
1925 806 2,010 70,706
1948 3,442 6,667 113,374
1970 5,563 10,980 65,266
1993 4,230 12,085 27,785
2005 1,330 3,626 10,031
Table 1. Employment in textile, clothing and leather manufacturing, 1925-2005
Sources: 1925 and 1948: Censuses of industry. Herning = Borough of Herning. 1970: Census of population. 1993 and 2005: Register of labour force.Herning= the 1970 municipality.
http://rcin.org.pl

22 Sven Illeris
its textile and clothing industry, which in Herning was responsible for 56% of the total manu-
facturing employment, in the County of Ringkoebing for 35%.
How could the Herning area – much against the expectations of all “experts” – fi rst so
rapidly expand and later stabilize its employment in this sector?
Undoubtedly, a combination of several factors have contributed (Illeris 1992). The spirit
of entrepreneurship, innovation and openness to do new things or to do them in new ways or
on new markets is important. This was connected with the structure of the sector, consisting
in the Herning area of 500–1000 small, unbureaucratic fi rms. In 1958, the textile and clothing
enterprises in Herning employed on average 14 persons, in the County of Ringkoebing 9. Only
few fi rms have ever had more than 150 employees. Many of the fi rms failed, but new entre-
preneurs – with few exceptions local people – always started. The competitiveness depended
on making clever use of existing ideas found somewhere, rather than on inventing something
really new. And the level of formal education was low, the knowledge involved was practical
rather than theoretical.
Over the second half of the 20th century, products of a higher quality were gradually
introduced. Most fi rms switched from stockings and under-garments to a variety of more
sophisticated and fashionable products. Knit-ware remained a specialisation, ladies´ dresses,
sports-ware for both sexes and children’s clothes are good examples. Several fi rms focussed
on the growing market formed by teenage girls. Important textile products were carpets and
upholstery fabrics, while spinning and weaving of intermediate products tended to be aban-
doned. The most skill-demanding production of men’s ready-made clothes and haute couture
were hardly taken up.
There was as much, perhaps even more focus on process innovation as on product
innovation. While there was no production in the area of machines for the textile and cloth-
ing industry, the machine importers and the user fi rms were well aware of technical progress.
The local textile museum exhibits machines rather than clothes!
The focus on machines may be seen in connection with the cost consciousness present in
this traditionally poor area. The buildings in which the fi rms had started were the cheapest
possible premises – often cellars, stables, garages etc, spread all over the town and villages.
Only gradually, better planned factory buildings in planned industrial estates were built.
Wages were before World War II very low (but during the agricultural crisis of the 1930s,
it was still possible to earn more as a textile worker than as a farmer). After World War II, wage
levels approached the national level, and since housing is cheap, the wage level in real terms
became higher than in Copenhagen (Kristensen 1992). Work was organized in a Taylorist way,
and the repetitive and unergonomic movements were a problem for the seamstresses – at least
until the1980s when fi rms started to change their organisation of work, partly under pressure
from a young generation of female workers.
Labour relations could be said to constitute an asset. The workers – often former farmers
or having grown up on farms – were late to create unions, but after World War II unionisation
became widespread (as it generally is in Denmark). However, the unions in the Herning area
tended to identify more with the employers than elsewhere, strikes were rare, and the workers
were generally loyal and motivated. This must be understood in connection with the fact that
many workers would like to start on their own some day, and that they often knew the emplo-
yers as family members, neighbours or friends. On the other hand, most employers – while
http://rcin.org.pl
23Clusters in an Age of Increasing Internationalisation ...
leading their fi rms in a patriarchal way – treated their personnel well.
While the level of formal education as mentioned was low, tacit as well as codifi ed know-
ledge of textile and clothes production became widespread. Many of the local people had a job in
the sector, and if not, they had at least family members, friends or neighbours who had. The local
“buzz” focussed on the production of clothes, the newspaper wrote about it, etc. Besides,
the employers already at the end of World War II created a school for their personnel, where
further qualifi cations could be obtained.
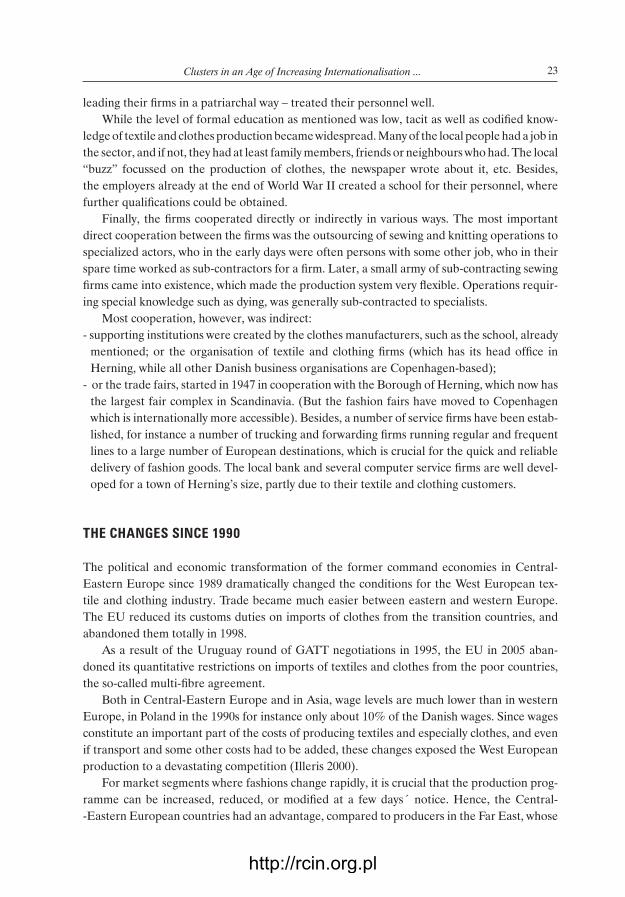
Finally, the fi rms cooperated directly or indirectly in various ways. The most important
direct cooperation between the fi rms was the outsourcing of sewing and knitting operations to
specialized actors, who in the early days were often persons with some other job, who in their
spare time worked as sub-contractors for a fi rm. Later, a small army of sub-contracting sewing
fi rms came into existence, which made the production system very fl exible. Operations requir-
ing special knowledge such as dying, was generally sub-contracted to specialists.
Most cooperation, however, was indirect:
- supporting institutions were created by the clothes manufacturers, such as the school, already
mentioned; or the organisation of textile and clothing fi rms (which has its head offi ce in
Herning, while all other Danish business organisations are Copenhagen-based);
- or the trade fairs, started in 1947 in cooperation with the Borough of Herning, which now has
the largest fair complex in Scandinavia. (But the fashion fairs have moved to Copenhagen
which is internationally more accessible). Besides, a number of service fi rms have been estab-
lished, for instance a number of trucking and forwarding fi rms running regular and frequent
lines to a large number of European destinations, which is crucial for the quick and reliable
delivery of fashion goods. The local bank and several computer service fi rms are well devel-
oped for a town of Herning’s size, partly due to their textile and clothing customers.
THE CHANGES SINCE 1990
The political and economic transformation of the former command economies in Central-
Eastern Europe since 1989 dramatically changed the conditions for the West European tex-
tile and clothing industry. Trade became much easier between eastern and western Europe.
The EU reduced its customs duties on imports of clothes from the transition countries, and
abandoned them totally in 1998.
As a result of the Uruguay round of GATT negotiations in 1995, the EU in 2005 aban-
doned its quantitative restrictions on imports of textiles and clothes from the poor countries,
the so-called multi-fi bre agreement.
Both in Central-Eastern Europe and in Asia, wage levels are much lower than in western
Europe, in Poland in the 1990s for instance only about 10% of the Danish wages. Since wages
constitute an important part of the costs of producing textiles and especially clothes, and even
if transport and some other costs had to be added, these changes exposed the West European
production to a devastating competition (Illeris 2000).
For market segments where fashions change rapidly, it is crucial that the production prog-
ramme can be increased, reduced, or modifi ed at a few days´ notice. Hence, the Central-
-Eastern European countries had an advantage, compared to producers in the Far East, whose
http://rcin.org.pl

24 Sven Illeris
products had to spend a month on a ship before being sold in Europe. However, since the be-
ginning of the new millennium, wage levels in Central-Eastern Europe have increased, and at
the same time, air transport has become relatively cheaper. Thus, Danish imports of clothes
from Poland have started to decrease, to the benefi t of imports from e.g. China, Vietnam and
Bangladesh (Figure 3).
From the early 1990s, prices of textiles and clothes began to decrease in the western World,
and most of the production became unprofi table. More than half of the producers in the Hern-
ing area have had to close, including all the specialized sewing fi rms. As shown in table 1,
the sector’s employment has declined dramatically. First and foremost, the sewing work disap-
peared, and the numerous seamstresses became redundant. Some production was so highly
automated that wage levels had little infl uence on total costs, e.g. the production of carpets.
However, in spite of the dramatic reduction of the formerly most important economic
activity, the textile and clothes production, Herning has not only survived, but is performing
quite well. The redundant seamstresses have found other work, and the rate of unemployment
in the County of Ringkoebing is the second lowest in Denmark (2.6% in December 2006).
The fi rms – even the surviving clothing fi rms – make good profi ts. Among the 24 Danish towns
with between 20,000 and 100,000 inhabitants, Herning is no. 18 as regards educational level,
but no. 12 as regards mean incomes. Let us look at the ways in which the Herning area has met
the challenges of internationalisation – ways, which almost overnight have changed the charac-
ter of the area fundamentally.
The most conspicuous reaction for Danish textile and clothes producers has been to off-
-shore the material production to low-wage countries. This could be done through acquiring
fi rms in the low-wage countries totally or partly, or through having new factories built there
(Foreign Direct Investment). Alternatively, they could make contracts with local fi rms – just as
they formerly had sub-contracted the sewing work to fi rms in the Herning area. Both ways are
applied. If the goods remain under Danish ownership from the start to the fi nished products,
the Danish fi rm is statistically classifi ed as a manufacturing fi rm, even if is does not do any manu-
facturing itself. If not, it is classifi ed as a wholesaling fi rm. In both cases, the tasks carried out is:
- to fi nd out the directions of the market demand;
- to design clothes accordingly and make models/prototypes;
Figure 3. Danish/Polish trade in textiles and clothing, 1988-2004
http://rcin.org.pl
25Clusters in an Age of Increasing Internationalisation ...
- to arrange for the material production according to the design;
- to arrange the connected logistics;
- to market and distribute the products;
- to manage the whole process in a suffi ciently fl exible way.
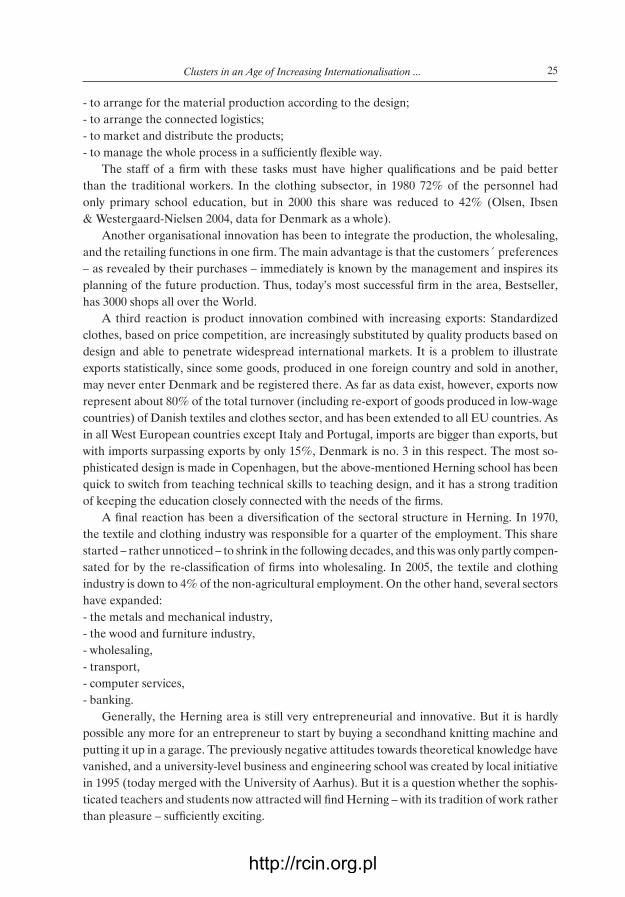
The staff of a fi rm with these tasks must have higher qualifi cations and be paid better
than the traditional workers. In the clothing subsector, in 1980 72% of the personnel had
only primary school education, but in 2000 this share was reduced to 42% (Olsen, Ibsen
& Westergaard-Nielsen 2004, data for Denmark as a whole).
Another organisational innovation has been to integrate the production, the wholesaling,
and the retailing functions in one fi rm. The main advantage is that the customers´ preferences
– as revealed by their purchases – immediately is known by the management and inspires its
planning of the future production. Thus, today’s most successful fi rm in the area, Bestseller,
has 3000 shops all over the World.
A third reaction is product innovation combined with increasing exports: Standardized
clothes, based on price competition, are increasingly substituted by quality products based on
design and able to penetrate widespread international markets. It is a problem to illustrate
exports statistically, since some goods, produced in one foreign country and sold in another,
may never enter Denmark and be registered there. As far as data exist, however, exports now
represent about 80% of the total turnover (including re-export of goods produced in low-wage
countries) of Danish textiles and clothes sector, and has been extended to all EU countries. As
in all West European countries except Italy and Portugal, imports are bigger than exports, but
with imports surpassing exports by only 15%, Denmark is no. 3 in this respect. The most so-
phisticated design is made in Copenhagen, but the above-mentioned Herning school has been
quick to switch from teaching technical skills to teaching design, and it has a strong tradition
of keeping the education closely connected with the needs of the fi rms.
A fi nal reaction has been a diversifi cation of the sectoral structure in Herning. In 1970,
the textile and clothing industry was responsible for a quarter of the employment. This share
started – rather unnoticed – to shrink in the following decades, and this was only partly compen-
sated for by the re-classifi cation of fi rms into wholesaling. In 2005, the textile and clothing
industry is down to 4% of the non-agricultural employment. On the other hand, several sectors
have expanded:
- the metals and mechanical industry,
- the wood and furniture industry,
- wholesaling,
- transport,
- computer services,
- banking.
Generally, the Herning area is still very entrepreneurial and innovative. But it is hardly
possible any more for an entrepreneur to start by buying a secondhand knitting machine and
putting it up in a garage. The previously negative attitudes towards theoretical knowledge have
vanished, and a university-level business and engineering school was created by local initiative
in 1995 (today merged with the University of Aarhus). But it is a question whether the sophis-
ticated teachers and students now attracted will fi nd Herning – with its tradition of work rather
than pleasure – suffi ciently exciting.
http://rcin.org.pl

26 Sven Illeris
CONCLUSIONS WITH REGARD TO GLOBALISATION
The analysis of the Herning case since 1990 shows that it is possible for fi rms in western,
high-wage countries to meet the challenges of globalisation – without recourse to protection-
ism – through openness, innovation and entrepreneurship. Leaders and workers must accept,
however, that they cannot go doing the same things as they did before, they must be willing to
fi nd new productions and learn new skills, and governments must assist them in getting over
these thresholds.
DISCUSSION AND CONCLUSIONS AS REGARDS CLUSTER THEORIES
Surveys of the theories, which have been suggested in recent decades to explain the fact
that similar and related fi rms often locate in rather agglomerated ways have been made i.a.
by Scott (2000), Dunford (2006) and Asheim, Cooke & Martin (2006). As mentioned in
the introduction to this paper, among the “schools” which empirically and theoretically studied
the phenomenon, the two most important ones were (A) a group of Italian economists (who
re-discovered the writings of Marshall (1890) and took into account socio-cultural forces; and
(B) the American economist Porter (1990) whose approach was more exclusively economic.
Even if their theories are not identical, both groups focus on the development of agglom-
erations of competitive and exporting fi rms which belong to the same or connected sectors and
which both compete and co-operate in more or less formalized networks. Such networks may
be formed for each order, which makes the production very fl exible. Spin-off and imitation
fl ourish, thanks to the short distances. Local governments, organisations, teaching systems and
other institutions of the area provide services to the networks.
In order to structure the discussion, it may be useful to apply table 2, showing the main
advantages – most of them recognized already by Marshall – for regional development of in-
dustrial districts/clusters, as they appear in the literature.
As regards the characteristics which on the basis of proximity favour clusters, they are
identical with the advantages or positive externalities which geographers and economists long
ago have observed in large cities. A distinction has usually been made between “advantages of
urbanisation” and “advantages of agglomeration” in a more narrow sense. The former are due
to the size itself of the city: a large supply of manpower with many skills and of services of all
Characteristics depending on geographical proximity, cluster-building:
- Economic connections and co-operation between similar and related fi rms
- Exchange of knowledge between similar and related fi rms
- Common labour-market, supply of persons with relevant knowledge
- Provision of relevant infrastructure and services
Socio-cultural characteristics, not depending on distances:
-Entrepreneurship, innovation, openness, trust, motivation, cooperativeness
Table 2. Characteristics which favour regional development
http://rcin.org.pl
27Clusters in an Age of Increasing Internationalisation ...
kinds, including information and knowledge services; furthermore, a high accessibility by all me
ans of transport and telecommunications, and a reduction of transaction costs due to the short
distances between partners. The narrow notion of advantages of agglomeration, on the other
hand, means the advantages, which derive from proximity of similar or related fi rms. Because
of this specialisation, small districts may offer the same advantages as those offered by large
cities. In the industrial districts or clusters, fi rms primarily enjoy the advantages of agglomera-
tion: a supply of specialized personnel and services, and the special contacts, which they need.
It is easier to obtain the exchange and discussion of the types of knowledge, which constitute
a necessary condition for the competitiveness of sophisticated and innovative fi rms, when
there are partners near by.
These theories have brought the understanding of regional economic development for-
ward by a large step. I think, however, that there are signifi cant shortcomings in the theories
themselves and in their practical applications. Much of my critique is parallel to what Asheim,
Cooke & Martin (2006) have written.
The theories have not suffi ciently studied the important question why some areas develop
into industrial districts and why others do not. I shall return to this question later. The theo-
ries have nothing to say about economic development in areas with no cluster-building. Most
studies have also neglected to emphasize the danger for local cultures to freeze into outdated
ideas („lock-in”); after all not all densely knit milieu are innovative! Nor have they studied
the dangers of too much trust in too closed local societies. In other words, these theories are not
fully fl edged regional development theories – nor did they originally pretend to be so. Where
economic development has happened in regions with no clusters, it has often been the result
of inward investment.
Another weakness is that the industrial district and cluster concepts are only vaguely defi -
ned. Ironically enough, scholars, who wish econometrically to test hypotheses about clusters
rigorously, have defi ned them in such a way that they lose all validity (Engelstoft, Jensen-
-Butler, Smith & Winther 2006). In particular, Porter (1990) is very vague, and the discussion of
“clusters” in a geographical sense only takes up 4 pages of 850; but he has later (1998) written
more extensively on the regional aspect. To mention only one dimension: In spite of their interest
in agglomeration and proximity, the scholars working in this tradition do not write much about
the extent of clusters. How near is “near”? In old intra-urban clothing clusters, such as the gar-
ment district in New York and “le Sentier” in Paris, the fi rms were within walking distances from
one another. When the Herning textile and clothing district was at the top of its importance, it
reached up to 40 kilometres from Herning. Some authors call a sector in a whole country a clus-
ter. But, clearly proximity cannot operate in the same way in these widely different situations.
A general critique is also that the literature is too speculative. Even if both the Italian
economists and Porter presented their theories as derived from empirical studies, in the body
of literature on clusters there is too little concrete documentation.
More specifi cally, the cluster literature has primarily focussed on the aspects of trade and
other direct relations between fi rms. For instance, Oosterhaven & Broersma (2007) defi ne
cluster economies as groups of closely interacting industries. But as stressed by Storper (1997),
whenever other aspects have been studied empirically, untraded interdependencies, such as
shared – and often specialized – labour markets, connected with widespread knowledge about
the production in the local society, usually appear to be more important than the direct rela-
http://rcin.org.pl

28 Sven Illeris
tions between the fi rms. The development of the Herning district, as described in this paper,
confi rms this proposition.
Even if fi rms in industrial districts have local networks, they usually have a strong interna-
tional orientation, an aspect which the theories have not paid much attention to. The cluster
fi rms often export most of their products and import most of their inputs, including their infor-
mation. Andersen, Boellingtoft & Christensen (2006) convincingly argue that cluster relations
increasingly are substituted by international relations, which to some degree pull the carpet
from under a cluster-based regional policy.
On the whole cluster theory, tends to be static, and much of the cluster research has been
slow to recognize that the increasing globalisation after 1990 changes the rules of the game.
Even if it is true that tacit knowledge, networks and fl exible cooperation are unique resources
of clusters, which reinforce their position in the international competition, there are many
other factors, which infl uence the outcome of the competition. For products with a low or
medium degree of sophistication, globalisation has made it possible for cost differences – in
particular wage levels – to come through as much more important factors than the special
cluster resources. On the other hand, for highly sophisticated products quality, and innovation
are decisive, and clusters do not have any monopoly of these factors.
One of the most important critiques, that has been raised against the Porter-inspired clus-
ter research is that it virtually always ignores the socio-cultural aspects of the phenomenon.
Even some works in the industrial district tradition are exclusively economic. But, network-
ing between fi rms does not happen independently of the social and cultural characteristics of
the local society. The story of the Herning district strongly supports this critique: The over-
coming of the general West European textile and clothing decline after WWII as well as
the ways to meet the challenges after 1990 primarily depended on entrepreneurship, innova-
tion and social capital (as well as on the qualities of the local labour force).
As shown in fi gure 4, socio-cultural characteristics do usually not exclusively depend on
close geographical proximity. The characteristics are often to be found in broader regions,
such as much of the so-called Third Italy, or in western Jutland. It may, thus be argued that
cluster characteristics only constitute a necessary, not a suffi cient condition for an area to be
a cluster. However, proximity undoubtedly creates an environment where characteristics as
entrepreneurship, innovativeness, openness, trust, motivation and cooperation are better de-
ployed than in environments where potential agents are few and separated by long distances.
The characteristics require a critical mass to become activated.
On the other hand, it could be argued that not all clusters consist of related fi rms with
much interaction. The South Swedish Smaaland area is known in Sweden because of the entre-
preneurial spirit characterising the area, the “Gnosjö-spirit”, but is composed of small and
medium enterprises belonging to different sectors, which seem only to have limited direct
relations. The current diversifi cation in the Herning district clearly takes it in the same direc-
tion. Some would argue that these areas are not clusters, but people living in them have a clear
recognition of the cluster identity.
Returning to the important question why clusters prevail in some regions and not in others,
we can only hint that the historical background seems to be very important. Clusters have deve-
loped on the bases of local initiatives and local capital, in other words they are endogenous to
their areas. On the one hand, we observe that industrial districts have not emerged in the South
http://rcin.org.pl

29Clusters in an Age of Increasing Internationalisation ...
Italian regions with strong feudal traditions, nor in old industrial and mining regions, where
social norms are against new initiatives and where labour skills are antiquated, such as
the North East of England. On the other hand, in western Jutland feudalism has been weak,
and in the „Third Italy” the American political scientist Putnam (1993) who studied regional
differences found a political history background of bottom-up, cooperating institutions.
Other theory components, which may fruitfully be drawn into the understanding of the clus-
ter phenomenon, may come from the research on social capital and trust. The creation and
stability of co-operation depends on the trust between the partners. Hence, it is of decisive im-
portance that the social norms and institutions of the area include a high degree of trust, and
that there are social networks – for instance religious or political organisations – where the part-
ners meet each other in other contexts than business. „Social capital” therefore accumulates.
Still other components have been fetched from the study of openness, of learning and
of innovation. Bathelt, Malmberg & Maskell (2004) write that it is as if the recognition that
openness, export orientation, global “pipelines of information” are decisive qualities has
been forgotten in the recent cluster literature. In the earlier literature on industrial districts,
it is stressed that in them, a spirit of openness towards trying something new has also meant
that many actors are anxious to learn. This innovativeness is typically, not based on the R&D
departments of large corporations, but rather on daily shop-fl oor co-operation to fi nd solu-
tions to small and large problems.
CONCLUSIONS AS REGARDS CLUSTERS AS A REGIONAL POLICY TOOL
Being a well-known and well-writing economist, Porter succeeded where generations of
scholars studying regional development had failed, namely to penetrate the barrier between
theorists and practical policy-makers. After some years, many national governments and
international organisations adopted cluster-building as a miracle-solution to the diffi cult task
of conducting regional policies.
There is a strong danger that such policies are too naive. Clusters cannot easily be created
from above. As stressed in the above assessment, the industrial district theories point out that
certain attitudes in the local society – entrepreneurial and innovative spirit, trust, co-operation
– are crucial for the good functioning of agglomerations. These characteristics are based on
historical cultural traditions. Hospers (2005) quotes a number of examples of cluster policies,
which have failed because the appropriate regional culture did not exist. Such attitudes are
not there for eternity, but we know little about how they may be infl uenced, and at best this is
a long term endeavour.
One implication from the theoretical literature is that policy should promote untraded
interdependencies between fi rms. This could be done through new business institutions, such
as local business associations, which help in the creation of networks between fi rms and the
development of clusters. The construction of effective support mechanisms, appropriate to the
institutions and clusters of a particular region, implicitly assumes devolution of appropriate
decision-making powers to the regional and local level. Improved cluster theory may inspire
such local hands-on policy measures in a small way, while the belief that a rapid creation of
clusters from above probably is doomed to fail.
http://rcin.org.pl

30 Sven Illeris
REFERENCES
Andersen P.H., Boellingtoft A. and Christensen P.R. (2006) Erhvervsklynger under pres: Glo-
baliseringens indfl ydelse på dynamikken i udvalgte danske erhvervsklynger. Institut for ledelse,
Handelshoejskolen i Aarhus.
Asheim B., Cooke P. and Martin R. (2006) The Rise of the Cluster Concept in Regional Analysis
and Policy: A Critical Assessment, in: Asmeim B., Cooke P. and Martin R. (eds) Clusters and
Regional Development: Critical Refl ections and Explorations,Routledge, London, 1–29.
Bathelt H., Malmberg A. and Maskell P. (2004) Clusters and Knowledge: Local Buzz, Global
Pipelines and the Process of Knowledge Creation, Progress in Human Geography, 28, 31–56.
Becattini G. (1990) The Marshallian Industrial District as a Socio-Economic Notion, in: Pyke F.,
Becattini G. and Sengenberger W. (eds) Industrial Districts and Inter-Firm Cooperation in
Italy, International Institute for Labour Studies, Geneva, 37–51.
Dunford M. (2006) Industrial Districts, Magic Circles, and the Restructuring of the Italian
Textiles and Clothing Chain, Economic Geography, 82, 27–59.
Engelstoft S., Jensen-Butler C., Smith I. & Winther L. (2006) Industrial Clusters in Denmark:
Theory and Empirical Evidence, Papers in Regional Science, 85, 73–97.
Hospers G.-J. (2005) “Best Practices” and the Dilemma of Regional Cluster Policy in Europe,
Tijdschrift voor Economische en Sociale Geografi e, 96, 452–457.
Illeris S. (1992) The Herning-Ikast Textile Industry: An Industrial District in West Jutland,
Entrepreneurship and Regional Development, 4, 73–84.
Illeris S. (2000) Outsourcing of Textile and Clothing Industry from Denmark to Baltic Transition
Countries, in: Owsiński J.W. and Johansson M. (eds) Global-Local Interplay in the Baltic Sea
Region, The Interfaces Institute, Warsaw, 56–68.
Kristensen P.Hull (1992) Industrial Districts in West Jutland, Denmark, in: Pyke F. and Sengen-
berger W. (eds) Industrial Districts and Local Economic Regeneration, Institute for Labour
Studies, Geneva, 122–173.
Marshall A. (1890) Principles of Economics, Macmillan, London.
Olsen K.B., Ibsen R. & Westergaard-Nielsen N. (2004) Does Outsourcing Create Unemploy-
ment? The Case of the Danish Textile and Clothing Industry, Aarhus School of Business.
Oosterhaven J. and Broersma L. (2007) Sector Structure and Cluster Economies: A Decom-
position of Regional Labour Productivity, Regional Studies, 41, 639–659.
Piore M.J. & Sabel C.F. (1984) The Second Industrial Divide, Basic Books, New York.
Porter M. (1990) The Competitive Advantage of Nations, Macmillan, London & Basingstoke.
Porter M. (1998) On Competition, Harvard Business School Press, Boston.
Putnam R., Leonardi R. & Nanetti R. (1993) Making Democracy Work: Civic Traditions in
Modern Italy, Princeton University Press.
Scott, A. (2000) Economic Geography: The Great Half-Century, Cambridge Journal of Eco-
nomics, 24, 483–504.
Storper M. (1997) The Regional World: Territorial Development in a Global Economy, Guilford,
New York.
http://rcin.org.pl

CITY SHRINKING AS A CHALLENGE FOR NEW EU MEMBER STATES –
– LEARNING FROM THE EASTERN GERMAN EXPERIENCE
AGNIESZKA CIEŚLA
Institute for European Urban Studies
Bauhaus University Weimar
Albrecht-Dürer-Str. 2, 99425-Weimar, Germany
e–mail: [email protected]–weimar.de
Abstract. Although contemporary urban development concentrates on the idea
of growth, in Eastern and Central Europe, due to accelerated declining and aging
population, different principles and goals for urban planning should be adapted.
The paper presents the case of Eastern Germany where dramatic decline of towns,
commonly known as shrinking, is highly pronounced. It might be assumed that cer-
tain processes like intensive out-migration despite large scale of investments known
from Eastern Germany will similarly take place in Poland. As a matter of the fact,
there are already signs of the demographic decline of Polish towns as in case of Up-
per Silesian Agglomeration. Therefore, it is important to analyse the development
of the Eastern Germany and draw conclusions for other post socialist countries.
Key words: birth rate, out-migration, shrinking city, land consumption, European
integration, Central and Eastern Europe
INTRODUCTION
Contemporary discussion on urban development concentrates on the growth. A newly
published report, prepared by United Nations entitled: “State of world population,
unleashing the potential of Urban Growth”, states that in 2008 for the fi rst time in history
half of the global population will be living in cities. 21st century has been announced to be
time of a rapid growth of cities and managing urban growth has become one of the most
important challenges (UN 2007). In 2030, the number of urban dwellers might reach
5 billion, which means more than 60% of the total population. However, the growth
of cities will not proceed with the same intensity all over the world. The most affected
by this process areas, will be developing regions, mostly in Asia and Africa whereas
Europe will face stabilization of its urban population development.
EUROPA XXI2007, 16: 31-38
http://rcin.org.pl
32 Agnieszka Cieśla
Even 60% of the growth of the number of urban dwellers is due to a birth rate and mere-
ly 40%, is made up by migratory movements and reclassifi cation processes. However, an ongo-
ing urbanisation process will be contributing to decrease of birth rate (UN 2007).
Although the world population is expected to reach in 2042 9 billion, (UN 2007a) its annual
changes have been already decreasing since the beginning of the 1990s. Various demographic
studies imply a reduction of the population growth rate or even forecast stabilization of this
development by the end of the 21st century.
Europe, with its high urbanization level, is a forerunner of the ongoing demographic
processes. The number of born children has dropped considerably in recent years in most
of the European countries. The situation is particularly diffi cult in countries of a for-
mer socialistic block. These countries undergo complex changes caused by a rapidly aging
population and an incomplete system transformation (World Bank 2006). It is assumed by
the UN Projection (middle variant) that this region (including 8 countries: Czech Republic,
Estonia, Hungary, Latvia, Lithuania, Poland, Slovak Republic and Slovenia) may lose until
2050 18% of its current population (Kupiszewski et al. 2006).
This demographic development, might be exacerbated by a high out–migration, which ap-
peared after the accession of Central European countries into the European Union. However,
due to a lack of exact data on the migration scale its infl uence on the future demographic
development cannot be proved.
The impact of the demographic development is already visible in European cities
and towns. According to “State of European cities report” cities in time 1996 – 2001 were
not developing in the same pace. They were classifi ed into three groups. In a given peri-
od of time 1/3 of European cities experienced a visible yet not intense population growth.
The majority of these cities were located in the southern Europe, mainly Spain and Greece;
some of them were identifi ed in Ireland and Finland. 1/3 of the cities had a stable number of
their population and the rest of towns noticed a remarkable decline in their population. These
cities are mostly to be found in Central and Eastern Europe.
Thus, process of urban depopulation is undergoing faster in the former socialistic block
than in the western part of Europe, which does not need to deal with transformation proc-
esses.
Current research on urban trajectories in Eastern Europe suggests that in cities, which were
not affected by such processes as Europeanization and globalisation the depopulation was less
severe than in those were these processes occurred (Mykhnenko and Turok 2007). In other
words, the city growth and the level of integration with the West may be negatively related.
DEFINITION OF A SHRINKING PROCESS
Shrinking does not merely mean depopulation. It rather describes a process, which is com-
posed of several factors. These are: general decline of birth rate, out–migration, grow-
ing unemployment rate, decreasing economic potential. Therefore, a shrinking city, would
be defi ned, as a city with a decreasing population and arousing from that decreasing
economic activity (Oswalt et al. 2004).
Shrinking is a self–fuelling process. People who tend to leave a given town are mostly
http://rcin.org.pl

33City shrinking as a challenge for new EU Member States ...
young and rather well educated. The town becomes less attractive for the potential investors
who choose other locations for their investments in rather “growing” areas. As a consequence
the economic condition of a shrinking town worsens and more people leave it.
Some research studies are attempts to present the process as existing in history since
a very long time (Oswalt et al. 2004). However, contemporary shrinking is unprecedented.
Never in the past, in time of relative prosperity and peace urban areas were losing so many
inhabitants. The most spectacular example of a shrinking process is the area of Eastern Ger-
many, which lost in only 15 years 1.5 million inhabitants.
The purpose of this paper is to present a process of shrinking in Eastern Germany after
1990. The main question posed is whether, there are some analogies between the proces-
ses, which took place in a former GDR and Poland after 2004.
THE CASE OF EASTERN GERMANYAfter reunifi cation of Germany in October 1990 area of a former GDR was subject to intense
investments. Large monetary transfers from the West were aimed at reduction of differences
in development levels in the country. A programme “Aufbau Ost” launched in 1990 had ini-
tially (until 2004) the budget of 94.5 billion Euro. It was used to fi nance urban revitalization,
redevelopment of hazardous waste sites and support for industrial centres. Additional funds
of 64 billion Euro were provided for infrastructure development, which included construction
of new roads’ and rail routes. Moreover, the eastern German communes had the opportunity
to obtain a fi nancial support from EU.
Shortly after the fall of the wall a huge wave of out–migration from eastern German
states to the western part of the country took place. Only in year 1990 the former GDR
was left by almost 400 000 citizens (RK 2000). Since then the situation seemed to stabi-
lize and the area noticed even a slight infl ow of new inhabitants from the west. However,
since 1997 the out–migration has started again to prevail and has been more and more
intense. This negative development took place despite a visible construction and prop-
erty boom. Between 1990 and 2005 almost 1.5 million people (8%) left the area of former
GDR. Those who left the eastern German States after 1997 were to great extend persons
of the age 18–30 years, a majority of them being women. Their emigration had a nega-
tive impact on the demographic development. The birth rate dropped beneath the level
in the western Germany and the eastern German population started to age very fast.
It is estimated that until 2050, the area may lose 30% of the population number from 2002
(BBR 2005).
This outfl ow resulted in a deep crisis of eastern German cities, which have started
a “struggle for survival”. There are cities, which were left in only 15 years by almost 1/3
of their population. Losses of 20% are not rare. In many cases, a high decline of inhabit-
ant number has hidden by the fact that the towns incorporated surrounding communes in
the 1990s (BVBW 2003b). As a result, the loss of inhabitants statistically seems to be not as
severe as in reality. It is worth mentioning that towns with population decrease lower than 3%
are described as having a stable number of inhabitants (MV MVBL 2006).
The reason for dramatically decreasing number of inhabitants has been not only
an intensive migration from former GDR to the western part of Germany, but also
a strong suburbanization. This process was supported by subventions of the German state
http://rcin.org.pl

34 Agnieszka Cieśla
(Eigenheimzulage) for accommodation property until 2006. Only in 2004 year the Ger-
man State spent 11.4 billion Euro on this purpose. Moreover, the commuting is still be-
ing supported in form of a tax exemption (Pendlerpauschale). As EEA Report points
out the scale of suburbanization in the 1990s in the eastern Germany was much greater
than in Poland and Czech Republic (EEA Report 2006). The city of Leipzig was left be-
tween 1993–2001 by 37 000 people who moved to the neighbouring districts (Oswalt et al.
2004). However, the mentioned state incentives for building own house were not the only
reason for suburbanization process. It was also the insuffi cient supply of quality hous-
ing in the city centres. As a result, the rents in city centre could not compete with those in
the suburbs (Oswalt et al. 2004).
The lack of decent housing in inner city was, due to the fact that, in socialism there was no
effi cient policy aimed to restore and maintain historic residential structures. Although after
reunifi cation high funds were spent for the inner city regeneration, renovation of the dilapi-
dated city centres was time consuming. As a consequence in many cases these areas, with pre –
– war structure, were depopulating faster than the prefabricated estates (BVBW 2003b)
Nevertheless, the suburbanization has reached its peak point around a year 2000. Now
the re–urbanisation starts to get stronger in the urban development of Eastern Germany
(Siedentop and Wiechmann 2007; MV MVBL 2006).
Former GDR had quite a different residential situation than other post–socialist
countries. There was no housing shortage. Already in 1990 there were 300 000 unoc-
cupied fl ats in the eastern Germany. In time 1990–2004 1 million new fl ats were built,
of which 400 000 family houses. Due to this high investment level in housing market
and parallel intensive out – migration the number of vacant dwellings reached in 2004
1.3 million (Oswalt et al 2004).
The increasing number of vacant residential units made the problem of depopula-
tion became visible. This is the reason why at the end of the 1990s a wide discussion about
the depopulation problem arose. The phenomenon of abandoned fl ats fuelled a fur-
ther depopulation. The settlements with many empty fl ats have been gaining an ill repute.
This made even more people leave. The process affected not only prefabricated estates in
the town periphery, but also pre–war inner city areas, which in socialism were neglected and
were in a bad condition. In many cases (e.g. Wittenberge) the number of vacant dwellings in
the centre is twice as much as in the prefabricated estates.
The percentage of unoccupied housing units in numerous towns is very high. Already in
year 2001 in cities like Chemnitz and Magdeburg more than 20% of the housing units stood
empty (BVBW 2003). In order to counteract a growing number of vacant buildings as well as to
improve the image of depopulating towns the German Government launched in 2001 program
“Stadtumbau Ost”. It will be held until year 2009 and it has a budget of 2.7 billion Euro. So far
under the program 190 000 fl ats were demolished (Liebmann 2007).
SPATIAL CONSEQUENCES OF DEPOPULATION IN EASTERN GERMANY
Contrary to the expectations a shrinking town does not contract but it expands.
In other words, less and less people use more and more space. Shrinking city is than quite
http://rcin.org.pl

35City shrinking as a challenge for new EU Member States ...
peculiar and misleading description, which corresponds only with a diminishing population.
In spite of this fact, it has been adopted by the contemporary urban studies.
In Germany, between 1996 and 2000 the land consumption, including settlement and traf-
fi c area, grew intensively. In 2000 it accounted to 129 ha/day, in the eastern part it reached 40
ha/day (BBR 2005). In 2003 the land consumption decreased to 93 ha/day and it is intended to
keep this tendency in order to reach the level of 30 ha/day in 2020 (Cieśla and Genske 2006).
So far, this reduction has been achieved through an abruptly diminished construction in
a housing sector (BBR 2005).
In one of the Eastern German States, Thuringia which lost between 1989–2004
328 000 (–12.2%) citizens, the amount of developed land (settlements and traffi c areas)
increased between 1993–2001 by 11.2% (Cieśla and Genske 2007).
Urban sprawl propelled to a great extend the increase of land consumption in the Eas-tern
Germany. Due to relatively low land prices, the lots were greater than in the western part of
the country (BBR 2005). Consequently, the same number of detached houses in the eastern
Germany took more space than that in the west.
After the reunifi cation the public infrastructure needed improvement. New highways and
road connections took large parts of the agricultural areas. At the same time expanding settle-
ments, thou with decreasing inhabitants’ number required even more traffi c connections. It is
interesting to point out that despite a decreasing population the number of cars is expected to
rise in the next years (BBR 2004).
Another factor stimulating land consumption in a former GDR are the investments
grounds. German Communes in the East were encouraged to settle “industrial parks” which
were to attract investments. However, due to a large number of such prepared sites and insuf-
fi cient number of coming investors, most of these parks stay today in a large part empty and
they are ironically called “illuminated meadows” (Oswalt et al. 2004).
Parallel, there became a lot of abandoned areas as a consequence of depopulation. These
were, as already mentioned, residential areas, both in socialistic settlements as well as in pre
–war inner city parts. Another type of a derelict land are industrial wastelands, which were left
by ineffi cient socialistic industry and former soviet army military bases.
As a response to the growing land use not only in the Eastern part, but in the whole Ger-
many the Government decided to support the idea of land recycling – the reusing of once used
area, or remediation of already used. Due to a lack of investors, willing to take such derelict
lands the state is responsible for their remediation.
SITUATION IN POLAND
Polish population has been decreasing for the last 10 years. In this period it declined by
170 000 persons. This loss is mainly caused by a low birth rate. It reached its lowest level in
2003. Despite a slight increase since then, in 2006 it was the lowest in European Union.
The accession of Poland to the European Union and a gradual job markets opening in
several western countries led to a high out – migration of mostly young and well educated
people. It is estimated that between 2004–2006 almost 2 million left Poland (GUS 2007).
According to the data presented by GUS the western voivodships: śląskie, lubuskie and opol-
http://rcin.org.pl

36 Agnieszka Cieśla
skie have noticed the highest levels of out – migration.
Since the phenomenon is at an early stage, any projection of potential come back of
the emigrants is not possible. It is quite likely however that the out–migration is going to affect
the urban development in Poland and needs a thorough research.
The number of urban dwellers in Poland has been slightly decreasing since 1998. So far
the depopulation process of Polish cities has not reached the Eastern Germany level and it is
less noticeable in the space. This is caused by the fact that Poland has the lowest number of
fl ats per 1000 inhabitants among other European countries. As a result vacant buildings can
be hardly found. Additionally, there exists a high shortage on dwellings, which is roughly esti-
mated for about 1.5 million units. Judging from an insuffi cient construction pace and a grow-
ing number of households this shortage will not be reduced in the near future.
The demographic development of a post–socialist town is largely shaped by de–indus-
trialisation processes. They are highly pronounced in a Polish industrial region Upper Sile-
sian Agglomeration, consisting of 19 towns with 2.2 million citizens in total. At the begin-
ning of the 1990s the economic condition of the towns seemed to be hopeless. Closing down of
numerous coal mines led to a high unemployment rate, which in many towns reached the level
well above 20%. In time 1995–2005 the Agglomeration lost 7.3 % of their citizens. The high-
est losses occurred in Ruda Śląska (11.6%) and in Piekary Śląskie (10.9 %). Even Katowice,
a town with a strong economy and a very low unemployment rate lost in that time almost 10%
of its population.
At least in an initial phase of deindustrialisation it was the outfl ow of mining industry
workers, which contributed greatly to the depopulation in the area. Numerous coal miners,
were forced to go on an earlier retirement. They were coming back to the regions where they
came from during the time of Silesia’s prosperity. Nowadays, however there is obser-ved
a growing willingness to leave the region by the young. In the age group up to 29 years the per-
centage of those intending to leave is particularly high and amounts to 21% (BCMM 2006).
This negative development takes place despite gradually improving economic situation
partly due to growing number of foreign investments. The area is being described by consul-
tancy experts as the most attractive for the industrial investment among other Polish regions
(IBnGR 2006). Taking the above into consideration the Upper Silesian Agglomeration cannot
be classifi ed as a shrinking area.
Admittedly, it is unknown whether in long term perspective the ongoing outfl ow of
inhabitants will negatively infl uence the economic growth of the Agglomeration. According to
the demographic projection prepared by GUS in 2004, Katowice may lose until 2030 23% of its
population from 2005. There is already reported lack of skilled workers for the newly created
factories, and even coal mines have diffi culties with fi nding workers.
Parallel, similar spatial phenomena as in Eastern Germany are taking place. In spite of
a decreasing population the land consumption rises. It is mainly caused by the new invest-
ments in Upper Silesia (e.g. whole Special Economic Zone) which are in majority green fi eld
type projects. Due to high costs and time demand brown fi elds regeneration is hardly imple-
mented. New roads and highway connections, which are under construction, contribute to
the considerable increase of the land use. Nevertheless suburbanization of the Agglomeration
has relatively low intensity, and cannot be regarded as a crucial factor in land consumption
process (Cieśla and Koch 2007).
http://rcin.org.pl

37City shrinking as a challenge for new EU Member States ...
CONCLUSIONS
Integration with the West has highly infl uenced the population distribution and space pro-
duction in former GDR. In 2004, Poland entered the EU structures. To a certain extend
the processes proceeding recently in Poland are similar to that which occurred in Germany.
A high level of out–migration, the construction and property boom have a lot in common in
both countries. Therefore, the European integration process of Eastern Germany is worth
analyzing for the countries of Central Europe. Especially dramatic decline of the German
magnifi cent towns should be treated with special attention.
It is very important for Poland and other new Member States to learn from the East-
ern Germany experiences. A matter of concern in the Eastern Germany was the con-
struction boom far beyond real needs. The economic growth was to be kept at all cost,
despite known, negative demographic trends. First, after the turn of the millennium
the prior-ities of spatial planning changed. Nowadays, it is not any more about the stimulation
of the growth, but how to counteract the economic and demographic decline. Another prob-
lem was the high consumption of green fi eld areas and neglect of the brown fi elds. According
to the studies conducted in Eastern German States the communities have not succeeded in
convincing investors to reuse the abandoned grounds (Cieśla and Genske 2007). Therefore,
the land consumption rose considerably despite decreasing population.
Historically, the economic growth of cities was fundamentally linked to increasing popu-
lation. Nowadays, the challenge of managing urban growth, due to expected growth of cities
worldwide has received priority. However, in Central and Eastern Europe, which faces demo-
graphic decline different goals for urban planning should be adapted. New planning principles
and measures should be developed in order to keep the economic growth and parallel deal with
demographic matters such as intensively decreasing and aging population. In other words, they
should be aimed at avoiding the shrinking phenomena.
REFERENCES
BBR (2004) Herausforderungen des demographischen Wandels für die Raumentwicklung in
Deutschland.
BBR (2005) Raumordnungsbericht 2005, Selbstverlag des Bundesamtes, Bonn.
BCMM (2006) Podstawy mieszkańców Śląska wobec emigracji zarobkowej, raport z badania
marketingowego.
BVBW (2003) Auswertung des Bundeswettbewerbs „Stadtumbau Ost“ – für lebenswerte
Städte und attraktives Wohnen, Mind Spring, Leipzig.
BVBW (2003a) Dokumentation zum Bundeswettbewerb „Stadtumbau Ost“ – für leben-swerte
Städte und attraktives Wohnen.
BVBW (2003b) Dokumentation zum Bundeswettbewerb „Stadtumbau Ost“ – für leben-swerte
Städte und attraktives Wohnen.
Cieśla A. and Genske D.D. (2006) Shrinking phenomena and sustainable land management
in Germany and Poland, in: Od terenów przemysłowych do…, Wydawnictwo PK, Kraków,
209–221.
http://rcin.org.pl
38 Agnieszka Cieśla
Cieśla A. and Genske D.D. (2007) Depopulation and land consumption in two model regions:
The Upper Silesian Agglomeration and Northern Thuringia, in: Rewitalizacja miast poprzez
regenerację terenów poprzemysłowych: innowacja i dobra praktyka, Wydawnictwo PK,
Kraków, 227–233.
Cieśla A. and Koch F. (2007) Transformationsprozess und heterogene Raumentwicklung in
Polen, Entwicklungsperspektiven am Beispiel des Oberschlesischen Industriegebiets und
Warschaus, RaumPlanung, 132, 3, 161–168.
EC (2007) State of European Cities Report. Adding value to the European Urban Audit.
EEA Report (2006) Urban sprawl in Europe. The ignored challenge.
GUS (2007) Informacja o rozmiarach i kierunkach emigracji z Polski w latach 2004–2006.
IBnGR (2006) Atrakcyjność inwestycyjna województw i podregionów Polski, Gdańsk.
Kupiszewski M., Bijak J. and Nowok B. (2006) Impact of future demographic changes
in Europe, Working Paper, 6.
Liebmann H. (2007) Fünf Jahre „Stadtumbau Ost“, Eine Zwischenbilanz des Bund–Länder–
Programms, RaumPlanung, 132, 3, 131–136.
MV MVBL (2006) Stadtumbau–Infonetzwerk in Mecklenburg–Vorpommern, Auswertung
Monitoring–Berichte.
Mykhnenko V. and Turok I. (2007) Shrinking Cities: East European Urban Trajectories
1960–2005, Working Paper, 4.
Oswalt P. ed. (2004) Schrumpfende Städte, Hatje Cantz Verlag.
RK (2000) Bericht der Regierungskommision Wohnungswirtschaftlicher Strukturwandel in
den neuen Bundesländer.
Siedentop S. and Wiechmann T. (2007) Zwischen Schrumpfung und Reurbanisierung. Stadten-
twicklung in Dresden seit 1990, RaumPlanung, 131, 57–62.
UN (2007) State of the world population 2007, unleashing the potential of urban growth.
UN (2007a) World Population Prospects. The 2006 Revision.
Werz N. (2001) Abwanderung aus den neuen Bundesländern von 1989 bis 2000,
www.bpb.de/publikationen.
World Bank (2006) From red to grey, the “Third Transition” of Aging Populations in Eastern
Europe and the former Soviet Union.
www.bundesregierung.de
www.stat.gov.pl
http://rcin.org.pl

WARSAW, PRAGUE, BUDAPEST – METROPOLITAN
FUNCTIONS COMPARISON
KATARZYNA A. KUĆ-CZAJKOWSKA
Faculty of Political Science
Maria Curie-Skłodowska University
Plac Litewski 3, 20-080 Lublin
e-mail: [email protected]
Abstract. The idea of the paper refers to the comparison of functions, which
determine an international position of Warsaw, Prague and Budapest. It is also
an attempt to evaluate the chances of these three cities to win and develop
individual metropolitan functions in the future. At the same time, this paper aims
at identifying the main factors, both obscuring and supporting the development of
metropolitan functions of cities under analysis. The author recognizes the following
reasons of CEE metropolises development – a signifi cant change of geopolitical
position, due to socio-economic transformation, a membership of Poland, Czech
Republic and Hungary in the structure of EU, globalization and civilization of
information technology.
Key words: metropolises, metropolitan functions, CEE capitals
INTRODUCTION
The main idea of this paper refers to the comparison of functions, which determine an interna-
tional position of Warsaw, Prague and Budapest. It is also an attempt to evaluate the chances
of these three cities to win and develop individual metropolitan functions in the future.
At the same time, this paper aims at identifying the main factors, both obscuring and suppor-
ting the development of metropolitan functions of Warsaw, Prague and Budapest. The author
recognizes the following reasons of CEE metropolises development – a signifi cant change of
geopolitical position, due to socio-economic transformation, a membership of Poland, Czech
Republic and Hungary in the structure of EU, globalization and civilization of information
technology.
EUROPA XXI2007, 16: 39-62
http://rcin.org.pl
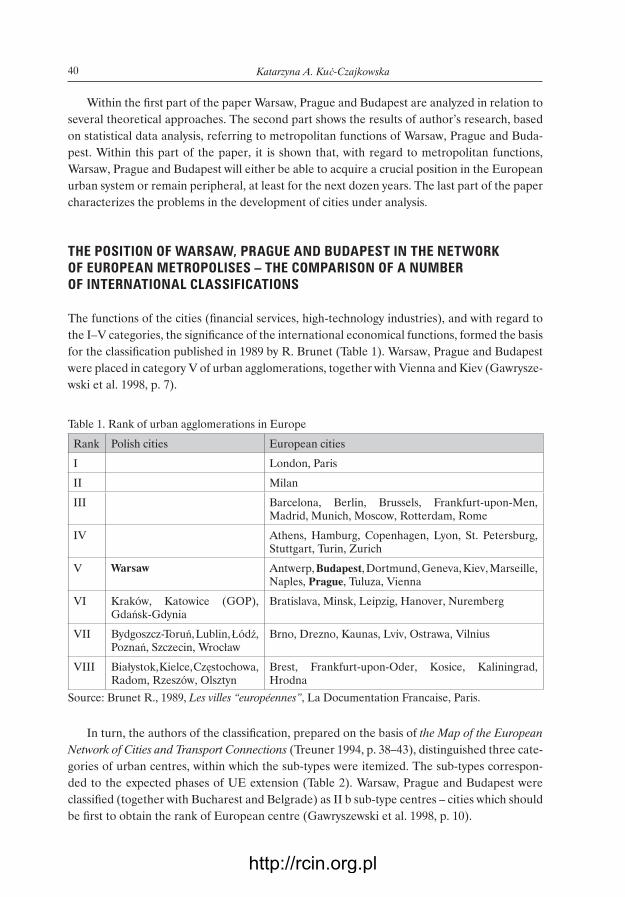
40 Katarzyna A. Kuć-Czajkowska
Within the fi rst part of the paper Warsaw, Prague and Budapest are analyzed in relation to
several theoretical approaches. The second part shows the results of author’s research, based
on statistical data analysis, referring to metropolitan functions of Warsaw, Prague and Buda-
pest. Within this part of the paper, it is shown that, with regard to metropolitan functions,
Warsaw, Prague and Budapest will either be able to acquire a crucial position in the European
urban system or remain peripheral, at least for the next dozen years. The last part of the paper
characterizes the problems in the development of cities under analysis.
THE POSITION OF WARSAW, PRAGUE AND BUDAPEST IN THE NETWORK OF EUROPEAN METROPOLISES – THE COMPARISON OF A NUMBER OF INTERNATIONAL CLASSIFICATIONS
The functions of the cities (fi nancial services, high-technology industries), and with regard to
the I–V categories, the signifi cance of the international economical functions, formed the basis
for the classifi cation published in 1989 by R. Brunet (Table 1). Warsaw, Prague and Budapest
were placed in category V of urban agglomerations, together with Vienna and Kiev (Gawrysze-
wski et al. 1998, p. 7).
Table 1. Rank of urban agglomerations in Europe
Rank Polish cities European cities
I London, Paris
II Milan
III Barcelona, Berlin, Brussels, Frankfurt-upon-Men, Madrid, Munich, Moscow, Rotterdam, Rome
IV Athens, Hamburg, Copenhagen, Lyon, St. Petersburg, Stuttgart, Turin, Zurich
V Warsaw Antwerp, Budapest, Dortmund, Geneva, Kiev, Marseille, Naples, Prague, Tuluza, Vienna
VI Kraków, Katowice (GOP), Gdańsk-Gdynia
Bratislava, Minsk, Leipzig, Hanover, Nuremberg
VII Bydgoszcz-Toruń, Lublin, Łódź, Poznań, Szczecin, Wrocław
Brno, Drezno, Kaunas, Lviv, Ostrawa, Vilnius
VIII Białystok, Kielce, Częstochowa, Radom, Rzeszów, Olsztyn
Brest, Frankfurt-upon-Oder, Kosice, Kaliningrad, Hrodna
Source: Brunet R., 1989, Les villes “européennes”, La Documentation Francaise, Paris.
In turn, the authors of the classifi cation, prepared on the basis of the Map of the European
Network of Cities and Transport Connections (Treuner 1994, p. 38–43), distinguished three cate-
gories of urban centres, within which the sub-types were itemized. The sub-types correspon-
ded to the expected phases of UE extension (Table 2). Warsaw, Prague and Budapest were
classifi ed (together with Bucharest and Belgrade) as II b sub-type centres – cities which should
be fi rst to obtain the rank of European centre (Gawryszewski et al. 1998, p. 10).
http://rcin.org.pl
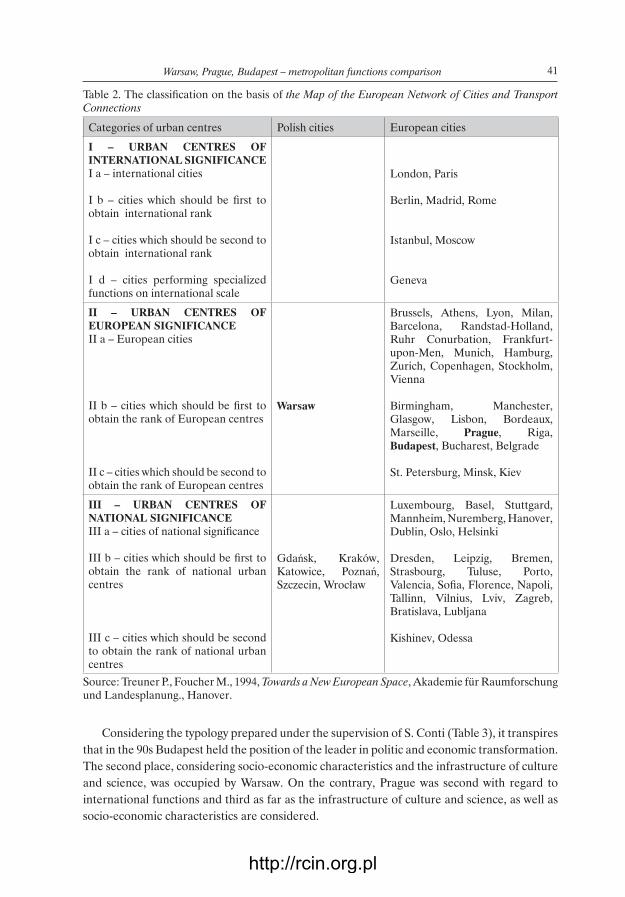
41Warsaw, Prague, Budapest – metropolitan functions comparison
Table 2. The classifi cation on the basis of the Map of the European Network of Cities and Transport Connections
Categories of urban centres Polish cities European cities
I – URBAN CENTRES OF INTERNATIONAL SIGNIFICANCEI a – international cities
I b – cities which should be fi rst to obtain international rank
I c – cities which should be second to obtain international rank
I d – cities performing specialized functions on international scale
London, Paris
Berlin, Madrid, Rome
Istanbul, Moscow
Geneva
II – URBAN CENTRES OF EUROPEAN SIGNIFICANCEII a – European cities
II b – cities which should be fi rst to obtain the rank of European centres
II c – cities which should be second to obtain the rank of European centres
Warsaw
Brussels, Athens, Lyon, Milan, Barcelona, Randstad-Holland, Ruhr Conurbation, Frankfurt-upon-Men, Munich, Hamburg, Zurich, Copenhagen, Stockholm, Vienna
Birmingham, Manchester, Glasgow, Lisbon, Bordeaux, Marseille, Prague, Riga, Budapest, Bucharest, Belgrade
St. Petersburg, Minsk, Kiev
III – URBAN CENTRES OF NATIONAL SIGNIFICANCEIII a – cities of national signifi cance
III b – cities which should be fi rst to obtain the rank of national urban centres
III c – cities which should be second to obtain the rank of national urban centres
Gdańsk, Kraków, Katowice, Poznań, Szczecin, Wrocław
Luxembourg, Basel, Stuttgard, Mannheim, Nuremberg, Hanover, Dublin, Oslo, Helsinki
Dresden, Leipzig, Bremen, Strasbourg, Tuluse, Porto, Valencia, Sofi a, Florence, Napoli, Tallinn, Vilnius, Lviv, Zagreb, Bratislava, Lubljana
Kishinev, Odessa
Source: Treuner P., Foucher M., 1994, Towards a New European Space, Akademie für Raumforschung und Landesplanung., Hanover.
Considering the typology prepared under the supervision of S. Conti (Table 3), it transpires
that in the 90s Budapest held the position of the leader in politic and economic transformation.
The second place, considering socio-economic characteristics and the infrastructure of culture
and science, was occupied by Warsaw. On the contrary, Prague was second with regard to
international functions and third as far as the infrastructure of culture and science, as well as
socio-economic characteristics are considered.
http://rcin.org.pl

42 Katarzyna A. Kuć-Czajkowska
Table 3. Transformation of big cities in CEE countries
International functions: foreign students, foreign insurance companies, foreign banks, international trade markets, foreigners, foreign air companies, fl ights and passengers, international fl ights
Socio-economic characteristics: increase in the number of population in the period from 1980 to 1990, density of population, unemployment, underground network, taxis, total number of people professionally active, number of people professionally active in industry, services and transport
Infrastructure of culture and science: number of museums, average number of museum visitors, number of theatres, number of theatre performances, science and research workers, university students
1. Budapest2. Prague3. Warsaw
1. Budapest2. Warsaw3. Prague
1. Budapest2. Warsaw3. Prague
Source: Bonavero P., Conti S., 1996, New Technological Paradigm. Urban Identity and Metropolitan Networks in Europe, in: Pumain D., Saint-Julien T. (eds), Urban Networks in Europe, John Libbey,
Paris, 47–65.
In the European cities typology from 1999 (Table 4), B. Jałowiecki classifi ed the three cities
under analysis to the lowest group – the group of regional metropolises with the preponder-
ance of national functions. It should also be remarked that both Prague and Budapest were put
into the group of metropolises of type D, characteristic of partially developed metropolitan
services and international functions, as well as partial availability. In contrast, Warsaw was
classifi ed to the lowest group E of the cities, characteristic of poorly developed metropolitan
services and international functions, as well as unsatisfactory availability. One should agree
with S. Furman (2000, p. 440) that the capital of Poland was evaluated “too critically” and,
in fact, all metropolitan characteristic features can be found in this agglomeration but they are
indeed poorly developed.
The overview of international typologies of cities leads to the following observations.
1. The presented classifi cations differ in the criteria forming the basis to make a division of
cities set and attribute a particular city to a given category. The defi nition of the co-called
city profi le may include: 1) type of performed functions (e.g. traditional industry or industry
based on new technologies, trade, transport, distribution, fi nancial service, business,
administration, education, research and development, culture and tourism) and the scope of
their impact (international, European, supranational); 2) city size; 3) geographical position
(Korcelli-Olejniczak 2004, p.79).
2. The position of Warsaw, Prague and Budapest in metropolises set is characterized by means
of various demographic, social and economic rates. Data comparison and lowering or rais-
ing the actual position of the cities prove to be a crucial problem. E.g. the classifi cation
from 1989 equates the signifi cance of Warsaw, Prague and Budapest, on the one hand, with
Vienna and, on the other hand, with Kiev. The typology from 1995 defi nes the position of
these three cities as low, as compared to the range of capitals of similar size, such as Vienna.
The authors of this classifi cation equate the signifi cance of Warsaw, Prague and Budapest
with Bucharest and Belgrade. B. Jałowiecki’s classifi cation evaluates the position of Warsaw
too critically, placing it within the lowest metropolitan group.
http://rcin.org.pl
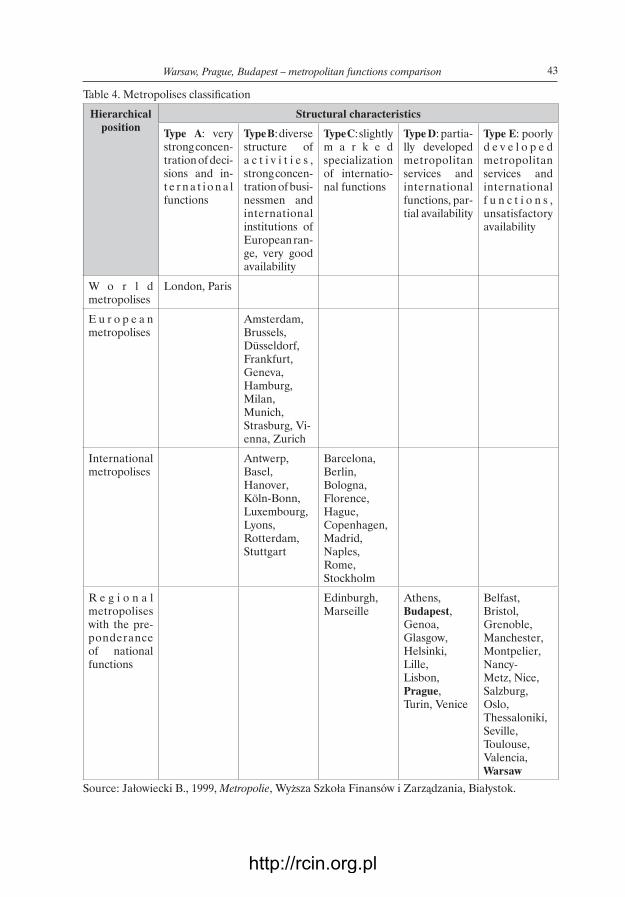
43Warsaw, Prague, Budapest – metropolitan functions comparison
Table 4. Metropolises classifi cation
Hierarchicalposition
Structural characteristics
Type A: very strong concen-tration of deci-sions and in-t e r n a t i o n a l functions
Type B: diverse structure of a c t i v i t i e s , strong concen-tration of busi-nessmen and international institutions of European ran-ge, very good availability
Type C: slightly m a r k e d specialization of internatio-nal functions
Type D: partia-lly developed metropolitan services and international functions, par-tial availability
Type E: poorly d e v e l o p e d metropolitan services and international f u n c t i o n s , unsatisfactory availability
W o r l d metropolises
London, Paris
E u r o p e a n metropolises
Amsterdam, Brussels, Düsseldorf, Frankfurt, Geneva, Hamburg, Milan, Munich, Strasburg, Vi-enna, Zurich
International metropolises
Antwerp, Basel, Hanover, Köln-Bonn, Luxembourg, Lyons, Rotterdam, Stuttgart
Barcelona, Berlin, Bologna, Florence, Hague, Copenhagen, Madrid, Naples, Rome, Stockholm
R e g i o n a l metropolises with the pre-ponderance of national functions
Edinburgh,Marseille
Athens, Budapest, Genoa, Glasgow, Helsinki, Lille, Lisbon, Prague, Turin, Venice
Belfast, Bristol, Grenoble, Manchester, Montpelier, Nancy-Metz, Nice, Salzburg, Oslo, Thessaloniki, Seville, Toulouse, Valencia, Warsaw
Source: Jałowiecki B., 1999, Metropolie, Wyższa Szkoła Finansów i Zarządzania, Białystok.
http://rcin.org.pl

44 Katarzyna A. Kuć-Czajkowska
METROPOLITAN FUNCTIONS
Metropolitan functions should be understood as the functions of II, III and IV sectors, the range
of which is no lesser than national1 (Table 5). These functions may be more or less developed.
They may co-occur with different intensity and in different time. The functions that were charac-
teristic of industrial economy are different from the ones that are found in the period of evolu-
tion towards the economy based on knowledge, and yet another ones, characterize the eco-
nomy based on knowledge. Metropolitan functions on a national, supranational, European
(continental) or international scale are performed by the entire metropolitan area, not only
by the main city (metropolitan centre). These functions may be located in different parts of
the metropolitan area (Gawryszewski et al. 1998, p. 89).
Table 5. Metropolitan functions – spatial range and types of activity
Spatial range Type of activity (sector)
I(agriculture)
II(industry)
III(services)
IV(higher-level services, eg. educa-tion)
National
R e g i o n a l (supranational)
E u r o p e a n (continental)
Global
Source: prepared by the author on the basis of the book by Korcelli-Olejniczak E., 2004, Funkcje metropolitalne Berlina i Warszawy w latach 1990–2002. Współzależność pozycji w systemie miast
Europy Środkowej, Prace Geografi czne IGiPZ PAN, 198, p. 37.
The subset of metropolitan functions is constituted by capital functions which can only be
located in the capital city (Gawryszewski et al. 1998, p. 112). Such an exclusive location results
from the very character of these functions. All national and administrative authorities have
their offi ces in the capital city, as well as diplomatic representatives, management centres,
branches of transnational companies. It is the nature of the capital to perform a symbolic
and integrative function, to create and spread cultural patterns and to form standards, as well
as a diverse potential in the scope of science and art, rich offer in the scope of culture, trade
and services (Jałowiecki 1989, p. 73). In other words, the catalogue of capital functions with
various intensity co-occur in a group of metropolitan functions. Such an exclusive location
1 The metropolitan infl uence range and the type of performed functions clearly differentiate the cities of national, regional (suprana-tional), continental and global rank. In this hierarchized system, global metropolises perform vital function in the economy and steer the processes of globalization, regulating the global economy. Continental metro-polises (eurometropolises), the international functions of which are not fully diverse, base their development on supra-national connections enabling economy regulation on a continental scale. Regional (supranational) metropolises play a crucial role on the scale of neighbouring countries, they are distinguished by global speciality but are not capable of performing steering and regulatory functions on a broader scale (Jałowiecki 2000, p. 23). Na-tional metropolises perform the functions which, to some extent, have international character and cross national borders (e.g. diplo-matic representatives offi ces).
http://rcin.org.pl
45Warsaw, Prague, Budapest – metropolitan functions comparison
of the subset of metropolitan functions may “help” the city in the development of the group
of metropolitan functions.
Metropolitan functions are mainly the areas of activity of inhabitants. Therefore, in order
to evaluate them, it is necessary to consider the number of population and the level of urbani-
zation of the cities under analysis (Table 6).
Table 6. Total area and population of Warsaw, Prague and Budapest in 2003
City Total area Population (mln)
Population per 1 km²
Contribution of the population of the capital in total number of population (%)
Budapest 525.2 km² 1,70 3274 16.9
Prague 496.2 km² 1,16 2350 11.4
Warsaw 516.9 km² 1,68 3269 4.4
Source: prepared by the author on the basis of Rocznik Statystyczny Warszawy, 2006, GUS, Warszawa,
p. 410–411.
The three characterized cities are of a comparable size. In the case of Budapest and
Warsaw, the number of population is similar and the number of people per one km² is nearly
identical. The phenomenon of a great concentration of population in the capital city is found
in the case of Hungary and Czech Republic: nearly 17 % of the total number of people in
Hungary live in the capital and slightly below 11.4% of population of Czech Republic lives
in Prague. The urbanization level in Poland is one of the lowest, as compared to other cities
under analysis – only 4.4% of population of Poland lives in Warsaw.
THE BUSINESS CENTRE FUNCTIONThe business centre function means the presence of the institutions representing international
corporations centres, companies and transnational branches of companies, the concentration
of business environment institutions: stock markets, banks, consulting, advertisement, and
promotion companies, as well as insurance companies2.
Warsaw, Prague and Budapest, having entered the EU structures, constitute the area
of intensive “penetra-tions” of foreign companies. The proof comes from, e.g. the results of
the European Cities Monitor Report3, in view of which Prague is the most attractive city among
all the analyzed places, as far as business location is concerned. In 2006 it was rated 13th out
of 33 centres under examination. Warsaw, becoming attractive for investors, in the general rat-
ings was promoted to 18th place, whereas 22nd place was occupied by Budapest (Table 7).
The decisions the location of companies depend on various factors. Among the essential
elements for locating business in Warsaw are as follows: cost of staff (1st place in the Report),
value for money of offi ce space (1st place in the Report), offi ce space availability, climate
created by governments, qualifi ed staff, language spoken. In contrast, the strong points of
Prague include: business climate (3rd place in the Report), cost of staff, offi ce space value,
offi ce space availability, access to markets, lack of pollution. With regard to the investments
2 Considering a limited space of this article, the author does not call any statistics comparing the number of consulting, advertisement and promotion companies, banks, etc. in Warsaw, Prague and Budapest.
3 European Cities Monitor Report is a survey which has been carried out annually since 1990 by Cush-man&Wakefi eld Healey&Baker. The analysis is carried out on the basis of interviews with high-rank managers of nearly 500 companies from 9 countries: Belgium, France, Germany, Italy, the Netherlands, Spain, Sweden, Switzer-land, United Kingdom.
http://rcin.org.pl

46 Katarzyna A. Kuć-Czajkowska
Rank City
19904 1998 2002 2003 2004 2005 2006
1. London London London London London London London
2. Paris Paris Paris Paris Paris Paris Paris
3. Frankfurt Frankfurt Frankfurt Frankfurt Frankfurt Frankfurt Frankfurt
4. Brussels Brussels Brussels Brussels Brussels Brussels Barcelona
5. Amsterdam Amsterdam Amsterdam Amsterdam Amsterdam Barcelona Brussels
6. Düsseldorf Barcelona Barcelona Barcelona Barcelona Amsterdam Amsterdam
7. Zurich Madrid Madrid Madrid Madrid Madrid Madrid
8. Geneva Zurich Milan Berlin Munich Berlin Berlin
9. Milan Dublin Berlin Milan Berlin Munich Munich
10. Glasgow Milan Zurich Munich Zurich Zurich Zurich
11. Barcelona Munich Munich Zurich Milan Milan Dublin
12. Munich Berlin Dublin Dublin Dublin Dublin Milan
13. Manchester Geneva Düsseldorf Manchester Prague Prague Prague
14. Hamburg Manchester Stockholm Geneva Manchester Lisbon Düsseldorf
15. Berlin Lisbon Geneva Lisbon Stockholm Manchester Lisbon
16. Lisbon Düsseldorf Prague Düsseldorf Lisbon Düsseldorf Hamburg
17. Madrid Hamburg Lisbon Prague Geneva Stockholm Stockholm
18. Lyons Stockholm Hamburg Stockholm Düsseldorf Geneva Warsaw
19. Stockholm Glasgow Manchester Lyons Hamburg Hamburg Birmingham
20. Vienna Lyons Lyons Hamburg Warsaw Warsaw Geneva
21. Budapest Copenhagen Glasgow Glasgow Lyons Budapest Manchester
22. Athens Vienna Rome Warsaw Vienna Glasgow Budapest
23. Prague Rome Vienna Budapest Budapest Vienna Vienna
24. Moscow Prague Copenhagen Vienna Glasgow Lyons Lyons
25. Warsaw Warsaw Budapest Copenhagen Rome Copenhagen Glasgow
26. Budapest Warsaw Rome Copenhagen Rome Rome
27. Turin Helsinki Oslo Moscow Helsinki Copenhagen
28. Oslo Athens Moscow Helsinki Moscow Leeds
29. Athens Oslo Helsinki Athens Oslo Bucharest
30. Moscow Moscow Athens Oslo Athens Helsinki
31. Moscow
32. Athens
33. Oslo
Source: prepared by the author on the basis of the European Cities Monitor Report 1990, 1998, 2002,
2003, 2004, 2005, 2006, Cush-man&Wakefi eld Healey&Baker, London.
4 In 1990 only 25 cities were included in the survey.
Table 7. Best cities to locate a business
http://rcin.org.pl

47Warsaw, Prague, Budapest – metropolitan functions comparison
Table 8. Detailed ratings – European Cities Monitor Report 2006 for Warsaw, Prague, Budapest
Best cities in terms of Warsaw Prague Budapest
Easy access to markets 19 18 25
Qualifi ed staff 17 23 25
Transport links with other cities and internationally 23 23 28
Qualify of telecommunications 29 26 29
Cost of staff 1 4 3
The climate governments create 4 3 2
Value for money of offi ce space 1 4 6
Availability of offi ce space 7 16 13
Languages spoken 18 24 24
Internal transport 28 23 26
the quality of life for employees 33 25 27
freedom from pollution 26 14 26
Source: prepared by the author on the basis of the European Cities Monitor Report 2006.
in Budapest, businessmen notice the following strong points: business climate (2nd place in
the Report), cost of staff, offi ce space value, offi ce space availability (Table 8).
What are then the crucial factors (assets) that make the international capital “attracted”
to Warsaw, Prague and Budapest, and which ones have a negative impact on the decision con-
cerning company location in these cities?
Low costs of conducting economic activity and especially labour costs in Warsaw, Prague
and Budapest (which are, as compared to other countries in Western Europe, even four or fi ve
time lower) constitute an important factor of investments in Warsaw, Prague and Budapest.
In the European Cities Monitor Report 2006, in terms of workers’ employment, Warsaw was
rated 1st, Budapest 3rd and Prague 4th (Table 8). In addition, the increase in salary rates in
Poland has taken place on an insignifi cant scale. As a result, the salary rates in Czech Republic
or Hungary are higher than in Poland (both in private and production sector) (Table 9).
Table 9. Man-hour costs (€)
Country Private sector Production sector
Poland 5.9 5.2
Hungary 6.7 6.1
Czech Republic 7.4 6.7
United Kingdom 26.5 26.6
Germany 28.7 32
Denmark 33.8 32.3
Source: Eurostat 2007.
Apart from low labour costs, the reason why a number of companies transfer their activity
to Warsaw, Prague and Budapest are low maintenance costs enabling the increase in sales
incomes and decrease in product prices. Living conditions in Poland e.g. are comparable with
http://rcin.org.pl
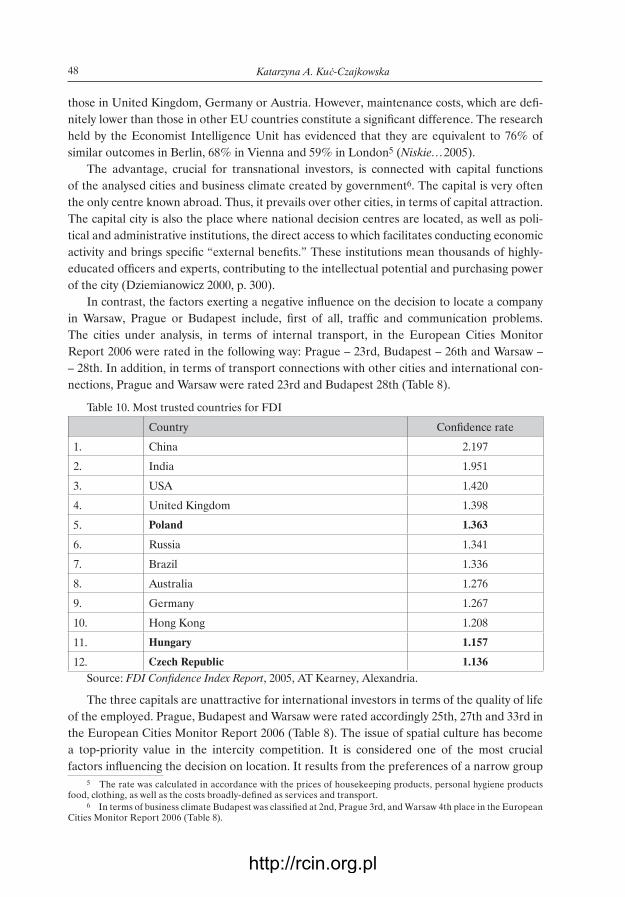
48 Katarzyna A. Kuć-Czajkowska
those in United Kingdom, Germany or Austria. However, maintenance costs, which are defi -
nitely lower than those in other EU countries constitute a signifi cant difference. The research
held by the Economist Intelligence Unit has evidenced that they are equivalent to 76% of
similar outcomes in Berlin, 68% in Vienna and 59% in London5 (Niskie…2005).
The advantage, crucial for transnational investors, is connected with capital functions
of the analysed cities and business climate created by government6. The capital is very often
the only centre known abroad. Thus, it prevails over other cities, in terms of capital attraction.
The capital city is also the place where national decision centres are located, as well as poli-
tical and administrative institutions, the direct access to which facilitates conducting economic
activity and brings specifi c “external benefi ts.” These institutions mean thousands of highly-
educated offi cers and experts, contributing to the intellectual potential and purchasing power
of the city (Dziemianowicz 2000, p. 300).
In contrast, the factors exerting a negative infl uence on the decision to locate a company
in Warsaw, Prague or Budapest include, fi rst of all, traffi c and communication problems.
The cities under analysis, in terms of internal transport, in the European Cities Monitor
Report 2006 were rated in the following way: Prague – 23rd, Budapest – 26th and Warsaw –
– 28th. In addition, in terms of transport connections with other cities and international con-
nections, Prague and Warsaw were rated 23rd and Budapest 28th (Table 8).
Table 10. Most trusted countries for FDI
Country Confi dence rate
1. China 2.197
2. India 1.951
3. USA 1.420
4. United Kingdom 1.398
5. Poland 1.363
6. Russia 1.341
7. Brazil 1.336
8. Australia 1.276
9. Germany 1.267
10. Hong Kong 1.208
11. Hungary 1.157
12. Czech Republic 1.136Source: FDI Confi dence Index Report, 2005, AT Kearney, Alexandria.
The three capitals are unattractive for international investors in terms of the quality of life
of the employed. Prague, Budapest and Warsaw were rated accordingly 25th, 27th and 33rd in
the European Cities Monitor Report 2006 (Table 8). The issue of spatial culture has become
a top-priority value in the intercity competition. It is considered one of the most crucial
factors infl uencing the decision on location. It results from the preferences of a narrow group
5 The rate was calculated in accordance with the prices of housekeeping products, personal hygiene products food, clothing, as well as the costs broadly-defi ned as services and transport.
6 In terms of business climate Budapest was classifi ed at 2nd, Prague 3rd, and Warsaw 4th place in the European Cities Monitor Report 2006 (Table 8).
http://rcin.org.pl

49Warsaw, Prague, Budapest – metropolitan functions comparison
of specialists who, due to their high incomes, attach a great importance to the choice of place of
residence and the quality of living conditions. Therefore, only the cities located in the natural
environment free from pollution are taken into consideration.
The cities under analysis come out badly in terms of the quality of telecommunication
services. In accordance with the results of the European Cities Monitor Report 2006, Prague
has been rated 26th and both Warsaw and Budapest 29th (Table 8).
Despite the fact that businessmen have to face the aforementioned problems, international
concerns plan new investments in Warsaw, Prague and Budapest. It seems that the construc-
tion of the base in CEE should be started in the region of a relatively high political and eco-
nomic security and absorbent market. In the AT Kearney Report 2005 Poland, Czech Republic
and Hungary are positively considered as dynamic countries, in the position of great trust,
as for foreign direct investments. With respect to this classifi cation, Poland has been rated 5th,
Hungary – 11th and Czech Republic – 12th (Table 10).
FUNCTION OF SPATIAL CENTRE FOR BUSINESSOFFICE MARKETWarsaw, Prague and Budapest are considered as a preferable commercial offi ce space market
in the region. In the European Cities Monitor Report 2006, in terms of offi ce space, Warsaw
was rated 7th, Budapest 13th and Prague 16th. What is worth noting, in terms of offi ce space
value in relation to its standards, the capital of Poland was rated 1st, Czech Republic – 4th and
Hungary – 6th (Table 8).
Initially (in the fi rst period of transformation), it was Budapest to be in the lead in the compe-
tition for building of luxurious offi ce complexes in this part of the continent. Owing to a relati-
vely liberal authorities policy, prior to the systemic transformation, the infrastructure of
the capital of Hungary was the closest to West-European standards (Jałowiecki 2000, p. 48–49).
The Budapest’s modern offi ce stock has currently been concentrated in the following areas:
the city centre, the central market, the non-central market and the peripheral market.
The most representative and expensive areas are the city centre and the central market.
Because of the lack of development sites in the city centre and the central market, the new
development takes place mainly within the non-central markets. The major part of new
space is being built over in the Vácu ut Corridor, South Pest, the outer ring and the south of
the city. 2/5 of the modern offi ce stock is located in Buda and 3/5 in Pest. In 2006, the total
offi ce stock in Budapest amounted to 1.73 million m². The prime rents for class A build-
ings at top locations equal Є 17–19 m²/month. The rents in non-central locations equal
Є 13–16 m²/month (Real...2007).
The capital of Czech Republic has also become an attractive offi ce space market in Europe,
owing to its rich historical heritage and advantageous location. The investments in Prague were
initially concentrated in the centre and included mainly the adaptation of historical objects.
At present, there are no substantial possibilities of development in this region. As a result,
the contribution of historical objects, from the point of view of offi ce location, has decreased
in favour of the districts outside the centre of Prague (Jałowiecki 2000, p. 49). At the end of
2006, the total offi ce stock reached nearly 2 million m². In the city centre the level of rents
equalled Є 17–19 m²/month, depending on the quality of the premises. The rent levels in
peripheral offi ce locations equal Є 14.5–15.5 m²/month (Prague... 2006/2007, p. 13).
http://rcin.org.pl
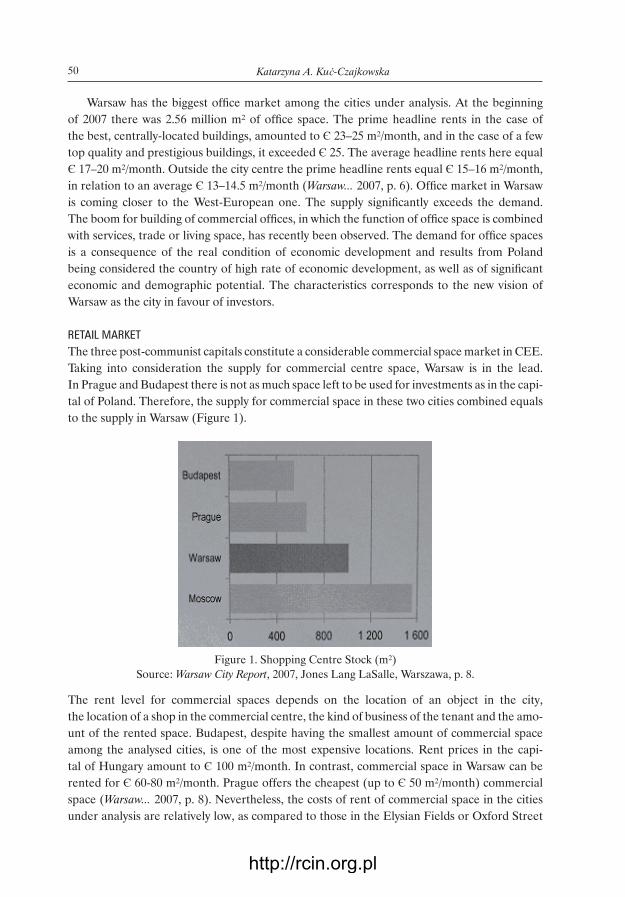
50 Katarzyna A. Kuć-Czajkowska
Warsaw has the biggest offi ce market among the cities under analysis. At the beginning
of 2007 there was 2.56 million m² of offi ce space. The prime headline rents in the case of
the best, centrally-located buildings, amounted to Є 23–25 m²/month, and in the case of a few
top quality and prestigious buildings, it exceeded Є 25. The average headline rents here equal
Є 17–20 m²/month. Outside the city centre the prime headline rents equal Є 15–16 m²/month,
in relation to an average Є 13–14.5 m²/month (Warsaw... 2007, p. 6). Offi ce market in Warsaw
is coming closer to the West-European one. The supply signifi cantly exceeds the demand.
The boom for building of commercial offi ces, in which the function of offi ce space is combined
with services, trade or living space, has recently been observed. The demand for offi ce spaces
is a consequence of the real condition of economic development and results from Poland
being considered the country of high rate of economic development, as well as of signifi cant
economic and demographic potential. The characteristics corresponds to the new vision of
Warsaw as the city in favour of investors.
RETAIL MARKETThe three post-communist capitals constitute a considerable commercial space market in CEE.
Taking into consideration the supply for commercial centre space, Warsaw is in the lead.
In Prague and Budapest there is not as much space left to be used for investments as in the capi-
tal of Poland. Therefore, the supply for commercial space in these two cities combined equals
to the supply in Warsaw (Figure 1).
Figure 1. Shopping Centre Stock (m²)
Source: Warsaw City Report, 2007, Jones Lang LaSalle, Warszawa, p. 8.
The rent level for commercial spaces depends on the location of an object in the city,
the location of a shop in the commercial centre, the kind of business of the tenant and the amo-
unt of the rented space. Budapest, despite having the smallest amount of commercial space
among the analysed cities, is one of the most expensive locations. Rent prices in the capi-
tal of Hungary amount to Є 100 m²/month. In contrast, commercial space in Warsaw can be
rented for Є 60-80 m²/month. Prague offers the cheapest (up to Є 50 m²/month) commercial
space (Warsaw... 2007, p. 8). Nevertheless, the costs of rent of commercial space in the cities
under analysis are relatively low, as compared to those in the Elysian Fields or Oxford Street
http://rcin.org.pl

51Warsaw, Prague, Budapest – metropolitan functions comparison
in London, amounting to approximately Є 500 m² (Jałowiecki 2000, p. 63). Not surprisingly,
the post-communist capitals receive great interest from foreign networks. It can be observed
that a number of large, multi-function commercial centres, such as Blue City and Arkadia in
Warsaw, have been set up. In the capital of Hungary there are several commercial investments,
such as Europark, Albertalva and multi-function objects.
WAREHOUSE MARKETWarsaw has the largest warehouse market among the cities under analysis. The warehouse
space offered by Prague and Budapest is slightly more limited (Figure 2).
Figure 2. Warehouse stock (mln m²)
Source: Warsaw City Report, 2007, Jones Lang LaSalle, Warszawa, p. 11.
The highest levels of rent rates in Warsaw are found in zone I and amount to approximately
Є 5.25 m²/month. In other zones they equal Є 2.8–3.6 m²/month (Warsaw... 2007). Such prices
are competitive in relation to Prague and Budapest, where rent prices are higher, as a re-
sult of lower supply for plots. They equal Є 5 m²/month and Є 4.8 m²/month, respectively
(Rynek... 2005).
The comparison between, on the one hand, Polish, Czech and Hungarian offi ce, commercial
and warehouse markets and, on the other hand, the markets of the fi fteen EU countries, leads
to the conclusion that the average annual return rates are very much in favour of Poland,
Czech Republic and Hungary. In the case of these countries, we deal with the highest demand
and the best capitalization rates. The average annual return rates from the invested capital in
the East-European cities amount to approximately 6% for offi ce space, 5.8% for commercial
Table 11. Real estate investment by countries in 2006
Country Investment rates (%)
Poland 39
Czech Republic 10
Hungary 9
Source: Jones Lang LaSalle.
space and 8.2% for warehouse space. In contrast, the return rates from investments in Poland,
Czech Republic and Hungary equal 7.9%, 8.1% and 10.5%, respectively (Czarnecka et al.
2005, p. 100). On the other hand, comparing the level of real estate investments, the highest
http://rcin.org.pl

52 Katarzyna A. Kuć-Czajkowska
investment rate is found in Poland and it is four time higher than in Czech Republic or Hun-
gary (Table 11).
THE FUNCTION OF EDUCATION AND KNOWLEDGE CENTRE
The function of education and knowledge centre means the presence of well-known and
reputable education and research centres, specialist personnel training centres, technological
parks, congress centres and universities with a signifi cant number of foreign students. Due to
the organization of a number of congresses, meetings and seminars, they constitute the ground
for the knowledge and information exchange and centre of international meetings.
The international position of a given centre, in the scope of education, is established on
the basis of the coeffi cient calculated by the Institute of Scientifi c Information in Philadel-
phia, marking the number of publications and their citations for a given educational centre.
T. Zarycki (2000, p. 342–346) carried out the analysis, in which he accepted this standpoint,
as well as considered the entries from the Science Citation Index presented in an article by
C.W. Matthiessen and A.W. Schwarz (1999). From the point of view of the number of articles
published in the period from 1994 to 1996, Warsaw was rated 32nd, Prague 33rd and Budapest
36th in Europe. Warsaw exceeded 29 West-European and two Russian centres (Moscow and
St. Petersburg). The capital of Poland slightly outdistanced Prague and Budapest. The ratings
of educational centres according to the number of articles noted in the Science Citation Index
per one inhabitant, looks different. Namely, Prague is classifi ed at 20th, Warsaw 33rd and
Budapest at 38th place.
Matthiessen and Schwarz also classifi ed the analyzed centres according to their research
profi les. Warsaw was classifi ed to the group of centres characteristic of a high-level of applied
physics and chemistry, but poor medicine and biology. Warsaw is also characteristic of well-
-developed natural sciences. Budapest has a high-level of computer science, but comes out
badly in terms of natural science and biology, and very badly in terms of medicine. Medical
engineering and natural sciences are the strong points of Prague, whilst medicine is the weak
point (Zarycki 2000, p. 346).
Comparing the number of university students, Warsaw is in the lead. In the capital of
Poland in 2003 the number of students was nearly two times bigger than in Budapest and three
times bigger than in Prague. Also the number of students per 1000 of inhabitants confi rms
the leading position of Warsaw among the cities under analysis (Table 12).
The positive tendencies in the development of higher education put Poland at the second
position in Europe, in terms of the number of students in relation to the number of inhabitants
(in Poland every second person in his/her twenties is a University student) (Bąk 2005, p. 40, 42).
It may turn out that Polish society is one of the best educated societies in the European conti-
nent. The neighbours of Poland offer more benefi cial conditions, higher allowances and better
infrastructure to their investors. However, they do not provide a suffi cient number of well-
-qualifi ed workers, knowing modern technologies. Polish students occupy high positions
in world programming competition, e.g. The University of Warsaw is regularly classifi ed at
the top of the Top Coder international programmers ratings (in 2005 it was rated 1st, exceed-
ing the Massachusetts Institute of Technology, California Institute of Technology, Stanford
University). Also, the University of Warsaw graduates achieve successes in this fi eld (Czajka
won the Top Coder competition in 2003 and 2004). Technological concerns transfer, e.g. to
http://rcin.org.pl

53Warsaw, Prague, Budapest – metropolitan functions comparison
Warsaw their research centres, as well as employ scientists, engineers and computer scientists.
In view of the statistics called by Ł. Bąk (2005), over 20 global concerns located in Poland their
research and development institutes, and fi nancial centres, with total number of engineers,
computer scientists and accountants equalling approximately 3 thousand.
Table 12. The number of university students
City 1990 2000 2002 2003
Total Per 1000 population
Warsaw 68,9 thous. 239,2 thous. 262,7 thous. 269,5 thous. 159
Budapest 45,4 thous. 114,4 thous. 134,7 thous. 146,6 thous. 86
Prague 54,5 thous. 73,7 thous. 79,6 thous. 94,1 thous. 81
Source: prepared by the author on the basis of Rocznik Statystyczny Warszawy, 2005, GUS, Warszawa,
p. 419; Rocznik Statystyczny Warszawy, 2006, GUS, Warszawa, p. 416.
Comparing, in turn, the number of foreign university students, Budapest is the fastest-deve-
loping centre. The proportion of foreign students in the academic year 1994/1995 in Warsaw
equalled 115 people, which was more than in Prague but could not be levelled with Budapest,
where the reported number of foreign students was far bigger (Jałowiecki 1999, p. 127). Since
then, the situation has hardly changed. In the academic year 2006/2007 over 15 thousand of
students from 118 countries decided to take up studies in Hungary7. The vast majority, i.e.
79%, of all foreign students came from Europe (mainly from Romania, Slovakia, Germany
and Ukraine), 16% came from Asia, 3% from North America and the remaining 2% from
African countries (Foreign... 2007).
The number of foreigners studying in Czech Republic approximates the fi gures in Hun-
gary. According to the data from the Institute for Information and Education, over 14.2 thou-
sand foreigners, mainly Slovaks, Russians and Ukrainians, studied at Czech universities in
the academic year 2004/2005. Most of foreigners studied in Prague at the Charles University –
5.2 thousand and at the University of Economics – 1.9 thousand (Number...2007).
The number of foreign students in Poland is smaller, as compared to Hungary and Czech
Republic, and equals 10 thous. In terms of education, Poland is attractive for the citizens of
the East-European countries, namely Ukraine, Belarus, Lithuania, Russia, as well as the coun-
tries from Middle and Southern Asia (Guza 2007). The number of foreign language students
in Warsaw in the academic year 2001/2002 equalled 1.88 thousand and in 2004/2005 – 2.3
thousand, and 2005/2006 – 2.6 thousand (Statistical Yearbook of Warsaw, 2003, 249; 2006,
p. 248). The capital of Poland becomes, thus, a more cosmopolitan centre. On the basis of
the research carried out by the author8, it can be concluded that the trend to take up educa-
tion in Warsaw concerns not only young people from Eastern Europe but also the citizens of
Asian countries (e.g. Armenia, Vietnam and China), as well as Western-European countries
(e.g. Germany, Holland).
7 As a result of the lack of current data on the number of foreign students in Budapest and Prague, the author compares the data for the entire countries. The author also assumes that the majority of foreign language students take up education in the capital.
8 The research concerning foreign students in Warsaw was carried out in the 1st quarter of 2005. It included 9 public and 59 non-public Universities (according to the overview of institutions of higher education available on the Internet web side of the Ministry of National Education and Sport, http://www.men.waw.pl, 12.12.2004).
http://rcin.org.pl

54 Katarzyna A. Kuć-Czajkowska
Therefore, it can be stated that the “fashion” for CEE has not been fading. Warsaw, Prague
and Budapest should actuate their development, taking advantage of their favourable location
or geopolitical system after the EU extension. These cities should contest for promotion in
the network of metropolises, by means of initiating new University courses in English. Making
the CEE an attractive place to study for young people from other EU countries is an important
educational challenge to be faced by Universities and local government authorities. The infl ux of
foreign students means social and economic benefi ts, and, above all, promotion of the city abroad.
However, we should remember about essential problems in the development of the func-
tion of education and knowledge centre.
1. Polish and Hungarian budgets constitute the central fi nancial source for scientifi c
research (in 2002 nearly 60% of fi nancial means came from the budget of these two coun-
tries). The country, in which private businessmen bear larger amount of costs on researches
is Czech Republic – 53.7%9 (Table 13).
Table 13. The structure of fi nancial means on research and development activity, according to fi nancing sources in 2002 (%)
Country National budget Economic subjects
Czech Republic 42,1 53,7
Hungary 58,5 29,7
Poland 61,1 22,7
Source: Heller J., Bogdański M., 2005, Nakłady na badania i rozwój w Polsce na tle wybranych
państw europejskich, Studia Regionalne i Lokalne, 4, 68–69.
2. Financial means on scientifi c researches are insuffi cient, as compared to the needs.
The level of expenditure on research and development in GDP (measured per one person)
in 2003 in Poland equalled 0.59%, Czech Republic 1.35% and in Hungary 0.97%. As can be
seen, Czech Republic devoted the largest amount of fi nancial means on the development
of education. In contrast, the expenditure was the lowest in Poland and Hungary (Heller et
al. 2005, p. 64–65).
3. In the research and development sector there exists an unfavourable domination of basic
research (theoretical and experimental studies, not aimed at their practical application)
over applied research (practical knowledge) and progressive research (using the acquired
knowledge to introduce innovations). E.g. in 2003 in Poland 38.8% of fi nancial expenditure
was devoted to basic research, while 35.5% and 25.7% was devoted to applied and progres-
sive research, respectively10 (Heller et al. 2005, p. 71).
THE FUNCTION OF CULTURAL CENTRE
THE PERSPECTIVE OF TRADITIONAL VISION OF CULTURE The perspective of traditional vision of culture refers to a group of people and institutions
participating in the process of creation, reproduction and popularization of pieces and phe-
nomena of high culture (museums, theatres, operas, philharmonics, galleries). This function
9 E.g. in Finland the private sector in 2002 in 69.5% fi nanced the development of education (Heller et al. 2005, 69).10 The situation is reversed in the USA. 18% of means is devoted to basic research, whereas 61% and 21% to
progressive and applied research, respectively (Olbrycht 2005).
http://rcin.org.pl

55Warsaw, Prague, Budapest – metropolitan functions comparison
includes regular organization of artistic events (congresses, exhibitions, festivals) of interna-
tional, European and supranational rank.
The cultural space in Warsaw is fi lled with the units conducting regular stage activity. There
are 30 theatres and music institutions, 56 museums, e.g. the National Museum, the Museum
in the King’s Palace of Łazienki, the Museum of Wilanów and the King’s Castle. The cultural
infrastructure of Warsaw consists also of more than 50 commercial rooms and 29 galleries
(Rocznik Statystyczny Warszawy, 2006, p. 257, 265), e.g. the Modern Art Gallery “Zachęta”,
as well as galleries vivaciously cooperating with artists from Eastern and Western Europe –
– Modern Art Centre. Warsaw is also a signifi cant music centre, famous not only in Europe,
but also in Japan and USA. The highest prestige is attached to the F. Chopin International
Pianist Competition. What is more, the following festivals take place each year: the Festival of
Music Autumn in Warsaw, Warsaw Summer Jazz Days or Warsaw Jazz Jamboree. There is also
a number of exhibitions presenting the works of contemporary sculptors, painters and graphics
(e.g. The International Poster Bien-nales), organized on a regular basis.
Budapest is unequivocally the centre of cultural life. Theatres (49), museums (121),
collections and tempo-rary exhibitions are concentrated in the capital. The Thalia Theatre,
the Comedy Theatre, and the Opera Theatre are the pride of city. The Hungarian capital has
a good position in the international cultural rank and is on its way to become once again one
of the cultural capitals of Europe. Each season has its outstanding features. The season begins
with the Budapest Spring Festival and ends with the Autumn Festival with a host of different
cultural events in between. Its cultural events are surrounded by large nation-wide and inter-
national interest.
Prague similarly Budapest is the centre of cultural life. There are 46 museums, 29 galleries,
and nearly 40 different theatres, e.g. the National Theatre, the Estate Theatre, State Opera,
and National Marionette Theatre. The important cultural institutions are also the National
Gallery with its extensive art collections spread throughout the city in six locations and
the National Museums. City’s other fi ne museums are the Jewish Museum with the world’s
largest collection of Judaic art, Rudolfi num which hosts contemporary art temporary exhibi-
tions, and House of the Black Madonna, one of the rare cubist building in Europe itself, with
exhibitions of Czech Cubism. Prague also hosts internationally festivals. The most famous one
is the annual “Prague Spring” International Music Festival (Inside... 2007).
World or European cultural metropolises are the historical centres refl ecting the past and
civilization development. They are an amalgamation of pieces of art, monuments of the past,
prestigious museums, theatres and operas. There are a number of international congress-
es, festivals and exhibitions, which are organized in these centres (Jałowiecki 1990, p. 50).
The capitals of Poland, Czech Republic and Hungary are capable of generating artistic events
of international reputation. They should use their potential and the existing festivals as a basis
for the formation of cultural centres of international reputation. Included into the EU system,
they should use their geographic position and historical connections as a means of cooperation
and artistic contacts. The post-communist capitals should become the place of thought and
idea exchange, the international meeting places for artists and people of culture. The develop-
ment of function of cultural centre could be based on the existing potential (of the institutions
of culture and cultural events of continuous character and international reputation), as well
as on the creation of a given speciality of cultural events. E.g. the chances of Warsaw could be
http://rcin.org.pl

56 Katarzyna A. Kuć-Czajkowska
seen in the city’s multicultural element, in the promotion of the initiative “at the crossroad of
cultures”, aimed at facing the culture of various nations that live there. However, it ought to be
remembered that the increase in cultural offer stiffens the competition. Therefore, it depends
upon the people of culture whether these capitals are to become the active participants of
cultural life or only passive observers and customers (recipients).
The lodging basis for visitors and tourists proves to be a crucial issue. Prague appears to
offer the biggest number of lodging places. The second position, in this respect, is occupied by
Budapest. Whereas, Warsaw comes out rather badly having the number of lodging places over
three times smaller than in Prague and two times smaller than in Budapest. A similar situation
is in the case of numbers of people staying overnight. Four times more people make use of
the lodging place offer in Prague than in Warsaw. Only in terms of the number of foreigners
making use of the lodging basis, Warsaw looks slightly better. With this respect, two times
more foreign visitors stays overnight in Prague and Budapest than in Warsaw.
Table 14. Lodging basis in 2003
City Number of beds in the
hotel facilities (thous.)
Number of beds per 1000
population
Tourists accommodated (mln) Share of foreigners in total of tourists
accommodated (%)Total Of which
foreigners
Prague 69,9 60 8,4 7,5 89,6
Budapest 44,8 26,3 5,1 4,3 83,9
Warsaw 19,8 11,7 2,3 1,09 47,1
Source: Rocznik Statystyczny Warszawy, 2006, GUS, Warszawa, p. 418–419.
PERSPECTIVE OF THE CULTURE OF SPATIAL ORDERPerspective of the culture of spatial order refers to the representative character of the archi-
tecture, the esthetics of the city, the prestigious expression of the infrastructure devices,
the shape of the building, lighting, urban gadgets, namely all that is called “the exceptionality
of the city”.
The capital cities of the Czech Republic11 and Hungary have urbanistic shape and their
monuments are comparable to the French or Italian ones. Warsaw had no luck in shaping
urban form. Several hundred years of being a capital city have not ensured an adequate qual-
ity of the urban space to the rank of a national representative. One of the reasons for such
a state is the fact, which we tend to easily forget about. The fate of the city, its development
or stagnation in the development, are connected with the environment and the geopolitical
phenomena. That is why the historical context of development of the city should also be taken
into account, while considering the culture of spatial order of Warsaw. During the war,
the capital of Poland lost the buildings from the second half of the XIX century, which is what
constitutes the essence of Budapest or Prague. Additionally, only a few buildings of the former
Warsaw survived in their original material substance. The war led to the destruction, espe-
cially of the central quarter and its monumental buildings. In two thirds, the city was rebuilt
(Bąk 2004, p. 14). That is why most of the Old Town and Royal Tract buildings is a restitution.
The restitution based on reliable studies, using old technologies, but still a restitution.
11 Prague is valuable historical city reserve. In 1992 the historical core of the city was listed in the UNESCO World Cultural and Natural Heritage Register.
http://rcin.org.pl
57Warsaw, Prague, Budapest – metropolitan functions comparison
The reason for the present urban shape of Warsaw is also the lack of conception of spa-
tial organisation after 1990. The localization of new investments is often accidental, which
deepens the existing chaos. The constructions are being located due to the availability of land,
mostly in the close centre. New offi ces are built next to the old, usually tenement houses, which
have not been restored for decades, and are in bad technical condition. The houses, very often
in a complicated proprietary situation (some fl ats are owned by the commune, some by ten-
ants), cannot be reprivatized or sold, and neither the tenants nor the local government have
money for their renovation. As a result, the multi-storey buildings of the best quality adjourn
devastated tenement houses. In addition, housing estate elements can be spotted in the centre.
New large-scale buildings often clash with the existing building styles, natural areas are built
over, dwelling buildings displaced by commercial functions.
Obviously, Warsaw has many positive achievements, i.e. central streets: Nowy Świat,
Chmielna. Moreover, the landscape of the city, especially the Skarpa Wiślana and the pano-
rama of the Old Town of Warsaw from Praga district is assessed highly. However, the land-
scape values which create natural conditions for Vistula river are not adequately benefi ted
from. Squares and churches built on the Skarpa are turned away from the river. The right bank
of the river is not used as a place to admire the Old Town panorama. By contrast, in Prague or
Budapest the river is included in the landscape of the city (Kurowski 1987, p. 170).
The capital city does not have to be a huge and wealthy city, but it has to be recognizable
and outstanding. Prague and Budapest are characteristic. Perhaps the chaos in the urban space
of Warsaw may be the evidence of its uniqueness and recognition.
THE FUNCTION OF THE TRANSPORT NODE
A metropolis ought to be connected through a system of motorways, fast railways, interna-
tional airport network of quick, frequent and direct transport connections with main urban
and world centres.
In the national economy, based on the knowledge of transport expenses, the availability
of the town to the traffi c of persons is more important. The Prague-Ruzyně Airport is the big-
gest airport among the discussed cities. It serves 10.8 mln passengers annually. It is used by 51
airlines in the network of 120 cities in the world. It is situated in the distance of around 10 km
from the centre of Prague (Port Lotniczy Praga...2007). The second largest airport, in terms of
the number of passengers, is the Budapest-Ferihegy Airport, located in the distance of 16 km
from the city centre. It offers fl ights all over Europe, Asia, the Near East and North America.
In 2005 it served 8.2 mln passengers (Port Lotniczy Budapeszt... 2007).
The international air transport node in Warsaw, the F. Chopin Airport (“Okęcie”) has
nearly 60 regular network connections with the biggest airports in the world and the number of
charter connections is growing. In 2006, 8 mln passengers went through the 3.5 mln passenger
concourse. As a result of the Terminal 2 being put into service, the capacity of the Airport is
expected to rise to 10 mln, and in practice even 14 mln travellers per annum (Terminal...2005).
The airport in the capital of Poland, though located near the centre, has many provincial
attributes. It is poorly connected to the system of national roads and hardly connected to
the railway. That is why the necessity of complex action, with regard to the infrastructure of
transport in Warsaw, is such an important issue. The modernization of the airport should be
followed by other investments, directly or indirectly related thereunto (Korcelli-Olejniczak
http://rcin.org.pl

58 Katarzyna A. Kuć-Czajkowska
2004, p. 129–130), so that the airport would be not only a transfer stop, but also a target stop
for newcomers and tourists.
A city can play an important role in the network of metropolises only on condition that it
has an advanced transport system. It is especially due to the fact that an increase in the general
number of passengers has been observed recently. In consequence, it is in the best interest of
Warsaw, Prague and Budapest to develop an air-transport system, so that the cities would be
connected, as fast as possible, to the main decision-making centres. The existence of the func-
tional and modern airport is one of the key conditions of the development of the already exist-
ing ones, and the acquisition of new metropolitan functions. As a result, the bigger the number
and the better the quality of the fl ight connection of a given city with the decision-making
centres of world standards, the higher the rank of the centre in the system of metropolises.
The technical capabilities of the carrier and the competitive prices of services are equally im-
portant (Denieul 1996, p. 66–69). Meanwhile, the prices offered by the biggest Polish carrier
PLL LOT are not among the cheapest, e.g. the price of the London-Warsaw fl ight by PLL LOT
costs Є 374, while the longer distance London-Prague by British Airways costs Є 214 (Table 15).
Table 15. Exemplary ticket prices in 2003
The route of the fl ight and name of the carrier The price of tickets (Є)
Stockholm-Warsaw PLL LOT 264
Stockholm-Prague Finair 209
Madrid-Warsaw PLL LOT 330
Madrid-Prague CSA-Czech Airlines 250
London-Warsaw PLL LOT 374
London-Prague British Airways 214
Source: Maciejewicz P., 2003, Pytania o Polskę, Gazeta Wyborcza, 189, p. 18.
Warsaw, Prague, and Budapest are situated at an intersection of important transit roads,
and their territories concentrate a large amount of functions and activities of above-national
importance. In spite of advantageous geopolitical location, the quality of transport infrastruc-
ture, especially in Warsaw agglomeration remains problematic12.
Prague and Budapest have solved their communication problems in the 1980’s. Budapest
took advantage of the economic prosperity of the turn of XIX and XX centuries. The under-
ground, as well as a number of main roads, were built in those days. The underground of Buda-
pest was the second one in the European continent. This means of transport is a solution to
many problems of Hungarian communication system. It is 31.7 km long, has 3 lines and 42
stations. The underground network in Prague and Budapest links almost all districts. It is
the most comfortable and the fastest means of communication within different city districts.
The underground in the capital of Czech Republic is the longest among the cities under analysis.
It is 54.6 km long, has 3 lines and 54 stations.
As compared to these two cities, the underground in Warsaw is of a provincial character
(despite the fact that the steps have been taken in order to extend this indispensable form of
transport). The underground in Warsaw is only 18.6 km long, has one line and 17 stations.
12 The author also writes about communication problems in Warsaw, Prague and Budapest in the part of this paper: The business centre function.
http://rcin.org.pl

59Warsaw, Prague, Budapest – metropolitan functions comparison
Czech Republic and Hungary spent on the transport infrastructure (per one citizen) re-
spectively 8 and 11 times more than Poland. There are not only motorways leading to Prague
and Budapest but the cities also have motorways and bypasses (Kudzia et al. 2001). Prague is
connected to 5 routes of the European road network, 3 of which are motorways (E 50, E 55,
E 67). In total, 4 motorways and 3 trunk roads lead to Prague. Prague transport network con-
tains 54.6 km of underground, 141 km of tram, 3.5 thousand km of road network, 76 km of
other high-speed road (Information... 2007).
The existing road-street system in Warsaw was created as a result of a post-war planning
process. The system of trunk roads is based on a radial-concentric model, gathering in the city
centre. The traffi c in Warsaw is introduced by 6 main roads. For many years, the attempts were
made to break this radial-concentric system through the construction of ring roads. However,
it turned out to be unsuccessful (only fragments of northern and western bypasses were built).
Thus, as there are no bypasses or motorways, the most of the transit traffi c (within the Warsaw
communication joint there are international roads: E 30, E 77, E 67), is led across the centre
of Warsaw. This causes an excessive overload of the relatively scarce network of streets in
the city (Górnicki 1999, p. 19–24). The length of the urban road network in Warsaw is 1093 km,
whereas in Budapest – 1133 km, and Prague – 877 km. The problem is that the highest number
of cars is registered in the capital of Poland (697.6 thousand). What is worse, “for up to 80%
of the overall traffi c in Warsaw, Warsaw is the fi nal destination” (Korcelli-Olejniczak 2004,
p. 127). In spite of the higher number of residents (1.7 mln), almost 100 thousand less cars
travel around Budapest (604.9 thousand). The smallest number of cars has been registered in
Prague – 568.9 thousand (Rocznik Statystyczny Warszawy, 2006, p. 417).
The communication transport system is the basic backbone of the city, conditioning its
effi cient functioning and metropolitan position. That is why, in the cases of Warsaw, Prague
and Budapest, it is necessary to improve transport nodes.
CONCLUSIONS
Table 16 depicts that Warsaw has strong position in terms of the function of spatial centre for
business, and the function of education and knowledge centre. Among the essential functions
of Prague are as follows: the business centre, the cultural centre and the communication joint.
The strong points of Budapest are: the function of education and knowledge centre (in terms
of the number of foreign students), and the function of cultural centre (in terms of traditional
vision of culture).
For Warsaw, Prague, and Budapest the road upwards the European urban hierarchy is not
a smooth one. Among essential reasons, it is necessary to indicate: the historical, legislative,
political and economic problems.
The development of metropolitan functions of those three cities and their chance of emerg-
ing as European metropolises depend on the interplay of historical and geographical factors.
Factors such as the original historical development of the country and its infl uence on attitudes
should also be included. The political dimension must not be overlooked (Bourdeau-Lepage
2004, p. 13). The capital has been, is, and will long be the object of keen interest on the part
of state authorities, which have tried many times and in many ways to gain infl uence upon its
http://rcin.org.pl

60 Katarzyna A. Kuć-Czajkowska
functioning. This is in a way a “normal phenomenon” because capital cities play the role of
major and active political, scientifi c, cultural, economic and administrative centres, and they
are large agglomerations of people. That is why, e.g. Warsaw’s government-structure differs
from the traditional territorial division of Poland. It is also the reason for frequent changes
of the status of Poland’s capital city (since the re-establishment of local government in 1990,
status of Warsaw has had 4 changes13). The political dimension also determines the potential
for metropolization, indirectly through the stability of government, but also directly through
regional and urban policies. E.g. Hungary’s economic crisis infl uences hindering of the develop-
ment of metropolitan functions in Budapest.
Table 16. Metropolitan functions Warsaw, Prague, and Budapest – the juxtaposition
Metropolitan functions Warsaw Prague Budapest
The business centre function 2 1 3
Function of spatial centre for business
Offi ce market 1 2 3
Retail market 1 2 3
Warehouse market 1 2 3
The function of education and knowledge centre
The number of articles published 1 2 3
The number of articles noted in the Science Citation Index
2 1 3
The number of university students 1 3 2
The number of foreign university students
3 2 1
The function of cultural centre
Perspective of traditional vision of culture
3 2 1
Perspective of the culture of spatial order
3 1 2
The function of the trans-port node
Air connections 3 1 2
Road junction 3 1 2
Source: prepared by the author.
What will be the position of Warsaw, Prague and Budapest in the hierarchy of metropo-
lises in the future? The answer to this question needs time and further analyses. It is worthy
to remember the word of S. Wyganowski (1993, p. 7), that every “city is a dynamic creation,
13 Warsaw instead of the association of 7 units (called district-municipalities), since 1994 was an association of 11
municipalities. One of which, Warsaw-Centrum municipality was divided into 7 districts (districts also exist in other
large cities in Poland, but their status was different from those in Warsaw). Meanwhile, since 1999 Poland was divided
into 16 regions, 315 provinces, 65 urban provinces (i.e. cities with province status) and 2489 municipalities. Finally,
Warsaw had an unusual structure of local government. Its structure was very controversial and complicated. There
were several levels of local administration, such as: 1) the province of Warsaw, 2) the Capital City of Warsaw – an asso-
ciation, 3) eleven Warsaw’s municipalities, 4) seven Warsaw-Centrum’s districts, 5) dozens settle-ments. Each of them
has its own decision-making body. This situation had positive and negative effects. On the one hand, residents of pe-
ripheral settlements could decide on their milieu. On the other, in the governance there was a lack of clear-cut spheres
of compe-tence, lack of clearly defi ned responsibility, lack of co-ordination of activities concerning the entire city. This
division brought a new set of policy and planning controversies. A subsequent reform of 2002 has consolidated the city
which now constitutes one municipality divided into 18 districts. The advocates think that this solution bring uniformity
in the city governance. The opponents said that this proposition goes to the centralisation of the city government
(e.g. the centralisation of fi nance decisions and real property policy) (Kuć 2003, p.109–122; 2004, p. 63–78).
http://rcin.org.pl
61Warsaw, Prague, Budapest – metropolitan functions comparison
continually developing, transformable. It is an open system, never-ending”. The awareness of
existing and potential threats to development forces limited time to remove the most visible
disproportions inhibiting functioning of the cities. The future of the changing Europe belongs
to the cities. The development of metropolitan functions should be selective, prepared to real-
ize selected directions, preferential to each city.
REFERENCES
Bąk J. w rozmowie z M. Łozińską – Warszawa u psychologa (2004) Życie Warszawy, 155.
Bąk Ł. (2005) Dolina Krzemowa jest w Polsce, Ozon, 5–6.
Bonavero P., Conti S. (1996) New Technological Paradigm. Urban Identity and Metropolitan
Networks in Europe, in: Pumain D., Saint-Julien T. (eds), Urban Networks in Europe, John
Libbey, Paris.
Bourdeau-Lepage L. (2004) Metropolization in Central and Eastern Europe: Unequal Chanc-
es, GaWC Research Bulletin, 141.
Brunet R. (1989) Les villes „européennes”, La Documentation Francaise, Paris.
Czarnecka D., Cieślak M. (2005) Raport nieruchomości. Powierzchnie komercyjne, Business-
man Magazine, 4.
Denieul F. (1996) Historic Metropolis. A Need for a Clear Strategy, in: Purchla J. (ed.), The His-
torical Metropolis. A Hidden Potential, International Cultural Centre, Kraków.
Dziemianowicz W. (2000) Warszawskie przedsiębiorstwa w procesie globalizacji, in: Kukliński A.,
Kołodziejski J., Markowski T., Dziemianowicz W. (eds), Globalizacja polskich metropolii,
Rewasz, Warszawa.
European Cities Monitor Report (1990, 1998, 2002, 2003, 2004, 2005, 2006) Cushman&Wakefi eld
Healey&Baker, London.
FDI Confi dence Index Report (2005) AT Kearney, Alexandria.
Foreign students in Hungary: Where are they coming from and where are they going? Ministry of
Education and Culture, http://www.felvi.hu, 05.09.2007
Furman S. (2000) Globalizacja metropolii warszawskiej. Ogólny szkic problemu, in: Kukliński A.,
Kołodziejski J., Markowski T., Dziemianowicz W. (eds), Globalizacja polskich metropolii,
Rewasz, Warszawa.
Gawryszewski A., Korcelli P., Nowosielska E. (1998) Funkcje metropolitalne Warszawy, Zeszy-
ty IGiPZ PAN, 53, Warszawa.
Górnicki J. (1999) Bariery i ograniczenia rozwoju systemu transportowego w Warszawie i met-
ropolii, in: Rozwój sieci transportowej metropolii warszawskiej 28-29 października 1999
konferencja naukowo-techniczna, Urząd Gminy Warszawa-Centrum.
Guza Ł. (2007) Cudzoziemcy mają problemy ze studiowaniem w Polsce, Gazeta Prawna, 120.
Heller J., Bogdański M. (2005) Nakłady na badania i rozwój w Polsce na tle wybranych państw
europejskich, Studia Regionalne i Lokalne, 4.
Information server city of Prague: Transportation, http://magistrat.praha-mesto.cz, 30.08.2007
Inside Prague: Culture, http://www.tripadvisor.com, 09.09.2007
Jałowiecki B. (1989) Warszawa jako stolica Polski, Kronika Warszawy, t. 79.
Jałowiecki B. (1999) Metropolie, Wyższa Szkoła Finansów i Zarządzania, Białystok.
http://rcin.org.pl

62 Katarzyna A. Kuć-Czajkowska
Jałowiecki B. (2000) Społeczna przestrzeń metropolii, Scholar, Warszawa.
Korcelli-Olejniczak E. (2004) Funkcje metropolitalne Berlina i Warszawy w latach 1990–2002.
Współzależność pozycji w systemie miast Europy Środkowej, Prace Geografi czne IGiPZ
PAN, 198, Warszawa.
Kuć K.A. (2003) Samorząd terytorialny miasta stołecznego Warszawy, Annales, vol. X, sectio K.
Kuć K.A. (2004) Problem ustroju miasta stołecznego Warszawy, in: Michałowski S., Pawłowska
A. (ed.), Samorząd lokalny w Polsce – społeczno-polityczne aspekty funkcjonowania,
Wydawnictwo UMCS, Lublin.
Kudzia P., Pawelczyk G. (2001) Między Wschodem a Zachodem, Wprost, 981.
Kurowski S. (1987) Warszawa na tle stolic Europy, Wydawnictwo KUL, Lublin.
Maciejewicz P. (2003) Pytania o Polskę, Gazeta Wyborcza, 189.
Matthiessen C.W., Schwarz A.W. (1999) Scientifi c Centres in Europe: an Analysis of Research
Strength and Patterns of Specialisation Based on Bibliometric Indicators, Urban Studies,
36, 3.
Niskie koszty działalności gospodarczej, PAIiIZ, http://paiz.gov.pl, 01.09.2005.
Number of foreigners study at Czech universities, http://magistrat.praha-mesto.cz, 05.09.2007.
Olbrycht M. (2005) Koło zamachowe innowacji, Polskie Jutro, 148, http://www.polskiejutro.com.
Port lotniczy Budapeszt-Ferihegy, http://pl.wikipedia.org, 21.08.2007.
Port lotniczy Praga-Ruzyně, http://pl.wikipedia.org, 21.08.2007.
Prague Property Report 2006/2007, Knight Frank Newmark Global, Prague.
Real Estate Market Overview Hungary – Budapest 2007, May 2007, Budapest-Vienna.
Rocznik Statystyczny Warszawy (2003) GUS, Warszawa.
Rocznik Statystyczny Warszawy (2005) GUS, Warszawa.
Rocznik Statystyczny Warszawy (2006) GUS, Warszawa.
Rynek powierzchni magazynowych w I kwartale 2005, http://dom.gazeta.pl, 23.06.2005.
Terminal 2: dane techniczne terminali pasażerskich, http://www.lotnisko-chopina.pl, 23.01.2005.
Treuner P. (1994) A New Map of Europe’s Spatial Development Objectives, European Journal
of Regional Development, 1.
Treuner P., Foucher M. (1994) Towards a New European Space, Akademie für Raumforschung
und Landesplanung, Hanover.
Warsaw City Report (2007) Jones Lang LaSalle, Warszawa.
Wyganowski S., (1993) Jutro wielka Warszawa, Związek Dzielnic-Gmin Warszawy, Warszawa.
Zarycki T. (2000) Warszawa jako europejska metropolia nauki, in: Kukliński A., Kołodziejski
J., Markowski T., Dziemianowicz W. (eds), Globalizacja polskich metropolii, Rewasz,
Warszawa.
http://rcin.org.pl

INFRASTRUCTURAL DETERMINANTS OF SPATIAL STRUCTURE
IN CRACOW’S SUBURBAN ZONE – A CASE STUDY OF THE MICHAŁOWICE
AND ZABIERZÓW COMMUNITIES
PIOTR TRZEPACZ and JOANNA WIĘCŁAW-MICHNIEWSKA
Institute of Geography and Spatial Management
Jagiellonian University
Gronostajowa 7, 30-387 Kraków
e-mail: [email protected] [email protected]
Abstract. Suburbanization processes are modifying the functioning of Cracow’s
surroundings. Migration fl ows are changing the demographic and social structure
of formerly rural areas, this occurring in relation to infrastructural development
and land-use changes. Spatial transformations from rural to urban space are among
the most readily measurable ones. Analyses of land-use changes in selected areas
of the two communes, directly adjacent to Cracow, provided an answer to the main
research question as to whether the outfi tting of suburban areas in infrastructure
creates a spatial confi guration of other land-use types The selected communes (local
authority areas) of Zabierzów and Michałowice represent different types of outfi t-
ting in infrastructure, acting as theoretical spatial-confi guration determinants.
Key words: infrastructure, suburbanization, airport, motorway, socio-economic
impact, local development, Cracow, Poland
INTRODUCTION
The immediate surroundings of Cracow are areas of unusually intensive transformations of
spatial structure. The commonly-observed procedure whereby cities exert impacts on their
hinterlands leads to transformation of the countryside, which at some stage loses its initial
characteristics under the infl uence of increased urbanization. Development of the suburban
area leads to both far-reaching social transformations associated with the infl ow of city inhab-
itants and to the development of residential buildings themselves. It is subject to the impact
of a wide range of factors related to both the directions and the intensities of the procedures
involved.
The main aim of the article is to indicate the level at which the functioning of the trans
EUROPA XXI2007, 16: 63-78
http://rcin.org.pl

64 Piotr Trzepacz, Joanna Więcław-Michniewska
port infrastructure defi ned by the authors as of large area or large scale (motorways, express
roads, city bypasses and ringroads, the airport) defi nes directions and intensities to the building
development ongoing in association with Cracow’s suburban area. The work described here,
has also concerned the signifi cance of local communication systems (servicing bus communica-
tions between locations in the suburban area and Cracow), as well as those that may be conside-
red traditional and somewhat monopolistic for the servicing of certain directions (the voivod-
ship road leading from Cracow to Warsaw via the commune of Michałowice, for which there
is no clear alternative). The work also relates to the dissonance between evaluations of local,
regional, and global impacts of large-area infrastructure. It is not by chance that the given
communes are included.
In fact, the communes under analysis manifest a number of similarities, but are also seen to
differ as regards the degree to which they are equipped or outfi tted in the aforementioned tran-
sport infrastructure. At the same time, within just a few years from now, the situation can be
expected to change. Plans for the future development of Michałowice provide for the construc-
tion of the so-called northern Cracow ringroad. It is therefore possible to assume that, much
as in the case of Zabierzów, where there is already a well-developed transportation system
functioning, Michałowice will also become diversifi ed into areas gaining from the existence of
such spatial solutions, and those losing importance, at least from the point of view of possibili-
ties for the further development of residential functions.
The effects of motorways or airports are variously contemplated in Western literature
(Hogan 1973; Lokshin and Chesnokova 1993; Anas 1995; Martinez and Araya 2000; Solnes
and Porgeirsson 2006). However, in relation to the fact that these objects are a relatively rare
occurrence in Poland, there should be studies conducted that recognize local conditions of
functioning, even more so since the creation of similar solutions for other areas already urban-
ised or in the course of urbanisation is a necessity, and a prospect for the nearest future.
CONDITIONING OF DEVELOPMENT OF THE CRACOW SUBURBAN REGION IN A NORTH-WESTERLY DIRECTION
The main areas dealt with in the presented study are the communes (local authority areas) of
Zabierzów and Michałowice, which fall within the poviat (“county”) of Cracow and adjoin the city
itself to the north and west. This area is among those experiencing signifi cant development
under the infl uence of a neighbouring large city. However, the suburban processes observed within
the Cracow poviat itself are on a much greater scale than those in other areas adjacent to the city.
It should be recognized that, from the point of view of possibilities for the development of
the suburban area, the value of the north-western vicinity of the city is in large part shaped by
landscape assets refl ecting the area’s relief. This is undoubtedly one of the foundations of suc-
cess for such communes as the discussed Michałowice or Zabierzów, localities in which many
migrants from Cracow decide to settle. The importance of this factor is inter alia attested to
by the fact that a large proportion of the lots that make up the area designated for develop-
ment are defi ned as beautiful land. However, it should be noted that, in the vicinity of Cracow,
the importance of relief can generally be considered additional to the residential function
development area. Therefore, in the case of the northern and western directions, it is not an
http://rcin.org.pl
65Infrastructural determinants of spatial structure in Cracow’s suburban zone ...
exception in comparison with the southern direction, or even less the only factor responsible
for the level of interest in the areas under discussion. Besides physical and geographical charac-
teristics, it is possible to identify a range of others that mutually characterize the distinction of
the discussed area, the emphasis being placed on its high potential for residential development.
One of the traits that clearly separates the area of Cracow poviat from the southern and
eastern vicinity of the city is the lack of signifi cant city centres. All communes directly adjacent
to Cracow and included in Cracow poviat are rural communes. However, the south-western
neighbourhood of Cracow is near (and even directly bordering with the administrative limits of)
such cities attractive and signifi cant from the point of view of business as Wieliczka, Skawina
and Niepołomice. In these cases, the development of suburban regions is cumulated as a
product of procedures associated with the outfl ow of population beyond the limits of both
Cracow and the smaller cities of the area. The prevalence of rural regions in the northern
and western parts of the area adjacent to Cracow is therefore an important mutual trait in
the discussed area. At the same time it is an area characterised by high population density – in
the case of the commune of Zabierzów even close to the densities observed in some urban
communes (Central Statistical Offi ce of Poland, 2007).
Apart from increased landscape value, the discussed area is also shown to be attractive by
the very high, if very internally diversifi ed, level of communication with the centre of the metro-
politan area. Residence in the direction to the north-east of Cracow means better communi-
cation accessibility of the city centre, even if compared to more closely located communes in
the southern or eastern environs. The possibility for residents of the commune of Zabierzów,
amongst others, to make use of the city bypass reduces the time of travel to work in the city
centre. The analysed communes vary in terms of communication connections from the centre
of the metropolis. The ring road, city train, bus communication lines, city bus lines servicing
the airport, as well as the suburban lines compose a long list of solutions that may be utilized
by residents of Zabierzów commune. Thus, this commune is much better equipped in this area
than that of Michałowice. On this basis, it is possible to declare that the residents of the latter
depend more on the utilization of individual transportation sources than those of Zabierzów.
While suburban communication and private buses also reach Michałowice, it is clearly a lower
level of communication with Cracow than that enjoyed by Zabierzów.
The directions and intensity of the population processes associated with the effect of
the city on its hinterland are factors characterizing both of the analysed communes. Above
all, the process of population infl ow in this area serves as an indicator of the popularity of this
direction to spatial development of the suburban region. In the cases of both of the discussed
communes – Zabierzów and Michałowice – there has been a steady increase in numbers of
high-level residents. During the years 1995-2006, the population of Zabierzów grew by over
2000, representing 10% of the current population of the entire commune (Central Statistical
Offi ce of Poland 2007). A similar scale to population development can be observed in the case
on Michałowice, in which the changes are more noticeable since this was originally (in the mid
1990s) among the weakly populated areas. The above discussed population increase proce-
dures show strong internal variety. The population infl ow, but also the outfl ow procedures
are visibly different at the level of villages – those located closer to large area transport infra-
structures, not covered with a system of protective screens, are characterized with a lack or
insignifi cant number of new residential investments.
http://rcin.org.pl
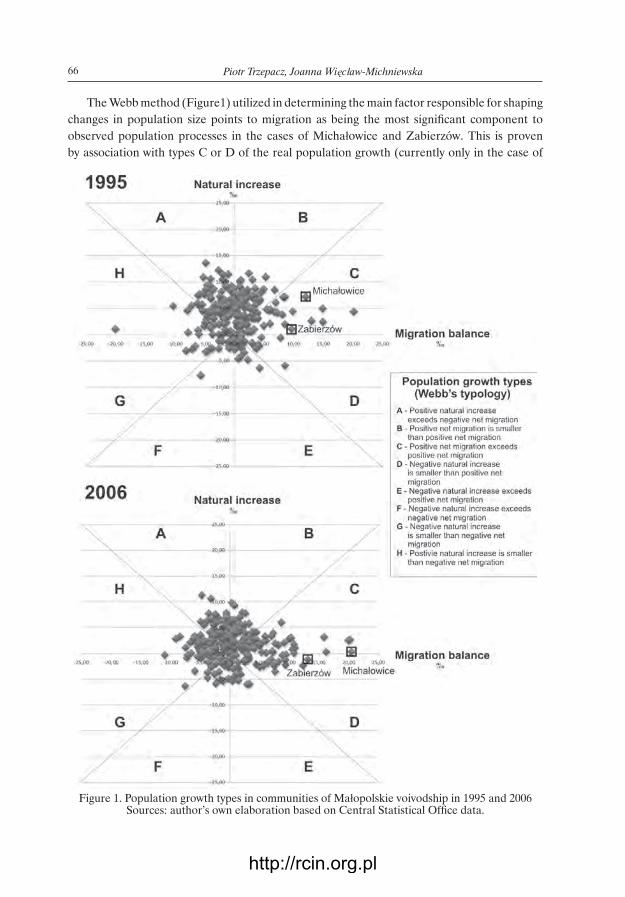
66
The Webb method (Figure1) utilized in determining the main factor responsible for shaping
changes in population size points to migration as being the most signifi cant component to
observed population processes in the cases of Michałowice and Zabierzów. This is proven
by association with types C or D of the real population growth (currently only in the case of
Figure 1. Population growth types in communities of Małopolskie voivodship in 1995 and 2006Sources: author’s own elaboration based on Central Statistical Offi ce data.
Piotr Trzepacz, Joanna Więcław-Michniewska
http://rcin.org.pl
67Infrastructural determinants of spatial structure in Cracow’s suburban zone ...
Zabierzów is this type D, though in the near future it will be the case for both). However, it
should be noted that the group association of communes with the highest values for migra-
tion infl ow – record-setting on scale of the entire voivodship – does not mean total stability as
regards the type of real growth. As mentioned previously, both communes are characterised
by high positive values for the migration balance. As early as in the mid 1990s, both Zabierzów
and Michałowice were already among the administrative units showing the greatest population
growth in the vicinityof Cracow (Figure 2). A general trend observed within the communes
of Cracow poviat is an upturn in population infl ow since the mid 1990s. The analysis of real
growth components points to the dominance of migration in shaping the development of pop-
ulation size in the discussed area. In the case of Zabierzów, the migration infl ow is also starting
to assume a compensatory function in relation to the natural growth. The natural growth in
the case of Michałowice is signifi cantly closer to zero, while in the case of Zabierzów a natural
loss is already being observed. In this area a major factor is the age structure of the migrants
fl owing into Michałowice. Currently there is a large share of young married couples settling in
the area, ensuring that the commune is still characterised by natural growth, rather than loss.
Among the types of residential buildings preferred by the population infl owing into
the area of the studied communes, it is possible to note differences in the range of architectural
forms and possession. In the case of Zabierzów, there is a much greater share of individual
residential developments, while the developed residential buildings more often have villa-like
characteristics, as opposed to being standard suburban single-family houses. Also, in the case
of this commune, it is possible to fi nd large, isolated residences in harder-to-reach places.
In the case of the other commune, of Michałowice, the situation to be observed contrasts
markedly. Building development is in large part the work of developers offering a chance for
people to reside within small districts whose architecture is very similar or even identical.
The discussed communes are not just targets for migrating residents from a large city,
functioning also as local business systems. In this aspect, it is possible to note marked variation
between the communes analysed. Zabierzów commune trades, not only on its location, but
also on the fact that it possesses an airport within its limits – this being a location factor for
business activity alongside the presence of the motorway. The presence of logistic companies
active within the commune attests to the above situation. This business development direction
has its spatial consequences. The logistic companies need large areas if they are to function
adequately, and larger business (industrial) lots. In such a system there are possibilities of con-
fl icts arising as designations are applied to terrain that could be attractive to both developers
and potential industrial investors. Another economic situation applies in the second analysed
commune – of Michałowice. In this case, the local economy is in large part associated with
agriculture. The environmental conditions are favourable to the development of market gar-
dening and fruit farming. The economic space in this commune is in large part composed of
storage areas, especially construction storage.
The development of this area is primarily associated with increased signifi cance of the resi-
dential function; for the population associated with Cracow this is not the only category of obser-
ved change, since other economic aspects should also be recognized as signifi cant impulses
to changes in the utilization of the terrain. To be referred to inter alia here is the dynamic
development of the Cracow Business Park. The name associated with Cracow relates to an
area located beyond the city limits – and within the commune of Zabierzów. This is one of
http://rcin.org.pl

68 Piotr Trzepacz, Joanna Więcław-Michniewska
Figure 2. Migration balance in Cracow’s surroundings in 1995 and 2006Sources: authors’ own elaboration based on Central Statistical Offi ce data
http://rcin.org.pl

69
the clearest signs of the business impact the city exerts on its immediate neighbourhood.
The characteristics of the analysed area of Zabierzów and Michałowice communes listed
above mutual point to similarities between the two, but also to a group of traits that serve in
differentiating between them. Both communes can be considered to be favourably located,
with many valuable features from the point of view of the possibility of further development
of both residential functions, and those relating to transportation, industry, and the services.
TRANSPORT INFRASTRUCTURE IN RELATION TO THE DEVELOPMENT OF THE CRACOW SUBURBAN REGION
The immediate vicinity of a large city comprises terrain of major signifi cance when it comes
to possibilities and needs as regards the planning infrastructure responsible for connection of
the system (city) centre on a regional or global scale. It is important to recognize the multi-face-
ted impact of large-area transport infrastructure (Fig. 3). The negative impact of that infra-
structure (e.g. through pollutant emissions) may lead to regression instead of the development
with which the infrastructure is supposed to be associated. An example of the direct negative
impact of infrastructure on the development of residential construction concerns the villages
located directly adjacent to the airport. The noise level associated with the landing and takeoff
of planes is a cause for concern among both developers and private investors, whose inter-
est in such places is very limited. It is therefore possible to observe adjacent localities with
markedly different levels of development (Aleksandrowice as a locality lacking new residential
developments, and Balice or Szczyglice with intensive infl ows of population and new residential
construction). This aspect of the functioning of the discussed infrastructure may therefore
Infrastructural determinants of spatial structure in Cracow’s suburban zone ...
Figure 3. Local, regional and global aspects of infrastructure impactSources: author’s own elaboration.
http://rcin.org.pl
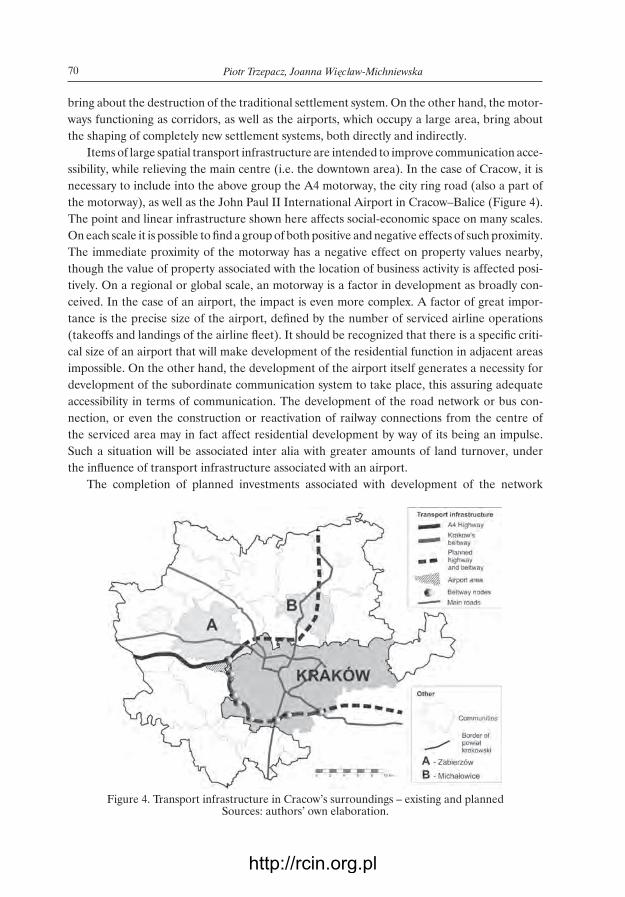
70 Piotr Trzepacz, Joanna Więcław-Michniewska
bring about the destruction of the traditional settlement system. On the other hand, the motor-
ways functioning as corridors, as well as the airports, which occupy a large area, bring about
the shaping of completely new settlement systems, both directly and indirectly.
Items of large spatial transport infrastructure are intended to improve communication acce-
ssibility, while relieving the main centre (i.e. the downtown area). In the case of Cracow, it is
necessary to include into the above group the A4 motorway, the city ring road (also a part of
the motorway), as well as the John Paul II International Airport in Cracow–Balice (Figure 4).
The point and linear infrastructure shown here affects social-economic space on many scales.
On each scale it is possible to fi nd a group of both positive and negative effects of such proximity.
The immediate proximity of the motorway has a negative effect on property values nearby,
though the value of property associated with the location of business activity is affected posi-
tively. On a regional or global scale, an motorway is a factor in development as broadly con-
ceived. In the case of an airport, the impact is even more complex. A factor of great impor-
tance is the precise size of the airport, defi ned by the number of serviced airline operations
(takeoffs and landings of the airline fl eet). It should be recognized that there is a specifi c criti-
cal size of an airport that will make development of the residential function in adjacent areas
impossible. On the other hand, the development of the airport itself generates a necessity for
development of the subordinate communication system to take place, this assuring adequate
accessibility in terms of communication. The development of the road network or bus con-
nection, or even the construction or reactivation of railway connections from the centre of
the serviced area may in fact affect residential development by way of its being an impulse.
Such a situation will be associated inter alia with greater amounts of land turnover, under
the infl uence of transport infrastructure associated with an airport.
The completion of planned investments associated with development of the network
Figure 4. Transport infrastructure in Cracow’s surroundings – existing and plannedSources: authors’ own elaboration.
http://rcin.org.pl
71Infrastructural determinants of spatial structure in Cracow’s suburban zone ...
of motorways and high-speed roads in south-western Poland will be of great importance to
the future of the suburban area of Cracow. From the point of view of the city’s function-
ing, a large effect will be exerted through the construction of a northern ring road, which
will lighten traffi c over a signifi cant part of the city, as well as the continued construction of
the A4 motorway in an eastern direction, as far as the border crossing with Ukraine.
At the same time, an investment such as the ring road will be of great importance in shap-
ing further possibilities for the northward development of the suburban region. The current
accessibility of areas located within the northern part of Małopolskie voivodship was much
weaker. The only communication route connecting the agricultural part of the voivodship with
its capital was the very important traditional regional road leading in the direction of Warsaw
(via the commune of Michałowice).
Of major signifi cance to the airport and part of the suburban area under discussion was
the activation of the city rail line connecting the airport in Balice with the centre of Cracow
(main station). This solution was primarily intended to shorten the travel time to the air-
port, which (with congestion problems in Cracow being as they are) was of almost an hour by
city transport. Such problems were impacting upon evaluations of the airport’s functioning.
The activation of the railway connection to the airport reduced the travel time to 18 or so minu-
tes. During the initial stages of its operations at least, the activity of the railway itself proved
a source of many spatial confl icts. Very limited use of the line was actually being made, while
its sudden activation in association with many unguarded crossings en route and requirements
as regards signalling proved very inconvenient to inhabitants, not only of the immediate sur-
roundings. The at least partial solution of passing of the rail on the route improved the situa-
tion – its passing is less inconvenient to the residents. The rail itself functions as a transporta-
tion source mainly delivering passengers to the terminals of the airport. However, this is not
its only function, this also being a very important source of transportation for many workers
at the airport, which as a large object with service points located within its terminals creates
a zone of commuting. However, the possibilities of the railway are not even exhausted when
this aspect has been considered, for this is an increasingly important means of transportation
for the population of the communes of Zabierzów and Liszki, and even for those living in
more distant areas of the Cracow poviat, these populations in no way being associated with
the airport itself. This situation should lead to the search for additional solutions that could
further improve the railway’s effectiveness within the discussed range. The Polish literature
more often signals the need for “park and ride” terminals to be constructed (Kolos 2005).
In this case also, a modern solution would mean a meeting of the expectations of the suburban-
area residents as regards the further improvement of communications between this area and
the centre of the metropolitan area.
AIRPORT AND MOTORWAY – IMPULSES OR BARRIERS TO DEVELOPMENT OF THE RESIDENTIAL FUNCTION
Both airport and motorway are to be listed among examples of large-area infrastructure.
These are objects that exerting strong anthropopressure. Their impact on the natural envi-
ronmental concerns, not merely the functioning of the objects themselves, but also the effects
http://rcin.org.pl

72 Piotr Trzepacz, Joanna Więcław-Michniewska
of operations conducted on their account – in road and air transportation. These objects go
a long way to shaping the social and economic space within an area that often goes beyond
the direct, closest neighbourhood.
Other than the fact that an area is occupied, there is also signifi cance due to the impact
the aforementioned objects (both point (airport) and linear) exert on the local population
(Gorka, Trzepacz 2006). The impact of these objects as barriers has its own specifi c charac-
teristics. Functioning, in the case of motorways in particular, leads to interruption of local
communication systems. The population that occupied the given area during the period in
which its signifi cance and utilization were at a much lower level than currently tends to speak
in negative terms about the blocking of their free pedestrian traffi c within the area. Equally,
there are observations as regards positive aspects, such as improved accessibility to schools or
workplaces.
The area of the commune of Zabierzów is characterized by a clear differential in relation
to the level attained by the residential function. The large-area nature of the infrastructure
itself does not have to result in a drastic decline in interest in a given area by developers.
The decisive factors in this regard are solutions utilized to limit negative functioning effects of
such infrastructure – primarily noise, for example. Such a solution may be a system of noise-
-prevention screening limiting this aspect of the motorway’s effects. However, a signifi cant
problem here is the resultant compromising of a landscape’s aesthetic value, which may
affect property values in an area. The analysis of development offers within the commune of
Zabierzów, especially in the villages through which the motorway runs, points to the major
importance of its impact as a factor shaping the level of turnover of land, as well as its price.
At this moment, there should be a separation of the impact of the residential function from
that of an exclusively economic character. The close proximity of an motorway or an airport
shapes property prices in a different way in the case of construction lots, as opposed to those
foreseen for business or industry. In the fi rst case, the location of a property in the immediate
vicinity of a large item of spatial infrastructure is presented as a questionable situation that
reduces value. An opposite affection vector in this regard is observed as the effect of such a
factor in shaping prices of lots foreseen for the development of service or industrial activity
is analysed. In this case, the closeness of communication arteries is examined in line with
the impulse that shapes the level of interest in the lot. Therefore, it is possible to arrive at
a conclusion that there are certain critical sizes (often literally) of both airports and other
transport infrastructure elements, which will function as a motivating factor in defi ned spatial
arrangements, while also representing a barrier to the local-scale development of the subur-
ban area in others. The regional, and even more so the global, scale of impact of the discussed
infrastructure, associated directly with the concept of development as broadly conceived, does
not have to mean development on a local scale, but rather a possibility for regression and
the destruction of local spatial structures to take place.
THE PROPERTY MARKET WITHIN THE SUBURBAN REGION OF CRACOW
Changes in land utilization in the studied communes, especially as regards the observed devel-
opment of housing construction, are closely linked with the intensifying process of suburbani-
http://rcin.org.pl

73Infrastructural determinants of spatial structure in Cracow’s suburban zone ...
zation in the Cracow agglomeration. Studies show that the effects of agglomeration affecting
its surrounding areas and making themselves felt strongly in relation to the spatial distribution
of employment, but also in e.g. fi nancial services and industrial production, achieve similar
values in agglomerations of Western European countries and the USA (Dekle, Eaton 1999;
Ciccone 2002). It is possible to assume that a parallel impact will also be exerted by Polish
agglomerations, including Cracow, on their surroundings. The employment increase is associ-
ated with a demand for new, attractive residences, and it is hard not to relate this to the sub-
urbanization procedure, to which many more Polish cities are subject. This is of course more
visible in suburban areas of large cities, such as Poznan, Cracow, or Wroclaw (Kochanowska,
Kochanowski 1997; Liszewski 1997). The residential zone in Eastern European countries has
been socially and politically transformed within the past several years, leading to signifi cant
changes, especially in metropolitan regions of large cities (Buckleyand and Tsenkova 2001;
Pichler-Milanovich 2001; Petrovic 2001), however, the suburbanization process itself, displayed
inter alia in the functioning of the real-estate market, is not very different from the Western
model, as declared in Hungary, for example (Timar, Varadi 2001).
The real-estate market situation near large Polish cities has changed greatly within
the past several years. Two basic facts have been noted: the price of land has increased many
times over (in the communes surrounding Cracow, the price of lots mostly grew by 100%
between 2005 and 2007), and also the land resources in the nearest vicinity of the city limits
have suddenly begun to shrink. A greater choice of offers characteristic of, among other things,
lower prices, is associated with more distant locations (e.g. in Cracow such areas as the surrou-
ndings of Myslenice or Alwernia, where the distance from Cracow is 30 – 40 km), although
even here a greater differential associated with attractiveness of location is to be observed.
The area of Pogórze Wielickie and the Cracow-Częstochowa Upland is recognized as a very
attractive place for residential development, while the eastern and western directions are
much less popular. Despite the difference in price, the number of lot sale offers in the com-
munes of Michałowice and Zabierzów during the period between April and October 2007
was the highest (with the exception of Wieliczka) among all 13 communes neighbouring with
Cracow. Within the communes of Cracow poviat (which includes 17 to the north and west
of Cracow), the discussed communes were also distinguished by having the largest number
of building lot offers. However, in both cases, these were the highest lot prices: among the
communes surrounding Cracow, the average price of land in Michałowice and Zabierzów was
3-4 times as high as the lowest price in the Igolomia-Wawrzenczyce commune (respectively:
344, 230 and 79 PLN/m2), while in the poviat of Cracow, this difference was even larger, since
the commune of Slomniki had an average lot price per m2 of 53 PLN during the analysed
period. The average price per m2 did not refl ect the differences associated with lot type, pre-
cise lot location, level of attractiveness of surroundings, terrain enforcement elements, close-
ness of main roads that access Cracow, type of access road, and other factors that signifi cantly
affect the price of development land. The analysis recognized all offers associated with real
estate, regardless of the lot type, i.e. its purpose according to the mandatory spatial deve-
lopment plan (if such exists). Nevertheless, in both Zabierzów and Michałowice communes,
the offer is dominated by building development, agricultural development, and agricultural
lots (with the possibility of requalifi cation for building development existing). These respec-
tively account for 78, 14.5, and 5% of the overall number of offers in Michałowice, and 70, 14,
http://rcin.org.pl

74 Piotr Trzepacz, Joanna Więcław-Michniewska
Figure 5. Number of properties for sale in the communes of Michałowice and ZabierzówSources: authors’ own elaboration based on “properties for sale” internet database.
http://rcin.org.pl
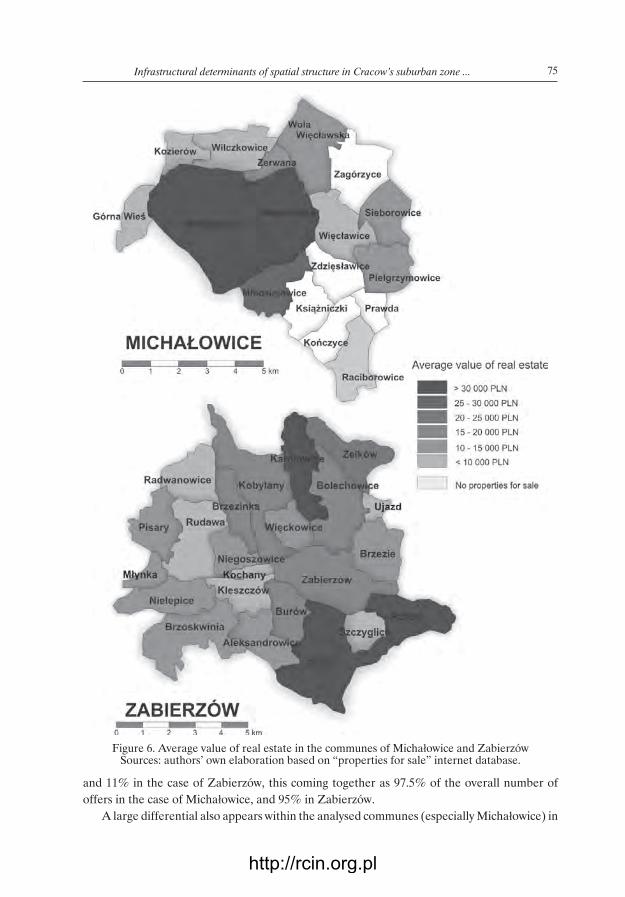
75
and 11% in the case of Zabierzów, this coming together as 97.5% of the overall number of
offers in the case of Michałowice, and 95% in Zabierzów.
A large differential also appears within the analysed communes (especially Michałowice) in
Figure 6. Average value of real estate in the communes of Michałowice and ZabierzówSources: authors’ own elaboration based on “properties for sale” internet database.
Infrastructural determinants of spatial structure in Cracow’s suburban zone ...
http://rcin.org.pl

76
relation to both the number of offers and the potential costs of purchasing land (Figures 5 and 6).
The commune of Zabierzów has attracted the interest of migrants from Cracow for many years
now, mainly on account of the good communication with the city and other towns, the very
attractive natural environment (one of the highest-rated communes as regards tourist attrac-
tions near Cracow, this resulting in the so-called values of beauty lots), and connections with
the so-called prestige of the place, specifi cally the reputation associated with a large number
of people known from broad public activity residing there. Currently, an additional factor
affecting the possibilities for the intensity of land turnover – and in consequence building
development – to increase is the enactment of spatial development plans. Among the 23
villages within the commune of Zabierzów, only 3 (Aleksandrowice, Burow and Kleszczow)
do not possess obligatory spatial development plans. In these villages, it is possible to note
the lowest share of overall real estate offers (respectively 0,6, 5 and 1.2% of the total). However,
this does not explicitly translate into land prices, since the latter are respectively of 130, 167,
and 73 PLN/m2, with the average for the commune of Zabierzów being 230 PLN/m2. Zabie-
rzów itself is the most popular (the proportion of offers within the overall number: close to
28%, prices between 190 and 255 PLN/m2), while following it we fi nd Balice, Rzaska and
Karniowice (respectively 16, 8, and 4%; average prices between: 441 and 325 PLN/m2).
The factors causing higher prices within these villages are: very good terrain enforcement,
possibilities for investing in service-production activities, the proximity of a technological
park, airport and motorway junction. Currently, the last two factors, especially the presence of
the airport, are received rather negatively in the case of potential investors in residential devel-
opment. However, it is indicated that, within a 10-15 year period, the terrain located near high
speed roads will be the most sought-after and valuable land for development.
The commune of Michałowice, located to the north of Cracow, is already the traditional
target of a large number of migrants from Cracow. The suburbanization process has intensi-
fi ed greatly here during the past several years, something that is associated ith the region’s
expanded developmental activity, among other things. The associated increase in the level of
technical investment, especially as regards land enforcement, hardening, or even asphalt paving
of many access roads, also stimulates increased interest in land purchase and the construction
of individual houses (however, “independent” house construction is much less expensive than
purchasing a home from development companies). To be observed within the commune are
strong variations in land turnover and amounts of construction traffi c. This is an agricultural
commune (still almost 70% occupied by arable land, including about 80% in categories I-III),
but the factors making certain villages attractive to investors are the proximity of downtown
Cracow – barely 15 km away, as well as easy access via the regional road. This relates to
Michałowice, Maslomiaca and Zerwana, in which the greater part of the offers and prices that
are among the highest are noted (respectively: 43, 28 and 7%; average price range: 150 – 120
PLN/m2; Figs. 5 and 6). The villages located further from the main communication routes are
characterised by both a smaller number of lots being offered for sale and by prices, which will
probably be subject to major changes within the next few years.
A signifi cant element that affects the turnover of land and its prices, and with that utili-
zation changes, are legal regulations, especially those that remain within the purview of
the space-holder, i.e. the regional government, as well as government regulations that affect
general housing policy through acts passed. In some countries, the laws regulating the method,
Piotr Trzepacz, Joanna Więcław-Michniewska
http://rcin.org.pl

77
type, or possibilities for changes in land utilization, in relation not just to residential construc-
tion, but to all other areas of human activity, are very well-developed (Hanushek, Quinley
1990; Cheshire Sheppard 2004). In Poland, the several years since the restitution of local and
regional government have not been suffi cient to erase a certain defi ciency in the degree of
effectiveness of the legal and fi nancial instruments local administrations use as they change
the designation of terrain for various purposes. The same factor that strongly organizes land
turnover and changes in the number of newly-constructed residential buildings is the “old” law
of the market: the relationship between supply and demand. The lack of both legal regulations
and normalized spatial development politics may ultimately lead to disruption of the balanced
development of the metropolitan areas of large cities, which may impact negatively upon any
further prospects for their functioning (Tosics 2004).
SUMMARY
Both the Zabierzów and Michałowice communes are places in which suburbanization pro-
cedures cross, while serving in the location and development of transport infrastructure of
an importance that greatly exceeds the servicing of local residents by businesses that function
in the area. The area occupied (appropriately signifi cant for the characteristics of the object)
is only one of the effects of functioning. The immediate proximity of the airport or the motor-
way, on account of severe (for residents in particular) functioning aspects including noise and
pollution makes this a place not considered residentially attractive. However, such a location
guarantees good communication accessibility of a large area associated with the servicing of
the centre of a spatial arrangement (e.g. downtown Cracow). The large-area infrastructure is
a factor that in large part determines spatial structures. The construction or expansion of such
transport infrastructure systems leads to the destruction of traditional settlement arrange-
ments, and has an effect in creating new ones, often in association with it. The dissonance
between scales of the local, regional and global impacts due to large-area transportation
investments in the context of their positive and negative effects should gain recognition in
the planning documents of such areas as those discussed in the article presented. Only
the planning of adequate solutions will allow (on one hand) for the population to be protected
from negative aspects of functioning within a human transport infrastructure – environment
system, and (on the other) for infrastructural development (of the airport) and appropriate
functioning (of the motorway) to be assured.
REFERENCES
Anas A. (1995) Capitalization of urban travel improvements into residential and commercial
real estate: simulations with a unifi ed model of housing, travel mode and shopping choices,
Journal of Regional Science, 35, 3, 351–376.
Buckleyand R. M., Tsenkova S. (2001) Housing Market Systems in Reforming Socialist Econo-
mies: Comparative Indicators of Performance and Policy, European Journal of Housing
Policy, 1, 2, 257–289.
Infrastructural determinants of spatial structure in Cracow’s suburban zone ...
http://rcin.org.pl
78
Cheshire P., Sheppard S. (2004) Land markets and land market regulation: progress towards
understanding, Regional Science and Urban Economics, 34, 6, 619–637.
Ciccone A. (2002) Agglomeration effects in Europe, European Economic Review, 46, 2, Else-
vier, 213–227.
Dekle R., Eaton J. (1999) Agglomeration and Land Rents: Evidence from the Prefectures,
Journal of Urban Economics, 46, 2, Academic Press, 200–214.
Górka Z., Trzepacz P. (2006) Węzły autostrady A4 jako czynnik rozwoju oraz przemian w zagos-
podarowaniu peryferyjnych osiedli Krakowa, in: Jażdżewska I. (ed.), XIX Konwersatorium
Wiedzy o Mieście. Nowe przestrzenie w mieście ich organizacja i funkcje, Wydawnictwo Uniwer-
sytetu Łódzkiego, Łódź, 377–390.
Hanushek E.A., Quinley J.M. (1990) Commercial Land Use Regulation and Local Govern-
ment Finance, The American Economic Review, 80, 2, 176–180.
Hogan M.C. (1973), Analysis of highway noise, Water, Air & Soil Pollution, 2, 3, Springer Neth-
erlands, 387–392.
Kochanowska D., Kochanowski M. (1997) Współczesne przemiany zagospodarowania przestrzen-
nego dużych miast i aglomeracji miejskich w Polsce, in: Korcelli P. (ed.), Aglomeracje miejskie
w procesie transformacji: V, Zeszyty IGiPZ PAN, Warszawa, 42, 23–40.
Kołoś A. (2005) Konfl ikty transportowe jako skutek współczesnych procesów urbanizacji,
in: Jażdżewska I. (red.), XVIII Konwersatorium Wiedzy o mieście. Współczesne procesy
urbanizacji i ich skutki, Wydawnictwo Uniwersytetu Łódzkiego, Łódź, 371–378.
Liszewski S. (1997) Procesy transformacji gospodarki i zmiany struktury przestrzennej Łodzi,
in: Korcelli P. (ed.), Aglomeracje miejskie w procesie transformacji: VI, Zeszyty IGiPZ PAN,
Warszawa, 42, 5–21.
Lokshin G., Chesnokova I. (1993) Highways and some ecological problems of urban areas,
Bulletin of Engineering Geology and the Environment, 47, 1, Springer, Berlin/Heidelberg,
119–125.
Martinez F., Araya C. (2000) Transport and land-use benefi ts under location externalities,
Environment and Planning A, 32, 9, 1611–1624.
Petrović M. (2001) Post-socialist Housing Policy Transformation in Yugoslavia and Belgrade,
European Journal of Housing Policy,1, 2, 211–231.
Pichler-Milanovich N. (2001) Urban Housing Markets in Central and Eastern Europe: Conver-
gence, Divergence or Policy ‘Collapse’, European Journal of Housing Policy, 1, 2, 145–187.
Solnes J., Porgeirsson A. (2006) Environmental and socio-economic evaluation of four differ-
ent sites for a domestic airport, Environmental Modeling and Assessment, 11, 1, Springer
Netherlands, 59–68.
Timár J., Váradi M. M. (2001) The Uneven Development of Suburbanization during Transi-
tion in Hungary, European Urban and Regional Studies, 8, 4, Sage Publications, 349–360.
Tosics I. (2004) European urban development: Sustainability and the role of housing, Journal
of Housing and the Built Environment, 19, 1, Springer Netherlands, 67–90.
Piotr Trzepacz, Joanna Więcław-Michniewska
http://rcin.org.pl

TOWARDS A COMMON EUROPEAN TRANSPORT SYSTEM
http://rcin.org.pl

http://rcin.org.pl
TOWARDS A COMMON EUROPEAN PASSENGER RAILWAY SYSTEM
JUSTYNA BAGIŃSKA
Institute of Geography and Regional Development
University of Wrocław
Plac Uniwersytecki 1, 50-137 Wrocław, Poland
e-mail: [email protected]
Abstract. The full liberalization of passenger railway transport is scheduled for
1st January 2010. It is expected that by this time, both the technical and legal inter-
operability of European railways will have been achieved. This article discusses
the current legislative, infrastructural and organizational undertakings aiming at
creating a competitive and modern railway transport system on a pan-continental
scale, as well as gives an example of good practices in this fi eld.
Key words: railway passenger transport, legal interoperability, technical interoper-
ability, joint undertakings
INTRODUCTION
The full liberalization of passenger railway transport in European Union is scheduled for
1st January 2010 and it is expected that by this time both the technical and legal interoperabil-
ity will have been achieved. There are a number of important factors shaping and infl uencing
the emergence of a single European passenger railway system. This article discusses the cur-
rent legislative, infrastructural and organizational undertakings aiming at creating a competi-
tive and modern railway transport system on a pan-continental scale. Moreover, the article
gives an example of authentic attempts to create a common market in the sector of passenger
railways. As it will be shown on the example of Railteam - the newly created joint undertaking
of European high-speed operators, cooperation and joint actions may be the keys to making
railways more competitive with regards to other modes of transport, and more attractive to
the passengers.
LEGISLATIVE ACTIONS
The context of a common European transport policy has largely changed with the EU’s
enlargement in 2004 and 2007 – an act that has substantially increased the length of the railway
network, enlarged its spatial scope and added several players to the railway market, but also
EUROPA XXI2007, 16: 81-86
http://rcin.org.pl
82 Justyna Bagińska
largely diversifi ed the quality of the railway network and services. EU enlargement apart, other
factors infl uencing the evolution of common transport policy, as indicated in the mid-term
review of the Community’s 2001 White Paper1, are: changes within transport industry, which
is becoming more and more innovative, EU’s environmental commitments and the need to
rationalize energy consumption, new international context including globalization, terrorism
and emerging competitive Asian markets.
The most important documents infl uencing European transport policy, with regards to
passenger railways, are the 2001 Transport White Paper and the EU Directives concerning
passenger transport, together with some Regulations and Decisions. Whilst the former
document contains aims and measures for the achievement of sustainable transport system,
the latter documents aim at ensuring its legal interoperability.
The 2001 Transport White Paper proposed 60 measures2 for the successful transport policy.
Amongst these measures there were calls for the revitalization of railways. However, most
of the proposed measures dealt with freight transport and only some of them addressed pas-
senger transport issues. As a result, “the effects of the White Paper on passenger transport
are minimal”3 in comparison to the effects on freight transport. The so-far implementation of
measures aiming at the revitalization of railway passenger transport (directly and indirectly)
was summarized in the White Paper mid-term review4:
- completed implementation of the First Railway Package
(Directives 2001/12/EC, 2001/13/EC and 2001/14/EC)
- ongoing implementation of the Second Railway Package
(Directives 2004/49/EC, 2004/50/EC and 2004/51/EC)
- creation of European Railway Agency in 2004 by the 881/2004 EC Regulation
- revision of TEN-T (Trans-European Transport Network) projects by the Decision 884/2004/EC
and Regulation 807/2004.
Unfortunately, the Third Railway Package, containing some important legal regulations
concerning gradual opening-up of international passenger services is still being under discus-
sion. Despite the foreseen adoption of the Package in the fi rst semester of 2007, no binding
decisions have been made by October 2007. Several other measures are still to be introduced,
namely the issues of:
- funding of TEN-T in the 2007–2013 period
- funding of infrastructure in the New EU Member States
- proposal for a Regulation on the protection of international rail passengers
(COM (2004) 143 fi nal)
- proposal for a Regulation concerning public services of passenger transport by rail and by
road (COM (2005) 319 fi nal)
Intergovernmental Organisation for International Carriage by Rail (OTIF) is another
important player on the European railway scene as far as legal matters are concerned.
1 “Keep Europe Moving”. Sustainable mobility for our continent. Mid-term review of the European Commission’s 2001 transport White Paper, Offi ce for Offi cial Publications of the European Communities, Luxembourg 2006.
2 White Paper. European Transport Policy for 2010: time to decide. Brussels, 12.9.2001 COM(2001) 370 fi nal, p. 12.3 The Impact Assessment of the Communication “Keep Europe Moving”. Sustainable mobility for our continent.
Mid-term review of the European Commission’s 2001 Transport White Paper, Commission Staff Working Document, Brussels 2006.
4 Ibidem, pp. 47–63.
http://rcin.org.pl

83Towards a common European passenger railway system
At present, OTIF has 42 member states in Europe, North East and North Africa. OTIF aims
at establishing and developing a uniform system of law for carriage of passengers and goods
in international rail traffi c by rail between its member states. First, and foremost OTIF
safeguards the enforcement of the Convention concerning International Carriage by Rail
(COTIF), which in its amended version entered into force on 1 July 20065. Appendix A to
COTIF deals with passenger rights (CIV Uniform Rules). Unfortunately, just before signing
the agreement for the accession of the European Community to COTIF in 2006, the European
Commission objected to appendices E, F and G, claiming them contradictory to the EU law.
This has hindered the implementation of COTIF in EU and resulted in the need to renegotiate
the agreement.
INFRASTRUCTURAL UNDERTAKINGS
As far as infrastructural undertakings are concerned, the most important of these are the so-
-called TEN-T lines. These are the core infrastructural lines together with traffi c management
and navigation systems important for the cohesion or EU regions and ensuring proper fl ow
of goods and passengers. As a result of the 2004 revision of TEN-T priority projects, 19 out
of total 30 projects are thought to be relevant to the passenger railway transport. However,
the budgetary means that can be spent on the realization of these projects amount only to
€ 7.2 billion, which is signifi cantly less than the initially proposed €20 billion6. In 2005, also as
a result of TEN-T revision, six European coordinators were appointed to supervise fi ve priority
projects and the ERTMS (European Rail Traffi c Management System) project. The projects
were:
- railway axis: Berlin–Verona/Milan–Bologna–Naples–Messina–Palermo (project no 1)
- high-speed railway axis of south-west Europe (project no 3)
- railway axis Lyon–Trieste–Divaca/Koper–Divaca–Ljubljana–Budapest–Ukrainian border
(project no 6)
- railway axis Paris–Strasbourg–Stuttgart–Vienna–Bratislava (project no 17)
- ‘Rail Baltica’ axis Warsaw–Kaunas–Riga–Tallinn–Helsinki (project no 27)
The axes are shown on Figure 1.
The task of coordinators was to harmonize the actions of infrastructure managers from
the participating countries and to create annual reports specifying the necessary actions aiming
at increasing the corridor’s competitiveness. The reports also dealt with the assessment of
possible fi nancial resources for the successful realization of the projects. Moreover, specifi c
technological solutions have been proposed for the implementation of the ERTMS scheme.
So far, each coordinator has presented the European Commission with two annual reports:
the fi rst one in July 2006, and the other one in July 20077. Thanks to the efforts of the coordi-
nators, the realization of these multinational projects runs more smoothly and there is strong
probability of them being carried out in accordance with the schedule.
5 CIT Annual Report 2006, p. 176 European Commission: Building our common future: Policy challenges and budgetary means of the Enlarged
Union 2007–2013, February 2004, COM (2004) 101 fi nal.7 The reports are available at: http://ec.europa.eu/ten/transport/coordinators/index_en.htm
http://rcin.org.pl

84 Justyna Bagińska
RECENT UNDERTAKINGS OF ORGANIZATIONS SUPPORTING PASSENGER RAILWAYS
There are several European-wide organizations, that are concerned with railway passenger
transport and aim at improving its position on the market. Among these, Community of Euro-
pean Railways and Infrastructure Companies (CER), International Union of Railways (UIC)
and International Rail Transport Committee (CIT) are perhaps the most infl uential. Their
activities range from putting forward legal proposals through carrying out research projects to
lobbying for the development of railways. Some of their recent successful initiatives include
signing of a Charter on Rail Passenger Services and setting up of a website for passengers:
www.railpassenger.info.
Figure 1. Five TEN-T priority projects with Coordinators
Source: based on TEN-T map available at:
http://ec.europa.eu/ten/transport/priority_projects_minisite/map_en.htm
http://rcin.org.pl

85Towards a common European passenger railway system
On 22 October 2002, CER, UIC and CIT signed a Charter on Rail Passenger Services.
This common initiative, which was approved by all the undertakings operating in the EU
in 2002, introduced a compensation mechanism for train delays during the day and included
an obligation of railway operators to offer better passenger services. According to the CER
Annual Report 2005/2006, the implementation of the Charter in EU countries was high, with
23 companies in 19 countries having either published their own commitment scheme based
on the Charter, or having linked the Charter with their national terms and conditions8. These
commitments for better quality services concern, amongst others, information on luggage and
bicycles transport, information on intermodal connections, punctuality information, refunds,
delay assistance and delay compensation, safety and security. It is vital to say that the Charter,
or any document based on it, is a voluntary commitment, therefore it is a sign of genuine effort
on railway operators’ part to attract customers and guarantee the best services possible.
An internet site: www.railpassenger.info, which is somewhat complementary to the Passen-
ger Charter, was set up in 2006. Its aim is to inform passengers of their rights when they travel
by train across Europe and to make the journey easier. The site is available in English, French
and German. Apart from useful information on passenger rights, the site contains links to par-
ticular railway operators, timetable search engine and information on compensation schemes
in case of delays.
Multiple European Integrated Timetable Storage, Price and Fare Information System
(MERITS-PRIFIS) is another example of a joint undertaking aiming at better railway pas-
senger services: 32 railway companies have cooperated in the creation of the fi rst module
(MERITS)9. The goal of the project is to create an integrated European database containing
information on price, linked with European MERITS train timetable, which has been opera-
tional since 200210. The data in MERITS is updated on a monthly basis. Once fully operable,
the system will be benefi cial both for sales staff, as well as general public, providing them with
instant access to uniformed, non-discriminatory information on prices and timetables.
AN EXAMPLE OF GOOD PRACTICES
In July 2007, high speed rail operators launched Railteam, a joint undertaking that will
facilitate cross-border travel by high-speed train in Europe. The aim of the undertaking is to
offer comfortable high-speed train journeys across Europe, without unnecessary stops and
complicated booking procedures. Railteam has been formed by: SNCF (France), DB (Germa-
ny), NS Hispeed (Netherlands), Eurostar (UK, France and Belgium), ÖBB (Austria), SNCB
(Belgium) and SBB (Switzerland), as well as two of their high-speed subsidiaries Thalys and
LyriaGermany. The network is shown on Figure 2. It has fi ve major hubs: Brussels, Lille, Stutt-
gart, Cologne and Frankfurt.
The journeys by Railteam trains between major European centres of business, culture and
commerce will defi nitely become competitive with travel by plane and by car. Out of the wide
range of services, “hop on the next train” seems quite utilitarian: in case of delays, the passen-
8 CER Annual Report 2005/2006, p. 19.9 http://www.uic.asso.fr/baseinfo/projet/projet.php?id=310 International Union of Railways Annual Report 2006, p. 95
http://rcin.org.pl

86 Justyna Bagińska
gers will be able to get on the next train going in the required direction.
The emergence of Railteam is a clear proof that, given good will, railway companies can
cooperate to achieve common goals. By acting together, railways can work out ways to make
train journeys attractive and increase their productivity.
CONCLUDING REMARKS
The article has presented selected legal, infrastructural and operational undertakings that
aim at achieving a liberalized and competitive passenger railway market within European
Union. As of 1st January 2007, the railway freight market has been fully liberalized, and inevi-
tably passenger market will have to follow. However, one has to remember that there are still
serious legal and infrastructural hindrances to be overcome in order that the liberalization
could take place. These hindrances are, amongst others: the need to harmonize COTIF and
EU laws, to work out common regulations on the protection of international rail passengers
and regulations concerning public services of passenger transport by rail, the need to over-
come infrastructural and organizational differences, and last but not least, to fi nd funds for
the necessary investments.
Figure 2. Railteam network
Source: http://www.railteam.eu/
http://rcin.org.pl

DIRECT INTERNATIONAL PUBLIC TRANSPORT CONNECTIONS
OF REGIONAL CENTRES IN SLOVAKIA
DANIEL MICHNIAK
Institute of Geography, Slovak Academy of Sciences
Štefánikova 49, 814 73 Bratislava
e-mail: [email protected]
Abstract: Direct international transport connections are mostly established between
main population centres and those of economic growth and indicate existence
of various relationships (economic, political, and cultural). Numerous connections
with many countries point to the strength of individual centres and to some extent,
they refl ect their competitive position. This article is devoted to the analysis of
the position of regional centres in Slovakia (Bratislava, Košice, Prešov, Nitra, Žilina,
Banská Bystrica, Trnava and Trenčín) on the basis of direct international public
transport connections. Type of connections (train, bus, air and boat connections),
intensity (number of connections a week) and the directions of connections (coun-
tries, cities) are analysed.
Key words: public transport, direct international transport connections, train con-
nections, bus connections, air connections, boat connections, regional centres, com-
petitive position, Slovakia
INTRODUCTION
Research of spatial relations between various spatial units (settlements or regions) is one of
the traditional fi elds of geographical research. It focuses on the movement of population,
goods, capital, and information that takes place via transport or communication networks
by various transport and communication means. The nature of spatial relationships beyond
the boundaries of individual countries is special because the existence and rate of these
relationships is signifi cantly infl uenced by the nature of the particular boundary. In the conse-
quence of globalization and the changing geo-political situation in Europe, the international
linkages also change. After 1989, the political situation in Slovakia changed. The fact mani-
fested in change of orientation of foreign trade, entry of foreign investments, development
of tourism and increasing commuting abroad, as well as the development of transboundary
cooperation in the boundary regions. New economic, social and cultural relationships between
Slovakia and other countries are being formed.
EUROPA XXI2007, 16: 87-100
http://rcin.org.pl

88 Daniel Michniak
International linkages can be classifi ed into four groups according to their nature – eco-
nomic, social, political, and other (Komornicki 2003), while the individual types are inter-
linked. The manifestations of economic linkages are fl ows of goods and movement of capital,
and the manifestations of social linkages are permanent or temporary migrations including
tourism. Political are in form of international cooperation of local and regional self-adminis-
trations, which also include the cross-boundary cooperation. Other linkages cover the trans-
port connections and interactions by means of information and communication technologies.
Massive investments into the development of transport and communication systems support
the development of international relationships and cause reduction of distances in the world
where mutual dependence of individual places and regions increases.
International transport linkages can be studied from various aspects such as the trans-
boundary transport infrastructure, transport of persons and goods or regular international
transport connections. This study concentrates on the existing direct international public
transport connections that refl ect existence of international linkages of various nature.
As the direct transport connections are founded as rule between the main settlement centres
and those of economic growth, the direct transport connections between regional centres and
foreign countries will be dealt with.
Slovakia is divided into eight administrative regions with centres in Bratislava, Košice,
Prešov, Nitra, Žilina, Banská Bystrica, Trnava and Trenčín (see Figure1). These towns are also
centres of higher self-administrative units. The fi rst seven of them are the biggest towns of
Slovakia and Trenčín ranks ninth in population (following the town Martin). Regional towns
are also the biggest commuting centres with at least 10 thousand commuters (Michniak 2005)
and the highest number of jobs concentrates in them. Numerous public transport connection
with many countries point to the strength (economic and population potential) of individual
centres and to some extent they also refl ect their competitive position.
The aim of this paper is to analyse the direct public transport connections of eight regional
towns in Slovakia with foreign countries (type of transport connections, intensity and direc-
tions) and an attempt to identify factors determining spatial arrangement of linkages.
Figure 1. Location of individual regional centres in Slovakia
http://rcin.org.pl

89Direct international public transport connections of regional centres in Slovakia
One of the premises of the research into international connections is the assumed exist-
ence of very strong transport linkages with the Czech Republic, which in turn refl ect the bonds
of the two countries formed before they split in 1993 (commuting to work, schools, family
relationships). Intensity of these linkages is still high and so is the intensity of regular direct
transport linkages.
Among those geographers who dealt with the direct transport linkages is for instance
T. Komornicki (2002, 2003) who studied spatial differentiation of international socio-economic
linkages in Poland. D. Seidenglanz (2005, 2006) was involved with direct international connec-
tions of Prague and Bratislava. A. Winder et al. (2001) studied transboundary public transport
in urbanized areas of Europe in terms of effects of the existing barriers (natural, administra-
tive and cultural) attributable to the frontiers. V. Székely (2004) studied direct transport con-
nections of district towns in Slovakia. M. Halás (2005) dealt with transboundary linkages and
cooperation on the example of the Slovak-Czech boundary regions.
DIRECT INTERNATIONAL PUBLIC TRANSPORT CONNECTIONS
Direct international public transport connections between Slovakia and other countries are
realized by means of railway, road, air and water transport. The data used in research of
direct international transport connections by public transport (number, intensity and routes)
were obtained from bus and railway schedules as of April 2007 (www.cp.sk, www.zsr.sk),
the sailing itinerary of companies Slovenská plavba a prístavy, a.s. and Central Danube Region
Marketing & Development GmbH, the later operating the connection between Bratislava
Figure 2. Direct international connections of Bratislava
http://rcin.org.pl

90 Daniel Michniak
and Vienna by boat TWIN CITY LINER, and the fl ight schedules of the Slovak airports for
summer 2007. In case of train connections, the direct carriages to some countries were also
taken into account. Two-way connections were considered only. Intensity of connections was
Figure 3. Direct international connections of Žilina
Figure 4. Direct international connections of Košice
http://rcin.org.pl

91Direct international public transport connections of regional centres in Slovakia
expressed by their number per one week. In case of seasonal connections, their number was
recalculated for the period of the whole year (for instance 3 connections a week during four
months = 1 connection a week during the whole year).
Figure 5. Direct international connections of Trenčín
Figure 6. Direct international connections of Prešov
http://rcin.org.pl
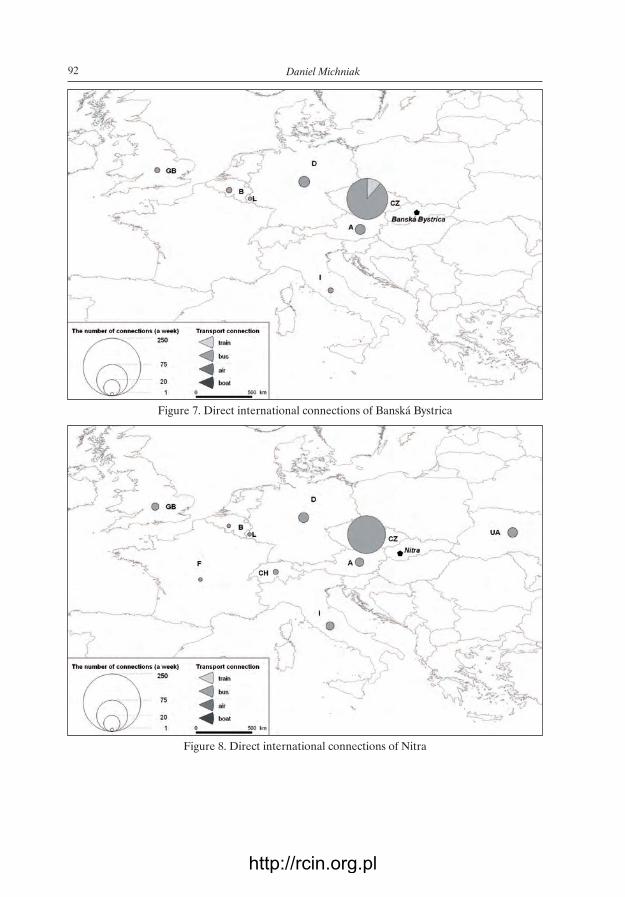
92 Daniel Michniak
Figure 7. Direct international connections of Banská Bystrica
Figure 8. Direct international connections of Nitra
http://rcin.org.pl

93Direct international public transport connections of regional centres in Slovakia
TRAIN CONNECTIONSTrain connections in international transport are among the most stable ones and greatly
depend on the existing transport infrastructure. There are several technical differences in
construction of railways of the individual countries (different type of electrifi cation, different
security and information systems or different wheel gauge), that constitute barriers in the deve-
lopment of international transport and their harmonization requires large investments.
Disadvantage of railway transport is its price, which in many cases exceeds that of bus transport.
Therefore, there is an effort to overcome this disadvantage using various discounts compared
with prices of international tariff in passenger railway transport. The Slovak railway company
ZSSK provides such discounts for journeys to all neighbouring countries. Advantages of rail-
way transport lie in its comfort above all in case of long distance travel. Importance of railway
in international transport increases due to the construction of high-speed routes connecting
several European countries.
Slovakia is connected with 12 European countries via direct international train connec-
tions. Table 1 summarises the number of connections from individual regional administrative
centres.
The strongest position in international railway transport among the regional centres has
Bratislava and it is the most important railway node in Slovakia. Bratislava was also the fi rst
town in Slovakia where the railway transport was introduced. Intensity of direct international
connections is high (481 connections a week to 12 countries) and this position is caused by
the vicinity of Austrian Vienna as the centre of European signifi cance and also by the fact that
Bratislava is part of the Pan-European transport corridors nos. IV and V. There are 375 con-
nections a week between Bratislava and Vienna what represents average 53 two-way connec-
Figure 9. Direct international connections of Trnava
http://rcin.org.pl

94 Daniel Michniak
tions a day. In the majority of cases, they are regional trains between Bratislava and Vienna via
border crossings Devínska Nová Ves–Marchegg and Petržalka–Kitsee. However, apart from
them there are also two trains of the InterCity category on the track Bratislava – Košice. More-
over, there is a project for connection the two neighbouring airports by high-speed railway.
Its realisation will mean further increase of connections between Bratislava and Vienna.
As far as intensity of railway connections with Bratislava is concerned, those with the Czech
Republic rank second (84 connections a week) on route Bratislava–Břeclav–Brno–Prague,
followed by connections with Hungary on routes Bratislava–Štúrovo–Budapest and Bratislava
–Rajka–Budapest (50 connections a week) and connections with Germany (21 connections
a week). In average, at least one train connection a day exists between Bratislava and Poland,
Ukraine, Belarus, Russia, and Romania. Connections with Bulgaria, Greece and Croatia also
exist for tourists during summer period.
Apart from Vienna and the settlements on the both routes to Vienna (Marchegg 201,
Bruck a. d. Leitha 169, Kittsee 167, Parndorf 153, Gattendorf, Neudorf and Pama 148 each,
Gramatneusiedl 133 Schönfeld-Lassee 68, Gänserndorf 63, Siebenbrunn-Leopoldsdorf 56,
Oberweiden and Weikendorf both 49 connections a week), Bratislava is well connected by rail-
way with towns in the Czech Republic (Břeclav 84, Brno 49, Prague 42, Kolín and Pardubice 35
Česká Třebová 28, Děčín, Lanžhot and Ústí nad Labem 21 connections), Hungary (Budapest
50, Györ 22, Rajka 22, Hegyeshalom 21 connections) and Germany (Bad Schandau, Dresden
both 21 connections).
The second to the most important centre of international railway transport in Slovakia
is Žilina (162 international train connections a week to 8 countries) situated on the route
of two Pan-European corridors nos. V and VI. Position of Žilina is important above all for
railway connections with the Czech Republic (99 a week) and Poland (35 a week) i.e. more
than Bratislava. Besides, it also has direct transport connections with Austria (21 a week) and
Table 1. Direct international train connections of regional towns (average number of connections a week)
Bratislava Trnava Trenčín Nitra ŽilinaBanská Bystrica
Prešov Košice
Austria 375.0 14.0 14.0 - 21.0 - - 21.0
Bulgaria 1.5 - - - - - 0.3 0.3
Belarus 7.0 7.0 7.0 - 7.0 - - -
Czech Republic
84.2 - - - 99.0 14.0 - 28.0
Germany 21.0 - - - 7.0 - - 7.0
Greece 0.5 - - - - - - -
Hungary 50.2 7.0 7.0 - 7.0 - 7.0 42.3
Croatia 0.2 - - - - - - -
Poland 7.0 7.0 7.0 - 35.0 - 7.0 7.0
Romania 8.5 - - - - - 0.3 0.3
Russia 7.0 7.0 7.0 - 7.0 - - -
Ukraine 7.0 7.0 7.0 - 7.0 - - 7.0
http://rcin.org.pl

95Direct international public transport connections of regional centres in Slovakia
Hungary, Ukraine, Belarus, Russia and Germany (7 connections a week each). Žilina is best
connected with the settlements in the Czech Republic (Hranice na Moravě 59, Horní Lideč 50, Česká Třebová, Český Těšín, Kolín, Olomouc, Ostrava, Pardubice, Prague and Třinec
49 each, Bohumín and Jablunkov – Návsí 42 each, Valašské Meziříčí and Vsetín 33 each Karv-
iná 28, Zábřeh na Moravě 27, Střelná 22, Havířov, Přerov, Studénka and Suchdol nad Odrou
21 each), in Poland (Zwardoň 35, Bielsko-Biala, Czechowice Dziedzice and Żywiec 21 each)
and Vienna (21 connections a week). Commuters to work and universities mostly use connec-
tions with the Czech Republic.
The third most important regional town in terms of direct train connections with foreign
countries is Košice (105 connections a week to 8 countries), best connected with Hungary,
Czech Republic and Austria. Besides, Košice is directly connected with Poland, Ukraine, and
Germany and in summer with Bulgaria and Romania. Individual settlements best connected
with Košice include the Hungarian settlement Hidasnémeti (49 connections a week), situated
on the border with Slovakia followed by town Miskolc (35) and other settlements on the track
Košice – Miskolc (Forró-Encs, Onga and Szikszó 28 each, Aszaló, Csobád, Halmaj, Hernád-
szurdok, Ináncs, Méra and Novajidrány 21 each) and some on the extension of the track to
Budapest (Füzesabony 28, Nyékládháza, Mezökövesd and Budapest 21 each). There are more
than 20 connections a week between Košice and several towns in the Czech Republic (Česká
Třebová, Kolín, Olomouc, Pardubice a Prague 28 each and Hranice na Moravě 21).
Direct international railway transport in other regional towns plays only supplementing
role. Position of Trenčín and Trnava is similar. Direct railway connections from these towns
via 28 international connections a week are to Austria (14 a week) and to Poland, Hungary,
Ukraine, Russia and Belarus (7 a week). Banská Bystrica is directly connected only with
the Czech Republich (14 connections a week). Prešov is directly connected via 7 railway
connections a week with Hungary and Poland (train Krakow – Budapest) and also with Bul-
garia and Romania in summer. Nitra has not direct railway connections with foreign countries
in the consequence of its situation in the railway network of Slovakia.
The international railway connections of Slovakia with foreign countries are most intensive
between Bratislava and Vienna. The remaining railway connections are oriented to the former
socialist countries, where the connection with the Czech Republic dominates. The main long-
distance route is still the track that connects several capitals of these countries (Berlin – Prague –
– Budapest – Bucharest). There is no direct railway connection with other western European
countries with the exception of Austria and Germany.
BUS CONNECTIONSThe demand for the international bus connections increased in the consequence of increased
travel and tourism following the political changes in Europe in 1989. The development of bus
connections is also favoured by the European motorway network, which facilitates rapid trans-
port to a great part of the European continent. The advantage of bus transport is the fact that
it can serve the greatest number of destinations compared to other transport means. Another
advantage of bus transport is its lower price compared to the railway or air transport. Opera-
tors of bus lines above all the long-distance ones also try to provide a reasonable comfort (air
conditioning, video, refreshments) in competition with the railway transport. Position of bus
terminals in the vicinity of town centres is the additional advantage.
http://rcin.org.pl

96 Daniel Michniak
Direct international bus lines connect Slovakia with 17 countries of Europe. The most
important node of international bus transport is Bratislava with 347 bus connections a week to
16 countries. In difference from train connections where those with Austria prevail, the highest
number of Bratislava’s international bus connections is with the Czech Republic, particularly
to its most important centres Brno (133) and Prague (96). Almost a third of international bus
connections heads from Bratislava to Austria and above all to Vienna do (115). These bus lines
also provide for connection of Bratislava with Vienna’s airport in Schwechat. A comparatively
good connection is that of Bratislava with Hungary (Budapest, Györ, Mosonmagyaróvár 21 times
a week), Germany (München and Stuttgart 10, Frankfurt am Main and Ulm 9, Augsburg 8),
Bulgaria (Sofi a 15) and Switzerland (St.Gallen and Zürich 12, Basel, Bern, Geneve and
Lausanne 8). There is least one connection a day with Great Britain (London 9), Italy (Udine
and Venezia 8), Ukraine (Uzhorod 7) and France (Lille 5, Strasbourg 4). The absenting direct
bus connection of Bratislava with Poland is interesting.
Estimating by the number of international connections, the second to the most important
regional town is Trenčín (204 connections to 9 countries a week), but almost 9/10 of them head
to the Czech Republic (Brno 139, Prague 103). Then the connections to Germany (Frankfurt
am Main and Nürnberg 5), Austria (Vienna 6), Switzerland (St.Gallen and Zürich 5), Italy,
Netherlands, Belgium and Great Britain follow.
Almost identical situation is that in international bus connections of the regional town
Žilina (191 connections to 9 countries a week), with the prevailing connections to the Czech
Republic (Brno 108, Prague 98, and Olomouc 57) and other to Germany (Düsseldorf, Frank-
furt am Main, Nürnberg 4), Switzerland (St. Gallen and Zürich 5), Austria (Vienna), Nether-
lands, Italy, Belgium and Great Britain.
Košice follows Žilina as far as the number of international bus connection is concerned
(155 connections a week), but Košice rank second by the number of countries it is connected
with (15). Approximately 2/3 of all connections head to the CR (Prague 93, Brno 90), followed
by Ukraine, (13 to Uzhgorod), Germany (11), Italy (7) Switzerland (6), and Hungary, Nether-
lands, Great Britain (4 each).
Prešov is connected with 10 countries via 151 bus connections. The best bus connection of
Prešov is that with the Czech Republic (85 % of all connections) particularly with Prague (90),
Brno (79), and Olomouc (38). There is also a good connection with Germany, Switzerland,
Italy and Netherlands.
Nitra ranks sixth in the international bus transport (133 connections to 10 countries) while
it is the only means of direct connection of the town with other countries. Like in case of other
towns, connections with the CR prevail (81 % of all connections) – Brno (100) and Prague (53).
There is also a good connection with Germany, Ukraine, Austria, Italy, and Great Britain.
The last by one position in terms of number of international connections corresponds
to Banská Bystrica (124 connections with seven countries). Apart from obvious prevalence
of connections with the CR (90%), important bus connections of Banská Bystrica are with
Germany and Austria. Trnava has the least number of direct international bus connections
(only 70 a week to 10 countries). Connections with the CR prevail (77%), followed by those
to Austria, Germany and Italy.
Connection with the Czech Republic, particularly Brno and Prague dominates in all bus
connections of regional towns with foreign countries. Slovak commuters to work in the Czech
http://rcin.org.pl

97Direct international public transport connections of regional centres in Slovakia
Republic, Germany and UK use bus connections above all; commuters working in Slovakia
use connections with Ukraine. Apart from that they also serve to tourists travelling to Italy,
Croatia, France and UK (London). Slovakia is connected via bus lines with some places with
important airports in Western Europe (Frankfurt am Main, Amsterdam, Munich). In case of
some bus lines (to Sofi a and Budapest) Bratislava represents the transiting point because they
start from Prague.
AIR CONNECTIONSThe signifi cance of air has increased recently in terms of international passenger transport.
The principal advantage of air transport is its velocity which was also corresponded by higher
prices in past. But low-cost airlines entered the market a few years ago and compete with low
prices above all in form of special offers. Disadvantages of the air transport include the situ-
ation of airports on peripheries of cities what requires use of other transport means to reach
the city centres. Air transport is highly depending on the existing transport infrastructure – inter-
national airports number of which is small compared to bus or railway stations. Air companies,
can very quickly respond to changes in demand for the services with either cancelled or newly
introduced connections.
Slovakia has six international airports in Bratislava, Košice, Žilina, Poprad, Piešťany and
Sliač. Only Piešťany lacks a regular international connection. Only three of regional towns
Table 2. Direct international bus connections of regional centres (average number of connections a week)
Bratislava Trnava Trenčín Nitra ŽilinaBanská Bystrica
Prešov Košice
Austria 116.4 7.5 6.0 5.5 4.0 7.5 3.0 3.5
Belgium 6.3 1.0 3.3 1.0 2.0 2.3 3.3 2.3
Bulgaria 15.0 - - - - - 0.5 0.5
Czech Republic
155.0 54.0 181.0 108.0 173.0 112.0 129.0 102.0
Germany 18.0 6.5 9.3 7.5 7.0 8.8 8.3 11.8
France 12.8 1.0 1.0 - - - 1.0
Great Britain 9.3 2.0 2.0 4.0 2.0 2.0 2.0 4.0
Greece 2.0 - - - - - - -
Hungary 21.0 - - - - - - 4.2
Croatia 2.0 0.8 0.8 - 0.8 - - 0.3
Switzerland 12.0 2.0 5.0 2.0 5.0 - 5.0 6.0
Italy 9.2 5.0 4.0 5.0 3.0 2.0 5.0 7.0
Luxembourg 1.0 1.0 - 1.0 - 1.0 - 1.0
Netherlands 4.5 - 4.0 - 4.0 - 4.0 4.0
Poland - - - - - - 1.8 1.8
Ukraine 7.0 - - 7.0 - - - 13.0
Serbia 2.0 - - - - - - -
http://rcin.org.pl

98 Daniel Michniak
have air connections with foreign countries.
Position of Bratislava is dominant in air transport having regular air connection with
28 cities in 16 countries, and 143 regular fl ights a week. The most intensive air connection of
Bratislava is with Great Britain with 34 fl ights including 25 fl ights to London; 26 fl ights to Ger-
many (l9 fl ights to Munich a week); 26 fl ights to Prague in the Czech Republic follow. As far as
other countries are concerned, there is an important air connection with Italy (14 to Milan and
Rome) France (11 connections to Paris), Ireland (7 connections to Dublin) and Netherlands
(7 connections to Amsterdam). During the summer season there is air connection with Greece
(Athens and Thesaloniki), Croatia (Dubrovnik and Split), Bulgaria (Bourgas and Varna), with
additional destinations in Italy (Catania and Naples), and Spain (Malaga and more fl ights
to Barcelona ). These connections serve above all to Slovak tourists. Overseas connections
only comprise Amritsar in India, Tel Aviv in Israel and Kuwait. Regular fl ights to Amritsar
(the spiritual and cultural centre of the Sikh Religion in the Indian state Punjab) are secured
by the airlines owned by the British enterpriser of Indian origin. Indians living in Western
Europe make use of this link while Bratislava is the transiting point. Flights to India are har-
monized with fl ights from the Western Europe, above all from London, Birmingham, Milan
and Köln. The regular connections with Moscow and Brussels were cancelled in 2007 although
their reopening is considered again.
Košice has air connection only with Prague (26) and Vienna (11) and air connection to
London and Dublin will be opened soon. Žilina is only connected with Prague (7 connections).
Air connections of Slovakia with Poland, Ukraine and Hungary do not exist. Above all con-
nections of Bratislava with Poland and Ukraine would be desirable although these countries
are not as attractive for Slovaks as to use the air transport for visiting them. Air connection
with these countries is available from the Vienna airport. Connection of Bratislava with this
airport is provided for by regular bus links.
BOAT TRANSPORT ON THE DANUBE RIVERWater transport plays only a supplementing role in the international personal transport in
Slovakia. The regular boat transport is seasonal with its peak in summer months and tourists
almost exclusively use it. The only international connection is on the river Danube (Pan-Euro-
pean Transport Corridor No. VII) between Bratislava and Vienna and Bratislava and Budapest.
Boat connections between Bratislava and Vienna provide two companies by hydrofoil and
high-speed catamaran with as many as 31 connections a week in summer. The once-in-a-day
line between Bratislava and Budapest operates from mid-April to October. There use to exist
a stop in Bratislava of the boat operating between Passau and Budapest but it was cancelled
and so was the regular link between Bratislava and the Austrian Hainburg mainly used for
advantageous duty-free shopping before accession of Slovakia to the EU. It now only operates
as the line for organized groups.
CONCLUSIONS
Regional centres in Slovakia are connected with 26 countries via four types of international
public transport connections (train, bus, air and boat connections). International public trans-
http://rcin.org.pl
99Direct international public transport connections of regional centres in Slovakia
port connections depend to large extent on existing transport infrastructure. Except for Bra-
tislava, where the rail connections prevail, in other regional centres bus connections prevail.
Nitra is connected with other countries only by bus transport. International air connections
are possible mainly from the Bratislava airport (28 destination, 16 countries) and airports in
regional centres Košice and Žilina. International boat connections in Slovakia exist only
between Bratislava and Vienna, and Bratislava and Budapest and their function is only com-
plementary especially for tourists.
Bratislava with 992 connections to other countries a week has a dominant position in
the international public transport in Slovakia, which is caused by its size, function and geograp-
hical location. Bratislava has the strongest connection with Austria and its capital – Vienna
(in average 61 connections daily), which is located in the 60 km distance from Bratislava.
Compared to other regional towns, Bratislava is best connected with 20 countries. Only
from Bratislava is a possible public transport connection to six countries. Merely in case of
three countries, other regional towns are in the best position. Position of Žilina is the best in
connections to the Czech Republic and Poland and Košice is best for connections to Ukraine.
According to the intensity of international direct public transport connections, Žilina
(359 connections a week), Košice (297), Trenčín (232), Prešov (158), Banská Bystrica (138)
and Nitra (133) follow Bratislava. On the other side, Trnava (98) has the weakest position.
The remaining regional centres are best connected with the Czech Republic and its largest
centres Prague and Brno. The transport links with the Czech Republic service commuters
to work and universities, and people who have social contacts with inhabitants of the Czech
Republic (many of them are from the period of the common state before splitting in 1993).
Within the international public transport, connections to Hungary, Germany, Poland and
Great Britain also play an important role. Connections to Germany and UK serve also for
the purpose of work migration.
Direct international transport connections refl ect the wide spectrum of mutual relation-
ships between Slovakia and other countries (economic, political, cultural). Position of individ-
ual regional centres also depends on population size of regional centres, quality of transport
infrastructure and geographical location. All mentioned factors contribute to the best position
of Bratislava. Žilina with its favourable location in the north-western part of Slovakia ranks
second. As the international transport (bus) connections are mostly oriented to the Czech
Republic and the EU countries situated west of Slovakia, position of Bratislava Trenčín, Žilina
and Nitra lying on important transport routes leading from easterly areas of Slovakia is advan-
tageous from the point of view of international public transport connections.
ACKNOWLEDGEMENT
This article was prepared as part of the Project No. 2/6038/26 „Economic performance and
competitiveness of localities and regions“, funded by the Slovak VEGA Grant Agency.
http://rcin.org.pl

100 Daniel Michniak
REFERENCES
Halás M. (2005) Cezhraničné väzby, cezhraničná spolupráca: na príklade slovensko-českého
pohraničia s dôrazom na jeho slovenskú časť, Univerzita Komenského, Bratislava.
Komornicki T. (2003) Przestrzenne zróżnicowanie międzynarodowych powiązań społeczno-
-gospodarczych w Polsce, Prace Geografi czne, 190, IGiPZ PAN, Warszawa.
Komornicki T. (2002) Bezpośrednie powiązania transportowe polskich województw z zagranicą, Prace Komisji Geografi i Komunikacji PTG, 8, 159–180.
Michniak D. (2005) Dochádzka do zamestnania do krajských miest na Slovensku v roku 2001,
in: Vaishar A., Ira V. (eds.) Geografi cká organizace Česka a Slovenska v současném období,
Ústav geoniky Akademie věd ČR, Brno, 53–64.
Seidenglanz D. (2005) Přímá železniční spojení z Prahy a Bratislavy (vliv politických a spole-
čenských změn), Acta Facultatis Rerum Naturalium Universitatis Comenianae, Geographica,
Supplementum, 3, 535–542.
Seidenglanz D. (2006) International railway transport in the Czech Republic and in Slovakia,
in: History of transport, traffi c, and mobility, Université Paris 1 Panthéon Sorbonne – Ecole
Nationale des Ponts et Chaussees, Paris, CD-ROM, 1–9.
Székely V. (2004) Priame dopravné prepojenia okresných miest Slovenska. Prace Komisji Geog-
rafi i Komunikacji PTG, 10: 281-302.
Winder A., Krug S. and Meinhard D. (2001) Cross-border public transport in Europe: overcoming
the barriers, Association for European Transport, London.
http://rcin.org.pl

WHOSE IS ROSPUDA?
LOCAL, REGIONAL, NATIONAL, EU AND GLOBAL PERSPECTIVES
OF A CONFLICT BETWEEN ENVIRONMENT PROTECTION
AND INFRASTRUCTURE BUILDING IN AUGUSTÓW (POLAND)
ROMAN SZUL
Centre for European Regional and Local Studies
University of Warsaw
Krakowskie Przedmieście 30, 00-927 Warszawa
University of Finance and Management
Ciepła 40, 15-472 Białystok, Poland
Abstract. The confl ict about building a ring road of Augustów (north-eastern
Poland), badly needed for a dramatic increase of traffi c of lorries between Baltic
states and the rest of the UE, through the valley of Rospuda river, protected
under the Natura 2000 EU-sponsored scheme, is an example of diverging points of
view, interests and legitimacy of the parties involved:
1) local inhabitants and democratically elected local government fi rmly supporting
a project of building the road through the valley (the project, prepared after sev-
eral years of studies, includes some measures to reduce its impact on the natural
environment) and rejecting other proposals for their requiring more time to wait,
2) inhabitants of Podlaskie voivodship backing in a region-wide referendum the pro-
ject (participation was rather low),
3) the central government which in 2007 fi rmly backed the project,
4) the European Commission opposing the project for its presupposed violation of
EU regulations on natural environment protection (the EC demanded to stop
building),
5) environment protection activists as self-appointed defenders of interests of
humankind opposing the project. The confl ict between the Polish government
and the EC should be resolved by the European Court of Justice.
Key words: Rospuda river, Augustów (north-eastern Poland), confl ict between
environment protection and infrastructure building
Rospuda is a geographical name – name of a small river in north-eastern Poland. It became
famous in Poland in 2007 for the confl ict about the project of building a ring road through
Rospuda valley to bypass the town of Augustów. This confl ict highlights the problem of differ-
EUROPA XXI2007, 16: 101-106
http://rcin.org.pl
102 Roman Szul
ent perspectives and interests of various actors, or would-be ”owners of Rospuda”, claiming
the right to decide on the issue. The aim of this paper is just to present these perspectives and
interests, without going into technical and legal details.
The Rospuda problem is one of side-effects of the political, social and economic transfor-
mations in Central and Eastern Europe after 1989–91. The breakdown of the Soviet Union
in 1991, emergence of independent Lithuania, Latvia and Estonia, their growing economic
exchanges with Poland and countries of the European Union (especially after May 1st 2004
when they, together with Poland and some other countries, joined the EU) led to a dramatic
increase in traffi c on the only road connecting them with Poland and the rest of the EU. This
road, once a small local road, leads through the town of Augustów in north-eastern Poland,
near the Polish-Lithuanian border. In order to present the change in the role of this border and
of this road it is enough to mention that until the breakdown of the USSR there were no cross-
ing point on the Polish-Lithuanian section of the Polish-Soviet border. The whole exchange
of goods and persons between Poland and the three Baltic republics, otherwise rather modest
and using overwhelmingly railway transport, bypassed this section, going mostly through
the territory of the Byelorussian SSR. Also the transit from those republics to the Western
Europe though Poland bypassed Augustów. Opening up of crossing points on the Polish-
-Lithuanian border in the 1990s and problems with crossing the Byelorussian border (Byelorus-
sia-Polish and Byelorussian-Lithuanian) for vehicles from foreign countries made that
the (almost) whole road transportation between Poland and the Baltic state used these cross-
ing points and the road leading through Augustów.
In such a way, the growing traffi c going through Augustów, especially of big lorries started
to seriously affect living conditions of its inhabitants, to the extent that it became dangerous
for lives of pedestrians and local car-drivers (many accidents caused by the lorries). The traffi c
was especially dangerous for school children having to cross the road in their way to school.
Noise, air pollution and ground vibrations added to the problem.
To solve the problem, the idea of building a ring road of Augustów was launched.
The problem of tracing the road was not easy given that the town is surrounded by ecologically
valuable areas of the Rospuda valley (forest, moors with rich fl ora and fauna). It took years to
select a project approved by local authorities, ministries in the central government in Warsaw
and by the building company which had to build the road. According to this project the road
had to cross the Rospuda valley. In order to reduce the negative impact of the road, it had
to ”jump over” a part of the valley with a high bridge and an area had to be re-forested as
a compensation for cutting down of the forest for the road. At the beginning of 2007 building
works started. The crucial point is that the area to be cut through by the road was covered by
the EU-wide Natura 2000 scheme.
The beginning of the works was protested by ecologists – voluntaries (e.g. Green Peace), mos-
tly young people from outside the area, including from abroad. They came in and personally
stopped the building (by climbing the trees, etc), and, more importantly, alarmed public opin-
ion in Poland and abroad and, fi rst of all, the European Union. The problem got high publicity
in Poland and within the ecological movement world-wide. In several cities in Poland defend-
ers of the natural environment organized demonstrations and happenings in protest against
the building of the road through the Rospuda valley. In response, inhabitants of Augustów
lead by the local government organized counter-demonstrations in Augustów and in the camp
http://rcin.org.pl

103Whose is Rospuda? Local, regional, national, EU and global perspectives ...
of ecologists in the Rospuda valley. (Due to the presence of police the two camps were sepa-
rated and only verbal expressions of anger of the two sides took place). It should be stressed
that inhabitants of Augustów and its local government as well as local branches of all parties
fi rmly back the project of building the road across Rospuda valley. The argument repeated by
them is that humans are also a part of natural environment and should be protected, not only
”frogs and birds”.
Ecologists, not to be blamed for ignoring needs of the local population, or simply to gain
time, presented an alternative proposal of the trace of the road – so-called ”Chodorki variant”
(after the name of a village in which the road should cross the river). According to this pro-
posal the road should cross the river in an ecologically less valuable area, where the valley is
much narrower. This project, which otherwise was not a professional project and had not take
into consideration technical, economic and legal aspects of the problem, required removal
(demolishing) of some farm buildings and cutting though several farms. Owners of those farms
and buildings warned that they would not agree, and organized another ”anti-ecological” dem-
onstration. It was clear that the alternative project would require more years for fulfi llment,
even when the owners of the farms would change their minds and agree to sell their property
(expropriation, although legally possible, would be very hard to execute). After years (about
ten years) of waiting for preparations and deliberations of the offi cially approved project nei-
ther local authorities nor local inhabitants were inclined to start a new round of preparation
and rejected the proposal.
European Commission, in defence of the Natura 2000 scheme, ordered to stop building
works and the re-forestation. In this moment building works were carried out outside the area
covered by the Natura 2000 scheme. The central government tried to persuade the Commis-
sion to change its stance using both legal and practical arguments. According to the legal argu-
ment, the decision to build the road was taken before the accession of Poland into the EU and,
consequently the EU has no legal power to stop the building works. The practical argument
stressed importance of the ring road for the local inhabitants and for the smooth transport
between the Baltic states and the rest of the EU.
In order to strengthen its position vis-à-vis the European Commission, the Polish central
government in April organized a region-wide referendum in Podlaskie voivodship (region).
It had to take place together with regional by-elections. The result of the referendum would
not be binding. In such a way, however, the central government suggested that inhabitants of
the region had a say in the issue. Although vast majority of those who took part in the refer-
endum supported the offi cial project, the participation was rather low (less than 30%) and
the referendum hardly strengthened the position of the government. In Augustów the partici-
pation was very high and an overwhelming majority backed the offi cial project.
The disagreement between the Polish government and the European Commission led to
a open confl ict. The then government argued that the ruling of the Commission violated
national sovereignty of Poland and was dangerous for the programme of modernization of
Poland because it would be easy now to stop any infrastructure project for ecological rea-
sons. This confl ict has to be decided upon by the European Court of Justice. Despite its mili-
tant declarations, the government ordered to stop works until the decision of the Court. For
the time being (November 2007) the Court has not expressed its opinion and the building works in
the protected area are suspended.
http://rcin.org.pl
104 Roman Szul
As can be seen from the above presentation, there are several ”owners” of Rospuda, with
different perspectives, values, interests and legitimacy:
- Local community of Augustów and its democratically elected local government. Their im-
mediate and urgent interest is getting rid of the traffi c from the town. They would accept any
project, but the time factor makes that the only project that could be fulfi lled in a reason-
able time is the offi cial project, therefore they support it. They use to say that their inter-
ests should have priorities over protection of ”frogs and birds” and they, as those who are
directly affected, have the moral and political right to decide. Representatives of the local
self-government stress their democratic legitimacy to decide, in contrast – in their opinion – to
those who have not such a democratic legitimacy, e.g. the ”self-appointed” defenders of
natural environment who live outside the area, or ”clerks in Brussels.” One of results of
the confl ict is the negative attitude of the local inhabitants towards the European Union.
Until the outbreak of the confl ict this town was highly ”Euroenthusiastic”.
- Inhabitants of Podlaskie voivodship. Their rights as ”co-owners” of Rospuda result from
the referendum organized by the central government. Those who were active enough to ex-
press their opinion supported inhabitants of Augustów.
- Poland represented by the central government. During the height of the crisis the govern-
ment fi rmly supported the offi cial project stressing both political rights of Poland to decide
on what happens on its national territory and the needs to develop infrastructure threaten
by protests of ecologists. According to the government, the measures aimed to reduce the ne-
gative impact of the offi cial project on the natural environment are suffi cient to accept this
project, and the project itself is legal. The ”defence of national sovereignty” in the confl ict
with the European Commission was in line with the general rhetoric of the then ”Euroscepti-
cal” government. The change of the government after the October 21th 2007 general election
may change the attitude of the government.
- European Union represented by the European Commission. The EC strongly opposes the offi -
cial project for two reasons: for its would-be illegality and for its negative impact on the envi-
ronment, especially because protection of the natural environment is on the top of ”European
values”. The EC rejects legal arguments of the Polish government. Interests of the local com-
munity and principles of local democracy and subsidiarity seem to be of lesser relevance for
the EC. The EC also argues that the shape of the area protected by the Natura 2000 scheme
was determined by the Polish side and therefore its protection is obligation of Poland.
- Humankind represented by defenders of natural environment living outside the area. Their in-
terest, according to their opinion, is protection of the natural environment of Rospuda valley
in the name of long-term interests of humankind. According to them the offi cial project
threatens the natural environment and the alternative project is realistic. Interests of the local
community of Augustów are of secondary importance because local inhabitants don’t under-
stand the value of natural environment, the need for its protection and are narrow-minded.
Defending the right cause, according to the defenders of natural environment, gives them
legitimacy to do so. The viewpoint represented by ecological activists is shared by a part of
public opinion in Poland and infl uential media, especially those in opposition to the then
government. For those media, the Rospuda issue was another evidence of the lack of profes-
sionalism of the government and of its inability or unwillingness to solve problems in rela-
tions with the EU.
http://rcin.org.pl
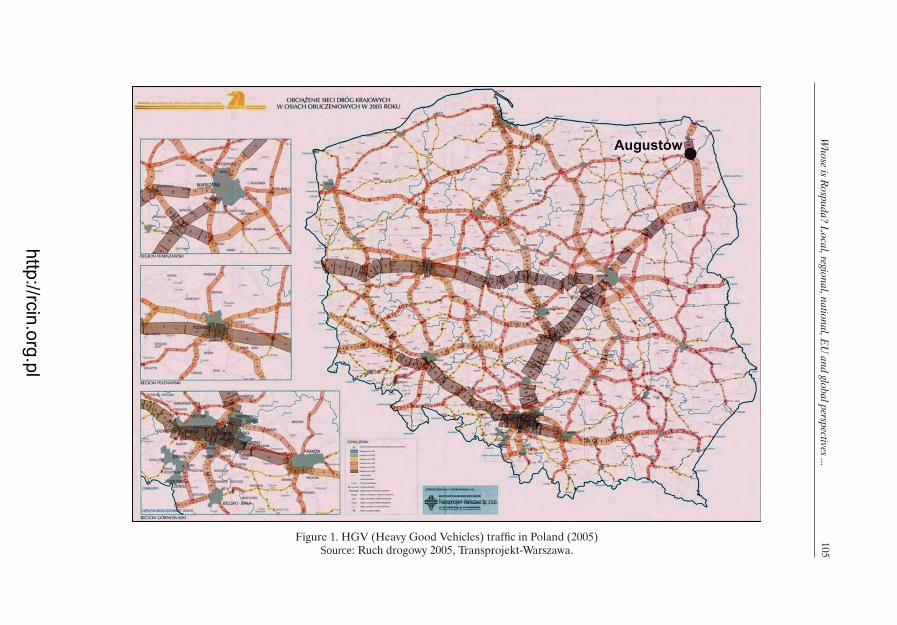
105
Wh
ose is R
osp
ud
a? L
oca
l, region
al, n
atio
na
l, EU
an
d glo
ba
l persp
ectives ...
Figure 1. HGV (Heavy Good Vehicles) traffi c in Poland (2005)Source: Ruch drogowy 2005, Transprojekt-Warszawa.
http://rcin.org.pl

106 Roman Szul
As can be seen from the above discussion, the ”Rospuda problem” illustrates the dilemma of
to what extent a local community has the right to dispose of natural wealth that can be conside-
red world’s natural heritage, and vice versa, to what extent a larger community (as the Euro-
pean Union and ecological activists) may impose its values while ignoring their impact on local
community and ignoring local democracy. A typical answer to such a dilemma is to try to fi nd
a compromise solution satisfying both sides, which, for instance, would imply additional costs
(more expensive technologies saving natural environment) and additional time (to fi nd a so-
lution and to materialize it). In the case of the ”Rospuda problem” the time factor is also at
stake, so that it makes the problem even harder.
http://rcin.org.pl

TOWARDS DEEPER COHESION OF BORDER AREAS
http://rcin.org.pl

http://rcin.org.pl

FREE ZONES ON THE EU BORDERS AS THE RESPONSE ON REDUCTION
OF DAILY COMMUTING THROUGH THE SOUTHERN EU BORDER
DAVID BOGATAJ and MARIJA BOGATAJ
Free Zone Ribnik, Ribnik bb
47272 Ribnik, Croatia
e-mail: [email protected]
University of Ljubljana, Faculty of Economics
Kardeljeva ploščad 17, 1000 Ljubljana, Slovenia
e-mail: [email protected]
Abstract. We are following a short-term and long term changes of migration activi-
ties after the dissolution of Yugoslavia, from Slovenian perspectives. The current
situation is marked by increasing mobility inside Enlarged Europe (EU 25) with
positive net migration in Slovenia and very low population territorial mobility across
the Southern border, which got the characteristics of Schengen border. The paper
gives the forecast of daily commuting across the border and migrations of popula-
tion on the border also after accession of Croatia to EU, and shows, how Free Zones
contribute to the stable demographic development in the period between dissolu-
tion of Yugoslavia and expected Croatian accession to EU. Improved Lowry – like
model with embedded parameters of waiting lines on the border crossings is used
for forecasts of migrations and daily commuting.
Keywords: Labour migration, daily commuting, Global supply chain, Free Zone,
Gravity model, Waiting lines, Schengen border
INTRODUCTION
One of contemporary dilemmas of spatial development in Europe is how to forecast the mobil-
ity as accurate as possible and how to fi nd the tools, which create the intensity and structure
of fl ows close to desired level as much as possible. The Schengen border crossings are moving
from the Ex-European borders to the South-East. This changes infl uence the socio-economic
positions of the regions along this border. For example, the contacts between Slovenian NUTS 3
regions and regions of Old EU as well as the contacts with Hungary are improved, because
of the new investments in transportation networks (in Slovenia this is the case of investments
in Corridor V and Corridor X) and shift of the previous state border crossings regimes to
the South- East. The shift of Schengen border will additionally infl uence the growth of fl ows
inside EU between member states.
EUROPA XXI2007, 16: 109-129
http://rcin.org.pl
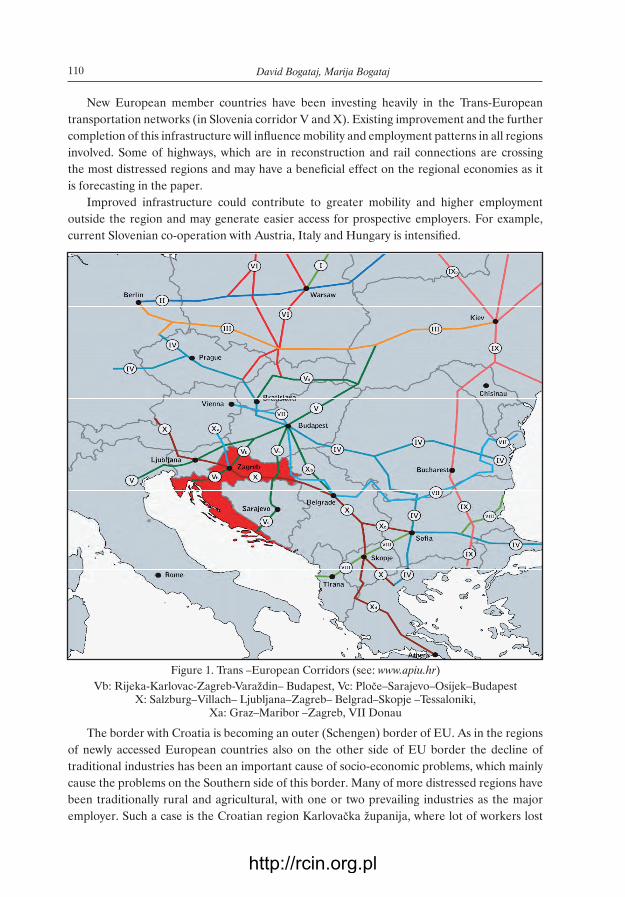
110 David Bogataj, Marija Bogataj
New European member countries have been investing heavily in the Trans-European
transportation networks (in Slovenia corridor V and X). Existing improvement and the further
completion of this infrastructure will infl uence mobility and employment patterns in all regions
involved. Some of highways, which are in reconstruction and rail connections are crossing
the most distressed regions and may have a benefi cial effect on the regional economies as it
is forecasting in the paper.
Improved infrastructure could contribute to greater mobility and higher employment
outside the region and may generate easier access for prospective employers. For example,
current Slovenian co-operation with Austria, Italy and Hungary is intensifi ed.
The border with Croatia is becoming an outer (Schengen) border of EU. As in the regions
of newly accessed European countries also on the other side of EU border the decline of
traditional industries has been an important cause of socio-economic problems, which mainly
cause the problems on the Southern side of this border. Many of more distressed regions have
been traditionally rural and agricultural, with one or two prevailing industries as the major
employer. Such a case is the Croatian region Karlovačka županija, where lot of workers lost
Figure 1. Trans –European Corridors (see: www.apiu.hr)
Vb: Rijeka-Karlovac-Zagreb-Varaždin– Budapest, Vc: Ploče–Sarajevo–Osijek–BudapestX: Salzburg–Villach– Ljubljana–Zagreb– Belgrad–Skopje –Tessaloniki,
Xa: Graz–Maribor –Zagreb, VII Donau
http://rcin.org.pl

111Free Zones on the EU borders as the response on reduction of daily commuting ...
their jobs in Slovenia by canceling of the previous work-permit scheme that allowed semi-
skilled, skilled and professional employment within Slovenia before Slovenian accession to
EU. These work permits have been introduced after dissolution of SFR Yugoslavia.
One of the responses to this state of the art was in creating new jobs in the Free zones
(FZ) on the south of EU border between Slovenia and Croatia. To establish a free zone
the key defi ning issues are:
• Leveraging the location advantages of the immediate border and reconnecting the long
established linkages of these municipalities with Slovenia as its physical and commercial
integration within the wider European market gathers pace;
• Minimizing possible threats to the border economies by protracted EU/Croatia accession
negotiations especially the tightening or in an extreme case the cancelling of the current
work-permit scheme that allows semi-skilled, skilled and professional employment within
Slovenia;
• Attracting environmentally-friendly, low impact industrial and service enterprises that recog-
nize advantage in locating in a high amenity agricultural / tourist area utilizing also a mix of
largely un-skilled and semi-skilled labour;
• Preparing an attractive investment environment using a mix of current and anticipated incen-
tives including adequately zoned, and serviced industrial land, investor-friendly regulatory
services especially, a well functioning customs inspectorate, as well as innovative linkages to
the existing FZ concessionaire and its expansion initiatives.
Considering this “border-related” framework that will drive the economic development
and local investment initiatives in border regions of Croatia on the border with Slovenia, sup-
ported by the currently well functioning public/private partnership, a possible “vision state-
ment” for free zones there could be “Free zones (FZ) are the centres for value-added manufac-
turing and services for the Free zones industrial community that enhances competitiveness of zone
and non-zone tenants within an expanding supply-chain nodes of profi table SME located within
the broad precision manufacturing clusters of NE Italy, Slovenia, SE Austria and NW Croatian
regions”.
The FZ on the Schengen border the “core business” is property development (real
estate) that includes the current zone as well as other industrial, commercial and leisure
related property investments in Croatia and beyond. The key business objective is to identify
and attract long-term tenants that are integrated either, by long-term contract or equity partici-
pation within an established supply-chain of globally trading but regionally-based corporations.
The “Mission Statement” of the management of the FZs on the Schengen border of
Croatia could be defi ned as: “The mission of the FZ is the provision of industrial premises for rent
the infrastructure in Free Zones that incorporates a services platform, which drives competitiveness
of tenant operations within a defi ned cross border supply-chain of distributed manufacturing clus-
ters in the Croatian Schengen border regions” (reduction of lead time in global supply chains and
reduction of taxes to have the equal possibilities as they are available to activity cells inside EU).
The remaining objectives within this strategic plan are:
- fi rst to defi ne the contours and elements of the services platform of the FZs on the Schengen
border, that are critical to attract and retain tenants engaged in supply-chain distributed
manufacturing;
- second to identify, which services are provided directly by FZs operations, those that are
http://rcin.org.pl

112 David Bogataj, Marija Bogataj
brokered for tenants in cooperation with local public / private stakeholders, and those, that
are purchased by the tenants directly from private providers.
The paper gives the forecast of daily commuting across the border and migrations of popu-
lation on the border also after accession of Croatia to EU and shows, how Free Zones con-
tribute to the stable demographic development. Improved Lowry – like model with embedded
parameters of waiting lines on the border is used for forecasts of migrations and daily com-
muting.
LABOR MIGRATIONS AND DAILY COMMUTING ACCROS THE REGIONAL BORDERS
Labour migration is a means of achieving economic effi ciency (appropriate skills) and equity
(Chun 1996). Thus, migration has implications for policy makers, especially those concerned
with the depressed areas. To adopt the best policy the mathematical methods supporting deci-
sions on regional policy are useful. In developed countries, state and local governments seek
to attract migration, because migrants increase employment and contribute to income equali-
zation. Schengen border regime is reducing these possibilities for the countries outside EU.
A study of migration may show us not only how these aims can be achieved, but also may
highlight other policies needed for inducing growth. The enlargement of Europe can be recog-
nized as one of the forms of transformation of approaches to globalization from multilateral
collaboration to modern alliances which are present on national and regional levels and which
infl uence increasing migrations. In this process Schengen border will be shifted several times
also between Middle European and West Balkan Countries.
In 20 years, from 1991 till 2011, the regime of cross-borders between Croatia and Slovenia
has been already and will be too changed several times: from (1) inner border of two republics
of the same federal state SFRJ, through (2) the border between two independent states, which
do not belong to EU, (3) the non Schengen border between EU member state (Slovenia) and
the state, which in not EU member (Croatia), and will be (4) the Schengen border between EU
member state (Slovenia) and the state which in not EU member (Croatia), from January 2008
and later (5) the Schengen border between EU member states (Slovenia) and (Croatia) and
fi nally to (6) the Non-Schengen border between two EU member states. How these changes
will infl uence changes in migrations and daily commuting which will infl uence also land
use in border regions is one of concerns of Slovenian Spatial planning authorities but also
the regional authorities in Croatia.
In our paper, extended Lowry-like model is presented to estimate available additional
human resources due to increased daily migrations between regions in Enlarged Europe and
expected new member country. The impact of Schengen border and other European regula-
tions on interregional fl ows of gross migration and daily commuting could stop the fl ows,
existing for centuries, like between Slovenian and Croatian NUTS 3 regions. This problem is
considered and presented in numerical example of our paper.
The growth of regions relates closely to population growth, which is mostly a result of
migration and commuting, which is becoming surrogate for migration, if the commuting is
bringing higher social well-being than any migration (Anjomani 2002). It is well known, that
migrations can also increase daily migrations if the worker found better spatial and social
http://rcin.org.pl

113Free Zones on the EU borders as the response on reduction of daily commuting ...
standards far away of his existing job location. If the contacts between regions, because of
improved transportation abilities and removed barriers – like the Schengen border is – are
becoming less expensive and easier, the inhabitants often prefer commuting (Nijkamp 1987).
Any study of migration and commuting fl ows makes better understanding of the growth of
regions and the other factors causing this growth. To be more accurately prepared for the future
growth of regions, which includes all kind of problems appearing when we have to create
new opportunities for different sectors of the regional economies, the mathematical models
help us to study different results applying decisions and their sequences as policies that could
increase the growth. The simulation approach is especially important, because the investments
in commercial buildings, residential houses and transport infrastructure (including different
public utility networks) appear active with long range time delays.
Our study attempts to fi nd the main factors of interregional migratory and commuting
fl ows in Slovenia, especially from Croatia and to Croatian border regions. Better understand-
ing of the pattern of migration and commuting will help to analyze the past policy and to sup-
port better decision making in the process of planning the investments in regions and in their
interconnections (especially roads and border crossings). It will also help to evaluate the how
the policies of free zones infl uences fl ows. However, the hypothesis have been proved in our
previous papers (Bogataj M., Drobne S. 2005; Bogataj et al. 1995; Bogataj et al. 2004) that:
(a) the time spending distances between regions are decreasing because of investments in
transportation network; (b) daily mobility (commuting) and gross migrations on the renewed
corridors are increasing and enabling better structuring of human resources according to their
skills; (c) the time spending distance of cross-border fl ows is longer because of waiting lines
on the Schengen borders when they are settled; (d) if there are no other political and legal
limitations, the impact of waiting lines can be easily forecast and optimal border capacities can
be predicted.
THE INTERREGIONAL GRAVITY MODEL
The main purpose of all Lowry-like models (Long 1966) is to forecast future changes in
the allocation of population housing, employment and land uses in urban areas. These are
basically demand-driven models in which the supply side of land is not considerably exposed
to consideration. In this paper, the main question is the reallocation of human resources due
to migrations and (daily) commuting under unconstrained possibilities of land use and com-
muting between the location of job and residential location, when taxes (free zone) are chang-
ing and accessibility is improved. The results of that kind of analysis enable us also to predict
the future need for land use, which will be infl uenced because of enlargement of Europe and
displacements of Schengen border, and to give some answer to other contemporary dilemmas
of spatial development in European regions situated along the Schengen border.
In our previous investigations (Bogataj M., Drobne S. 2005; Bogataj et al. 1995; Bogataj
et al. 2004), the model for study of regional interactions, especially of interregional migrations
and commuting between the regions of New European Member Countries has been proposed.
The use of modifi ed Lowry–like model based on time spending distance functions with embed-
ded waiting lines is suggested here.
http://rcin.org.pl
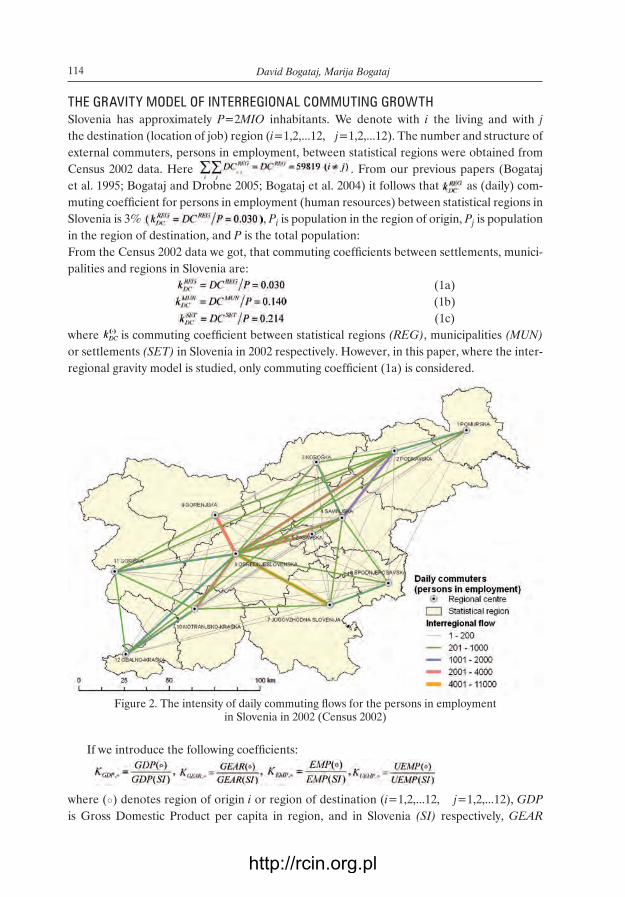
114 David Bogataj, Marija Bogataj
THE GRAVITY MODEL OF INTERREGIONAL COMMUTING GROWTHSlovenia has approximately P=2MIO inhabitants. We denote with i the living and with j
the destination (location of job) region (i=1,2,...12, j=1,2,...12). The number and structure of
external commuters, persons in employment, between statistical regions were obtained from
Census 2002 data. Here . From our previous papers (Bogataj
et al. 1995; Bogataj and Drobne 2005; Bogataj et al. 2004) it follows that as (daily) com-
muting coeffi cient for persons in employment (human resources) between statistical regions in
Slovenia is 3% , Pi is population in the region of origin, Pj is population
in the region of destination, and P is the total population:
From the Census 2002 data we got, that commuting coeffi cients between settlements, munici-
palities and regions in Slovenia are:
(1a)
(1b)
(1c)
where is commuting coeffi cient between statistical regions (REG), municipalities (MUN)
or settlements (SET) in Slovenia in 2002 respectively. However, in this paper, where the inter-
regional gravity model is studied, only commuting coeffi cient (1a) is considered.
If we introduce the following coeffi cients:
where (○) denotes region of origin i or region of destination (i=1,2,...12, j=1,2,...12), GDP
is Gross Domestic Product per capita in region, and in Slovenia (SI) respectively, GEAR
Figure 2. The intensity of daily commuting fl ows for the persons in employment in Slovenia in 2002 (Census 2002)
http://rcin.org.pl

115Free Zones on the EU borders as the response on reduction of daily commuting ...
is an average gross earning per person in region, and in Slovenia (SI) respectively, EMP is
the number of persons employed in region, and in Slovenia (SI) respectively, and UEMP is
the level of registered unemployment in region or in the country For d (○) as Euclidian
distance (e), the shortest road distance (s), as well as for the time-spending distances (t)1
we estimated the parameters of gravity model
In the regression analysis of interregional fl ows of commuters – persons in employment,
who travel by car, only the time-spending distance and coeffi cient of average gross earning
per person in region of destination, , were found that signifi cantly infl uence the fl ows
(P-values are less than 0.001). For interregional fl ows in Slovenia in 2002 the model is the fol-
lowing:
(2)
We got the regression parameters for the interregional commuting fl ow equation, where
R-square is 0.8 for 132 observations and where d(t) is time-spending distance in minutes when
travelling by car; see Table 1.
From Table 1 we can see that all P-values for all coeffi cients are very low. The regression
model of interregional commuters is very stable. The other mentioned coeffi cients have
P-value higher than 0.01.
THE GRAVITY MODEL OF INTERREGIONAL GROSS MIGRATION GROWTHPopulation growth in the regions of Slovenia is mostly the result of interregional and inter-
national migrations (Bogataj and Drobne 2005). Between the two Censuses (1991 and 2002),
the average yearly interregional gross migration in Slovenia was the following (Table 2).
In the period of Censuses 1991 and 2002, there were 5613 gross migrations between Slovenian
regions per year on average.
However, from our previous work mentioned above, we know that the expected commut-
ing fl ow from region i to j DCi,j , in respect to gross migration GMi,j and time-spending distance
di,j(t) between the origin i and destination j region, can be evaluated as follows:
(3)
1 To determine this time spending distances, before and also after investments in European corridors, OMNI-
TRANS package has been used for distances evaluation between settlements, on the bases of the road network clas-
sifi cation and GIS Slovenian road database.
Table 1. Gravity model coeffi cients and summary output for Slovenian interregional commuting (DC*i,j) – persons in employment
Name of Coeffi cients
Value of Coeffi cients in (2)
t Stat P-value Lower 95% Upper 95%
Ln(a) -10.7571 -4.1376 0.0001 -15.9016 -5.6125
αi 0.9536 7.6792 0.0000 0.7079 1.1993
αj 1.2795 8.6041 0.0000 0.9852 1.5737
- β -2.3548 -13.1222 0.0000 -2.7099 -1.9997
γ 5.4843 4.2297 0.0000 2.9185 8.0500
http://rcin.org.pl

116 David Bogataj, Marija Bogataj
Here the multiple R is 0.78 in 132 observations. A summary output of the regression statistics
is given in Table 2.T
ab
le 2
. A
vera
ge y
earl
y in
terr
egio
nal
gro
ss m
igra
tio
ns
in
Slo
ven
ia b
etw
een
Cen
suse
s 1991–2002
12
34
56
78
91
01
11
2
Pomurska
Podravska
Koroška
Savinjska
Zasavska
Spodnjeposavska
JV Slovenija
Osrednjeslovenska
Gorenjska
Notranjsko-Kraška
Goriška
Obalno-Kraška
1P
om
urs
ka
149.2
5 8
20.2
5 1.2
5 2.5
6.2
5 87.2
5 11.5
6.2
5 6.2
5 11
2P
od
ravs
ka
150.5
54.5
184.5
5
20
9.7
5162.2
5 29.5
10.7
516
32.5
3K
oro
ška
9
66.7
5 64.7
5 1
2.7
5 3.5
49
9.5
3.2
5 1.2
5 6.2
5
4S
avi
njs
ka
24.2
5182.2
566
39
53.5
14.5
190.7
5 25.5
7
10.5
32.2
5
5Z
asa
vsk
a 2.2
5 10.5
0.5
48.2
518.2
5 4.2
5 81.7
5 7.5
1.5
2.7
5 8
6S
po
dn
jep
osa
vsk
a 3.5
16.2
5 2.5
55
11
73.5
78.5
8.2
5 4
4
7.5
7JV
Slo
ven
ija
0.7
5 14.7
5 1.5
15.5
7.2
566.7
5181.2
5 17.7
5 5.7
5 4
13.2
5
8O
sred
nje
slo
ven
ska
62.2
5110.2
521
139.5
131.5
72.2
5240
529
156.7
570.5
152.5
9G
ore
njs
ka
16.2
5 34.5
7.7
5 30.2
5 7
17.7
5 26.2
5364
12.5
37.7
5 28
10
No
tran
jsk
o-K
rašk
a 3
2.7
5 0.5
5.7
5 0.2
5 3.2
5 3.2
5 90
6.5
9.7
5 40.5
11
Go
rišk
a 3.2
5 15.2
5 2.2
5 13.5
2
4.5
5.5
116.7
5 35.5
13.2
5 50
12
Ob
aln
o-K
rašk
a 10.2
5 22
3
18.5
2.7
510.2
5 10.2
5119.2
5 21.5
33.2
541.5
http://rcin.org.pl
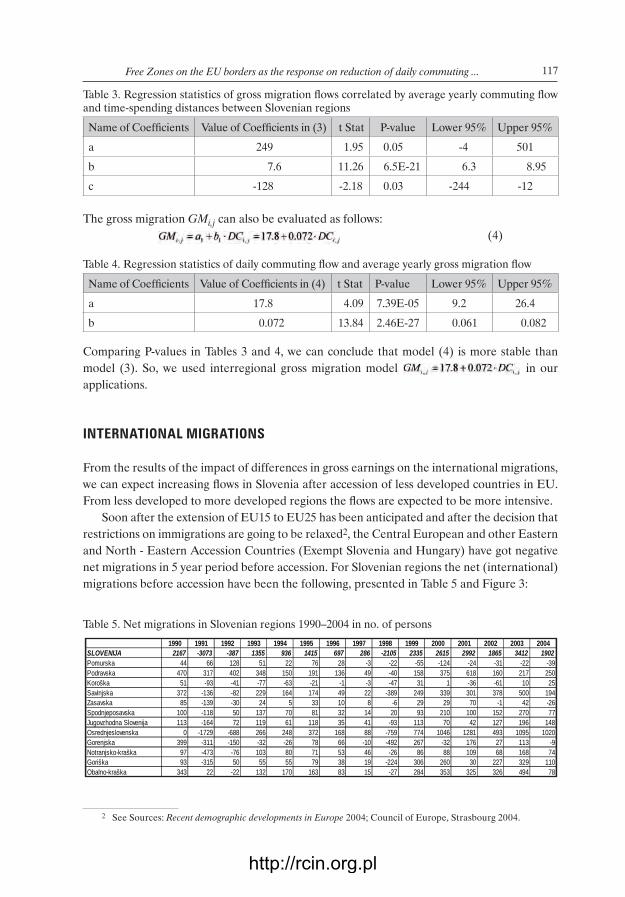
117Free Zones on the EU borders as the response on reduction of daily commuting ...
The gross migration GMi,j can also be evaluated as follows:
(4)
Comparing P-values in Tables 3 and 4, we can conclude that model (4) is more stable than
model (3). So, we used interregional gross migration model in our
applications.
INTERNATIONAL MIGRATIONS
From the results of the impact of differences in gross earnings on the international migrations,
we can expect increasing fl ows in Slovenia after accession of less developed countries in EU.
From less developed to more developed regions the fl ows are expected to be more intensive.
Soon after the extension of EU15 to EU25 has been anticipated and after the decision that
restrictions on immigrations are going to be relaxed2, the Central European and other Eastern
and North - Eastern Accession Countries (Exempt Slovenia and Hungary) have got negative
net migrations in 5 year period before accession. For Slovenian regions the net (international)
migrations before accession have been the following, presented in Table 5 and Figure 3:
2 See Sources: Recent demographic developments in Europe 2004; Council of Europe, Strasbourg 2004.
Table 3. Regression statistics of gross migration fl ows correlated by average yearly commuting fl ow and time-spending distances between Slovenian regions
Name of Coeffi cients Value of Coeffi cients in (3) t Stat P-value Lower 95% Upper 95%
a 249 1.95 0.05 -4 501
b 7.6 11.26 6.5E-21 6.3 8.95
c -128 -2.18 0.03 -244 -12
Table 4. Regression statistics of daily commuting fl ow and average yearly gross migration fl ow
Name of Coeffi cients Value of Coeffi cients in (4) t Stat P-value Lower 95% Upper 95%
a 17.8 4.09 7.39E-05 9.2 26.4
b 0.072 13.84 2.46E-27 0.061 0.082
Table 5. Net migrations in Slovenian regions 1990–2004 in no. of persons
1990 1991 1992 1993 1994 1995 1996 1997 1998 1999 2000 2001 2002 2003 2004SLOVENIJA 2167 -3073 -387 1355 936 1415 697 286 -2105 2335 2615 2992 1865 3412 1902Pomurska 44 66 128 51 22 76 28 -3 -22 -55 -124 -24 -31 -22 -39Podravska 470 317 402 348 150 191 136 49 -40 158 375 618 160 217 250Koroška 51 -93 -41 -77 -63 -21 -1 -3 -47 31 1 -36 -61 10 25Savinjska 372 -136 -82 229 164 174 49 22 -389 249 339 301 378 500 194Zasavska 85 -139 -30 24 5 33 10 8 -6 29 29 70 -1 42 -26Spodnjeposavska 100 -118 50 137 70 81 32 14 20 93 210 100 152 270 77Jugovzhodna Slovenija 113 -164 72 119 61 118 35 41 -93 113 70 42 127 196 148Osrednjeslovenska 0 -1729 -688 266 248 372 168 88 -759 774 1046 1281 493 1095 1020Gorenjska 399 -311 -150 -32 -26 78 66 -10 -492 267 -32 176 27 113 -9Notranjsko-kraška 97 -473 -76 103 80 71 53 46 -26 86 88 109 68 168 74Goriška 93 -315 50 55 55 79 38 19 -224 306 260 30 227 329 110Obalno-kraška 343 22 -22 132 170 163 83 15 -27 284 353 325 326 494 78
http://rcin.org.pl

118 David Bogataj, Marija Bogataj
As we can see the number of emigrants from Slovenian regions is increasing after 1997, but
number of immigrations have increased too, so that the net migration is positive like presented
in Table 5. The question appears, what can we expect when there will not be the border restric-
tions and emigrational limitations on the Slovenian borders. Especially we would like to get
the answer to the question what intensity of fl ows can we expect on the border between Slov-
enia and Croatia? The fi nal question is how the Free zone reduction of taxes, which infl uence
earnings compensates waiting lines on Schengen border when limitations of working permits
will not be in power any more.
MODEL APPLICATION
For forecasting the daily migrations between Slovenian regions, model (2) can be extended to
(5)
where pi is the ratio of the number of workers in i which have no problem to communicate with
j (language understanding and similar problems) and pj the ratio of employees who have no
problem to employ the workers from i. The distance function d(t) includes time distance on
the road and time required on average in waiting lines on the border:
(6)
where s,μ,λ are number of channels, frequency of services on the border and frequency of
arrivals on the border between i and j respectively.
The economic indicators are derived on the bases of mean economic characteristics, which
are belonging to total area in consideration and not only to Slovenia in total. In case when there
are no political, language and legal limitations on the border between Slovenia and Croatia,
0
500
1000
1500
2000
2500
3000
3500
1990 1991 1992 1993 1994 1995 1996 1997 1998 1999 2000 2001 2002 2003 2004
Figure 3. The yearly emigrations from Slovenian regions in the period 1990–2004 in number of persons
Pomurska Podravska Koroška SavinjskaZasavska Spodnjeposavska Jugovzhodna Slovenija OsrednjeslovenskaGorenjska Notranjsko-kraška Goriška Obalno-kraška
http://rcin.org.pl

119Free Zones on the EU borders as the response on reduction of daily commuting ...
for population on the border with similar preference on both sides of the border crossings, as
they are, using model (2) and (4), estimated numbers of commuters as well as gross migrants’
fl ows between Slovenia and Croatian border regions can be calculated. Tables 6, 7, 8 and 9
show estimated number of commuting and gross migrants’ fl ows between studied regions.
From Tables 6, 7, 8 and 9, we can fi nd that there are more commuters as well as gross
migrants, who travel/migrate from Croatia to Slovenia than in the opposite direction in
majority of the regions. But Mesto (Town) Zagreb is the unit which attracts the inhabitants
of Slovenian regions the most.
The following are the Slovenian regions, where expected yearly net migration with Mesto
Zagreb would be negative: Pomurska (-150), Koroška (-79), Savinjska (-117), Zasavska (-99),
Tab
le 6
. E
stim
ati
on
of
com
mu
ters
fro
m C
roati
an
bo
rder
regio
ns
to S
love
nia
n r
egio
ns
(wit
ho
ut
legal
rest
rict
ion
s an
d s
top
pin
g o
n t
he b
ord
er)
HR
-1H
R-2
2H
R-2
HR
-4H
R-5
HR
-8H
R-1
8H
R-2
0
To
geth
er
to
Slo
ven
ian
re
gio
n
Zagrebačka
Mesto Zagreb
Krapinsko- Zagorska
Karlovačka
Varaždinska
Primorsko-goranska
Istarska
Međimurje
To
geth
er
fro
m
Cro
ati
an
regio
n35 3
84
5016
12 0
91
3427
2428
2574
5770
2676
1401
SI-
1P
om
urs
ka
690
54
130
58
17
193
13
7218
SI-
2P
od
ravs
ka
5259
641
1546
1253
203
968
145
72
431
SI-
3K
oro
ška
176
25
60
27
922
14
712
SI-
4S
avi
njs
ka
3020
417
1006
729
139
344
148
69
167
SI-
5Z
asa
vsk
a269
49
119
27
16
19
20
910
SI-
6S
po
dn
jep
osa
vsk
a3174
823
1983
120
158
42
20
920
SI-
7JV
Slo
ven
ija
2740
542
1306
125
506
70
111
44
37
SI-
8O
sred
nje
slo
ven
ska
16 5
46
2164
5215
952
1215
795
4205
1563
437
SI-
9G
ore
njs
ka
1316
172
415
81
95
70
317
128
39
SI-
10
No
tran
jsk
o-K
rašk
a310
23
54
912
8154
45
5
SI-
11
Go
rišk
a597
56
134
24
30
23
207
111
13
SI-
12
Ob
aln
o-K
rašk
a1285
51
122
22
27
21
415
615
12
http://rcin.org.pl

120
Da
vid B
oga
taj, M
arija
Bo
gata
j
Table 7. Estimation of commuters from Slovenian regions to Croatian border regions at regime 6 (without legal restrictions and stopping on the border)
SI-1 SI-2 SI-3 SI-4 SI-5 SI-6 SI-7 SI-8 SI-9 SI-10 SI-11 SI-12
Together to
Croatian region
Po
mu
rsk
a
Po
dra
vsk
a
Ko
rošk
a
Savi
njs
ka
Zasa
vsk
a
Sp
od
nje
po
savs
ka
JV S
love
nij
a
Osr
ed
nje
slo
ven
ska
Go
ren
jsk
a
No
tran
jsk
o-K
rašk
a
No
tran
jsk
o-K
rašk
a
Pri
mo
rsk
a
Together from Slovenian region 12 759 377 1733 173 1375 257 4249 1659 1695 512 202 212 315
HR-1 Zagrebaćka 624 23 117 12 94 18 324 122 102 31 8 10 8
HR-22 Mesto Zagreb 7468 280 1399 139 1123 218 3879 1462 1216 369 99 125 101
HR-2 Krapinsko- zagorska 53 9 77 4 56 3 16 10 15 5 1 2 1
HR-4 Karlovačka 34 1 5 1 4 1 8 14 7 2 1 1 1
HR-5 Varaždinska 39 32 68 4 30 3 6 6 14 5 1 2 1
HR-8 Primorsko-goranska 596 7 34 8 43 10 10 32 256 74 73 50 90
HR-18 Istarska 276 3 14 3 17 4 4 11 80 25 18 23 112
HR-20 Međimurje 12 22 18 1 9 1 2 2 5 2 0 1 0
http://rcin.org.pl
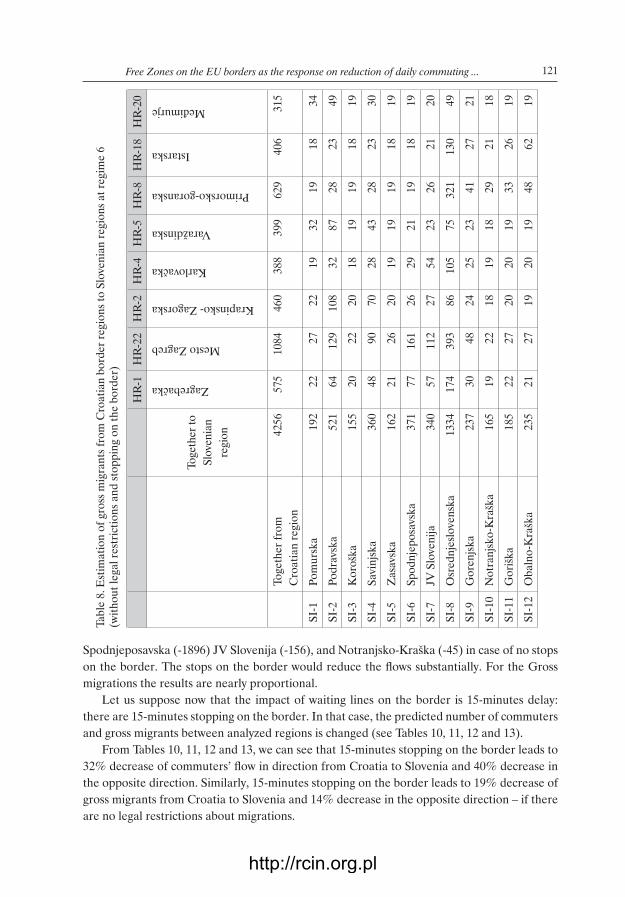
121Free Zones on the EU borders as the response on reduction of daily commuting ...
Spodnjeposavska (-1896) JV Slovenija (-156), and Notranjsko-Kraška (-45) in case of no stops
on the border. The stops on the border would reduce the fl ows substantially. For the Gross
migrations the results are nearly proportional.
Let us suppose now that the impact of waiting lines on the border is 15-minutes delay:
there are 15-minutes stopping on the border. In that case, the predicted number of commuters
and gross migrants between analyzed regions is changed (see Tables 10, 11, 12 and 13).
From Tables 10, 11, 12 and 13, we can see that 15-minutes stopping on the border leads to
32% decrease of commuters’ fl ow in direction from Croatia to Slovenia and 40% decrease in
the opposite direction. Similarly, 15-minutes stopping on the border leads to 19% decrease of
gross migrants from Croatia to Slovenia and 14% decrease in the opposite direction – if there
are no legal restrictions about migrations.
Tab
le 8
. E
stim
ati
on
of
gro
ss m
igra
nts
fro
m C
roati
an
bo
rder
regio
ns
to S
love
nia
n r
egio
ns
at
regim
e 6
(w
ith
ou
t le
gal
rest
rict
ion
s an
d s
top
pin
g o
n t
he b
ord
er)
HR
-1H
R-2
2H
R-2
HR
-4H
R-5
HR
-8H
R-1
8H
R-2
0
To
geth
er
to
Slo
ven
ian
regio
n
Zagrebačka
Mesto Zagreb
Krapinsko- Zagorska
Karlovačka
Varaždinska
Primorsko-goranska
Istarska
Međimurje
To
geth
er
fro
m
Cro
ati
an
regio
n
4256
575
1084
460
388
399
629
406
315
SI-
1P
om
urs
ka
192
22
27
22
19
32
19
18
34
SI-
2P
od
ravs
ka
521
64
129
108
32
87
28
23
49
SI-
3K
oro
ška
155
20
22
20
18
19
19
18
19
SI-
4S
avi
njs
ka
360
48
90
70
28
43
28
23
30
SI-
5Z
asa
vsk
a162
21
26
20
19
19
19
18
19
SI-
6S
po
dn
jep
osa
vsk
a371
77
161
26
29
21
19
18
19
SI-
7JV
Slo
ven
ija
340
57
112
27
54
23
26
21
20
SI-
8O
sred
nje
slo
ven
ska
1334
174
393
86
105
75
321
130
49
SI-
9G
ore
njs
ka
237
30
48
24
25
23
41
27
21
SI-
10
No
tran
jsk
o-K
rašk
a165
19
22
18
19
18
29
21
18
SI-
11
Go
rišk
a185
22
27
20
20
19
33
26
19
SI-
12
Ob
aln
o-K
rašk
a235
21
27
19
20
19
48
62
19
http://rcin.org.pl
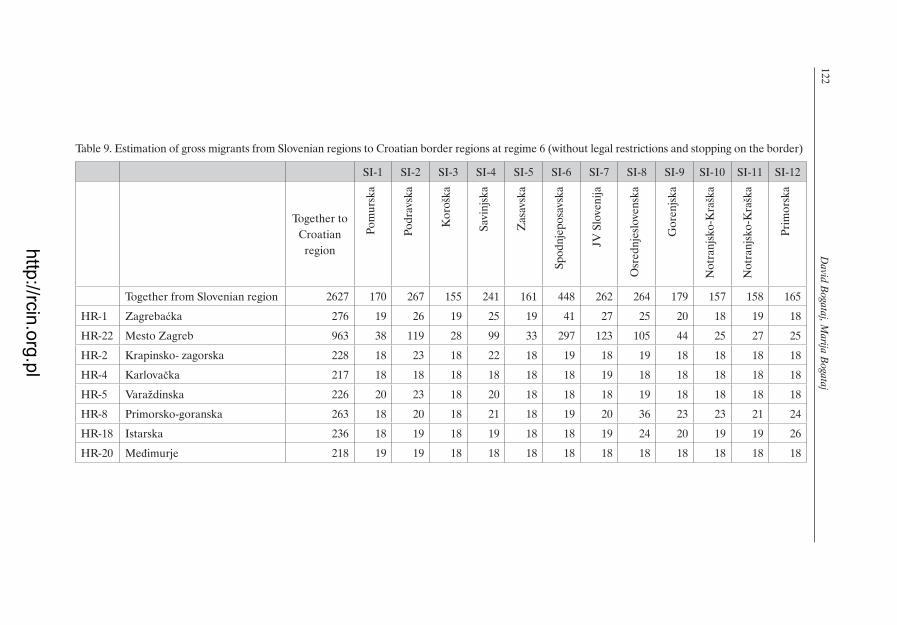
122
Da
vid B
oga
taj, M
arija
Bo
gata
j
Table 9. Estimation of gross migrants from Slovenian regions to Croatian border regions at regime 6 (without legal restrictions and stopping on the border)
SI-1 SI-2 SI-3 SI-4 SI-5 SI-6 SI-7 SI-8 SI-9 SI-10 SI-11 SI-12
Together to
Croatian
region
Po
mu
rsk
a
Po
dra
vsk
a
Ko
rošk
a
Savi
njs
ka
Zasa
vsk
a
Sp
od
nje
po
savs
ka
JV S
love
nij
a
Osr
ed
nje
slo
ven
ska
Go
ren
jsk
a
No
tran
jsk
o-K
rašk
a
No
tran
jsk
o-K
rašk
a
Pri
mo
rsk
a
Together from Slovenian region 2627 170 267 155 241 161 448 262 264 179 157 158 165
HR-1 Zagrebaćka 276 19 26 19 25 19 41 27 25 20 18 19 18
HR-22 Mesto Zagreb 963 38 119 28 99 33 297 123 105 44 25 27 25
HR-2 Krapinsko- zagorska 228 18 23 18 22 18 19 18 19 18 18 18 18
HR-4 Karlovačka 217 18 18 18 18 18 18 19 18 18 18 18 18
HR-5 Varaždinska 226 20 23 18 20 18 18 18 19 18 18 18 18
HR-8 Primorsko-goranska 263 18 20 18 21 18 19 20 36 23 23 21 24
HR-18 Istarska 236 18 19 18 19 18 18 19 24 20 19 19 26
HR-20 Međimurje 218 19 19 18 18 18 18 18 18 18 18 18 18
http://rcin.org.pl

123
Free Z
on
es on
the E
U b
ord
ers as th
e respo
nse o
n red
uctio
n o
f da
ily com
mu
ting ...
Table 10. Estimation of commuters from Croatian border regions to Slovenian regions at regime 5 and existing capacities on border crossings (without legal restrictions and with 15-minutes stopping on the border)
HR-1 HR-22 HR-2 HR-4 HR-5 HR-8 HR-18 HR-20
Together to Slovenian
region
Change because of stopping
Zagre
bačk
a
Mest
o Z
agre
b
Kra
pin
sko
- Z
ago
rsk
a
Karl
ovačk
a
Vara
ždin
ska
Pri
mo
rsk
o-g
ora
nsk
a
Ista
rsk
a
Međi
mu
rje
Together from Croatian region 23 900 3362 8104 2141 1657 1767 4000 1892 976
Change because of stopping -32% -33% -33% -38% -32% -31% -31% -29% -30%
SI-1 Pomurska 436 -37% 41 99 40 14 112 11 6 112
SI-2 Podravska 3390 -36% 448 1080 675 150 581 119 60 278
SI-3 Koroška 136 -23% 20 47 19 7 16 11 6 9
SI-4 Savinjska 2026 -33% 293 705 406 102 231 117 56 117
SI-5 Zasavska 193 -28% 35 83 18 12 14 16 7 8
SI-6 Spodnjeposavska 1351 -57% 333 802 66 82 29 16 7 15
SI-7 JV Slovenija 1681 -39% 330 795 86 267 53 85 35 29
SI-8 Osrednjeslovenska 12196 -26% 1625 3917 722 895 629 2891 1165 352
SI-9 Gorenjska 1008 -23% 134 322 63 72 57 230 98 32
SI-10 Notranjsko-Kraška 208 -33% 18 42 7 9 7 90 30 4
SI-11 Goriška 460 -23% 46 110 20 24 19 148 82 11
SI-12 Obalno-Kraška 816 -37% 42 101 18 22 18 266 339 10
http://rcin.org.pl
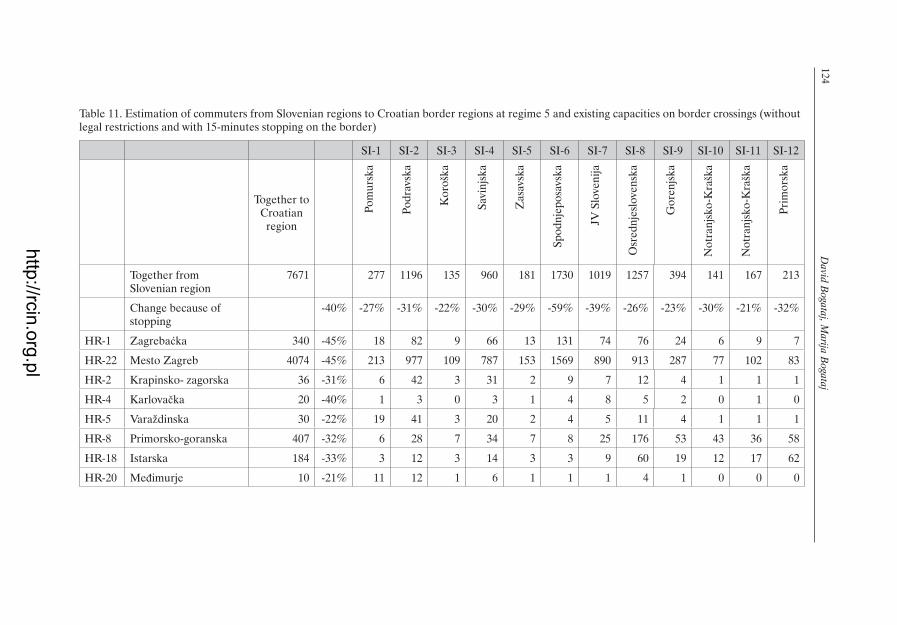
124
Da
vid B
oga
taj, M
arija
Bo
gata
j
Table 11. Estimation of commuters from Slovenian regions to Croatian border regions at regime 5 and existing capacities on border crossings (without legal restrictions and with 15-minutes stopping on the border)
SI-1 SI-2 SI-3 SI-4 SI-5 SI-6 SI-7 SI-8 SI-9 SI-10 SI-11 SI-12
Together to Croatian
region
Po
mu
rsk
a
Po
dra
vsk
a
Ko
rošk
a
Savi
njs
ka
Zasa
vsk
a
Sp
od
nje
po
savs
ka
JV S
love
nij
a
Osr
ed
nje
slo
ven
ska
Go
ren
jsk
a
No
tran
jsk
o-K
rašk
a
No
tran
jsk
o-K
rašk
a
Pri
mo
rsk
a
Together from Slovenian region
7671 277 1196 135 960 181 1730 1019 1257 394 141 167 213
Change because of stopping
-40% -27% -31% -22% -30% -29% -59% -39% -26% -23% -30% -21% -32%
HR-1 Zagrebaćka 340 -45% 18 82 9 66 13 131 74 76 24 6 9 7
HR-22 Mesto Zagreb 4074 -45% 213 977 109 787 153 1569 890 913 287 77 102 83
HR-2 Krapinsko- zagorska 36 -31% 6 42 3 31 2 9 7 12 4 1 1 1
HR-4 Karlovačka 20 -40% 1 3 0 3 1 4 8 5 2 0 1 0
HR-5 Varaždinska 30 -22% 19 41 3 20 2 4 5 11 4 1 1 1
HR-8 Primorsko-goranska 407 -32% 6 28 7 34 7 8 25 176 53 43 36 58
HR-18 Istarska 184 -33% 3 12 3 14 3 3 9 60 19 12 17 62
HR-20 Međimurje 10 -21% 11 12 1 6 1 1 1 4 1 0 0 0
http://rcin.org.pl

125
Free Z
on
es on
the E
U b
ord
ers as th
e respo
nse o
n red
uctio
n o
f da
ily com
mu
ting ...
Table 12. Estimation of gross migrants from Croatian border regions to Slovenian regions at regime 5 and existing capacities on border crossings (without legal restrictions and with 15-minutes stopping on the border)
HR-1 HR-22 HR-2 HR-4 HR-5 HR-8 HR-18 HR-20
Together to Slovenian
region
Decrease because of stopping
Zagre
bačk
a
Mest
o Z
agre
b
Kra
pin
sko
- Z
ago
rsk
a
Karl
ovačk
a
Vara
ždin
ska
Pri
mo
rsk
o-G
ora
nsk
a
Ista
rsk
a
Međi
mu
rje
Together from Croatian region 3430 456 797 368 333 341 502 350 284
Decrease because of stopping -19% -21% -26% -20% -14% -15% -20% -14% -10%
SI-1 Pomurska 174 -10% 21 25 21 19 26 19 18 26
SI-2 Podravska 387 -26% 50 96 66 29 60 26 22 38
SI-3 Koroška 152 -2% 19 21 19 18 19 19 18 18
SI-4 Savinjska 288 -20% 39 69 47 25 34 26 22 26
SI-5 Zasavska 156 -3% 20 24 19 19 19 19 18 18
SI-6 Spodnjeposavska 240 -35% 42 76 23 24 20 19 18 19
SI-7 JV Slovenija 263 -22% 42 75 24 37 22 24 20 20
SI-8 Osrednjeslovenska 1020 -23% 135 300 70 82 63 226 102 43
SI-9 Gorenjska 215 -9% 27 41 22 23 22 34 25 20
SI-10 Notranjsko-Kraška 157 -4% 19 21 18 18 18 24 20 18
SI-11 Goriška 176 -5% 21 26 19 20 19 28 24 19
SI-12 Obalno-Kraška 201 -14% 21 25 19 19 19 37 42 19
http://rcin.org.pl

126
Da
vid B
oga
taj, M
arija
Bo
gata
j
Table 13. Estimation of gross migrants from Slovenian regions to Croatian border regions at regime 5 and existing capacities on border crossings (without legal restrictions and with 15-minutes stopping on the border)
SI-1 SI-2 SI-3 SI-4 SI-5 SI-6 SI-7 SI-8 SI-9 SI-10 SI-11 SI-12
Together to
Croatian
region
Po
mu
rsk
a
Po
dra
vsk
a
Ko
rošk
a
Savi
njs
ka
Zasa
vsk
a
Sp
od
nje
po
savs
ka
JV S
love
nij
a
Osr
ed
nje
slo
ven
ska
Go
ren
jsk
a
No
tran
jsk
o-K
rašk
a
No
tran
jsk
o-K
rašk
a
Pri
mo
rsk
a
Together from Slovenia 2261 162 229 152 212 155 267 216 233 171 153 154 158
Change because of
stopping-336 -14% -4% -14% -2% -12% -3% -40% -18% -12% -5% -3% -2% -4%
HR-1 Zagrebaćka 251 -9% 19 24 18 23 19 27 23 23 20 18 18 18
HR-22 Mesto Zagreb 657 -32% 33 88 26 74 29 131 82 84 38 23 25 24
HR-2 Krapinsko- zagorska 222 -3% 18 21 18 20 18 18 18 19 18 18 18 18
HR-4 Karlovačka 216 -1% 18 18 18 18 18 18 18 18 18 18 18 18
HR-5 Varaždinska 222 -2% 19 21 18 19 18 18 18 19 18 18 18 18
HR-8 Primorsko-goranska 248 -6% 18 20 18 20 18 18 20 30 22 21 20 22
HR-18 Istarska 229 -3% 18 19 18 19 18 18 18 22 19 19 19 22
HR-20 Međimurje 216 -1% 19 19 18 18 18 18 18 18 18 18 18 18
http://rcin.org.pl
127Free Zones on the EU borders as the response on reduction of daily commuting ...
In case that there is no new investments in border crossing, when there would be 15 min of
expected stopping on the border, and no other restrictions for movement of human resources
across the border would be valid, the fl ow from Slovenia to border regions of Croatia would
be reduced for 14% and the fl ows from Croatia to Slovenia for 19% according to the case
of free movement without stopping. Today, when Slovenia is member of EU and Croatia not,
the other legal restrictions are reducing this movements nearly to zero. The tables above help
us to prepare the suitable policies for the time when we all shall be in EU, while: for a certain
time the Schengen border regime between Slovenia and Croatia will still reduce the fl ows and
also for later when the fl ows between this two states will be without restrictions.
CONCLUSIONS
Slovenia has to meet the requirements for entry into the Schengen area by the end of this year.
Many crossing points on the country’s border with Croatia, including bridges and roads, are
to be shut down till the end of this year. At the end of the campaign, conducted by Slovenia’s
public administration ministry, 60 crossing points will remain operational along the 670 km
border between the two countries, when this new member state will start to join the Schen-
gen open – border agreement in 2008. It is confi rmed to open possibilities for more intensive
movement of human resources in Europe, while across the “Schengen border” the fl ows
between regions will still be exposed to many restrictions. The structure and number of work-
ers of labor migration and commuting will be restricted and the procedures on border crossings
will be changing according to the status of border which will create waiting lines. According
to Lowry – like models with additionally embedded waiting line formulas and recent statistics
the contacts between the regions inside the EU25, daily commuting and migrations will be
additionally increased because of Schengen agreement, improved transportation corridors
and cheap fl ights between distant regions.
In the member states like Slovenia is where Schengen regime will be adopted in few days
on the border with Croatia, and later changed stepwise so, that in 20 years from 1991 we will
have several changes of border status, the intensive daily migrations and gross migrations will
be even more in decline as it was declining in last 15 years, though our parents and grand
parents used to commute very intensively through this border in the last millennium, till today.
In 20 years from 1991 we already had or we will have the following statuses of the Slovenian–
–Croatian border:
- inner border of two republics of the same federal state SFRJ, with no restrictions of migra-
tions and daily commuting,
- the border between two independent states which do not belong to EU, with some restric-
tions of migrations and daily commuting,
- the non Schengen border between EU member state (Slovenia) and the state, which is not
EU member (Croatia) with additional EU restrictions,
- the Schengen border between EU member state (Slovenia) and the state which in not EU
member (Croatia),
- the Schengen border between two EU member states (Slovenia) and (Croatia) with no other
restrictions except long waiting lines on the border,
http://rcin.org.pl

128 David Bogataj, Marija Bogataj
- the border under Schengen open – border agreement with no restrictions.
According to the history and expecting successful accession of Croatia to EU we can calcu-
late what will be the intensity of fl ows between border regions after Croatian accession to EU
using Lowry – like model with embedded waiting line methodology. It can help us to estimate
the need for land in Slovenian and Croatian settlements for migrants, the requirements for
improved roads and capacity of border crossings.
In future, if the Schengen policy will be relaxed, we can expect intensive daily commuting
and migration from Slovenian regions to Mesto Zagreb, while the commuting to the other
Croatian border regions and migration there will be lower than infl ows to Slovenia from other
Croatian border regions. The improved economy in Croatia can make these fl ows more sym-
metrical. Especially tax policy in Free Zones which increase net earnings for p% of gross earn-
ings can attract (1+p)5,48 more commuters. The investments in more channels on the border
crossings would reduce the waiting lines and therefore induce the fl ows across the border also
after accession of Croatia to EU, if Schengen border, which causes increased service time,
would not be removed at the same time, or if number of channels would not be increased on
the border crossings (status 5). Using model (2)-(4), we can fi nd the optimal investments in
increased number of channels on the border crossings and using this approach we can also
evaluate some projects of investments in the roads belonging to the third direction of Euro-
pean corridors in Slovenia, which is to be constructed in next three years.
In Free Zones the reduced taxes could compensate lead time costs in a supply chain and
additionally enable to increase the gross earnings for 5–15%. According to (2) these advan-
tages can attract daily migrations into distressed region for approximately
(7)
It means the following: if there is no changed waiting time on the border crossing, we get in
average 70% increased fl ow of available human resources at 10% increased earnings of work-
ers (1.15,48=1.7). The infl uence is as strong as the infl uence of 15 minutes decreased waiting
time on the border crossings for the commuters who after that travel 60 min from home to
the Free Zone, where their job is located. On the other worlds it compensates 15 minutes of
additional waiting time for such a commuters (1,252,35=1,7).
REFERENCES
Anjomani A. (2002) Regional growth and interstate migration, Social–Economic Planning
Science, 36, 239–265.
Bailey T. C., A. C. Gatrell (1995) Interactive Spatial Data Analysis, Longman, London.
Bogataj M., Drobne S., Bogataj L. (1995) The infl uence of investment and fi scal policy on
growth of spatial structure, Suvremeni promet, 15, 5, Zagreb, 239–245.
Bogataj L. Bogataj M., Drobne S., Vodopivec R. (2004) The infl uence of investments in roads
and border crossings capacities on regional development after accession. Modern Traffi c,
24, Mostar, 103–111.
Bogataj M., Drobne S. (2005) Does the improvement of roads increase the daily commuting?
http://rcin.org.pl
129Free Zones on the EU borders as the response on reduction of daily commuting ...
Numerical analysis of Slovenian interregional fl ows, in: Zadnik Stirn L., Indihar Štemberger
M., Ferbar L., Drobne S. Selected Decision Support Models for Production and Public Policy
Problems, Slovenian Society Informatika, Ljubljana, 185–206.
Cadwallader M. (1992) Migration and Residential Mobility: Macro and Micro Approaches. Uni-
versity of Wisconsin Press, Wisconsin.
Chun J. (1996) Interregional migration and development, Ashgate Publishing Company, Brook-
fi eld, Vermont.
Lowry I. S. (1966) Migration and Metropolitan Growth: Two Analytical Models, Chandler Publi-
shing Company, San Francisco.
Nijkamp P. (1987) Regional Economics, North–Holland, Handbook of Regional and Urban
Economics, 1.
Statistical Yearbooks 1992–2005, Statistical Offi ce of the Republic of Slovenia, 1990–2005:
Ljubljana, (also available at http://www.stat.si/)
http://rcin.org.pl

http://rcin.org.pl

THE IMPORTANCE OF THE OPERATIONAL DIMENSION IN CROSS-BORDER
COOPERATION INITIATIVES: ITALY LOOKS SOUTH-EAST
GIANCARLO COTELLA
Dipartimento Interateneo Territorio (DITER)
Politecnico di Torino
Viale Mattioli 39, 10125, Torino, Italy
e-mail: [email protected]
Abstract. International Cooperation represents one of the main pillar of Euro-
pean development policy. Neighbouring countries engaged in the development
of cross-border regions undertake institutional engineering operations to set up
the necessary procedures to run Cooperation Programmes. Hence, beside their
spatial impact, INTERREG programmes represent institution-building workshops
for the articulation of management structures compatible with the different gov-
ernance arrangements of involved Member States. Building on this assumption,
the paper presents an operational analysis of the INTERREG IIIA Programmes
involving Italy and non-EU15 nations (Slovenia, Balkans, Albania, Malta), and
sheds some light on the diffi cult process behind the institution of cross-border levels
of governance.
Key words: INTERREG IIIA, Territorial Cooperation, European Spatial Planning,
Community Initiative Programmes, Governance, Institutional Structure, Procedural
Structure, Programme Management
INTRODUCTION: TERRITORIAL COOPERATION IN THE FRAMEWORK OF EUROPEAN SPATIAL DEVELOPMENT POLICY
In the ever-enlarging Europe that reached 27 members in the beginning of 2007, the impor-
tance of European Spatial Development Policy is growing proportionally to the increase
of the economic, social and territorial disparities. In this sense, spatial planning at EU level
is not a new subject, as since at least 20 years it has been possible to witness the develop-
ment of a substantial body of European Union policy making focused on spatial objectives.
The issue of spatial disparities accompanied the development of the EU throughout its
history, although it has not always been expressed explicitly, or in the vocabulary of spatial
policy (Williams 1996). The resurgence of interest in national and supranational spatial plan-
ning, refl ected in the preparation of several spatial planning studies of Europe as a whole, can
be considered partly a response to economic integration, and the single market, the growing
EUROPA XXI2007, 16: 131-152
http://rcin.org.pl
132 Giancarlo Cotella
interest on the improvement of trans-national transport networks, and the recognition of
the importance of a growing spatial coherence of different sectoral policies, as it was already
recognised at the time of the Single European Act in 1987 (Scott 1993).
The publication of the Green Book on the Urban Environment (CEC 1990),
and the studies Europe 2000 and Europe 2000+ (CEC 1991; CEC 1994), are only
few of the several steps that indicate how European Spatial Planning has been a fi eld
in rapid evolution, and its “proudest achievement” (Faludi 2001), i.e. the redaction
and publication of the European Spatial Development Perspective1 (ESDP. CEC 1999),
has been the natural follow up of the described steps. Nevertheless, no evident tech-
nically and institutionally shared defi nition of spatial planning at the European level
exists yet, the uncertainness ruling the debate being strictly connected to the fact
that the Commu-nitarian Treaties includes no references to spatial planning, formally
disempowering the European Commission to make proposals of legislation in this
concern.
In the beginning of the new century, the affi rmation of the territorial cohesion aim
in many EU offi cial documents (among others: CEC 2003; CEC 2004), and the inclusion
of the concept in the Treaty establishing a Constitution for Europe2, seemed to arrive
just on time to eventually legitimate territorial actions at the European level. Whereas
the Treaty has undergone through several turbulences, and its ratifi cation eventually
abandoned in June 2007, territorial cohesion continues to be a hardly disagreeable
institutional reference (Janin Rivolin 2005), as proved by its fi nal recognition as one of
the three principles that guide the Structural Funds distribution for the programming
period 2007–2013 (under the label Convergence).
Within the framework of a European Spatial Development Policy focused to achieve
territorial cohesion, the new programming period introduces the objective of European
Territorial Cooperation that, although being a relatively new term, to the experts may
appear as a new title for a well-known tale. For some fi fteen years, consensus have been
growing around Territorial Cooperation among Member States (Graute 2006), so much
that it became one of the main pillar of European regional development policies. Indeed,
what is included in the Objective 3 of the current Structural Funds expenditure policy
is very close to what has gone until 2006 under the Community Initiative Programme
(CIP) INTERREG (introduced as soon as 1990, right after the 1988 Structural Funds
reform). Hence, although a complex political debate eventually led to substantial cuts in
the related budget, the importance of International Cooperation in the EU scenario is
undeniable.
International cooperation is based on specifi c institutional/operational arrangements
that have to be compatible with the different layers of governance involved in the ma-
na-gement of the programmes in the different Member States. The present contribu-
1 Check Faludi and Waterout (2002) for a detailed description of the complex technical and political process
that started in 1989 in Nantes and continued step-by-step until the approval of the fi nal version of the document in
Potsdam in 1999.
2 Signed by the 25 EU Heads of State and Government in Rome on 29 October 2004, the Constitution states that
the Union “ shall promote economic, social and territorial cohesion, and solidarity among Member States” (Art. I-3).
Furthermore, economic, social and territorial cohesion fi gures in Art. I-14, defi ning the shared competences between
the Union and the Member States.
http://rcin.org.pl

133The importance of the operational dimension in Cross-border Cooperation Initiatives: ...
tion starts from the assumption that the “operational quest” behind the assemblage of
effi cient management and procedural apparatuses, far from being a marginal issue, con-
stitutes an important precondition for the effective territorial impact of the programmes,
and represents a source of operational innovation in the EU framework of multilevel
governance.
Furthermore, whereas Territorial Cooperation inside the EU15 counts on longer tradi-
tion and easier conditions in terms of uniformity of rules and procedures, Cross-border
Initiatives involving New Member States and/or Third Countries are often characterized
by several structural and operational threats. Believing that the exploration of the Terri-
torial Cooperation Programmes involving New Member States and Third Countries
constitutes a further step towards integration and mutual learning in the ever-enlarging
European scenario, the paper presents a comparative analysis of the INTERREG IIIA
Programmes that involved Italian regions and nations not belonging to the EU15, focusing
on their different operational frameworks.
After a brief overview of the evolution of Territorial Cooperation in Europe and
a description of the challenges characterising its operational dimension, the second part
of the text focuses on the peculiar management and procedural arrangements of four
INTERREG III A Programmes (Italy-Slovenia, Italy–Adriatic, Italy–Albania, Italia–
Malta). The conclusive section explores lights and shadows of Italian South-Eastern
cooperation, shedding some light on the diffi culties standing behind the institution and
the functioning of cross-border levels of governance.
A BRIEF HISTORY OF EUROPEAN TERRITORIAL COOPERATION
Cross-border co-operation has a long tradition in Europe. Back in the Sixties, border
regions were already bringing their specifi c problems to the attention of European and
national governments and searching together for solutions. These regions were facing
fundamental disadvantages caused by their peripheral location and by administrative,
legal, linguistic and infrastructural barriers. Parallel to these initiatives, the efforts
to achieve the open internal market, concretized in the Treaty of Maastricht (1992),
formally dismantled internal administrative borders within the EU, theoretically allow-
ing the free movement of goods, people services and capital.
As a concrete contribution to such a process, in 1990 the European Commission
launched the INTERREG Initiative, for the fi rst time introducing a cross-border dimen-
sion to the Structural Funds as a tangible expression of the objective of European integra-
tion. The initiative was both expanded and diversifi ed for the 1994–99 period, embracing
three different types of multinational programmes: Strand A focused on cross-border
cooperation and extended the activities of INTERREG I, Strand B involved the comple-
tion of existing energy networks and Strand C (introduced in 1996) addressed coopera-
tion in regional and spatial planning, building on the increased interest in this fi eld in
the context of the ESDP. The introduction of Phare Cross-border Cooperation (CBC)
in 1994 and Tacis CBC in 1996 also offered scope for external integration efforts, with
INTERREG IIA and Tacis or Phare CBC programmes attempting to mirror each other
http://rcin.org.pl

134 Giancarlo Cotella
across the two sides of relevant borders3.
On 28 April 2000, the Commission Guidelines for the INTERREG III Programme
2000–06 were approved. The principal aim of the new Programme was “to encourage
harmonious and balanced development of the European territory” (CEC 2000), over-
coming internal borders and barriers between member states and reducing the isolation
of peripheral regions. This was to be achieved through the promotion of cooperation
projects between EU countries, Accession countries, Mediterranean countries of North
Africa involved in the programme MEDA4, and other non-EU countries. In its third
phase, INTERREG embraced many themes of the past programming period (see table1)
and continued to be the largest Community Initiative, but received signifi cantly more
resources5 divided into three strands6:
3 In 1994 the European Commission approved a new regulation concerning the implementation of cooperation
programmes between Central and Eastern European Countries (CEECs) and Member States. The main goal was to
facilitate the EU accession of CEECs to promote cooperation. In this framework, Phare CBC was introduced in 1994
to mirror INTERREG in the border regions of Phare benefi ciary Countries with the EU Member States. In 1998 it
was extended to border regions between candidate countries. With a similar process, specifi c regulation were prepared
in order to make INTERREG programmes compatible also with Tacis (1996), MEDA and Cards programmes.4 Mediterranean Development Agreement to promote Euro-Mediterranean partnership and to create a free
trade area, based on the results of a Conference held in Barcelona in 1995.5 The INTERREG III budget amounts to EUR 4,875 million; compared to the previous INTERREG II pro-
gramme for 1994–1999, for which the budget was 3,519 million Ecu, an increase of 28%.6 Two additional related programmes were operated under Article 53 of the INTERREG guidelines:
• European Spatial Planning Observation Network (ESPON), fi nanced jointly by the European Union and the fi fteen
Member States, as well as other neighbouring states, a cooperation network involving national spatial planning
institutes and focusing on the analysis of territorial and regional development trends in Europe.
• INTERACT, launched in 2002 aiming to improve the effectiveness of implementation of INTERREG III during
the current programming period by enabling exchanges of experience, networking and information dissemination
about INTERREG programming.
Table 1. Scope and numbers of INTERREG I, II and III programmes
Theme INTERREG I 1990–1993
INTERREG II 1994–1999 INTERREG III 2000–2006
Total 31 Programs 79 Programs 72 Programs
Cross border cooperation
INTERREG I31 Programs(4 maritime)
INTERREG IIA59 programs
(16 maritime – 31 internal border, 28 external border)
INTERREG IIIA53 Programs
(14 maritime – 24 internal border, 29 external
border)
Transnational cooperation
n/a INTERREG IIC13 programs focused on
regional and spatial planning
INTERREG IIIB13 cooperation areas
Interregional cooperation
n/a n/a INTERREG IIIC4 PanEuropean
Programmes
Completion of Energy network
n/a INTERREG IIB 3 Programs Continuation of the Regen Community
Initiative
n/a
Source: own elaboration.
http://rcin.org.pl

135The importance of the operational dimension in Cross-border Cooperation Initiatives: ...
A. Cross-border cooperation (67% of the total budget). As under INTERREG II A,
this strand promoted cooperation between adjacent regions, with the aim of develo-
ping social and economic cross-border integration through common development
strategies.
B. Transnational cooperation (27% of the total budget). Building on INTERREG IIC,
this strand aimed to promote better integration within the EU through the formation
of large groups of European regions whose integration is strengthened through stra-
tegic and conceptual initiatives.
C. Interregional cooperation (6% of the total budget). This strand, focusing on mutual
learning rather than policy delivering, aimed to improve the effectiveness of regional
development policies and instruments through large-scale information exchange and
sharing of experience.
There have been 81 INTERREG III programmes. The majority (64) belonged to
INTERREG IIIA, and were largely infl uenced by the geopolitical context of the invol-
ved borders:
• Internal EU15 border programmes. The 24 programmes along internal borders enjo-
yed the best prospects for successful integrated cross-border activities. Many, espe-
cially on the northwest European mainland, have been the subject of an active process
of integration over many years supported both within and parallel to INTERREG.
Prospects along some other internal borders were more challenging, e.g. where there
existed physical barriers impeding interaction (such as sea borders, high mountains or
infrastructural defi cits) and/or political and cultural tensions7.
• External border programmes with ‘neighbouring’ countries. This group of six prog-
rammes involved non-EU partners with high levels of resources and organisational
capacity (Switzerland, Norway, Liechtenstein), therefore able to cooperate effectively
with EU countries. These programmes combined EU and neighbouring country
resources and are comparable with internal EU15 border programmes in terms of
their capacity to undertake effective coordination.
• External border programmes with New Member States (NMS). Until the end of 2003,
these 12 programmes applied only to the EU15 half of the border areas, and were
‘border oriented’ rather than fully cross-border. They operated on one side of a border,
while a parallel Phare CBC programme operated on the other. After EU enlargement,
these programmes evolved into full cross-border programmes, embracing relevant
areas of new Member States where Phare no longer operated, and became joint pro-
grammes steered by stakeholders from both sides of the border.
• External border programmes with third countries. These 11 programmes involved
regions on the external borders of the EU. As with the new Member State programmes,
they only operated on the EU side of the border, and coordinated their activities with
parallel instruments (Phare, Tacis, MEDA, CARDS or EDF). These programmes
were the most severely challenged in terms of their ability to undertake effi cient and
meaningful activities, mainly due to structural incompatibilities existing between
INTERREG and parallel instruments.
7 It should also be noted that some internal borders have not had this status for long: Finland, Sweden and Aus-
tria only acceded to the EU in 1995.
http://rcin.org.pl

136 Giancarlo Cotella
Two key changes took place in 2004. With EU enlargement changed the status of
the new Member State programmes, progressively transforming them into “internal
border” programmes. At the same time, EU enlargement increased the number of
INTERREG IIIA programmes through the creation of new internal INTERREG IIIA
programmes targeting new internal borders of the EU25 and the creation of new external
border programmes. The second change, was the introduction of the ‘Neighbourhood
Instruments’ in new and continuing external border areas, a mechanism designed to
address the diffi culties associated with parallel incompatible instruments on either side
of borders.
While INTERREG III programmes are still open to fi nancing until the end of 2009,
for the Programming period 2007–13, International Cooperation lose its dimension of
Community Initiative Programme, and became “mainstream” objective under the label
“European Territorial Cooperation”.
THE OPERATIONAL DIMENSION OF INTERREG
The EU constitutes a highly interesting and ever-evolving institutional project (Sbragia
2002). Although being no state with one nation, one government and a common territory,
the Union developed an institutional setting in many respect similar to the one of a state
(Graute 2006). But while the Member States own legitimate rights to promote spatial
development initiatives, due to the described lack of competences European Spatial Planning
constitutes a confl icting policy fi eld.
Nevertheless the full acknowledgement of such “competence confl ict”, the ESDP
provides general operational guidelines for spatial actions (among which “Integrated
Spatial Development”, “new ways of cooperation’ and ‘the principle of subsidiarity’),
synthesising that “co-operation is the key to an integrated development policy” (CEC
1999, p. 35). Moreover, the document highlights that integrated cooperation in spatial
planning implies that “national borders and other administrative hurdles no longer
represent barriers to development” (CEC 1999, p. 35). Member States apply such guide-
lines on a voluntary basis, through the application of the subsidiarity principle between
the authorities responsible for sectoral policies and those having overall responsibility at
different levels, in a new perspective of horizontal–vertical integrated cooperation that
involves the EU, the Member States, the regions and several other bodies.
In this context, the CIP INTERREG constituted a tailor-made instruments to promote
the ESDP aims (Pedrazzini 2005)8, retroactive in a certain sense (as its origins are to be
found in 1990, when the ESDP process had just started), but developed on parallel tracks.
This is confi rmed by the ESDP Tampere Action Programme that, among the 11 actions
identifi ed, stress the prominent role of INTERREG III in the translation of the ESDP
policy aims for into examples of good practices at various territorial levels through tran-
snational projects (Tampere Ministerial 1999).
8 As stated in chapter four of the document (CEC 1999), INTERREG Programmes allow to realize in a concrete
and effective way the integrated approach (vertical and horizontal cooperation) to spatial development envisaged
by the EU.
http://rcin.org.pl

137The importance of the operational dimension in Cross-border Cooperation Initiatives: ...
Therefore, whereas International Cooperation is a high-impact tool to fi ght the margi-
nality of many border regions, the programmes undertaken by neighbouring countries
for the development of Cross-border regions are also crucial instruments to implement
the operational aims of the Commission. The different aspects emerging in the coopera-
tion (in terms of reactivation of contacts, shared identities, empowerment of local actors,
etc.) often favour complex institutional engineering operations aiming to set up the neces-
sary conditions to run the programmes themselves. Hence, beside their strong spatial
impact9, international cooperation programmes constitutes an innovative workshop f
ocused on the articulation of new management and procedural structures for cross-bor-
der initiatives.
One of the strongest assets (and, at the same time, the most delicate obstacle) of
International Cooperation Initiatives is therefore the involvement of different public
actors with direct competence in territorial planning in different national context
through the elaboration and the implementation of joint operational programmes.
In this respect, it is important to keep in mind that preliminary experiences in the fi eld
of cross-border cooperation, promoted under the CIP INTERREG I and II were laun-
ched “in recognition of the need for the Member States to get involved in a more
operational way in cooperation on regional and spatial planning” (CEC 2002). In this
preliminary experiences many contradictions emerged, the diffi culty to interface diffe-
rent institutional, management and procedural frameworks being the harshest challenge.
Cooperation between actors presenting diverse legal and cultural orientations (as well as
different experience in spatial planning) led to vague projects asking for further investi-
gation, and to results refl ecting the strong need to improve mutual understanding and to
create a common language so as to communicate.
Furthermore, it is interesting to notice how the new way of cooperation promoted by
INTERREG has not been common in all the European countries. Particularly evident
is the difference between regions and states where the spatial planning tradition is more
mature (e.g. France and Germany), and those that do not have a consolidated tradition
(Pedrazzini 2005). Countries belonging to the former group were more able to “digest”
the general aims and procedures expressed by the Commission in the programmes, thus
managing to put on transnational cooperation agenda proposals responding to their own
political objectives. On the contrary, such a new integrated approach to joint territorial
development was relatively new for southern and eastern countries, traditionally charac-
terized by legalistic planning regulation or still dealing with the legacy of hierarchical
soviet-inspired systems.
Besides such a broad grouping in terms of performance, there exists many elements
that may affect the successful implementation of Cross-border cooperation, in primis
the relation between the geopolitical condition of the border and the diffi culties likely
faced by the programmes, already introduced in the previous paragraph. Another
important feature is the degree of “physical isolation” along borders, deriving from
the economic disparities across borders, the cross-border infrastructure endowment,
and their land or maritime condition. In addition, the programmes’ fi nancial size and
the fi nancing instruments involved constitute important variable infl uencing effective 9 This issue has been analysed in several scientifi c contributions. Among others: Graute 1998, 2006.
http://rcin.org.pl
138 Giancarlo Cotella
implementation, and also the number of countries involved in a programme infl uences
its performance.
For what concern the operational dimension of the Programmes it is important to
underline how the characteristics of the management structure (i.e. the institution of
special cross-border agencies, the location of the managing bodies, and other specifi c
arrangements) highly infl uence programmes’ performance. In terms of procedures
adopted it is then possible to distinguish between those fi nalized to the dissemination of
information and the procedures related to projects preparation and evaluation. In both
cases such procedures can be characterised by greater bottom up of top-down fl avour,
i.e. based on open call for proposals accessible to a great variety of actors in the frame-
work of the priorities and the measures defi ned in the programme, or presenting inter-
ventions directly promoted by responsible regional authorities, leaving to private actors
only in the implementation phase10.
Focusing on this and other aspects, in the following paragraph the paper builds on
the achievements of a research produced in the INTERACT framework11, presenting
information obtained from both Offi cial INTERREG documents and interviews with
different contact persons.
ITALY LOOKS SOUTH-EAST: FOUR DIFFERENT INTERREG IIIA PROGRAMMES
Italy participated to INTERREG since 1990, and took part to the third programming period
with nine programmes. Five of them concerned internal borders (Italy–Austria, Italy–France
“ALCOTRA”; Italy–France “Islands”, Italy–Greece, Italy–Switzerland), and the other four
involved Italy and New Member States (Italy–Slovenia, Italy–Malta) or Third Countries
(Italy–Albania, Adriatic Cross-border).
Whereas Territorial Cooperation inside the EU15 has been favoured by easier con-
ditions in terms of uniformity of rules and procedures, INTERREG III cooperation
involving one or more New Member States and Third Countries have been characterized
by several structural and operational threats. Assuming that an exploration of the latter
constitutes a further step towards integration in the ever-enlarging European scenario,
the paper analyses the different operational frameworks of the four INTERREG IIIA
Programmes that involved Italian regions and countries not belonging to the EU15.
PROGRAMME INTERREG IIIA ITALY–SLOVENIAThe cooperation programme INTERREG IIIA–Phare CBC Italy–Slovenia concerned
an area of 11.400 kmq and an overall population of 1.943.000 inhabitants. The eligible area
included, on the Italian side, the provinces of Udine, Gorizia and Trieste (Friuli–Venezia
Giulia region), and the province of Venice, (Veneto region); moreover, the provinces of
Pordenone and Rovigo constituted exceptionally eligible areas. As for Slovenia, the eligible
areas were the two statistical regions Obalno–Kraška and Goriška and the municipality of
Kranjska Gora (Figure 1).
10 This is mainly the case of high impact projects focused, for example, on infrastructural goals.11 see note n°6.
http://rcin.org.pl

139The importance of the operational dimension in Cross-border Cooperation Initiatives: ...
The 200 km long Italian–Slovenian border shows a moderate degree of physical iso-
lation (the situation is fast improving after Slovenia EU accession) and signifi cant geo-
graphic variety. The area concerned by the programme presented the typical problems
of border areas, showing development delays, while some areas are characterised by
de-industrialisation phenomena.
Among other cross-border and bilateral national initiatives, Italy and Slovenia par-
ticipated in the INTERREG IIA–Phare CBC Programme 1995–99, that contributed
to improve and intensify cross-border co-operation in the border area. The programme
period 2000–2006 became even more challenging in the light of enlargement of the EU,
as it was crucial to focus funds’ impact on the prospect of the integration of Slovenia
in the EU. The programming document INTERREG IIIA–Phare CBC Italy–Slovenia
2000–2006 was prepared and approved in 2001, and its management and implementa-
tion rules and procedures were still based on two regulations (INTERREG and Phare).
With the EU accession of Slovenia in 2004, after a reformulation of the programme both
countries started to operate within the framework of the joint CIP INTERREG IIIA
Italy–Slovenia.
The programme presented a high volume of resources before (EUR 101,010,372,
supported by both INTERREG and Phare CBC funds before May 2004, and by
INTERREG funds after that date). The responsible implementing bodies were regio-
Figure 1. The eligible regions of the programme INTERREG IIIA Italy–SloveniaSource: fi gures 1–4 Interact
http://rcin.org.pl
140 Giancarlo Cotella
nal structures, and no cross-border structures were legally established. Italy (namely
the Autonomous Region of Friuli Venezia Giulia) has been in charge of the programme
for the whole period. As regards to the management structure, there was a “Central”
Managing Authority (MA) (Autonomous Region of Friuli Venezia Giulia) with overall
responsibility, and three Intermediate Bodies (IBs) (the Directorate for International
Relations and Local Autonomies for Friuli Venezia Giulia, the Directorate for Com-
munity programmes–INTERREG Service for Veneto Region, and the National Agency
for Regional Development for the Republic of Slovenia), which worked together in
the implementation the programme.
The overall organisational framework and the appointment of individual respon-
sibilities was complex but clear, and favoured transparency and formal and functional
independence between the various management and process structures. Despite the large
number of structures involved, management appeared to be well coordinated, and
the overall management structure developed as a highly integrated network. Neverthe-
less, during the start-up phase of the activities of the regional administrative structure,
certain obstacles and delays occurred, the main problem being related to the lack of
regional staff dedicated to the programme. Moreover, the reorganisation of the Prog-
ramme occurred in 2004 generated further delays.
For what concerns the information procedures, several “bottlenecks” undermined
the information dissemination channels in the beginning of the programme, and a scarce
knowledge about the programme was highlighted at regional and local levels, especially
among economic and social subjects. The offi cial Internet website, operational since
the beginning of 2005, and an editorial cross-border initiative called “Euro-Regio Maga-
zine”, partially contributed to invert such trend. Nevertheless, the communication proc-
ess continued to be mainly top-down oriented.
In terms of project preparation and evaluation instead, the programme mainly
focused on call for proposal concerning the different measures, that contributed to pro-
vide the programme with a high bottom-up fl avour in terms of implemented interventions
due to growing consultation in the calls launched after 2004. The “regional direction”
procedure, i.e. the promotion of interventions directly elaborated within the Managing
Authority, has also been a means of application, mainly applied before the reformulation
of the programme.
The problems identifi ed were mainly connected to the absence of proper cross-
-border bodies within the framework of the regional authorities concerned. In Friuli
region, researches are currently underway concerning the creation of a Euro-region
as well as a Regional Agency for cross-border development. Indeed, also the changes
in the call for projects procedures and the withdrawal of so-called “mirror” and “coope-
rative” projects in 2004 led to further delays, but contributed to improve the cross-
-border quality of projects, due to the simultaneous publishing of the calls in Italy and
Slovenia.
PROGRAMME INTERREG IIIA CROSS-BORDER ADRIATICAt the beginning of 2000, in order to improve the coherence of the available instruments
insisting on the area, the European Commission accepted the Italian request to prepare
http://rcin.org.pl

141The importance of the operational dimension in Cross-border Cooperation Initiatives: ...
a cross-border INTERREG Programme involving Italy and Eastern Adriatic Countries12.
On the 23 August 2001, the Commission recognised eligible for the Adriatic Coopera-
tion under INTERREG IIIA the Italian provinces of Ancona, Ascoli Piceno, Campo-
basso, Chieti, Ferrara, Foggia, Forlì–Cesena, Macerata, Pesaro and Urbino, Pescara,
Ravenna, Rimini, Rovigo and Teramo, foreseeing a coordination of the Programme with
CARDS instruments. A new instrument called Adriatic Cross-border Programme was
then defi ned, covering the Adriatic area with the scope to coordinate the existing cross-
-border programmes in Albania, Bosnia, Croatia, Serbia and Montenegro and Slovenia
(see Figure 2).
Moreover on July 2003, with a document titled “Paving the way for a new neigh-
bourhood instrument”, the Commission proposed a new community policy, that became
effective on 1 May 2004, and led to the adaption of INTERREG IIIA Adriatic Cross-
12 However the European Commission accepted only the general principle, without including the Adriatic terri-
tories in the initiative INTERREG IIIA. Therefore, the list of the countries involved in INTERREG IIIA initia-
tives of the 28 April 2000 included a declaration of the European Commission underlining that whether there were
the politic assumption to promote cooperation initiatives between Italian regions and Adriatic third countries,
the Commission would have examined the most appropriate way to promote them with further cooperation
instruments.
Figure 2. The eligible regions of the programme INTERREG IIIA Adriatic New Neighbourhood Programme
http://rcin.org.pl
142
border Programme to a new legal and operational framework, eventually producing
the Adriatic New Neighbourhood Programme13.
The main impact of the programme reorganization was the increased participation
of Adriatic Eastern Countries to the planning and decision making processes. Besides,
having anticipated the new orientation of the Commission on neighbourhood policy,
the new programme became one of the main instruments to be taken into consideration
for the defi nition of the new EU external border policies for the 2007–13 period.
Until 2004, the overall public fi nancial endowment for INTERREG IIIA Adriatic
Cross-border Programme (2002–2006) was amounting to EUR 101,015,000. On the Ital-
ian side, 50% of the resources came from INTERREG and the remaining 50% from
the national resources. Since 2004, the new fi nancial plan of the Adriatic New Neigh-
bourhood Programme was composed of the residual INTERREG IIIA resources, and
CARDS resources, allocated for the period 2004–2006.
Members of Eastern Adriatic Countries were fully represented in the management
structures, and closely cooperated in Transnational Working Tables. The structures
responsible for the management of the program were divided in three groups: Internal,
External and Joint Management Structures. The competencies of the Internal Manage-
ment Structures for the management of the Programme were various. The Managing
Authority (located in the Abruzzo region) guaranteed the effi cacy of the implementation
of the programme and in the management of the funds that targeted EU Member States.
The Regional Units, together with the MA, guaranteed the Programme management,
carrying out dissemination activities in the respective areas and encouraging project
proposals.
Among the External Management Structures (additional management bodies located
in the third countries involved), the Programme Coordination Units, located in differ-
ent Ministerial Authorities of the East Adriatic Countries, guaranteed (together with
the Managing Authority) the management of the CARDS part of the programme, carry-
ing out information activities and stimulating the submission of project proposals.
Among the Joint Management Structures, it is interesting to underline the role of
the Joint Monitoring Committee (JMC), composed of representatives of the Internal and
External Countries and responsible to supervise the implementation of the programme.
It approved all the changes occurred in the programme and examined the results of
the programme in relation with the objectives manifested in each of its measures.
The Joint Selection Committee (JSC) was responsible for the selection of the project propo-
sals. It applied previously agreed selection criteria, coordinated the supervision of the im-
plementation, and approved the calls for proposals, as well as the project applications.
13 In particular, during the year 2004, due to the general rearrangement, the Programme Complement was
modifi ed in four different occasions, in order to keep in consideration the necessary adjustments as a consequence
of the programme implementation and the new orientations of European Commission on neighbourhood policies.
(1) the fi rst modifi cation (February 2004) concerned the criteria of projects selection. (2) In relation with adminis-
trative problems of some Regions that participate in Programme, the Programme Complement was again modifi ed
in May 2004, as far as it concerns the fi nancial procedures of Programme. (3) Following the presentation of “regional
direction” projects, ulterior changes have been made necessary to make the programme more coherent with the new
fi nancial framework in relation to each Measure. per Measure (December 2004). (4) The Programme documents where
eventually redefi ned following the Commission guidelines for New Neighbouring Programme, and eventually, on
the 22 December 2005, the Adriatic New Neighbourhood Programme was formally approved by the European Commission.
Giancarlo Cotella
http://rcin.org.pl
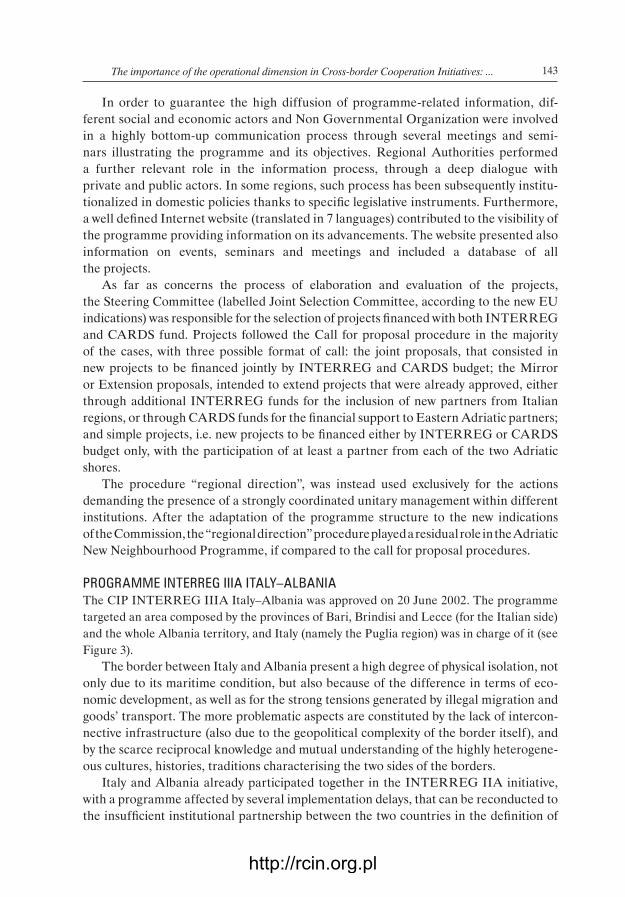
143
In order to guarantee the high diffusion of programme-related information, dif-
ferent social and economic actors and Non Governmental Organization were involved
in a highly bottom-up communication process through several meetings and semi-
nars illustrating the programme and its objectives. Regional Authorities performed
a further relevant role in the information process, through a deep dialogue with
private and public actors. In some regions, such process has been subsequently institu-
tionalized in domestic policies thanks to specifi c legislative instruments. Furthermore,
a well defi ned Internet website (translated in 7 languages) contributed to the visibility of
the programme providing information on its advancements. The website presented also
information on events, seminars and meetings and included a database of all
the projects.
As far as concerns the process of elaboration and evaluation of the projects,
the Steering Committee (labelled Joint Selection Committee, according to the new EU
indications) was responsible for the selection of projects fi nanced with both INTERREG
and CARDS fund. Projects followed the Call for proposal procedure in the majority
of the cases, with three possible format of call: the joint proposals, that consisted in
new projects to be fi nanced jointly by INTERREG and CARDS budget; the Mirror
or Extension proposals, intended to extend projects that were already approved, either
through additional INTERREG funds for the inclusion of new partners from Italian
regions, or through CARDS funds for the fi nancial support to Eastern Adriatic partners;
and simple projects, i.e. new projects to be fi nanced either by INTERREG or CARDS
budget only, with the participation of at least a partner from each of the two Adriatic
shores.
The procedure “regional direction”, was instead used exclusively for the actions
demanding the presence of a strongly coordinated unitary management within different
institutions. After the adaptation of the programme structure to the new indications
of the Commission, the “regional direction” procedure played a residual role in the Adriatic
New Neighbourhood Programme, if compared to the call for proposal procedures.
PROGRAMME INTERREG IIIA ITALY–ALBANIAThe CIP INTERREG IIIA Italy–Albania was approved on 20 June 2002. The programme
targeted an area composed by the provinces of Bari, Brindisi and Lecce (for the Italian side)
and the whole Albania territory, and Italy (namely the Puglia region) was in charge of it (see
Figure 3).
The border between Italy and Albania present a high degree of physical isolation, not
only due to its maritime condition, but also because of the difference in terms of eco-
nomic development, as well as for the strong tensions generated by illegal migration and
goods’ transport. The more problematic aspects are constituted by the lack of intercon-
nective infrastructure (also due to the geopolitical complexity of the border itself), and
by the scarce reciprocal knowledge and mutual understanding of the highly heterogene-
ous cultures, histories, traditions characterising the two sides of the borders.
Italy and Albania already participated together in the INTERREG IIA initiative,
with a programme affected by several implementation delays, that can be reconducted to
the insuffi cient institutional partnership between the two countries in the defi nition of
The importance of the operational dimension in Cross-border Cooperation Initiatives: ...
http://rcin.org.pl
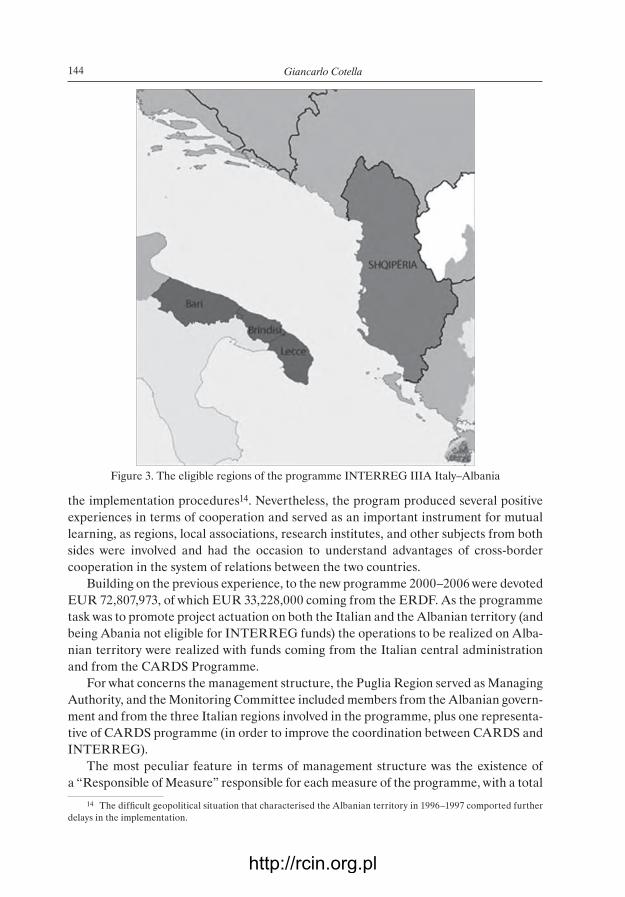
144
the implementation procedures14. Nevertheless, the program produced several positive
experiences in terms of cooperation and served as an important instrument for mutual
learning, as regions, local associations, research institutes, and other subjects from both
sides were involved and had the occasion to understand advantages of cross-border
cooperation in the system of relations between the two countries.
Building on the previous experience, to the new programme 2000–2006 were devoted
EUR 72,807,973, of which EUR 33,228,000 coming from the ERDF. As the programme
task was to promote project actuation on both the Italian and the Albanian territory (and
being Abania not eligible for INTERREG funds) the operations to be realized on Alba-
nian territory were realized with funds coming from the Italian central administration
and from the CARDS Programme.
For what concerns the management structure, the Puglia Region served as Managing
Authority, and the Monitoring Committee included members from the Albanian govern-
ment and from the three Italian regions involved in the programme, plus one representa-
tive of CARDS programme (in order to improve the coordination between CARDS and
INTERREG).
The most peculiar feature in terms of management structure was the existence of
a “Responsible of Measure” responsible for each measure of the programme, with a total
14 The diffi cult geopolitical situation that characterised the Albanian territory in 1996–1997 comported further
delays in the implementation.
Giancarlo Cotella
Figure 3. The eligible regions of the programme INTERREG IIIA Italy–Albania
http://rcin.org.pl
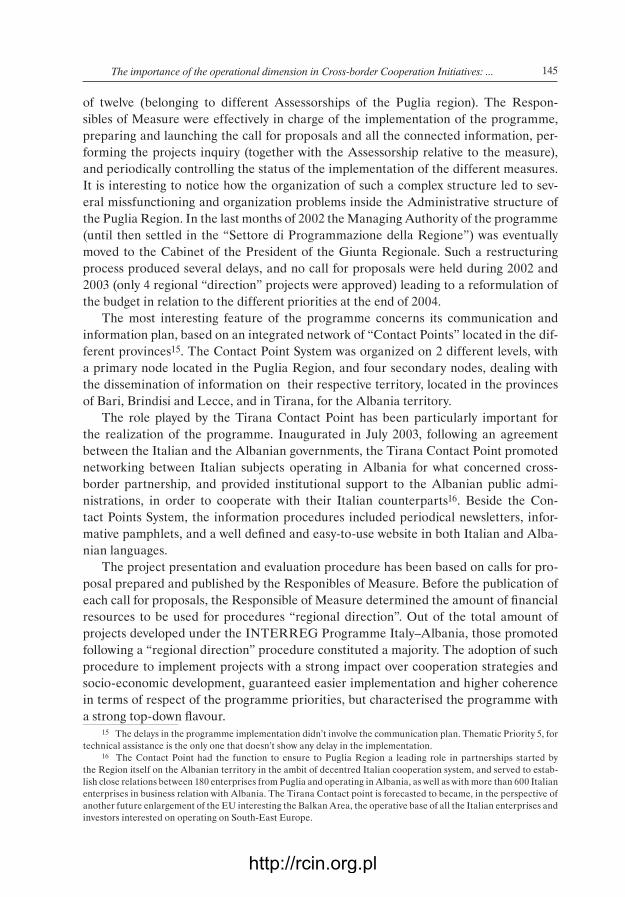
145
of twelve (belonging to different Assessorships of the Puglia region). The Respon-
sibles of Measure were effectively in charge of the implementation of the programme,
preparing and launching the call for proposals and all the connected information, per-
forming the projects inquiry (together with the Assessorship relative to the measure),
and periodically controlling the status of the implementation of the different measures.
It is interesting to notice how the organization of such a complex structure led to sev-
eral missfunctioning and organization problems inside the Administrative structure of
the Puglia Region. In the last months of 2002 the Managing Authority of the programme
(until then settled in the “Settore di Programmazione della Regione”) was eventually
moved to the Cabinet of the President of the Giunta Regionale. Such a restructuring
process produced several delays, and no call for proposals were held during 2002 and
2003 (only 4 regional “direction” projects were approved) leading to a reformulation of
the budget in relation to the different priorities at the end of 2004.
The most interesting feature of the programme concerns its communication and
information plan, based on an integrated network of “Contact Points” located in the dif-
ferent provinces15. The Contact Point System was organized on 2 different levels, with
a primary node located in the Puglia Region, and four secondary nodes, dealing with
the dissemination of information on their respective territory, located in the provinces
of Bari, Brindisi and Lecce, and in Tirana, for the Albania territory.
The role played by the Tirana Contact Point has been particularly important for
the realization of the programme. Inaugurated in July 2003, following an agreement
between the Italian and the Albanian governments, the Tirana Contact Point promoted
networking between Italian subjects operating in Albania for what concerned cross-
border partnership, and provided institutional support to the Albanian public admi-
nistrations, in order to cooperate with their Italian counterparts16. Beside the Con-
tact Points System, the information procedures included periodical newsletters, infor-
mative pamphlets, and a well defi ned and easy-to-use website in both Italian and Alba-
nian languages.
The project presentation and evaluation procedure has been based on calls for pro-
posal prepared and published by the Responibles of Measure. Before the publication of
each call for proposals, the Responsible of Measure determined the amount of fi nancial
resources to be used for procedures “regional direction”. Out of the total amount of
projects developed under the INTERREG Programme Italy–Albania, those promoted
following a “regional direction” procedure constituted a majority. The adoption of such
procedure to implement projects with a strong impact over cooperation strategies and
socio-economic development, guaranteed easier implementation and higher coherence
in terms of respect of the programme priorities, but characterised the programme with
a strong top-down fl avour.15 The delays in the programme implementation didn’t involve the communication plan. Thematic Priority 5, for
technical assistance is the only one that doesn’t show any delay in the implementation.16 The Contact Point had the function to ensure to Puglia Region a leading role in partnerships started by
the Region itself on the Albanian territory in the ambit of decentred Italian cooperation system, and served to estab-
lish close relations between 180 enterprises from Puglia and operating in Albania, as well as with more than 600 Italian
enterprises in business relation with Albania. The Tirana Contact point is forecasted to became, in the perspective of
another future enlargement of the EU interesting the Balkan Area, the operative base of all the Italian enterprises and
investors interested on operating on South-East Europe.
The importance of the operational dimension in Cross-border Cooperation Initiatives: ...
http://rcin.org.pl
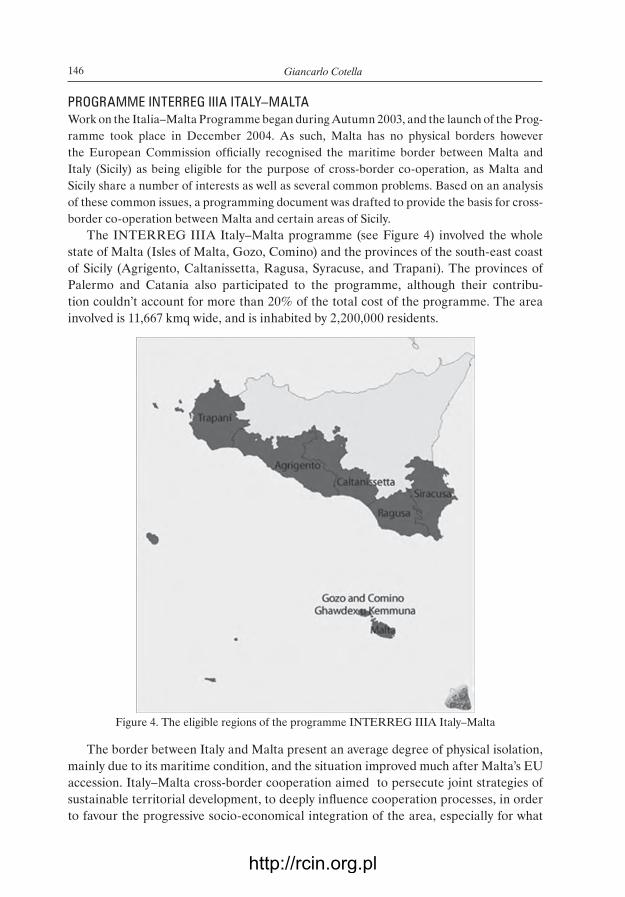
146
PROGRAMME INTERREG IIIA ITALY–MALTAWork on the Italia–Malta Programme began during Autumn 2003, and the launch of the Prog-
ramme took place in December 2004. As such, Malta has no physical borders however
the European Commission offi cially recognised the maritime border between Malta and
Italy (Sicily) as being eligible for the purpose of cross-border co-operation, as Malta and
Sicily share a number of interests as well as several common problems. Based on an analysis
of these common issues, a programming document was drafted to provide the basis for cross-
border co-operation between Malta and certain areas of Sicily.
The INTERREG IIIA Italy–Malta programme (see Figure 4) involved the whole
state of Malta (Isles of Malta, Gozo, Comino) and the provinces of the south-east coast
of Sicily (Agrigento, Caltanissetta, Ragusa, Syracuse, and Trapani). The provinces of
Palermo and Catania also participated to the programme, although their contribu-
tion couldn’t account for more than 20% of the total cost of the programme. The area
involved is 11,667 kmq wide, and is inhabited by 2,200,000 residents.
The border between Italy and Malta present an average degree of physical isolation,
mainly due to its maritime condition, and the situation improved much after Malta’s EU
accession. Italy–Malta cross-border cooperation aimed to persecute joint strategies of
sustainable territorial development, to deeply infl uence cooperation processes, in order
to favour the progressive socio-economical integration of the area, especially for what
Giancarlo Cotella
Figure 4. The eligible regions of the programme INTERREG IIIA Italy–Malta
http://rcin.org.pl

147
concern the South-East border of Sicily and Malta, to improve the value of the social,
cultural and economical resources of the cross-border area, in the framework of sustain-
able development.
The choice of the intervention sectors and of the specifi c goals that generated priori-
ties and measures of the programme derive from a comparison between the indications
found out during a joint SWOT analysis and the priorities of the use of structural funds,
taking into consideration also internal coherence of actions and convergence and syner-
gies between them.
The programme had a budget of EUR 6,832,847 for the 2004–2008 period, with
the participation of ERDF funds (EUR 5.124.654). The Italy–Malta programme was
completely co-fi nanced by the EU through INTERREG Funds (being Malta a Full
Member State at the time when the programme was approved). The responsible author-
ity for the implementation of the programme were, for the Sicilia region the “Presidenza
della Regione Siciliana Dipartimento della Programmazione, Servizio Sviluppo Locale”,
and for Malta the “Planning & Priorities Co-ordination Directorate”.
A number of structures were set up for the proper co-ordination of the Italia–Malta
Programme. The Managing Authority was based at the Dipartimento di Programma-
zione, Presidenza della Regione di Sicilia, and it was also be supported by an Auxiliary
Managing Authority (the Planning & Priorities Co-ordination Directorate at the Offi ce
of the Prime Minister, Malta). The Managing Authority was supported by a Joint Tech-
nical Secretariat in the day-to-day management of the Programme, that had an auxi-
liary JTS in Malta. A Monitoring Committee was established to monitor progress of
the Programme, approve the selection criteria, take decisions regarding calls for propos-
als, etc., and a Steering Committee carried out project evaluation and Project Selection.
The Committees were made up of Maltese and Sicilian representatives, and alternatively
met in Italy and Malta.
The Operative Programme of INTERREG IIIA Italy–Malta promoted a well detai-
led communication and information plan, based on several thematic workshops organ-
ized (in form of technical meeting between potential benefi ciaries and JTS), in Sicily and
in Malta, and many other informative tools were elaborated.
For what concern the project formulation and evaluation procedures, the programme
introduced an interesting innovative element, the Form for the presentation of project
ideas. It consisted of a document that led potential participants to propose potential
project ideas to be published on the internet website, in an open forum, in order to
help potential partners to get in contact with each other. Furthermore, the programme’s
authorities provided all the documents that concerned the procedures of application to
call for proposals (including forms to be fi lled, explanations of how to fi ll documents,
rules about roles and responsibilities) in a “kit for presentation of the propositions”, that
proved to be of great help for the participants.
The eligibility and assessment of the project followed the Call for proposals pro-
cedure as well as the procedure of “Regional direction” (but only for a minor share of
the promoted projects, also due to the scarcity of funds).
The importance of the operational dimension in Cross-border Cooperation Initiatives: ...
http://rcin.org.pl

148
CONCLUSIONS: (FEW) LIGHTS AND (MANY) SHADOWS OF THE ITALIAN SOUTH-EASTERN COOPERATION
It is possible to present the four CIP INTERREG analysed in the paper under a comparative
perspective, insisting on the different variable characterizing their operational dimension
(see Table 2).
As far as concerns the “quality” of the border targeted by the programmes, it is
interesting to notice how those insisting on Internal borders (Italy–Malta) enjoyed
Giancarlo Cotella
Table 2. Operational Comparison of the four INTERREG IIIA programmes between Italy and South-Eastern European countries.
Italy–Slovenia ANNP Italy–Albania Italy–Malta
PR
OG
RA
MM
E F
EA
TU
RE
S
Borders Accession Countryà Internal
Land
Third CountriesMaritime
Third countryMaritime
InternalMaritime
Physical Isolation
Moderate High High Moderate
Countries Involved
2 (Italy, Slovenia) 5 (Italy, Slovenia,
Albania, Serbia–Montenegro,
Bosnia, Croatia)
2 (Italy, Albania) 2 (Italy, Malta)
Financial Size(EUR)
High(101,010,372)
High(101,015,000)
High(72,807,973)
Low(6,832,847)
Funds Involved
INTERREG+Phare
à INTERREG
INTERREG + CARDS
INTERREG + CARDS
INTERREG
Reformulation in itinere
Yes (2004) Yes (4 times during 2004)
Yes (2005) No
OP
ER
AT
ION
AL
FE
AT
UR
ES Programme
ManagementComplex:
Managing Authority + 3 Intermediate
Bodies
Complex:Int. StructuresExt. StructuresJoint Structures
Complex:12 Measures’
Directors
Linear:Main
Structures + Auxiliary
Struct.
Information Procedures
Top-down;Scarce info in the
fi rst phase.Seminars, Website.
Bottom-up;High
involvement of stakeholders, Workshops
Website/forum in 7 languages.
Bottom-Up;Tirana Contact point / Contact
points structure;Seminars,
Web-forum
Bottom-Up;Workshops,Web-Forum,Call for ideas
Project Presentation/ Evaluation Procedures
Bottom-Up;Mostly call for
Projects – “Regional direction” projects
just in the fi rst phase
Top-Down / Bottom Up;
Call for Projects and “regional
direction” procedure;
Top-DownMostly
“Regional Directions”
projects, few Call for Projects
Bottom Up;Call for Projects
Source: own elaboration.
http://rcin.org.pl

149
a higher degree of successful integrated cross-border activities, while programmes
involving new member states (Italy–Slovenia) and third countries (Cross-border Adriatic
and Italy Albania) were severely challenged in terms of their ability to undertake effi -
cient and meaningful activities mainly due to organisational challenges (connected with
the reorganization of the programme due to the achievement of EU member condition
or with the incompatibility of the different funding programme involved). Moreover,
concerning the degree of “physical isolation” of the borders external borders generally
faced higher levels of isolation (greater in case of maritime borders), which constituted
further obstacles.
The presence of different funding sources represented another negative element,
the more funding instruments involved meaning the lower performance of the prog-
ramme in terms of implementation (due to incompatibility of different rules of eligibility,
delivery, and expenditures). Furthermore, different funding sources were mainly used
to promote “mirror” projects (e.g. in the Italy Slovenia and Cross-border Adriatic situ-
ations before 2004) that did not present strong cross-border impact. The examination
of the economic size of the project do not lead to a straightforward interpretation, as
budgetary comparisons need to be made with care, as fi gures need to be related to fac-
tors such as the length and nature of borders. Furthermore, some programmes placed
strong emphasis on high-cost measures that may not have been bigger in terms of num-
bers of projects, but were easier to implement due to “regional direction” procedure if
compared with some of the fi nancially smaller programmes.
For what concern the operational dimension of the programmes, it is important to
underline how a reformulation in itinere always produced delays in terms of implementa-
tion. The degree of complexity of the management structures further infl uenced the cor-
rect functioning of the programmes, and linear structures seemed to be more effective
(as in the Italy–Malta case) while growing complication led to higher risks of missfunc-
tioning (e.g. in the case of Italy–Albania programme).
In terms dissemination and information procedures, they can be characterised by
bottom-up or top-down fl avour, i.e. based on active involvement of the different stake-
holders in the defi nition of the different priorities or just focused on the provision of
programme information. A bottom up approach characterised the programmes Adriatic
Cross-border, Italy–Albania, Italy–Malta, and in the Malta case, also the procedures
of project preparation and presentation, mainly based on open call for proposals. On
the contrary, the Balkan programme and, to a higher extent the Albanian case, presen-
ted top-down implementation procedures due to the usage of the “regional direction”
procedure. In this concern, also the implementation of the programme Italy–Slovenia
was carried out under a bottom up approach, especially after 2004, but together with
a highly top down communication system that led to scarce knowledge about the pro-
gramme among the different stakeholders in its fi rst phase.
Of the four examples, Italy Malta incurred in less delays in terms of implementation.
Started after the EU accession of the Maltese nation, this programme could benefi t from
a single source of funding, on a linear management structure and on strong bottom-
-up procedures. The relatively low fi nancial size of the programme surely contributed
to favour its correct implementation, meaning, on the other hand a lower impact of
The importance of the operational dimension in Cross-border Cooperation Initiatives: ...
http://rcin.org.pl

150
the promoted interventions. For what concern the Italy–Slovenia programme, diffi culties
have been mainly related to the reorganization of the programme, and the 2007–2013
cross-border cooperation is expected to encounter less operational troubles. Different is
the case of the cooperation Italy–Albania that, in spite of the experience matured under
the previous period, didn’t achieve suffi cient results in terms of implementation, mainly
due to internal missfunctioning. Last but not least, the procedures that regulated
the Adriatic New Neighbourhood Programme, with their high degree of complexity and
the many effort to promote integration among different funding sources, will be used
as a reference for the 2007–2013 phase, providing an adequate support to the Commis-
sion in the implementation of other forms of cross-border cooperation and proximity
programme.
Although the importance of the operational dimension in International cooperation
initiatives appears clearly from the above description, it is diffi cult to say much about
the concrete effects obtained by INTERREG III in terms of institutional, manage-
rial and operational integration. From the perspective of the European Commission,
INTERREG III have been a resounding success (Pedrazzini 2005), as Member States
and regions recognized the Union a role and a ‘competence’ on spatial policy that does
not fi gure in any of the European treaties17. From the point of view of local actors,
the bottom up preparation of INTERREG Programmes, strongly involving European
Commission, Member States, regional and local representatives constituted an impor-
tant platform for mutual institutional learning.
Weather the complicated procedures to carry out the management and mutual con-
trol of programmes and projects in many cases slowed down the cooperative process,
many evidences confi rm the interest in future collaboration projects, that will surely
contribute to a better integration of cross-border regions also based on growing mutual
understanding and on learning-by-doing processes of institutional and procedural engi-
neering. Indeed, INTERREG IIIA programmes, aiming to reach common spatial ob-
jectives, had also in some way an infl uence on the institutional and operational arrange-
ment of territorial planning in the different contexts. The disappearance of traditional
political and administrative borders between European states and regions, the promo-
tion of new instrumental alliances between regions and the large impact of Commu-
nity policies means, amongst others, a sort of internationalization of planning practices.
In this context, Territorial cooperation initiatives represent a huge effort to face these
challenges (Faludi and Waterhout 2002; Pedrazzini 2000).
It is possible to affi rm that INTERREG contributed (and will contribute) to infl uence
the different operational approaches to planning. Just the few examples presented serve
to remind us that there is still much to do in the promotion of shared “Euro-framework for
spatial action”. Cooperation in spatial planning just concluded its fi rst concrete program-
ming period focused on the diffusion of means of transnational projects and the harmo-
nization of languages and styles of communication. Sharing management and procedural
good practices for spatial development, is a preliminary condition to be satisfi ed, at least
as important as the elaboration and diffusion of shared spatial development concepts.
17 Moreover, they accepted to achieve jointly established objectives and to act following certain given protocols,
i.e. to have the commission to interfere in their own territorial agendas and operational structures.
Giancarlo Cotella
http://rcin.org.pl
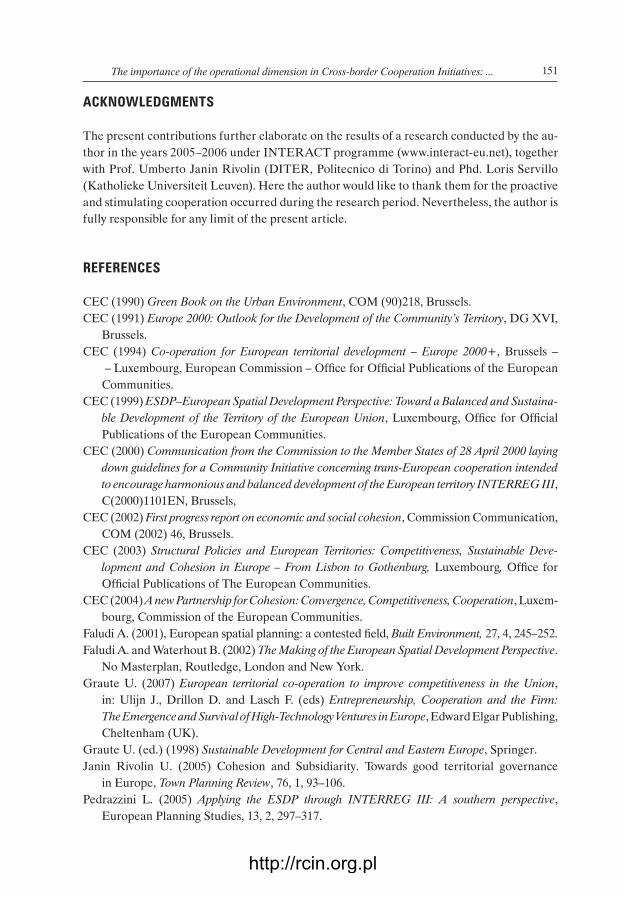
151
ACKNOWLEDGMENTS
The present contributions further elaborate on the results of a research conducted by the au-
thor in the years 2005–2006 under INTERACT programme (www.interact-eu.net), together
with Prof. Umberto Janin Rivolin (DITER, Politecnico di Torino) and Phd. Loris Servillo
(Katholieke Universiteit Leuven). Here the author would like to thank them for the proactive
and stimulating cooperation occurred during the research period. Nevertheless, the author is
fully responsible for any limit of the present article.
REFERENCES
CEC (1990) Green Book on the Urban Environment, COM (90)218, Brussels.
CEC (1991) Europe 2000: Outlook for the Development of the Community’s Territory, DG XVI,
Brussels.
CEC (1994) Co-operation for European territorial development – Europe 2000+, Brussels –
– Luxembourg, European Commission – Offi ce for Offi cial Publications of the European
Communities.
CEC (1999) ESDP–European Spatial Development Perspective: Toward a Balanced and Sustaina-
ble Development of the Territory of the European Union, Luxembourg, Offi ce for Offi cial
Publications of the European Communities.
CEC (2000) Communication from the Commission to the Member States of 28 April 2000 laying
down guidelines for a Community Initiative concerning trans-European cooperation intended
to encourage harmonious and balanced development of the European territory INTERREG III,
C(2000)1101EN, Brussels,
CEC (2002) First progress report on economic and social cohesion, Commission Communication,
COM (2002) 46, Brussels.
CEC (2003) Structural Policies and European Territories: Competitiveness, Sustainable Deve-
lopment and Cohesion in Europe – From Lisbon to Gothenburg, Luxembourg, Offi ce for
Offi cial Publications of The European Communities.
CEC (2004) A new Partnership for Cohesion: Convergence, Competitiveness, Cooperation, Luxem-
bourg, Commission of the European Communities.
Faludi A. (2001), European spatial planning: a contested fi eld, Built Environment, 27, 4, 245–252.
Faludi A. and Waterhout B. (2002) The Making of the European Spatial Development Perspective.
No Masterplan, Routledge, London and New York.
Graute U. (2007) European territorial co-operation to improve competitiveness in the Union,
in: Ulijn J., Drillon D. and Lasch F. (eds) Entrepreneurship, Cooperation and the Firm:
The Emergence and Survival of High-Technology Ventures in Europe, Edward Elgar Publishing,
Cheltenham (UK).
Graute U. (ed.) (1998) Sustainable Development for Central and Eastern Europe, Springer.
Janin Rivolin U. (2005) Cohesion and Subsidiarity. Towards good territorial governance
in Europe, Town Planning Review, 76, 1, 93–106.
Pedrazzini L. (2005) Applying the ESDP through INTERREG III: A southern perspective,
European Planning Studies, 13, 2, 297–317.
The importance of the operational dimension in Cross-border Cooperation Initiatives: ...
http://rcin.org.pl
152
Pedrazzini L. (2000) Pianifi cazione e prospettive di sviluppo per le regioni d’Europa, in: Urbanistica
Informazioni, 173.
Sbragia A. M. (2002) Conclusions to the Special Issue on the Institutional Balance and the Future
of EU Governance: The Treaty of Nice, Institutional Balance and Uncertainty, Gover-
nance: An International Journal of Policy, Administration and Institution, 15, 3, 393–411.
Scott A. (1993) Financing the Community: The Delors II Packadge, in: Lodge J. (ed.) The Euro-
pean Community and the Challenge of the Future, Printer, London, 69–88.
Tampere Ministerial (1999) Informal Meeting of EU Ministers Responsible for Spatial Plan-
ning and Urban/Regional Policy of the European Union (Tampere: Saarija¨rvi, Gummerus
Printing).
Williams R. H. (1996) European Union Spatial Policy and Planning, Chapman, London.
Giancarlo Cotella
http://rcin.org.pl

NEW VERSUS OLD CROSS-BORDER COOPERATION PROGRAMMES
IN THE EXAMPLE OF POLISH – CZECH AND POLISH – GERMAN BORDER AREAS
SYLWIA DOŁZBŁASZ and ANDRZEJ RACZYK
Institute of Geography and Regional Development
University of Wroclaw
Plac Uniwersytecki 1, 50-137 Wroclaw, Poland
e-mail: [email protected] [email protected]
Abstract. The aim of this paper is to assess the Polish–Czech border cooperation
and to compare it to the Polish–German border. The studies have been based on
the analysis of the projects qualifi ed for implementation under the INTERREG III A
programmes. Particular emphasis was put on the relationships between spatial dis-
tribution of these projects and the level of economic development of the given areas.
The generic characteristic of the projects and institutional structure of benefi ciaries
was also examined.
On the basis of the obtained results it was verifi ed how the scale of cooperation and
the amount of fi nancial outlays incurred to date affect its quality.
Key words: cross-border cooperation, border regions, INTERREG III A Program-
mes, cooperation quality
INTRODUCTION
Institutional forms of cross-border co-operation in Poland after 1989 varied in character across
borders. It was determined by formal, organizational, historical and other factors. One of
the most important incentives for co-operation development, were the funds allocated to its
implementation.
The Polish-German border area has the richest history of such co-operation in Poland. On
this border Phare CBC programme was realized for the fi rst time – already in 1994. The Czech
border region has been included in the programme since 1995 as part of a trilateral programme
Poland–Czech Republic–Germany but as part of bilateral programme only since 1999.
In consequence, the connection network that was created in the Polish-German border
region was much more complex than that existing in other border regions. The main elements
of these structures were Euroregions. Strength and durability of these relationships made for
EUROPA XXI2007, 16: 153-165
http://rcin.org.pl

154 Sylwia Dołzbłasz, Andrzej Raczyk
the fact that Polish-German co-operation was treated as a model solution and adapted to
the realities of other border regions in Poland.
The EU fi nancial involvement in cross-border programmes in the pre-accession period
was most intensive on the western border. This resulted from the fact that this border consti-
tuted the external border of the EU at the time and one of the main objectives of the Phare
programme was supporting sustainable development of the EU border regions. In the case of
the Polish-German border region, the total sum allocated for the realization of co-operation
programmes was over 450 million EUR. In the Polish-Czech border region the sum was nearly
20 times smaller and amounted to 23 million EUR. Disproportions in the duration and scale of
co-operation could be the reason for the emergence of signifi cant differences in institutional
forms of co-operation, its intensity as well as effectiveness.
The basic objective of this paper was to assess cross-border co-operation realization under
INTERREG III A Poland – Czech Republic programme and its comparison with Polish-German
programmes. Special attention was paid to the generic characterization of the projects and insti-
tutional structure of benefi ciaries. Another important objective was to analyse the relation-
ships between spatial distribution of the realized projects and the level of economic develop-
ment of particular regions. Moreover, the hypothesis assuming that the duration of co-opera-
tion and the sums allocated in the pre-accession period affect the realization of co-operation
programmes after accession was verifi ed.
This study assumes that the realized projects refl ect the reality of institutional co-operation
in the Polish-Czech border region. The authors are fully aware that the projects do not cover
the full spectrum of this co-operation. Nevertheless, they constitute its substantial element and
refl ect the real shape of cross-border co-operation and not declarative co-operation existing
only “on paper”. The analysis does not cover informal co-operation, which may have signifi -
cant infl uence on formal aspects of co-operation.
The research comprises the data concerning all the projects realized under INTERREG III A
Programme, obtained from the Ministry of Regional Development. The projects of Tech-
nical Assistance have been omitted since they are not directly connected with cross-border
co-operation. Selected public data statistics at the LAU 2 level (communes) were also used
in the research. In order to examine the main determinants of the spatial distribution of
the realized ventures a comparison of the mean for the population of the communes parti-
cipating and the communes not participating in the projects were conducted in relation to
the chosen socio-economic indicators. To this end, Leven’s method of means comparison has
been applied (Nawojczyk 2002).
DETERMINED OR FREE CO-OPERATION. CO-OPERATION DETERMINANTS
The INTERREG III A programme was a component of one of the four Community Initiatives.
Its objective was to fi nance cross-border co-operation. The Polish southern and western border
region have been supported since the moment of Poland’s accession to the EU in 2004 (Figure 1).
INTERREG III A Poland – Czech Republic Community Initiative Programme as well as other
programmes on the western border (INTERREG III A Poland (Dolnośląskie Voivodship) – Sax-
ony, INTERREG III A Poland (Lubuskie Voivodship) – Brandenburg, INTERREG III A Poland
http://rcin.org.pl
155New versus old cross-border cooperation programmes ...
(Zachodniopomorskie Voivodship) – Mecklenburg-Vorpommern / Brandenburg) were co-fi nan-
ced from the European Regional Development Fund. Between 2004–2006 the total sum allca-
ted for the Polish side from the Polish-Czech border funds totalled 18 million EUR. The sum
allocated for the Polish-German border at the time amounted to 86,6 million EUR. Thus,
the disproportion between the distribution of funds was smaller in the pre-accession period,
but still noticeable.
When analysing co-operation one should take into consideration its complex character.
It is determined not only by institutional, fi nancial and other factors but also by factors specifi c
to particular regions. Among the most important ones are disparities in the level of socio-eco-
nomic development on both sides of the border. It seems that the high level of disproportions
is an important factor hindering co-operation. It results, among other things, from different
expectations concerning potential co-operation. In this respect, the Polish-Czech border area
is an example of a region with relatively low level of disparities. In contrast, the Polish-German
border is believed to be one of the internal EU borders characterized by the highest level of
economic disparities (see ESPON in progress 2004).
Similarity of problems and objectives regarding socio-economic development is a crucial
determinant shaping co-operation. Also in this respect a striking similarity with the Polish-
-Czech border region can be observed in relation to the encountered problems (e.g. occurrence
of problem areas, joint mountain region, reorganization of traditional branches of industry) as
well as objectives (e.g. integration with the EU, economic development, search for activation
incentives). In the case of Germany, greater emphasis was placed on the achievement of inner
coherence, especially in the economic aspect.
Figure 1. Spatial scope of the programmes carried out in Poland between 2004–2006, within the framework of Community Initiatives INTERREG III A
Source: fi gures 1–5 own study.
http://rcin.org.pl
156 Sylwia Dołzbłasz, Andrzej Raczyk
Moreover, it needs to be stressed that the cultural barrier was smaller on the southern
border than that on the western border (the persistence of stereotypes, attitude towards
neighbouring nations, historical experiences, etc.). In both cases the border was established on
the basis of environmental features. The southern border, running mainly across mountainous
region turned out to be less of a barrier than Polish-German river border. In the latter case
it constitutes a signifi cant impediment affecting free movement of people and goods. Over-
coming this barrier requires considerable fi nancial outlays (e.g. bridge building). It restricts
the freedom of border crossing (Więckowski 2004) – the total number of border crossings
is 40 (including 3 only for small border traffi c) compared to about 113 border crossings to
the Czech Republic (23 only for small border traffi c and 42 on the tourist trails). Such
a structure of border crossings greatly facilitates local traffi c on the southern border.
The character of co-operation in the Polish-Czech border region is determined to a great
extent by environmental determinants and is highly affected by the borders’ location in tour-
isty areas (mountain tourism, sentimental tourism, winter sports, a great number of historical
buildings) as well as great natural value of the region (numerous national and landscape parks).
It not only facilitates but also ‘determines’ potential directions of co-operation, in accordance
with the unique character of the area. The Polish-German border region is characterized by
the lack of one, clear co-operation objective. Consequently, there is greater potential for in-
tegration in the Polish-Czech border region than that in the Polish-German border region.
At the same time, it may be connected with the creation and consolidation of ‘co-operation
monoculture’ dominated by tourist-oriented activities. However, the occurrence of a clear
integrating factor in the border region may create favourable conditions for the creation of
a truly trans-border region.
Institutional system connected with co-operation existing on the southern border in
the pre-accession period was less developed than that on the western border. This was
the result of the fact that Euroregions which played the most important role in the shaping of
cross-border co-operation had fewer opportunities for obtaining funds. Poland’s accession to
the EU and the inclusion of the country in the INTERREG III A programme brought about
the formation of a new institutional structure dedicated to cross-border co-operation. In con-
sequence, the role of Euroregions in the shaping of co-operation was limited, compared to that
in the pre-accession period. It was also accompanied by the appearance of a number of new
institutions managing the implementation of co-operation programmes (e.g. Ministry of
Regional Development, Governor’s Offi ce, Marshal Offi ce). The necessity for the realized
projects to comply with EU requirements and national legislation brought about signifi cant
changes in the rules concerning the running of programmes compared to the Phare pro-
gramme. As a result, potential benefi ciaries had to learn again how to function in a new formal
institutional system.
The development of Polish-Czech cross-border co-operation has been relatively
widely presented in literature. For the most part, however, it contains works dedicated
to particular areas (Euroregions, voivodships, communes) or thematic areas (e.g. trans-bor-
der trade) (e.g. Pokluda 2005; Zapletalova 2005). Relatively few of the works are dedicated
to a complex assessment of the effects of co-operation realization in the Polish-Czech
cross-border region. The Polish-German border region is more thoroughly analysed (Gorzelak
et al. 2004).
http://rcin.org.pl

157New versus old cross-border cooperation programmes ...
PROJECT ANALYSIS
In the period under examination, 108 projects were realized under INTERREG III A Poland-
-Czech Republic Programme (excluding Technical Assistance). The total sum allocated from
ERDF was almost 17 million EUR (excluding Technical Assistance). The projects under
research covered about 14.9 million EUR, which was 88 % of the funds planned for the pro-
gramme. It means that the research covered the majority of the projects and its results may be
considered reliable for the whole programme. On the Polish-German border the realization of
the programme was even slightly faster.
Taking into consideration the long preparation process by the managing authority as well
as the European Commission approval process, we can assess the use of the funds as substan-
tial. Thus, the dangers raised by a number of authors suggesting a limited ability to absorb
means from structural funds did not occur. This was the result of a keen interest on the part of
potential benefi ciaries as well as the effi ciency of administrative structures.
On the southern border the volume structure was greatly dominated by very small and
small projects, the ones with subsidy volume of less than 100,000 EUR. The structure showed
a pronounced lack of large projects with subsidy value exceeding 1 million EUR. In this
respect the southern border area differed signifi cantly from the Polish-German border region.
This was the result of a different generic structure of the realized projects.
When analysing projects in the respect of subsidy volume it appears that the smallest
projects were realized by higher education institutions and associations while the largest ones
were realized by regional self-government and central administration. It confi rms the exist-
ence of a fi nancial barrier, especially in relation to non-profi t organizations.
Due to variances in nomenclature and factual contents of programme priorities and meas-
ures the generic analysis was based on intervention categories used by the European Com-
mission in monitoring and reporting. The generic structure was dominated by tourist projects,
mainly non-material in character – about 37% and together with property investments – as
much as 46% (Figure 2). An important role was also played by basic infrastructure - road
investments, social infrastructure, sewage system, bicycle lanes (about 36%). It needs to be
stressed that there is a pronounced lack of projects dedicated to human resources. The most
important features distinguishing the structures on the southern and western borders were
related to the following factors:
- lesser diversity of projects on the southern border,
- substantial prevalence of tourist projects, including joint services for tourism industry,
- clearly higher share of scientifi cally advanced research projects conducted by universities and
research institutes as well as transfer of technology and innovation,
- higher share of projects in the fi eld of renewable sources of energy and joint services for
entrepreneurs,
- smaller share of basic infrastructure projects, including social infrastructure, healthcare and
sewage systems,
- lack of human resources projects.
Such project structure clearly confi rms the infl uence of the previously described integrat-
ing factor (environmental features). It directed the programme clearly towards trans-border
tourism. It remains an open question to what extent it is the refl ection of strong needs on
http://rcin.org.pl

158 Sylwia Dołzbłasz, Andrzej Raczyk
the part of potential benefi ciaries and to what extent it is the consequence of a lack of alterna-
tives for socio-economic development. The development of such specifi city in the programme
realization despite its uniform rules and implementation structures nationwide seems positive
as it combines the general objective of the INTERREG III A programme of co-operation
development with existing, real opportunities for local development (e.g. tourism).
Signifi cance of infrastructural undertakings suggests that cross-border co-operation was
still connected with the creation of physical aspects of co-operation. On the one hand, it
resulted from the existing, immense investment needs reported by local and regional self-
-governments, especially in the fi eld of road and environment infrastructure (sewage system).
On the other hand, relatively simple (and very imprecise) formal requirements concerning
cross-border impact triggered the submittance of infrastructural applications, which were
in fact converted Structural Funds regional programme projects (Integrated Programme
of Regional Development). This was basically caused by excessive focus on infrastructural
investments on the part of local and regional self-governments and their tendency to treat
Areas of Intervention (OJ L 063, 03/03/2001): 1306 Renovation and development of villages, 1307 Diversifi cation of agricultural activities, 1312 Protection of the environment, 163 Business advisory services, 164 Shared business services, 171 Tourism, physical investment, 172 Tourism, non-physical investment, 173 Shared services for the tourism industry, 181 Research projects based in universities and research institutes, 182 Innovation and technology transfers, 183 RTDI Infrastructure, 21 Labour market policy, 23 Developing educational and vocational training, 24 Workforce fl exibility, 3122 Regional/local roads, 3123 Cycle tracks, 314 Airports, 315 Ports, 319 Intelligent transport systems, 323 Services and applications for the citizen, 324 Services and applications for SMEs, 343 Urban and industrial waste, 344 Drinking water, 345 Sewerage and purifi cation, 351 Upgrading and rehabilitation of industrial and military sites, 352 Rehabilitation of urban areas, 353 Protection, improvement and regeneration of the natural environment, 354 Maintenance and restoration of the cultural heritage, 36 Social and public health infrastructure
Figure 2. The number of projects qualifi ed for realization in the Polish partof the Polish–German and Polish–Czech border area according to intervention category
http://rcin.org.pl
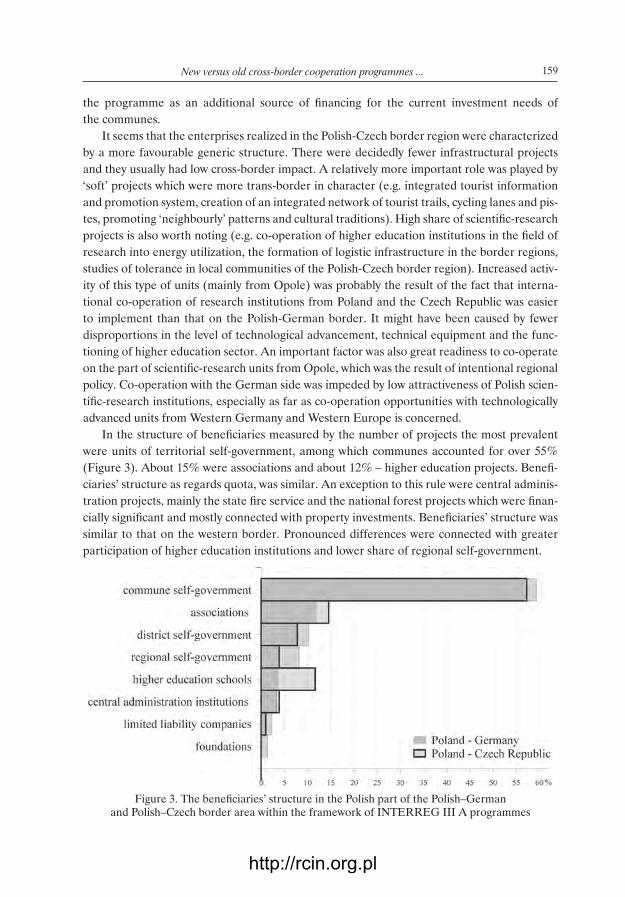
159New versus old cross-border cooperation programmes ...
the programme as an additional source of fi nancing for the current investment needs of
the communes.
It seems that the enterprises realized in the Polish-Czech border region were characterized
by a more favourable generic structure. There were decidedly fewer infrastructural projects
and they usually had low cross-border impact. A relatively more important role was played by
‘soft’ projects which were more trans-border in character (e.g. integrated tourist information
and promotion system, creation of an integrated network of tourist trails, cycling lanes and pis-
tes, promoting ‘neighbourly’ patterns and cultural traditions). High share of scientifi c-research
projects is also worth noting (e.g. co-operation of higher education institutions in the fi eld of
research into energy utilization, the formation of logistic infrastructure in the border regions,
studies of tolerance in local communities of the Polish-Czech border region). Increased activ-
ity of this type of units (mainly from Opole) was probably the result of the fact that interna-
tional co-operation of research institutions from Poland and the Czech Republic was easier
to implement than that on the Polish-German border. It might have been caused by fewer
disproportions in the level of technological advancement, technical equipment and the func-
tioning of higher education sector. An important factor was also great readiness to co-operate
on the part of scientifi c-research units from Opole, which was the result of intentional regional
policy. Co-operation with the German side was impeded by low attractiveness of Polish scien-
tifi c-research institutions, especially as far as co-operation opportunities with technologically
advanced units from Western Germany and Western Europe is concerned.
In the structure of benefi ciaries measured by the number of projects the most prevalent
were units of territorial self-government, among which communes accounted for over 55%
(Figure 3). About 15% were associations and about 12% – higher education projects. Benefi -
ciaries’ structure as regards quota, was similar. An exception to this rule were central adminis-
tration projects, mainly the state fi re service and the national forest projects which were fi nan-
cially signifi cant and mostly connected with property investments. Benefi ciaries’ structure was
similar to that on the western border. Pronounced differences were connected with greater
participation of higher education institutions and lower share of regional self-government.
Figure 3. The benefi ciaries’ structure in the Polish part of the Polish–Germanand Polish–Czech border area within the framework of INTERREG III A programmes
http://rcin.org.pl

160 Sylwia Dołzbłasz, Andrzej Raczyk
It needs to be stressed that the share of grass-roots, non-administrative initiatives repre-
sented by associations and social organizations was low – barely around 15%. It seems that
from the point of view of cross-border co-operation their role should be much more signifi cant.
This is indicative of non-government sector weakness, diffi culties in obtaining necessary funds,
which, in turn, is caused by a relatively low level of social capital in Poland (Janc 2006).
Despite a very similar structure of benefi ciaries in Polish-German and Polish-Czech pro-
grammes, co-operation directions were different (Figure 4). Although types of benefi ciaries
were generally connected with types of projects, they were not the only determining factors.
Territorial self-government units’, preferences towards basic infrastructure projects was noti-
ced by the authors in the earlier projects concerning the Polish eastern and western border
regions. In the Polish-Czech programme we can notice only a slight change of this preference.
It is indicative of the fact that the occurrence of a strong integrating factor may affect co-
-operation directions even when the structure of entities implementing this co-operation does
not change. However, the character of co-operation between associations, social organizations
and higher education institutions remained unchanged. However, they were not analysed thor-
oughly due to a very small number of SMEs participating in the programme and signifi cant
infl uence of incidental changes on the structure of the realized projects.
The main factors shaping spatial distribution of the realized projects in the Polish-Czech
border region was the factor of border proximity (Figure 5). In contrast to the western border,
no spatial concentration was observed there. An important role in spatial distribution was
played by tourist attractiveness of particular regions as well as the existence of spa and tourism
resorts (the Stołowe Mountains, the Karkonosze Mountains, the Silesian Beskid Mountains).
Signifi cant activity of benefi ciaries from Opole also needs to be emphasized. It was probably
the result of intentional and active policy of local self-governments and higher education
institutions. Interestingly, Jelenia Góra, Wałbrzych and Bielsko-Białą played a relatively small
role in the shaping of this co-operation despite their location which should encourage high
activity.
Taking into consideration the location of the projects, a clear prevalence of urban com-
munes (about 42%) in the project shaping was observed. This might have been caused largely
Figure 4. Distribution of projects realized in the Polish part of the Polish–Germanand Polish –Czech border area within the benefi ciaries’
http://rcin.org.pl
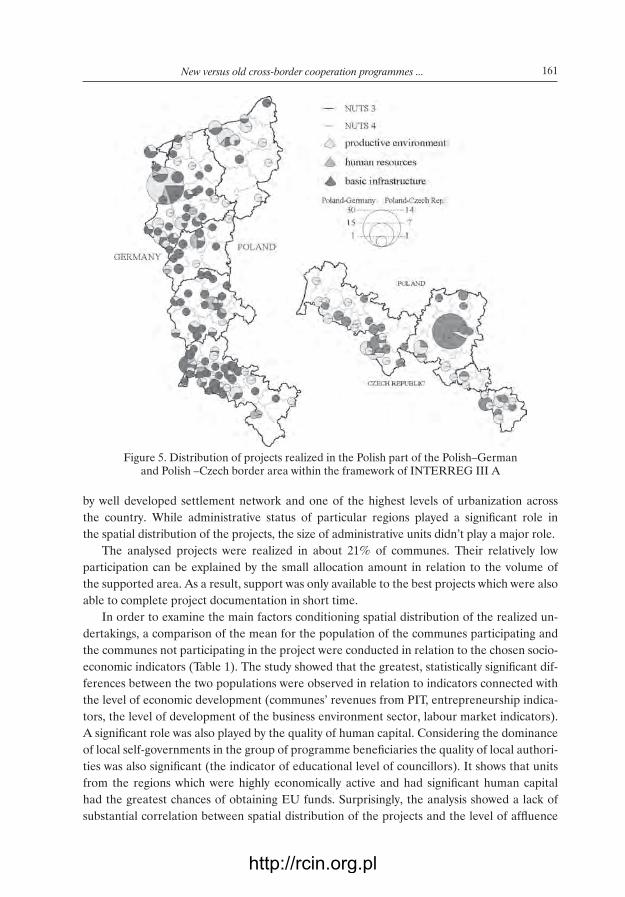
161New versus old cross-border cooperation programmes ...
by well developed settlement network and one of the highest levels of urbanization across
the country. While administrative status of particular regions played a signifi cant role in
the spatial distribution of the projects, the size of administrative units didn’t play a major role.
The analysed projects were realized in about 21% of communes. Their relatively low
participation can be explained by the small allocation amount in relation to the volume of
the supported area. As a result, support was only available to the best projects which were also
able to complete project documentation in short time.
In order to examine the main factors conditioning spatial distribution of the realized un-
dertakings, a comparison of the mean for the population of the communes participating and
the communes not participating in the project were conducted in relation to the chosen socio-
economic indicators (Table 1). The study showed that the greatest, statistically signifi cant dif-
ferences between the two populations were observed in relation to indicators connected with
the level of economic development (communes’ revenues from PIT, entrepreneurship indica-
tors, the level of development of the business environment sector, labour market indicators).
A signifi cant role was also played by the quality of human capital. Considering the dominance
of local self-governments in the group of programme benefi ciaries the quality of local authori-
ties was also signifi cant (the indicator of educational level of councillors). It shows that units
from the regions which were highly economically active and had signifi cant human capital
had the greatest chances of obtaining EU funds. Surprisingly, the analysis showed a lack of
substantial correlation between spatial distribution of the projects and the level of affl uence
Figure 5. Distribution of projects realized in the Polish part of the Polish–Germanand Polish –Czech border area within the framework of INTERREG III A
http://rcin.org.pl

162 Sylwia Dołzbłasz, Andrzej Raczyk
of local self-governments and social capital. The studies conducted by the authors in other
Polish border regions confi rmed that the pivotal role in the creation of co-operation is played
by human capital. This factor was statistically signifi cant in all of the analysed programmes
(Poland-Mecklenburg Programme, Poland-Brandenburg Programme, Poland-Saxony Prog-
ramme, Poland-Ukraine-Belarus Programme). The majority of them were also greatly affected
by economic and social capital factors.
It should be considered that the results obtained may be the consequence of the project
location, i.e. the prevalence of urban communes. In order to verify these conditions concerning
spatial distribution the analysis was conducted separately for the sub-population of com-
munes: urban, rural and urban-rural ones. In the population of urban communes the results
of the analysis confi rmed previously obtained results. The study of rural communes confi rmed
the signifi cance of only a few economic factors (entrepreneurship and the development
of business environment sector). In the case of urban-rural communes no signifi cant infl uence
of spatial distribution was observed. In the latter case it might have been caused by specifi city
of these units connected with their internal dichotomy.
CONCLUSIONS
On the basis of the conducted analysis it can be stated that cross-border co-operation in the
Polish-Czech border region was shaped differently from the other borders. It was mainly
caused by the existence of a strong integrating factor connected with the development of tour-
ism in the joint mountainous region.
Apart from the dominance of the projects concerning tourism an important role in
the structure of intervention categories was played by basic infrastructure projects. Although
the stage of shaping physical aspects of co-operation was signifi cant, gradual evolution of
intervention seems necessary. Above all, particular emphasis should be placed on promoting
projects from the fi eld of human resources, economic co-operation, technological develop-
ment and spatial planning.
The demonstrated relationship between programme benefi ciary structure and the generic
structure of the projects indicates that the achievement of this objective requires a change in
the structure of benefi ciaries. Therefore, it would be desirable to increase the signifi cance of
associations, social organizations and scientifi c centres in shaping cross-border co-operation as
the conducted analysis indicates their preference of advanced co-operation projects.
Changes in the mentality and attitude of the inhabitants should play an important role
in stimulating social activity and shaping bottom-up initiatives. One of the most signifi cant
challenges will be in the thinking of inhabitants, i.e. the consolidation of awareness of a joint
cross-border region, the shaping of which should be considered a partnership.
The study also revealed that the programmes realization is dependent on the level of
human capital as well as economic development of particular regions. In a limited sense,
it may also cause further polarization within the border region, and above all between urban
and rural regions.
Spatial distribution shows a clear prevalence of the projects realized in the close proxim-
ity of the border. Compared to the Polish-German border area the proximity factor played
http://rcin.org.pl

163New versus old cross-border cooperation programmes ...
Table 1. Selected social-economic indicators for which the difference between the mean values within
the population of communes realizing and not realizing INTERREG III A projects are statistically
signifi cant (Levene’s test)
Specifi cation
The mean value for the communes in which
Differences in medium-
sized (c-b)/b*100
(in %)
INTERREG III A projects
are not realized
INTERREG III A projects are realized
a b c d
Total cross-border area
Number of entities 186 49 -
Commercial companies for every 10 000 adults 27 39 43
Joint venture companies for every 10 000 adults 9 12 42
Natural persons’ business entities for every 1000 adults
56 72 29
Communes’ income from PIT per inhabitant 233 274 17
Contribution of business entities from the business environment
15 18 27
Unemployment per 100 inhabitants (%) 8 9 15
Employees per 100 inhabitants (%) 12 17 43
Contribution of councilors with higher education 32 43 36
Contribution of inhabitants with higher education 4 6 38
Contribution of inhabitants with primary and vocational education
57 53 93
Urban community
Number of entities 27 29 -
Natural persons’ business entities for every 1000 adults
85.9 99.0 15
Contribution of councilors with higher education 54.1 60.0 11
Contribution of inhabitants with higher education 7.4 8.3 11
Contribution of inhabitants with primary and vocational education
47.9 45.8 96
Rural community
Number of entities 141 30 -
Natural persons’ business entities for every 1000 adults
55.2 70.1 27
Number of business environment entities per 1000 inhabitants
8.8 10.0 113
Urban-rural community
Number of entities 83 56 -
Source: own study.
http://rcin.org.pl
164 Sylwia Dołzbłasz, Andrzej Raczyk
a defi nitely greater role. Very high level of permeability of the Polish-Czech border and
the fact that it does not constitute a signifi cant barrier affected spatial aspect of co-operation
(i.e. concentration of the projects along the border).
The conducted research did not confi rm the hypothesis that there was a connection
between the duration and the scale of the realized cross-border co-operation programmes
in the pre-accession period and the quality of co-operation after the accession. One of
the most important reasons for this was the lack of institutional continuity and new rules gover-
ning the realization of co-operation programmes. It meant the creation of the institutional
co-operation structure from scratch. Probably much more intensive informal connections in
the Polish-German border region did not yet translate into real co-operation under INTER-
REG III A programmes.
The fact that this connection was not refl ected in the study may indicate high susceptibility
of cross-border institutional co-operation to changes in the instruments shaping it (structures,
formal-legal arrangements, fi nancing etc.) It also suggests a lost opportunity for creating higher
quality projects in the western border region, which could be used thanks to the continuity of
formal and informal connections.
The existence of the integrating factor, may signifi cantly dynamize co-operation and deter-
mine its character, like in the case of Polish-Czech border region. It concerns institutional co-
-operation which was the subject of the analysis. It also seems to apply to informal co-operation.
However, the confi rmation of such hypothesis needs to be proved by an independent study.
Experiences to date, as well as a substantial increase in formal requirements in the next
programme period 2007–2013, should result in evolution (modifi cation) of the current co-ope-
ration model in the Polish-Czech border regions. There is a serious threat of transposing
the current directions (the dominance of basic infrastructure) and benefi ciaries’ structure
(the dominance of local self-governments) to the next programme period. It requires
the creation of a coherent, long-term policy in the scope of formal and informal cross-border
co-operation. Such policy should focus on the formation of conditions for workable trans-border
co-operation, the creation of players for this co-operation (especially in the non-governmental
sector) as well as integration of the border region.
REFERENCES
Ciok S., Raczyk A. (forthcoming) Implementation of the EU Community Initiative INTERREG
III A at the Polish-German border. The Attempt of an Evaluation.
ESPON Secretariat (2004) Espon in progress – Preliminary results by autumn 2003, European
Spatial Planning Observation Network, Luxembourg.
Gorzelak G., Bachtler J., Kasprzyk M. (eds) (2004) Współpraca transgraniczna w Unii Euro-
pejskiej. Doświadczenia polsko-niemieckie, Wydawnictwo Scholar, Warszawa.
Janc K. (2006) Human and social capital in Poland – spatial diversity and relations,
in: Komornicki T. and Czapiewski K.Ł. (eds) Core and peripheral regions in Central and
Eastern Europe, EUROPA XXI, 14, PTG, IGiPZ PAN, Warszawa.
Nawojczyk M. (2002) Przewodnik po statystyce dla socjologów, SPSS, Kraków.
OJ L 063, 03/03/2001 P. 0021 – 0043, Commission Regulation (EC) No 438/2001 of 2 March 2001
http://rcin.org.pl

165New versus old cross-border cooperation programmes ...
laying down detailed rules for the implementation of Council Regulation (EC) No 1260/1999
as regards the management and control systems for assistance granted under the Structural
Funds.
Pokluda F. (2005), Orlicko: a rural microregion on the Czech-Polish state border, in: Komornicki T.,
Czapiewski K. Ł. (eds) New spatial relations in new Europe, EUROPA XXI, 13, PTG,
IGiPZ PAN, Warszawa.
Więckowski M. (2004) Przyrodnicze uwarunkowania kształtowania się polsko-słowackich więzi
transgranicznych, Prace Geografi czne, 195, IGiPZ PAN, Warszawa.
Zapletalova J. (2005) Geography of the Polish–Czech borderland: the case of Euroregion
Beskydy, in: Komornicki T. and Czapiewski K. Ł. (eds) New spatial relations in new Europe,
EUROPA XXI, 13, PTG, IGiPZ PAN, Warszawa.
http://rcin.org.pl

http://rcin.org.pl
RURAL AREAS ALONG THE EASTERN BORDER OF THE EUROPEAN UNION –
– PROBLEMS AND PERSPECTIVES OF DEVELOPMENT WITH SPECIAL
CONSIDERATION OF TOURISM
(ON THE EXAMPLE OF THREE POLISH MUNICIPALITIES)
MARIA BEDNAREK
Institute of Geography and Spatial Organization
Polish Academy of Sciences
Twarda 51/55, 00-818 Warszawa
e-mail: [email protected]
Abstract. Local development of rural areas situated at the eastern EU border con-
stitutes the main problem that the paper focuses on. The study area consists of three
primarily agricultural communes. The socio-economic condition of the area is weak
(like the condition of the other eastern-border areas) but there is a potential for
the agro-tourist development (based on traditional rural and semi-natural land-
scape, as well as the natural valley of the border river Bug). The paper presents
natural conditions, socio-economic situation and the problem of the natural and
political border. The documents issued by the communal authorities concerning
the ways of development (strategies of local development), as well as current
activities of local authorities toward tourism development are examined in the paper.
Findings from the interviews with farmers providing agro-tourist services are presen-
ted. On the basis of all the research fi ndings the author tries to evaluate the perspec-
tives of development of the study area, especially in terms of tourism and the bor-
der-adjacent location.
Key words: rural tourism, border-adjacent location, Dubienka, Horodło, Hrubieszów
INTRODUCTION
The study area is constituted by three communes in Poland, located in the province of Lublin,
at the border with Ukraine (Figure 1). The province of Lublin (a NUTS 2 region) is a typi-
cally agricultural area, characterized by a low level of socio-economic development. Before
the accession of Romania and Bulgaria to the European Union this was the least developed
region of the EU, with the GDP value per capita in 2004 at 35% of the average for the NUTS
2 regions (Growing regions… 2007). The municipalities investigated are typical examples of
the peripheral areas of this region.
EUROPA XXI2007, 16: 167-179
http://rcin.org.pl

168 Maria Bednarek
The study area has the surface of not quite 500 sq. km. The eastern boundary of each of
the three communes is constituted by the river Bug, being at the same time the state boundary
and the boundary of the European Union, and, since December 2007, also the boundary of
the Schengen zone. The study area is characterized by low population density and domination
of farming in the structure of the economy, while their natural and landscape qualities are
potentially a good basis for the development of agro-tourism.
The purpose of this paper is to provide a diagnosis of the socio-economic problems of the stu-
dy area, with special consideration of the role of closeness to the border and the problem of
tourism-related development, as well as an attempt of assessing the development perspectives
in the light of the existing internal and external conditioning.
THE SOCIO-ECONOMIC SITUATION OF THE COMMUNES STUDIED AGAINST THE BACKGROUND OF THEORETICAL QUESTIONS AND BORDERLAND PROBLEMS ON THE REGIONAL SCALE
Location at the state border is associated with specifi c conditions of economic development.
Boundary is often analyzed by scholars in terms of a spatial barrier, that is – an obstacle for
Figure 1. Location of the study area
http://rcin.org.pl
169Rural areas along the eastern border of the European Union ...
the connections, translocations and interactions in physical space (Rykiel 1991); a spatial bar-
rier can be characterized by different degrees of permeability (Rykiel 1985), depending upon
numerous natural and man-made factors. One of the fi rst theories concerning the economic
aspects of the border-adjacent location was described by W. Christaller and A. Lösch, who
maintained that functioning of the market areas located close to the border is subject to a sig-
nifi cant limitation on the reach of the zone of infl uence in comparison with the areas located
deeper in the country, and so the development opportunities of the borderlands are smaller.
State boundaries cut across the natural networks of market areas and unilaterally “close out”
the border areas (Falkowski 2006). Studies, conducted for the border areas in Poland in the years
1998-2003 show that all these areas developed much more slowly than the rest of the country
and that the process of marginalization was progressing there (Mierosławska 2005). Yet, even
before the accession of Poland to the European Union the areas of the Polish western and
south-western borderlands developed much better, at least in the context of the transboundary
connections, than those of the eastern borderland. This observation is confi rmed by the data
concerning the exports from individual counties and the cross-border traffi c taking place along
the main transport corridors in Poland in 2000. Both the values of exports and the intensity of
the cross-border traffi c were much higher within the western and south-western borderlands.
After Poland had joined the European Union, the values of both of the indicators mentioned
generally increased, with the eastern borderland remaining in a clearly worse situation than
the western and the south-western ones. The share of the counties located along the eastern
border in foreign trade is marginal, except for the counties, in which the cargo border crossings
are located (Komornicki 2007).
The areas of eastern borderland are characterized, when seen against the background of
the rest of the country, by a lower level of education of the population, higher share of popula-
tion employed in agriculture, lower share of urban population and lower number of businesses
(Mierosławska 2005). These areas are not attractive for external investors (Komornicki 2007).
Besides, the demographic structure is particularly disadvantageous. The majority of areas, situ-
ated along the eastern border, are considered problem areas in terms of the demographic situa-
tion, with high shares of population in post-productive age, low natural increase indicators, low
migration balance, and a shortage of females in the age of 20–29 years (Frenkel 2000).
The possibilities of development on the basis of transboundary collaboration of the areas
situated along the eastern boundary are signifi cantly weakened by, fi rst of all, the lengthy bor-
der crossing procedures and the customs and visa formalities, but also by the very low number
of border crossing points. In the case of the border with Ukraine, whose length is 535 km,
there are only six road border crossings, meaning that there is, on the average, one road border
crossing per 90 km of the boundary (for comparison, on the Polish-German border there is
one road border crossing per 18 km). Simultaneously, the indicator of density of roads cross-
ing Polish-Ukrainian border is the worst in relation to the remaining Polish borders (Fedan,
Makieła 2006). It was shown by the studies, concerning the Polish-Ukrainian borderland, that
the transboundary collaboration is there in the initial phase of development, as demonstrated
by the lack of signifi cant, deeply rooted joint economic or infrastructural undertakings (Fedo-
niuk et al. 2005).
The municipalities under study are a good example of appearance of the problems here
mentioned on a local scale. The border-adjacent, peripheral location with respect to large
http://rcin.org.pl

170 Maria Bednarek
urban centres, domination of traditional farming in the structure of economy, and lack of man-
ufacturing form the conditions for the low level of socio-economic development of these areas.
Population numbers in all the three communes systematically, even though slowly, decrease,
while the share of population in post-productive age increases, amounting in the communes
investigated to between 18 and 22%, which is well above the average for Poland (15.7%).
Young people tend to leave these areas and move to town in search for jobs. Peripheral loca-
tion and other factors make the municipalities under study little attractive for settling, as dem-
onstrated, for instance, by the fact that on the entire area, inhabited altogether by some twenty
thousand persons, only 13 new housing buildings were put to use in 2006 (BDR 2006).
Border adjacency does not constitute a development factor for these areas. Over the bor-
der segment of 91 km there is only one border crossing (road crossing for persons in vehicles),
of local signifi cance, in Zosin. This is, at the same time, the location of the sole road bridge
on Bug river over the entire border segment considered. There are no road cargo or walker
crossings. It should also be added that along the borders of the three consecutive communes
to the South (roughly 70 km in total) there is no border crossing at all. One can hardly speak,
therefore, of the development of business links and the collaboration between the neighboring
areas, situated on both sides of the border. It is worthwhile to quote here the results of
the survey study, performed on the area in question, among the business owners. They decla-
red that, despite being located in the border zone, they did not export to Ukraine and did not
plan to start such activity (Strategia rozwoju gminy Hrubieszów 1998).
It turns out that even in the nearest neighbourhood of the sole border crossing on the area
of the three communes investigated services develop to a very limited extent – there are just
two little bars and two groceries. Demand for service would have been certainly much higher,
were the cargo traffi c passing through the area (in such a case, though, one should not forget
about the negative effects, which would have accompanied the cargo traffi c, like, for instance,
worsened life quality of the inhabitants and lowering of the tourist attractiveness).
Even though a railway border crossing is situated on the territory of one of the municipali-
ties considered, it functions solely for the Wide-Gauge Metalworking Railway Line, connect-
ing Silesia in Poland with Ukraine, and has no economic signifi cance for the area analyzed.
Farming structure on the area analyzed is fragmented, with domination of small farms –
– the shares of the farms having less than 7 hectares range in the communes considered between
65 and 78%. Besides, there are numerous farms managed by the retired and the pensioners.
In two out of the three communes considered more than half of farms produce solely or mostly
for own use (subsistence farming). This is a very high share and is an evidence for a low eco-
nomic activity of the farmers. Let us add yet that in only approximately 7% of farms some
non-agricultural activity is also conducted.
The areas here considered struggle with serious problems in the domain of basic technical
infrastructure (Figure 2). This even concerns the equipment with basic sanitary installations.
Thus, in the communes studied, according to the data as of 2002, between 40 and 60% of houses
were not equipped with a bathroom or a fl ush toilet. These are, again, very high rates. Lack
of these installations applies primarily to old houses, not repaired for a long time, inhabited
by the retired and the pensioners. This is also linked with a relatively low percentage share of
the population, using water supply and sewage systems. There are few businesses – their number
per 1,000 inhabitants is at 30 to 35, which is decidedly below the average for the rural communes
http://rcin.org.pl

171Rural areas along the eastern border of the European Union ...
in Poland (57). The revenues of the municipal budgets are low – per capita they are at some
80% of the average revenues, per capita, for the rural municipalities in Poland (BDR 2006).
Figure 2. Selected indicators concerning the development of infrastructure of the communes studied against the background of rural communes in Poland
0
10
20
30
40
50
60
70
80
Dubienka Horodło Hrubieszów Poland-averagevalue for ruralcommunes
shar
e of
dw
ellin
gs w
ith b
athr
oom
(%)
0
5
10
15
20
25
Hrubieszów Dubienka Horodło Poland-averagevalue for ruralcommunes
shar
e of
pop
ulat
ion
usin
g se
wag
e sy
stem
(%)
0
10
20
30
40
50
60
70
Dubienka Horodło Hrubieszów Poland-averagevalue for ruralcommunes
shar
e of
dw
ellin
gs w
ith c
entr
al h
eatin
g sy
stem
(%)
http://rcin.org.pl

172 Maria Bednarek
PERSPECTIVES OF DEVELOPMENT OF THE COMMUNES IN THE LIGHT OF STRATEGIC DOCUMENTS. NATURAL CONDITIONS FOR THE DEVELOPMENT OF TOURISM
In order to confront the situation here presented with the approach of the local self-governmen-
tal authorities to the problems of development of the communes, it is worth having an insight
in this place into the directions of development, adopted by the authorities of these communes
in the strategic documents during the recent years. The strategies of development of two out
of the three communes contain the formulations constituting the evidence, that high hopes are
placed in the opportunities for the economic development by taking advantage of the border-
-adjacent location. Among the strong points of the communes the border-adjacent location
is mentioned, which is supposed to be the basis for economic activation, including deve-
lopment of cross-border trade. Close cooperation with Ukraine, according to one of the visions
of development of the communes, shall bring about the development and the strengthening of
the enterprises, providing jobs for the population, who would abandon the direct engagement
in farming. This shall also contribute to the development of tourism (Strategia rozwoju gminy
Horodło 1999). In the case of the third of the municipalities considered there are no formula-
tions whatsoever in the strategic documents, concerning the role of the state border in the eco-
nomic development. And this appears to be a more realistic perspective.
Besides, each of the communes saw the chances of bettering their economic situation in
the changes in the farm structure, the development of commercial farming, as well as, on the other
hand, in the development of the non-agricultural functions, and especially tourism. It is worth
noting here that favouring of the tourism-oriented direction of development is a frequent
phenomenon in the policy of the local self-governmental authorities, even on the areas, where
tourism has not been developing to date. One can notice in Poland a kind of “fashion” of activa-
ting the traditionally agricultural areas through the development of tourism, including, in many
instances, quite unjustifi ed treatment of tourism as the means for solving the economic prob-
lems of the countryside.
In view of the diffi cult socio-economic situation of the communes in question, their author-
ities also put emphasis on the important role of development of tourism. The basis for such
an approach is constituted by the attractive natural and cultural assets of these areas. Almost
half of the total area of the three communes is covered by the landscape park and the so-called
areas of protected landscape. These forms of protection are created so as to preserve the spe-
cial natural, cultural and historical values and the features of landscape. Among the most
important parts of the heritage there are: an extensive forest (about 8,220 hectares) of natural
character, fertile habitats, multi-level ecological structure with a great number of plant species,
and non-intensively used meadows and pastures. The valley of the border river Bug is also of
high natural importance. The valley of the meandering river is wide and natural, covered by
riverine fl oodplain forests, meadows, and xerothermic grasslands, with oxbow lakes. The river
is a migration corridor and habitat area for many birds, e.g. predatory birds (Rąkowski 2002).
Due to the natural values of this region, four NATURA 2000 areas were created here. A sign-
ifi cant part of the area considered is characterized by a rolling terrain relief, with attractive-
ness of the landscape enhanced by small valleys and in-fi eld groves. Farming land, and espe-
cially cultivated fi elds, constitutes a typical element of this landscape. Low population density
http://rcin.org.pl

173Rural areas along the eastern border of the European Union ...
(41 persons per sq. km) is conducive to the strengthening of the natural qualities. The settle-
ment structure is formed by smallish villages (the biggest of them of around 1,500 inhabitants),
with a high share of the old, wooden structures. According to the BDR (Bank of Regional Data)
data of 2002, the share of houses from before 1945 in the commune of Dubienka was at close
to 37%, though in the communes of Horodło and Hrubieszów these shares were lower (at, res-
pectively, 19 and 10%). Farms are usually small, around six hectares on the average. The area
analyzed is characterized, therefore, by a typical rural landscape, well fi t for the agro-tourist
use. Of importance for the development of tourism may also be the historical-cultural assets of
the area. There are villages with multi-religious traditions, featuring historical religious archi-
tecture, places of historical events, as well as numerous valuable archeological sites, including,
for instance, the settlements and the burying grounds of Goths from the 2nd-4th centuries AD
(Plan rozwoju lokalnego gminy Hrubieszów 2004).
In the development strategies of the communes considered, elaborated since 1998, nume-
rous detailed objectives were formulated in connection with the potential development of tour-
ism. Among these detailed objectives one fi nds the following ones: infrastructural develop-
ment of the recreational and leisure areas (Hrubieszów), modernization of infrastructure asso-
ciated with servicing of the population – trade, catering and accommodation infrastructure,
entertainment (Horodło), reclamation of the abandoned buildings for purposes of tourism
and recreation services (Horodło), activation of the local society through trainings (Horodło,
Hrubieszów), increase of the incomes of the population through development of agro-tourism
(Dubienka), and the like. The here quoted strategy formulations demonstrate that the self-
-governmental authorities do actually attach high importance to the development of the tourist
function. It remains, however, still to be answered, to what extent the objectives concerning
the development of tourism, formulated a couple of years ago by the local authorities, are rea-
listic. In order to verify the state of realization of the respective postulates fi eld study was
performed, meant to identify the state of tourism development and tourist traffi c; interviews
were carried out with the owners of the existing accommodation facilities, the questionnaires
were also sent to the communal self-governmental offi ces, so as to acquire information on
the subject of their activity in the domain of development of tourism.
ACTIVITIES OF THE LOCAL SELF-GOVERNMENTAL BODIES MEANT FOR THE DEVELOPMENT OF TOURISM
The mailed questionnaires, addressed at the communal offi ces, contained questions concern-
ing the activity of the local administration and authorities in the domain of support for tour-
ism. The results of the questionnaires indicate that involvement of the self-governmental bod-
ies in this domain is insuffi cient. It turns out that only one of the municipalities organized
(or co-organized) training in agro-tourism. Collaboration with various bodies, meant to sup-
port the development of tourism, is poor (Table 1). It is particularly surprising that collabora-
tion with the local associations of the hospitality operators, functioning in the communes stud-
ied, was not declared. This is a confi rmation of the information, obtained during the interviews
with the owners of the agro-tourist farms from the communes of Dubienka and Horodło, who
indicated insuffi cient support from the side of the self-governmental bodies.
http://rcin.org.pl

174 Maria Bednarek
There were also questions concerning the investment projects, associated with the exten-
sion of the tourist and para-tourist infrastructure (tourist routes and paths, sports, accommo-
dation and cultural facilities), development of villages and their historical heritage (renovation
of historical monuments, formation of the village centres), as well as additions to the technical
infrastructure, that have been realized in the years 2004–2006. In all the three communes pri-
marily the necessary technical infrastructure was being developed – water supply, sewage and
roads. Projects linked with tourism have been, on the other hand, realized only sporadically,
with the commune of Hrubieszów standing out in a positive manner through establishment
of a tourist route, a bicycle renting facility and a museum. The commune of Hrubieszów is
also an exception in terms of the diversity of the promotion materials published, undertakings
aiming at activation of the local community, as well as in terms of the number and variety of
the concrete plans and ideas connected with the development of tourism, which were declared
in the self-governmental municipality offi ce.
It is hardly surprising that in the domain of activity of the communal self-governmental
bodies, aimed at the development of tourism, no plans or actions are envisaged concerning
the use of the border-adjacent location. There is very little that can be done at the municipality
level in the face of the tightening of the Polish-Ukrainian border and the shortage of border
crossings. Yet, even if the regulations associated with the functioning of the state boundary
and the European Union did not constitute a barrier, the river Bug would still form a natural
barrier. The potential construction of bridges would be a diffi cult, serious and costly task, not
only for the economic and political reasons, but also for the environmental ones (such projects
could have a signifi cant impact on the NATURA 2000 areas). Plans of bridge construction
would require, fi rst of all, joint initiatives and actions of the state institutions on both sides of
the border. Then, in turn, the existing shortage of bridges makes undertaking of coordinated
investment projects diffi cult (Kałuski 1992).
LEVEL OF DEVELOPMENT OF TOURISM
The state of development of tourist infrastructure on the study area is relatively poor.
In the three communes considered only 23 accommodation facilities function (21 agro-tourist
farms, one guest-room facility, and one youth hostel). In 2007 interviews were carried out
in 15 accommodation facilities, functioning on the study area. Information obtained from
Self-government
of the commune:
Collaboration for the development of tourism with:
forest
service /
management
of protected
area
supra-local
tourist
organisation
local
hospitality
operators
other
communes
abroad
Dubienka YES NO NO NO NO
Horodło NO NO NO YES NO
Hrubieszów NO YES NO YES YES
Table 1. Self-governments’ collaboration with various bodies for the development of tourism
http://rcin.org.pl
175Rural areas along the eastern border of the European Union ...
the hospitality operators allowed for the assessment of the state and the development perspec-
tives of tourism on the study area.
Almost all the facilities considered were agro-tourist farms. Majority of the service-pro-
viders offer their guests various kinds of service and attractions: full board, based on prod-
ucts from own farm, including specialties of home cuisine, playground for children, bicycles
and other sports equipment, possibility of taking advantage of the garden. The hosts usually
provide a separate kitchen, or a kitchen annex, for the guests, and the TV sets in the rooms.
Tourists may read on place information materials, booklets on the area, may put up tents and
make bonfi res on the property of the hosts. In every second farm the hosts declared that old
household appliances are collected. This is, indeed, a positive phenomenon, the operators
are aware of the importance of the cultural and economic heritage of the land. One third of
the operators declared owning horses or ponies, and organized horse riding and sleigh caval-
cades. Some of the agro-tourist farms offered yet other, quite specifi c attractions, like organiza-
tion of the traditional Christmas Eve dinners for foreign guests, New Year’s Eve festivities,
mushroom and berry picking outings, fi shing events, guiding service, or bonfi res with the hunters.
On the other hand, in only two cases of the agro-tourist facilities the guests were offered rooms
with bathrooms.
Despite the ample offer, hospitality and engagement of the hosts, as well as the attractive
area, in recreational and sightseeing terms, the use of the accommodation facilities considered
was very low. There were, on the average, 18 nights spent per year per bed, which is equivalent
to 5% of use. If we take, in addition, into account the fact that there were very few beds in
each of the facilities analyzed (in only four of them there were more than ten beds), we should
conclude that tourist service does not constitute an essential source of income for the opera-
tors considered. Moreover, in roughly half of the facilities considered no upward tendency
was noted during the last three years in terms of the number of nights spent at the facilities by
the guests. In the remaining cases the increase of this number was mainly not associated with
the visits of tourists, but of the guest workers.
The study conducted allowed for the identifi cation of an interesting phenomenon, con-
cerning accommodation service within the study area. It turned out, namely, that in nine out
of fi fteen facilities considered, the services were provided to workers and high school students.
Thus, the agro-tourist farms functioned largely as temporary lodging for persons employed on
various projects within the area and as lodgings for pupils and students (the latter concerns,
in particular, Dubienka, where a high school is located, educating border guards staff). Some
operators declared outright that typical tourists, who come for leisure, are a decisive minority
among their customers. Besides, the customers crossing the state border, even in the case of
facilities situated in the vicinity of the border crossings, played a marginal role. In the opinion
of the operators real income comes only from renting of the rooms to the employees and stu-
dents. The information, obtained from the operators implies that tourist service brings them
on the average 21% of the total income in the household.
Development of tourism is not facilitated by the legal regulations, linked with the exis-
tence of the state boundary on the river Bug. Thus, according to the valid legal regulations
(decree of the Minister of Home Affairs and Administration, Dziennik Ustaw, 94, 2006)
the intention of undertaking on the border waters of such activities as tourism, sports, fi shing
and hunting, should be declared to the Border Guards at least 24 hours before undertaking
http://rcin.org.pl
176 Maria Bednarek
such activities. This concerns, therefore, for instance, canoeing or even bathing in the river. This
principle may turn out to be an important limitation on the development of the recreational
function of the river Bug valley. Holidaymakers often spontaneously choose the way of spend-
ing their leisure time. The legal requirements like the one mentioned, linked with the condi-
tions on the recreational and tourist use of the river may discourage potential visitors.
An additional serious barrier to the development of tourism is constituted by the diffi culties
associated with crossing of the state border. As mentioned, the sole border crossing for persons,
functioning on the study area, is a road traffi c crossing. Hence, tourists not using cars, like cy-
clists or walkers, cannot use this crossing. Such a situation is characteristic for the entire east-
ern border. According to the agreements on the border traffi c between Poland and her eas-
tern neighbours, no foot walking traffi c is allowed on the road border crossings. In this connection
there exist, as of now, no perspectives for opening tourist border crossings on the areas in ques-
tion. Tourists in cars, however, encounter problems as well – the waiting time for the border
guard and customs clearance at the sole border crossing in the communes analyzed, in Zosin, is
always very long, as it can be concluded from own observation and the opinions of the local popula-
tion. This problem is, again, characteristic for the entire area adjacent to the border with Ukraine.
Since the very inception of the Euroregion Bug, encompassing also the region here con-
sidered, too small number of border crossings and their inadequate throughput capacity have
been indicated, as making out of the border a hard-to-cross barrier for the tourist traffi c
(Janicki 1997). In order to enable the development of the cross-border tourism a postulate has
been since a long time ago forwarded of the necessity of opening the tourist border crossings,
in the form, for instance, of foot-bridges over the river and the adaptation of the existing cross-
ings to the pedestrian traffi c (Rąkowski 1997). Yet, until today no tourist border crossing has
been opened along the border with Ukraine.
One can hardly speak of the real economic signifi cance of tourism on the area considered.
There are few agro-tourist farms, incoming tourist traffi c is marginal. It also turns out that
the owners of the existing facilities treat this kind of activity more like a hobby than a true-to-
-life business activity. Only one third of the respondents indicated that fi nancial reasons had
been one of the factors of starting the agro-tourist activity. The actual reasons indicated inclu-
ded, in particular, curiosity, passion for tourism, wish of getting in touch with people, persua-
sion from the friends. In terms of the advantages, which the operators declared as accruing
from the conduct of tourist service, fi rst of all the non-material ones were quoted, as well:
contacting interesting people, entertainment, way of spending time in a nice manner, etc. Only
1/5 of the respondents declare that tourist services shall continue to be provided by their chil-
dren. These responses imply the pessimistic forecasts as to the development of agro-tourism
on the study area. Such forecasts are confi rmed by the following information, acquired from
the respondents: in the initial phase of development of agro-tourism there were relatively
many persons willing to conduct such an activity and their number gradually decreased, when
it turned out that the revenues from this activity are small; and: local inhabitants do not have
suffi cient willingness nor ideas for conducting tourist services. Besides, young, active people
leave the area and move to towns in search for jobs (such comments are a confi rmation of
the statistical data, showing population decrease in the study area). For many of those, who
remain, an additional source of upkeep is constituted by petty trade, especially in alcohol and
cigarettes, brought in from Ukraine.
http://rcin.org.pl

177Rural areas along the eastern border of the European Union ...
The respondents pointed out an important role of the farmer support service centres,
which were active several years ago in supporting agro-tourism. Employees of the support
service centres were contacting farmers and encouraged them to take up agro-tourist activi-
ties. This action was supposed to be at the origin of the development of local agro-tourism.
It turned out, though, that when the intensity of this action decreased, further development
of agro-tourism has not followed. Hence, it can be concluded that there has been insuffi cient
internal social capital in the communes analyzed for the realization of this direction of busi-
ness activity, despite the solid bases and the stimuli, provided by the farmer support centres.
The respondents indicated, as the main barriers to the development of tourism, lack of pro-
motion and shortage of tourist attractions (half of the respondents pointed out these reasons),
as well as low interest from the side of the local community and the local self-governmental
bodies in the development of tourism (fi ve indications each). Thus, it can be concluded that
the respondents do not perceive the barrier, which is constituted by the conditions associated
with the functioning of the state boundary on the river Bug.
SUMMARY
Information acquired allows for drawing of little optimistic conclusions concerning the pers-
pectives of the socio-economic development of the study area. It can be expected that the pro-
cesses of its depopulation and ageing shall continue, since there are no prerequisites indicating
the possibility of improvement of the socio-economic attractiveness of these areas. Currently,
however, the municipalities considered struggle to overcome the problems of the long-term
negligence in the domain of basic technical infrastructure.
The border-adjacent location is in the case of the area studied a barrier to development in
three aspects:
- it is a peripheral location on the scale of the country, far from the urban centres, which con-
tributes to deepening of the weak economic position,
- state boundary, being at the same time the boundary of the European Union, constitutes
a barrier to cooperation and business, social and cultural links, especially in the context of
the complex and lengthy procedures of crossing the border; an important role is also played
by the shortage of border crossings and the visa regulations, which have to be followed by
the citizens of Ukraine; tightening of the border in connection with the accession of Poland
to the Schengen zone does not provide perspectives for economic activation of the areas
of Polish-Ukrainian borderland; on the other hand, though, one should not overestimate
the signifi cance of the political events for the intensity of the cross-border traffi c, they exert
a stronger infl uence on the structure of this traffi c – the increase of the share of Poles, cross-
ing the border (Komornicki 2004),
- a natural boundary is, additionally, constituted by the river Bug, which remains a physical
barrier irrespective of the political conditions.
Low level of economic development is conducive to the strengthening of the natural values,
and so – also of the tourist qualities of the study area. Yet, one should not expect on this area
a more pronounced development of tourism, in the sense of appearance of a generally acces-
sible tourist infrastructure, despite the hopes of the local self-governmental bodies placed in
http://rcin.org.pl
178 Maria Bednarek
the tourist direction of development. A small number of accommodation facilities shall most
probably continue to function, but tourism shall remain a phenomenon of a marginal signifi -
cance on the scale of the analyzed communes, especially as regards the economic role of tourism.
It is, on the other hand, possible that in view of the low prices of land on this area, the second
homes, constructed by the inhabitants of towns, shall appear here. Such processes start to take
place on other agricultural areas of the province of Lublin.
As mentioned before, the lengthy procedures of border crossing, shortage of border cross-
ings and lack of the ones meant for tourists, constitute the barriers to the development of
cross-border tourism. It can be assumed that once these limiting factors are eliminated, excur-
sions to the Ukrainian side could be an interesting addition to the offer for tourists, staying on
the area of the communes considered.
An important barrier to the development of tourism is constituted by the legal norms,
linked with the use of the border river Bug, including the use for sports and tourism. The val-
ley of Bug is, on the one hand, the fundamental tourist asset of this area, a valuable natural
corridor of European signifi cance, and on the other hand – its use for recreational purposes is
limited in connection with the functioning of the regulations concerning state boundaries.
REFERENCES
Bank Danych Regionalnych (2002, 2006).
Falkowski K. (2006) Czynniki i ograniczenia konkurencyjnego rozwoju terenów przygranicznych.
Ujęcie teoretyczne, in: Teichmann E.(ed.) Wschodnie pogranicze rozszerzonej Unii Europejskiej.
Czynniki konkurencyjności, Szkoła Główna Handlowa, Warszawa, 15–34.
Fedan R., Makieła Z. (2006) Infrastruktura techniczno-ekonomiczna a elementy środowiska
przyrodniczego – na przykładzie funkcjonowania granicy z Ukrainą, in: Kitowski J. (ed.),
Prace Komisji Geografi i Komunikacji PTG, 12, PTG, Uniwersytet Rzeszowski, Warszawa-
-Rzeszów, 87–94.
Fedoniuk S., Kawałko B., Miszczuk A. (2005) Infrastruktura graniczna i ruch graniczny.
Wnioski i rekomendacje, in: Kawałko B., Miszczuk A. (eds), Pogranicze polsko-ukraińskie.
Środowisko. Społeczeństwo. Gospodarka, Wyższa Szkoła Zarządzania i Administracji
w Zamościu, Zamość, 193–200.
Frenkel I. (2000) Wiejskie obszary problemowe pod kątem widzenia sytuacji demografi cznej in:
Rosner A. (ed.) Lokalne bariery rozwoju obszarów wiejskich, FAPA, Warszawa.
Growing regions (2007) 4th Report on Economic and Social Cohesion, European Commission.
Janicki R. (1997) Walory turystyczne pogranicza polsko-ukraińskiego, in: Rąkowski G. (ed.),
Turystyka jako czynnik aktywizacji pogranicza polsko-ukraińskiego, Norbertinum, Lublin.
Kałuski S. (1992) Rzeki graniczne a kształtowanie się więzi regionalnych w Europie, Wydawnict-
wo UW, Warszawa.
Komornicki T. (2007) External border of the European Union – permeability, co-operation, per-
spectives, in: Kovacs A. D. (ed.), Regionality and/or Locality, Discussion Papers, Center for
Regional Studies of Hungarian Academy of Sciences, Pecs.
Komornicki T. (2004) Badanie interakcji transgranicznych między Polską i Ukrainą w latach
1992–2003 na podstawie danych statystycznych, opis dla Exlinea Project.
http://rcin.org.pl
179Rural areas along the eastern border of the European Union ...
Mierosławska A. (2005) Problemy obszarów przygranicznych Polski, in: Sikorski J. (ed.), Regiony
przygraniczne w warunkach zewnętrznych granic Unii Europejskiej, Wydawnictwo Uniwer-
sytetu w Białymstoku, 154–164.
Plan rozwoju lokalnego gminy Hrubieszów (2004).
Rąkowski G. et al. (2002) Parki krajobrazowe w Polsce, Instytut Ochrony Środowiska,
Warszawa.
Rąkowski G. (1997) Koncepcja rozwoju turystyki w Euroregionie Bug, in: Rąkowski G. (ed.),
Turystyka jako czynnik aktywizacji pogranicza polsko-ukraińskiego, Norbertinum, Lublin.
Rykiel Z. (1991) Rozwój regionów stykowych w teorii i w badaniach empirycznych, Prace
Habilitacyjne IGiPZ PAN, Ossolineum, Wrocław.
Rykiel Z. (1985) Zagadnienia regionalnych systemów osadniczych, Studia KPZK PAN, 85.
Strategia rozwoju gminy Dubienka (2000).
Strategia rozwoju gminy Horodło (1999).
Strategia rozwoju gminy Hrubieszów (1998).
http://rcin.org.pl

http://rcin.org.pl

THE REBIRTH OF SOVEREIGN STATES AND FIRST CHALLENGE
TO NATIONAL INTERESTS OF REPUBLICS OF SOVIET UNION (1989)
KEIJI SATO
Research Fellow, Japan Society for the Promotion of Science
068-006, Hokkaido, Iwamizawa, 6zyou-higashi-4-28-5, Japan
e-mail: [email protected]
Abstract. Under the Soviet imperial regime 15 Soviet Socialist Republics, were
“blessed” with formal democracy, sovereignty and self-determination. However,
after introduced glasnost and perestroika policies by Mikhail Gorbachev, reforma-
tive atmosphere gradually extended to freedom, democratic or ethnic movements
all over the Soviet Union. The larger scale of democratic and ethnic movements
developed, the more radical confl ict happened among ethnic groups and Union
Republics. Dearing with case of researching commission of 1939 Soviet-German
Nonaggression Pact, this paper verifi es what kind of national interests the Union
Republics tried to keep, and what a cause of confl ict among them was.
Key words: Soviet-German Nonaggression Pact, Secret Protocol, 23 August 1989,
belonging of Vilnius, transdniester, sovereignty
INTRODUCTION
The researching aim of this paper is to verify how to generate collisions of national interests
among Union Republics on the process of that it had put Secret Protocol within 1939 German-
-Soviet Nonaggression Pact1 on view to general public, at the end of Soviet era.
Secret Protocol, which German and USSR clandestinely concluded in 1939 decisively
changed balance of power in the East European territory. From 1939 till 1940 as a fi nal phase of
succeeding events after concluded Secret Protocol, independent Baltic states were annexed as
a part of USSR, the east land of Poland was ceded to Belarus, Ukraine and Lithuania and the east
land of Finland (Karelia) to Russia. Romania was divided into two parts; one of them was
annexed into USSR as “the Soviet State of Ethnic Moldovan” (Figure 1). This one-sided Soviet
policy deprived these territories of independent (sovereignty) and created Lithuanian SSR,
Estonian SSR, Latvian SSR Moldovan SSR as a result of “free-will and choice” of inhabitants.
1 The Pact is widely known by a number of different titles as Molotov-Ribbentrop Pact, Nazi-Soviet Pact and Hitler-Stalin Pact.
EUROPA XXI2007, 16: 181-190
http://rcin.org.pl

182 Keiji Sato
In the middle of 1987, after introduced Gorbachev’s perestroika and glasnost, Baltic intellec-
tuals began to organize private researching groups for reconsidering and modifying Baltic
history during the Soviet period. In 23 August 1988, it held mass meeting in Vilnius for recon-
sidering Secret Protocol, which decided Lithuanian doom. Under the pressure from Baltic
nations on 8 June 1989 it was organized the Commission of Congress of People’s Deputies
USSR for politically and legally valuing of the 1939 Soviet-German Nonaggression Pact
(Komissiya Syezda Narodnykh Dyeputatov SSSR po Politichyeskoy i Pravovoy Otsyenkye
Sovyetsko-Gyermanskogo Dogovora o Nyenapadyenii ot 1939)2. To recognize the existence of
Secret Protocol, which Soviet authority offi cially argued non-existence until December 1989
meant that the East European independent countries were “illegally” annexed to USSR, and
might bring a chance to correct current political status including in border. The delegations
of 1939 Pact researching commission from Baltic states, were representatives of the Popular
Front’s forces and tried to make Moscow authority recognize the existence of Secret Protocol.
This paper would mainly verify the following discussing points; to recognize existence of
Secret Protocol did not bring about simple alternative choice whether Union Republics would
have a right to secede from Soviet Union. Members had various opinion how it should be
denied Secret Protocol by consulting own “national interests”. For instance, Estonian dele-
gations tried to open Secret Protocol to public from outside pressure especially gathering
attention from German and Finland. Lithuanian tried to deny Secret Protocol at the USSR
2 In this paper this commission’s name is abbreviated “1939 Pact researching commission”.
Figure 1. Actual territorial changes, 1939-1940
http://rcin.org.pl

183The Rebirth of Sovereign States and fi rst challenge...
domestic level without asking to foreign countries, which Poland had a possibility to involve in.
Ukrainian delegation was basically passive to annul Secret Protocol which was a main cause
of Ukrainian territorial expansion. This paper would take a case of 1939 Pact researching
commission and verifi es what kind of national interests the Union Republics tried to prevent.
THE PROCESS OF DISCUSSION – WHAT WAS A MAIN CAUSE OF CONFLICTS AMONG REPUBLICS?
Baltic states, already in 23 August 1988, had an experience of large scale demonstrations
toward 49th anniversary of Soviet-German Nonaggression Pact, in 1989 they could not impede
larger mass movement for recognizing existence of Secret Protocol and invalid it. On the wave
of Baltic movement, Landsbergis requested to form 1939 Pact researching commission in
the First Congress of People’s Deputies in May 1989. Accepted request, it organized commis-
sion, whose the chairman was A. Yakovlev and whose member consisted of 26 people’s deputies
USSR (Table 1). There were 5 meetings in Kremlin; the fi rst meeting of 1939 Pact researching
commission held in 8 June 1989, the second in 5 July, the third in 12 July, the fourth in 19 July
and fi fth in 4 November. Let us check process of discussion.
The notable point in the fi rst meeting is that Baltic delegations, Savisaar and Landsbergis,
requested to conclude a fi nal result of commission till the 23rd August 1989 when it would be
50th anniversary of the Soviet-German Nonaggression Pact3. Landsbergis revealed that 250
thousand Lithuanians attended to the last demonstration at the 49th anniversary in 1988 and
alarmed members that it would bring bad affect on the Baltic society without fi nal conclu-
sion toward Secret Protocol. Meanwhile Yakovlev faltered their request, M. Bulifson from
Latvian Art Academy continued to alarm that some others, on behalf of them, would organize
researching groups and publish the conclusion about Soviet-German Nonaggression Pact and
Secret Protocol if their 1939 Pact researching commission would not4.
The second meeting was held one month later in 5 July 1989. In this meeting different
thinking way among members became clearer. At the beginning of session, G. Arbatov insisted
that he would boycott latter session if legal and political evaluation to German-Soviet Nonag-
gression Pact would connect with seceding problem of Baltic countries and Bessarabia from
Soviet Union5. Although Savisaar who became vice-president in reality6 agreed not to discuss
seceding problem, commission members could not impede to touch this taboo. Motieka des-
cribed that Lithuania as a historical truth lost independence by Secret Protocol7 and then it
occurred heated dispute again.
The third meeting touched off from an episode that the movements against Secret Pro-
tocol were intensifi ed in the Baltic countries. Z. Šiličitė, Lithuanian advocate, explained her
surroundings that Lithuanian delegations and authority faced hard condition that the meeting-
participants heckled “the commission did not do anything”8. Furthermore I. Kezbers, Latvian
3 GARF (Gosudarstvyennyy Arkhiv Rossiyskoy Fyedyeratsii), f. 9654, op. 2, d. 123, l. 37ob.4 GARF, f.. 9654, оp. 2, d. 123, l. 38–39оb.5 GARF, f. 9654, оp. 2, d. 124, l. 199; 201оb.6 Offi cial vice-presidents were Yu. Afanashev and V. Falin.7 GARF, f. 9654, оp. 2, d. 124, l. 201оb.8 GARF, f. 9654, оp. 2, d. 126, l. 17оb.
http://rcin.org.pl
184 Keiji Sato
communist leader, told that general public well noticed that the commission did not yet bring
any result during 2 month and alarmed that society would be critical condition without making
fi nal result till 5 August 19899. Another problem in the third meeting was that it came out sece-
ding question again as well as in the second meeting. Motieka insisted that Lithuania might
never become a member of Soviet Union without Secret Protocol. Yakovlev strongly criticized
him to connect Secret Protocol with current political status of Union Republics. Toward his
criticizing, I. Griazin, Estonian scientist, described that the present political status of Estonian
SSR was legally groundless although current Estonia was located in USSR.
In the forth meeting discussion stagnated because Kraveth, Ukrainian diplomat, was
against denial of Secret Protocol while Baltic delegations tried to conclude the concrete date
when it would be invalid. Kraveth did not accept all demands and suggestions from Baltic dele-
gations and there was originally a wide gulf among Baltic and him. Finally Baltic delegations
could not reach at fi nal common conclusion till 23 August 1989 and must conclude opinion as 3/4 of members because Kraveth denied idea, which invalided the Soviet-German Nonaggres-
sion Pact.
It should be noticed important event after the fourth meeting of 1939 Pact researching
commission till 23 August 1989. The commission could not show common view but in 18
August Yakovlev expressed his personal opinion in answering interview as Pravda. He des-
ribed that the current political status of Lithuanian SSR, Latvian SSR and Estonian SSR did
not have any relation with Secret Protocol and Soviet-German Nonaggression Pact10. Natu-
rally enough, it occurred movements against his statements in Baltic states. In 22 August
Lithuanian Supreme Soviet concluded invalid of Secret Protocol and annexation into Soviet
Union. The fi fth meeting after Baltic Ways in 23 August became simple adjustment meeting
for completing result.
It should be picked up several important points through whole meetings. The one thing
is that it had long interval between the fi rst meeting and the second, the fourth and the fi fth.
It could be found drastic changing behaviour, opinion and subject of members because dur-
ing these intervals it occurred thousands meetings and demonstrations in the Baltic countries.
In the second meeting, the Baltic delegations started to be hurry to make a fi nal result, which
the Baltic mass tremendously expected, while in the fi fth meeting members simple adjusted
conclusion, because the Baltic mass did not already have a hope that commission would bring
expected result for Baltic inhabitants.
The second point is that 1939 Pact researching commission did not take up Polish subject from
initial stage of meetings. Poland was the most damaged by Soviet-German Nonaggression Pact
and Secret Protocol. The delegations from Estonia who understood limitation to resolve sovere-
ignty issue as a USSR domestic level suggested gathering international attention. In the second
meeting Aleksandrov, the secretary of Yakovlev, mentioned that it should be contempla-
ted link with past Polish territory if discussion would touch relation with foreign countries.
One Lithuanian delegation reacted his comment at once and expressed wish not to develop
their discussion to territorial issue although he mentioned not to be afraid it. Finally, Savisaar
agreed that commission would never discuss subject as territorial issue. In reality, territorial
9 ibid., l. 18оb.10 Haruki Wada, Baltic States pricked imperial regime, in: Haruki Wada., Nobuo Shimotomai and Yuri Afana-
shev (eds), NHK Special: Tragedy of Baltic States and collapse of one-party dictatorship, NHK Publisher, Tokyo, 1990) [Japanese version], p. 95.
http://rcin.org.pl

185The Rebirth of Sovereign States and fi rst challenge...
issue did not bring any good affect on each actor because most of power actors Lithuania,
Ukraine, Belarus and Soviet Union received territory from Poland by Secret Protocol.
Table 1. Members of 1939 Pact researching commission (1989)
Chairman
A. Yakovlev Secretary, Central Committee USSR
Vice-chairman
Iu. Afanashev Rector, Moscow State Institute of Historical Archives
V. Falin Head, International section of Central Committee USSR
Member
Ch. Aitomatov Writer (Kyrgyz), President, Writer’s Union Kyrgyz SSR
G. Arbatov Director, Institute of USA and Canada AS USSR
L. Artiunian Head of department, Elevan State University
V. Buikov Writer (Belarus), Secretary of Writer’s Union USSR
M. Bulifson High-ranked teacher, Latvian Art Academy
I. Griazin Director, Social and Philosophical Institute Estonian SSR
I. Druthe Writer (Moldova)
G. Eremei President, Labor Union Moldovan SSR
A. Kazannik Assistant professor, Omsk State University
I, Kezbers Secretary, Central Committee Latvian SSR
V. Korotich Redactor, Aganiok
V. Kraveth Foreign Minister, Ukrainian SSR
S. Lavrov Head of department, Leningrad State University
V. Landsbergis Professor, State Musicological Institute Lithuanian SSR
M. Lauristin Head of department, Tartu State University
E. Lippmaa Director, Institute of biology chemistry and physic AS Estonian SSR
J. Martinkiavicus Writer (Lithuania)
K. Motieka Advocate (Lithuania)
N. Neiland Vice Foreign Minister, Latvian SSR
A. Ridiger Archbishop, Leningrad and Novgorod
E. Savisaar Vice Director, Constructing section Ministry of Light Industry
Estonian SSR
V. Shinkaruk Director, Philosophical Institute AS Ukrainian SSR
Z. Shilichite Advocate (Lithuania)
http://rcin.org.pl
186 Keiji Sato
STANDPOINTS OF EACH UNION REPUBLICS TOWARD SECRET PROTOCOL – DOES SOVEREIGNTY CONNECT WITH TERRITORY?
Baltic countries seemed to successfully form united front toward issue of sovereignty and
Secret Protocol. In 13 and 14 May 1989 it organized Baltic council in Tallinn. Savisaar,
the representative of Estonian Popular Front, Ivans from Latvian Popular Front and Lands-
bergis from Sąjūdis attended and signed the statement that it did not have any legal ground
of annexation of Baltic countries into USSR as a result of conducting Secret Protocol11 .
In 18 May, just before First Congress of People’s Deputies USSR, Estonian and Lithua-
nian Supreme Soviet demanded this First Congress to recognize illegal and invalid of Secret
Protocol12. However, each Baltic states had different standpoint on the way how to annul
Secret Protocol. Main cause of differences was territorial issue. Among Union republics, espe-
cially, Lithuania sensitively reacted to territorial issue. This section would verify standpoints
towards territorial issue and sovereignty of each actors; Lithuania, Moldova, Ukraine, Estonia
and Russia. This paper would not touch Latvia and Belarus because Latvian and Belarusian
delegations did not show clear standpoint in the session13.
LITHUANIAN STANDPOINT – VILNIUS SYNDROMELithuanian delegations were most active and at the same time most careful to go forward
on discussion. Specialists represented that Lithuania “recovered” Vilnius region on behalf of
accepting the Soviet control as a result of Secret Protocol14 and some of them even mentioned
that annul of Secret Protocol would “logically” mean territorial restitution to Poland15.
Lithuania, it can be proved, had legal-ground of belonging of Vilnius. Lithuanian gover-
nment tied 2 main treaties with Soviet authority; the one is the Soviet Russian-Lithuanian
Peace Treaty in 12 July 1920 and the other is Soviet-Lithuanian Nonaggression Treaty in 28
September 1926. Both recognized sovereignty as independent countries each other and mutual
non-intervention into territory16. In 1939 Pact researching commission Motieka insisted recog-
nition of Lithuanian sovereignty by 1920 Peace Treaty17. The reason why Lithuanian delega-
tions and intellectuals emphasized 1920 Pearce Treaty is not only what USSR recognized
the Lithuanian independence, but also what he accepted the Lithuanian expended territory
including in Vilnius and Grodno regions18. However this treaty gave negative impression
to France and U.K., which were friendly nations to Poland because Lithuania and Soviet
Union conducted one-sided division of Polish territory. Therefore it was not profi table to
11 ibid. pp. 92–94.12 ibid., p. 94.13 If we would research issue of Soviet-German Nonaggression Pact by wide range, it should be noticed stand-
points of German, Finland, Romanian and Poland. However these actors did not have chance to interfere into 1939 Pact researching commission because of closed meeting. Therefore, this paper would focus on standpoints of only Union Republics.
14 Alfred Erich Senn (1995) Gorbachev’s Failure in Lithuania, St. Martin’s Press, New York, p. 32; Anatol Lieven (1993) The Baltic Revolution: Estonia, Latvia, Lithuania and the Path to Independence, Yale University Press, New Ha-ven and London, p. 79; Vytautas Žalys (1998) The Return of Lithuania to the European Stage, in: Alfonsas Eidintas, Vy-tautas Žalys (eds), Lithuania in European Politics: The Years of the First Republic 1918-1940, Vaga, Vilnius, pp. 69–70.
15 ibid., p. 167.16 Alfonsas Eydintas, Rudis Gyadiminas (1991) Novyy vzglyad na istoriyu Litvy, Kaunas; Gyeorgiy Yefryemov
(1990) My lyudi drug drugu – Litva: Budni Svobody 1988–1989, Moskva.17 GARF, f. 9654, оp. 2, d. 126, l. 25оb.18 Žalys Vytautas, The Return of Lithuania, pp. 69–70.
http://rcin.org.pl

187The Rebirth of Sovereign States and fi rst challenge...
emphasize 1920 Peace Treaty for Lithuania which needed international support on own
democratic movement.
Under such political and historical condition, Lithuania faced diffi culty to achieve sover-
eignty (independence) without touching territorial issue. At the Soviet domestic level, 1920
Peace Treaty and 1926 Non-aggression Pact were still legal ground on the point of recover-
ing sovereignty. The commissions of 1939 Soviet-German Pact, it could be said, that repub-
lic blanch of 1939 Pact researching commissions USSR, were formed in Estonia, Lithuania,
Latvia and Moldova and in 18 August 1989 Lithuanian commission concluded as follows:
1. Secret Protocol violated international law and was invalid since when it signed by Molotov
and Ribbentrop,
2. Soviet-German Nonaggression Pact with Secret Protocol deprived Lithuanian sovereignty
and independence and forced him to annex into Soviet Union,
3. These deeds were against 1920 Peace Treaty and 1926 Nonaggression Pact19.
Lithuania contained another unstable factor. Polish-Lithuanians which live in Vilnius and
Šalčininkai regions20 reacted decision of Lithuanian authority that annulled Soviet-German
Nonaggression Pact. Some of autonomous activists among Polish-Lithuanians insisted that
territorial incorporation Vilnius and Šalčininkai regions into Lithuania also should be invalid
considering Secret Protocol would be invalid. Their autonomous movement in Šalčininkai and
Vilnius region made Lithuanian government bothering in the process of independence21.
MOLDOVAN STANDPOINT – A PART OF ROMANIA OR INDEPENDENT STATE?Moldovan Popular Front appealed revival of ethnic culture and history into Moldovan SSR
Supreme Soviet, but these appeals were similar products to previous one handed by Baltic
Popular Frontists22. The considerable point is that the Moldovan Popular Front strongly
insisted to recover lost territory; Northern Bukovina, Akkerman, Kiriya, where were “illegally”
ceded to Ukraine SSR by Secret Protocol. According to it, these regions belong to Moldova
as a peculiar territory from historical and ethnic viewpoints23. Moldovan case contained
the more complicated condition that it occurred territorial problem not with foreign countries,
but with same member of Union Republics.
Lari, N. Davija and M. Cimpoi who were Moldovan deputies of Congress of People’s Depu-
ties USSR and members of Moldovan Popular Front were main debaters about Secret Proto-
col, but they were not chosen as members of 1939 Pact researching commission. The Moldovan
delegations were I. Druthe and G. Eremei. Eremei’s autobiography told that he generally did
not give almost any comment in the session and Druthe did not act to research24. Stenograph
also proves that Eremei could not catch up discussion led by Baltic delegations. Through sess-
ion it can be found a few comments that everything is new for him and he could not judge
because of lack of information25. Eremei told concrete reason of “passiveness” in the commis-
19 LVNA (Lietuvos Valstybės Naujasis archyvas), f. 32, op. 1, d. 81.20 Either region is located in the south-east Lithuania.21 Keiji Sato (2007) The Analysis of the “Matrioshka” Structure of Ethnic Problems during the Decline of
the Soviet Era: The Case Study of the Problem of Polish-Lithuanians, Slavic Studies, 54, pp. 101–130.22 LVNA, f. 32, op. 1, d. 101.23 Michael Bruchis (1996) The Republic of Moldavia: From the Collapse of the Soviet Empire to the Restoration of
the Russian Empire, Columbia University Press, New York, p. 116.24 Yeryemyey Grigorye (2005) Nyewidimoye litso wlasti, Chişinău, p. 371.25 GARF, f. 9654, оp. 2, d. 126, l. 114оb.
http://rcin.org.pl

188 Keiji Sato
sion. Basically he criticized Molotov’s and Stalin’s deeds but he thought that territorial issues
derived form under War period did not have direct connection with Secret Protocol. Eremei
did not get involve into the discussion about national interest unlike Baltic delegations.
He mentioned that he was not interested in discussion of national interest, but of historical
truth of Bessarabia occurred in 1939 and 194026.
Not only at the Eremei’s personal level, but at the governmental level Moldova had diffi -
cult to avoid Secret Protocol. Compared with independent Baltic states before Secret Proto-
col, Moldova was one district of Romanian Kingdom. Considered annul of Secret Protocol,
Moldova would logically join into Romania as one district. However it is quite doubtful that
Moldovan Nomenclature who gained profi ts under the Soviet rule could abandon vested prop-
erties and accept positions as simple regional politician and administrator under Romania.
Furthermore annul of Secret Protocol might have a possibility to annul of Transdniester
region as a Moldovan territory where incorporated into Moldovan SSR from Ukraine in 1940.
Transdniester region at that time had advanced industry and large scale electric power plants,
and it was indispensable to keep it for national interests. Invalid of Secret Protocol might
occur the territorial issue with Ukraine, the loss of Transdniester and the loss of vested profi ts
as Moldovan Nation.
UKRAINIAN STANDPOINT – SHOULD UNITED TERRITORY BE KEPT FOR NATIONAL INTEREST?Ukraine virtually got most profi t by Secret Protocol. In 1939 Pact researching commission
V. Kraveth praised Soviet-German Nonaggression Pact as a triumph of Soviet diplomatic for
impeding War for one and half year27 and furthermore, as a result of Pact, Ukraine recovered
“peculiar” Ukrainian territory and achieved unifi cation under single Ukrainian government28.
Yakovlev understood Kraveth’s position29 and contained the Baltic delegations that Ukrainian
nations would oppose to lose the territorial unifi cation. These opinions did not fi t with Baltic’s
absolutely. Even Afanashev directly criticized his uncompromised behaviour30. The impor-
tant point is that it was less diffi cult to resist for him because Moldovan could not cooperate
with Baltic delegations. It is not easy to defi ne whether Kraveth was Soviet representative or
Ukrainian if look at his typical Soviet style rethoric in 1939 Pact researching commission31. It is
also possible to defi ne that Kraveth took either position because to keep Ukrainian territorial
unifi cation and to deny annul of Soviet-German Nonaggression Pact with Secret Protocol were
not against old-style Soviet interest.
ESTONIAN STANDPOINT – DID MINORITY ISSUE AFFECT ON ACTIVITY OF ESTONIAN?Estonian delegations, Savisaar E. Lippmaa, Lauristin and Griazin, discussed concrete points
from legal viewpoints what date it should be non-effective of Soviet-German Nonaggression
Pact and annul of Secret Protocol, which was not ratifi ed by Supreme Soviet or Parliament.
Estonia who did not have “direct” territorial issue unlike other Union Republics might have
26 Yeryemyey Grigorye (2005) Nyewidimoye litso wlasti, Chişinău, p. 356.27 GARF, f. 9654, op. 2, d. 126, l. 93оb.28 ibid., l. 94оb.29 ibid., l. 138оb.30 GARF, f. 9654, оp. 2, d. 127, l. 158; 198оb.31 ibid., l. 179оb.
http://rcin.org.pl

189The Rebirth of Sovereign States and fi rst challenge...
a possibility to take a hard line for achieving sovereignty. However, the Estonian delegations
did not take such role. The clear reason why Estonia could not do was the Russian minor-
ity issue in Narva and Sillamae regions. At the end of 1988 it already became big trouble in
the Estonian society and Russian-speakers in Estonia appealed in the First Congress of Peo-
ple’s Deputies to protect the human right of ethnic minorities from Estonian government32.
Therefore, Estonian delegations should be more careful to touch minority issue than Moldova
and Lithuania, which come out as problem later than middle of 1989.
RUSSIAN AND SOVIET STANDPOINTS – WAS RUSSIA GOVERNOR OF SOVIET UNION?In the third meeting of 1939, Pact researching commission it was discussed subject that Russia
should be defi ned as a same entity of USSR33. Iu. Afanashev, director of institute from Russia,
insisted that Russia lost Republic ethnic history under the Soviet rule for the reason that Russia
was equated with Soviet Union. Afanashev is a heroic existence for Baltic nations because in
the Tallinn meeting in 23 August 1988 he described personal opinion that Secret Protocol was
a decisive factor of Estonian annexation into USSR34. It should be defi ned that he had a more
priory to reconsider and judge Stalinism and Stalin’s deeds than to assist Baltic democratic
movements. It can be proved by his notice that text book of Soviet history for ninth 9th grade
school-student did include “untruth” in each page and school-teachers unfortunately must use
it 35. His reconsider attitude toward Soviet history seemed like “for-disintegration” of USSR
and “pro-separatism” of Baltic states. 1939 Pact researching commission alarmed that mass
media and “conservatives” developed personal remarks to commission members, especially
Afanashev and Šiličitė36.
V. Falin, communist from Russia, was located in opposite position from Afanashev.
According to his opinion before 1939 Pact researching commission, he thought Secret Protocol,
which Western researchers indicated the division of Soviet-German sphere was missing or
originally did not exist37. According as interview with Motieka, he could not sympathize
because Falin had an intention to use the negotiation card of Vilnius issue for pressing Lithua-
nian democratic and sovereignty (“separatism from USSR”) movement38. Falin also admitted
that he could never share common opinion with Baltic delegations39.
G. Arbatov, another delegation from Russia, also carefully paid attention to Baltic democ-
ratic movements40. At the beginning of the second meeting he alarmed to boycott if the subject
would touch to seceding issue of Bessarabia and Baltic from Soviet Union41. In the fourth meet-
ing, meanwhile Baltic delegations and Afanashev handed in decision of 3/4 member’s opinion,
Arbatov made different report that the existence of Secret Protocol were non-doubtful but this
contain mentioned only division of German-Soviet sphere and did not touch current political
32 LVNA, f. 43, op. 1, d. 63.33 GARF. f. 9654, оp. 2, d. 126, l. 55оb.34 Wada, Baltic States pricked, p. 89.35 Yu. Afanashev (1989) Idea of Perestroika, Gunzou-sya, Tokyo, p. 290.36 GARF, f. 9654, оp. 2, d. 127, l. 201–202оb.37 Izidors Vizulis (1990) The Molotov-Ribbentrop Pact f 1939: The Baltic Case (Westport, New York, Praeger,
London, p. 121.38 Interview with Motieka, Vilnius, 22 Jun 2007.39 Valentin Falin (1999) Byez skidok na obstoyatyelstva, Moskva, p. 403.40 GARF, f. 9654, оp. 2, d. 124, l. 201оb.41 ibid., l. 199оb.
http://rcin.org.pl

190 Keiji Sato
status of Baltic states42. In short, he refused a possibility to become more sovereignty status or
independent states of Baltic countries. Kraveth supported his plan43 and Falin and Yakovlev,
although they did not say direct backing words in the session, also had common opinion with
Arbatov according to other materials44.
CONCLUSION
As demonstrated above “said and did” by commission members refl ected on faced conditions
of their countries quite well. In this point Moldova, which could not represent clear opinion in
1939 Pact researching commission, can be found fatal mistake for future political handling as
an independent state. Moldova fi nally did not want to and could not integrate into Romania
and rely on Russia and this ambiguous position is still going till now. On the contrary Ukraine
and Baltic states had clear difference from Moldova in the point of insists of national interest.
Kraveth did not accept invalid of Secret Protocol checking national interest and Baltic delega-
tions, who faced strong pressure from Baltic general public, tried annul of it as a same reason
as Kraveth. After all, these actors could not compromise till the end of 1939 Pact researching
commission. The signifi cant point is that they already started to consider what national interest
meant in reality.
42 LVNA, f. 32, op. 1, d. 81.43 GARF, f. 9654, оp. 2, d. 127, l. 200оb.44 GARF, f. 9654, оp. 2, d. 126, l. 28оb; Valentin Falin (1999) Byez skidok...p. 404.
http://rcin.org.pl
ETHNIC DIVERSITY OF SLOVAKIA
JURAJ MAJO and MARCEL HORŇÁK
Department of Human Geography and Demogeography
Faculty of Natural Sciences, Comenius University,
Mlynská dolina
842 15 Bratislava, Slovakia
e-mail: [email protected], [email protected]
Abstract. It is no doubt that ethnic structure of Slovakia is very heterogeneous and
in the past was very dynamic also. Especially, between years 1880 – 1930 the Slovak
population had undergone its most dynamic era in history. Many of these changes
were conditioned by social, cultural and political factors in Hungarian Empire, as
well as founding of Czechoslovak republic. Signifi cant changes of ethnic structure
had occurred during, and after the end of WW II as well. The aim of this paper is
to show the changes of diversity of ethnic structure in Slovakia with the appropri-
ate censual data. The changes in ethnic structure are compared against the census
in 2001, and spatial changes of ethnic structure are evaluated by indices of ethnic
diversity of Slovak regions
Key words: ethnicity, ethnic diversity, ethnic diversity measurement, Slovakia, history
INTRODUCTION
The region of Central Europe is one of the most dynamic region considering more cultur-
al aspects. For example, this region is crossed by boundary between Eastern and Western
Christianity. Western Christianity is here represented not only by Roman-Catholic Church,
but also by strong historical Protestant denominations. Unique denominations in this region
are Uniate churches, creating cultural bridge between Eastern and Western Christianity and
culture. Central Europe had also been infl uenced by Islam between 16th and 18th century, and
there were numerous Jewish minorities all over this region.
This region was diversifi ed from the point of view of ethnicity. In the Carpathian Basin there
were many ethnic groups living together ever since. These ethnic groups belonged to various
language families (Slavic, Finno-Ugric, Italic). Therefore, in the region of Slovakia had
always been inhabited by Slovaks, Hungarians, Germans, and Ruthenians mainly. This mosaic
was completed Croatians, Serbians, Jews, Romanians, Gypsies, Poles, and many others.
EUROPA XXI2007, 16: 191-198
http://rcin.org.pl

192 Juraj Majo, Marcel Horňák
Such ethnic diversity is past nowadays. Except Slovaks, Hungarians, Ruthenians and
Romas, there are unfortunately no larger ethnic groups living in Slovakia. The process of
assimilation is slower in these ethnic groups, but the ethnic structure is now much less diverse.
Rural settlements had sustained its ethnic diversity more intensively than cities, although some
homogenization processes are evident here too. The aim of this paper is to convey snapshot of
today´s ethnic diversifi cation of Slovakia in comparison to year 1880.
Ethnic diversity is structured phenomenon encompassing various processes. Also, methods
of measurement of such type of diversity vary. There are qualitative or quantitative methods
of diversity measurement. We have adopted measurement of ethnic diversity according to
the ethnic fragmentation index (Greenberg index of ethnic diversity) used in paper from Yeoh
(Yeoh 2003)
∑=
⎟⎠⎞
⎜⎝⎛
−−
⎟⎠⎞
⎜⎝⎛−=
n
i
ii
Nn
Nn
F1 1
11
ni represents number of members of i-ethnic group, and N total population of a statistical
unit. This formula is defi ned as probability of membership of two randomly selected persons
in different ethnic group. This index varies from 0-1, and the value 0 represents completely
homogeneous unit, ant 1 completely heterogeneous unit. (Yeoh 2003).
Key data for ethnic diversity measurement come from Census 2001. We have analyzed data
of ethnic structure (Slovak statistics prefers term nationality) of communes. Membership in
nationality group was freely declared in census. According to offi cial defi nition from census,
nationality is referred to as the person´s affi liation to the nation or ethnic minority. Mother tongue
is not the decisive factor when determining nationality, nor the tongue mostly used or better spoken
by the citizen, it is rather his/own decision on the affi liation to the nation or ethnic minority.
The nationality of children aged under 15 was indicated according to the nationality of their parents.
If parents stated different nationalities, the nationality declared by one of them was indicated (upon
mutual agreement of parents). (according to http://portal.statistics.sk/showdoc.do?docid=4486).
Salient information is that ethnic membership does not depend on the use of ethnic minority
language, but on free declaration of membership. That is why ethnic diversity does not mean
the same as linguistic diversity.
Another data source from census 1880 had totally different philosophy. There are data
according to mother tongue available only (népesség anyanyelv szerint). Therefore, these data
are not completely comparable to the data from 2001, but there are no other ethnicity data
from this period available. Statistical system of ethnic affi liation record started to fully develop
after 1918 only.
ETHNIC DIVERSITY OF POPULATION OF SLOVAKIA IN 1880
There were 44 settlements having the status of town in 1880. These were free royal towns, or
towns with established municipal authority. Slovaks were mostly largest ethnic group inhabit-
ing towns at the end of 19th century. Another important ethnic group shaping urban space of
northern Hungarian towns were Germans, followed by Magyars, and another minor ethnic
groups. There was very little share of Ruthenians in urban settlements then. According to
http://rcin.org.pl

193Ethnic diversity of Slovakia
the Table 1, the most ethnically diverse town was Nitra composed of Slovaks, Magyars, and
Germans. There was only slight dominance of Slovak population in Nitra. The share of Slovaks
and Magyars was almost equal in the second most heterogeneous town – Košice
Interesting fact is that the total urban settlements heterogeneity index value was higher –
– 0.684. This value was mainly composed by three most numerous ethnic groups then – Slovaks,
Germans, and Magyars in various combinations and share. As already mentioned, the major
ethnic group in the top heterogeneous town rank was Slovaks. There were only two towns with
non-Slovak majority – Komárno and Rimavská Sobota. These towns were mainly inhabited by
Hungarians. Ethnic diversity in Slovak towns in proved by fact, that there were only 4 towns
with the share of one ethnic group (Slovaks) over 90 % – Ľubietová, Nová Baňa, Pukanec
Table 1. Ethnic diversity index of towns in Slovakia in 1880
town index value major ethnic groups
1 Nitra 0.674 Slovaks, Magyars, Germans
2 Košice 0.667 Slovaks, Magyars, Germans
3 Levoča 0.619 Slovaks, Germans, Magyars
4 Prešov 0.610 Slovaks, Magyars, Germans
5 Trenčín 0.604 Slovaks, Germans, Magyars
6 Trnava 0.600 Slovaks, Germans, Magyars
7 Pezinok 0.579 Slovaks, Germans, others
8 Svätý Jur 0.574 Slovaks, Germans, others
9 Spišská Nová Ves 0.570 Slovaks, Germans, Magyars
10 Spišské Vlachy 0.568 Slovaks, Germans, Magyars
Source: Population and Housing Census, 2001.
Figure 1. Ethnic diversity of towns in Slovaia in 1880
http://rcin.org.pl

194 Juraj Majo, Marcel Horňák
a Krupina. Ľubietová and Pukanec towns were not considered urban settlements in the follo-
wing censuses (such as 1910 census). Although these towns were former mining towns, and
the population was not much lower than other towns, it seems that their structure resembled
rural settlements rather than urban settlements at that time. Ethnic homogeneity of towns in
1880 presents Figure 1.
Rural settlements had lower diversity index than urban settlements – 0.538. It is not much
lower value comparing to the urban settlements value. So, it means, that rural settlements
were almost equally heterogeneous, or homogeneous, as towns. The most heterogeneous
villages were located in the eastern part of Slovakia. Rural settlements in this part of Slovakia
were mostly heterogeneous thank to Ruthenian population. There is a spatial exception to this
rule, when one of the more heterogeneous villages is located in the western part. Leopoldov
municipality is mostly composed by Slovaks and Magyars as well as by other, not specifi ed
ethnic groups.
Ethnic diversity of Slovak population is proved by fact, that in 1880 there were only 12 eth-
nically homogeneous communities. Most of them were rather small in population, and were
mostly located in eastern parts of Slovakia.
ETHNIC DIVERSITY OF SLOVAKIA IN 2001
In comparison with year 2001 there were some really remarkable changes in processes of eth-
nic homogenization of population of Slovakia. The most numerous ethnic groups besides Slo-
vaks were also Magyars, Ruthenians, and Romas. Spatial distribution of Magyars and Ruthe-
nians copies state boundaries with adjacent states, while the distribution of Romas is focused
in central and eastern parts of Slovakia, in so called regions of Gemer and Spiš.
Diversifi cation of ethnic structure of Slovakia in 2001 was based again on comparison bet-
ween rural and urban population. The processes of ethnic changes infl uenced also the values
of ethnic diversifi cation index, which dropped to quite low values. Urban ethnic structure was
diversifi ed at the value of 0.21, and, surprisingly, rural population was diversifi ed at the level
0.3. These differences are not signifi cant, but presents that urban population is today more
homogeneous than rural. In comparison to year 1880, these values are lower, and the rural
settlements were more ethnically diverse in 2001 than towns. We would expect that towns
and cities, as sites of high population concentration, would have higher values of ethnic diver-
sity index than rural municipalities. There might be present more complexed and rather latent
processes of ethnic identity change in new environment, and more intense level of social inter-
action in urban space. The idea of towns being something like „melting pot” for minor ethni-
cities, emerges from these speculations. Evident manifestation of own ethnic identity of new
immigrants might make social integration more diffi cult. This is not universal rule in this area,
but there might be some impacts of urban areas on ethnic identity stability.
Table 2 as well as Figure 2 show, that towns with higher value of ethnic diversifi cation are
located in central and eastern parts of Slovakia. Ethnic groups composing ethnic diversifi ca-
tion are generally common, and another sign is that values are lower than in 1880. First two
mentioned ethnic group in table are dominant, third is rather complementary making ethnic
appearance of town more diverse. Index values around 0.5 might show, that in most towns
http://rcin.org.pl

195Ethnic diversity of Slovakia
there are mostly only two ethnic groups forming ethnic circumstances in Slovak towns. Census
2001 is missing important urban element from 1880 – Germans, that is now replaced by new
urban ethnic group - Romas.
Homogeneity of towns in Slovakia is proved by fact, that 100 towns from 138 have share
of one ethnic group above 90 %. In all cases this majority group represents Slovaks. This is
salient change in 130 year history of Slovakia. Most of them lie in the ethnically most stable
north-western region of Slovakia.
Higher rate of heterogeneity is evident at the rural settlements. Ethnic diversity index
reached level of 0.303. Tendency of heterogeneity index growth from north towards south and
from east to west is common for towns as well as for rural settlements. The most heterogene-
ous communes can be found at the contact zone between Slovak, Ruthenian, and Ukrainian
Table 2. Ethnic diversity of towns in Slovakia in 2001
town index value major ethnic groups
1 Medzilaborce 0.561 Slovaks, Ruthenians, Ukrainians
2 Moldava nad Bodvou 0.549 Slovaks, Magyars, Romas
3 Veľké Kapušany 0.544 Magyars, Slovaks, Romas
4 Hurbanovo 0.540 Magyars, Slovaks, Romas
5 Čierna nad Tisou 0.524 Magyars, Slovaks, Romas
6 Rimavská Sobota 0.523 Slovaks, Magyars, others
7 Tornaľa 0.521 Magyars, Slovaks, Romas
8 Komárno 0.518 Magyars, Slovaks, others
9 Želiezovce 0.515 Magyars, Slovaks, Romas
10 Galanta 0.500 Slovaks, Magyars, Romas
Source: Population and Housing Census, 2001.
Figure 2. Ethnic diversity of towns in Slovaia in 2001
http://rcin.org.pl

196 Juraj Majo, Marcel Horňák
majority. This structure becomes more colorful due to Roma population and are rather small
in population
Small population is common sign for ethnically homogeneous rural communities. These
communities are small, mostly depopulating settlements with population varying from 7 to
950 inhabitants. Their common sign is Slovak population exclusively and their concentration
to the areas of central and eastern Slovakia. Higher concentration is evident around the town
Prešov (see Figure. 3).
CONCLUSION
Presented analytical data indicates great dynamics that ethnic structure has undergone
in 1880-1930 in heterogeneous cultural region of Central Europe and Slovakia. At fi rst,
Table 3. The most ethnically homogeneous towns in Slovakia in 2001
town index value share of Slovaks
Tvrdošín 0.019 99.03 %
Rajec 0.023 98.86 %
Trstená 0.023 98.82 %
Vrbové 0.025 98.75 %
Námestovo 0.027 98.65 %
Hriňová 0.028 98.56 %
Rajecké Teplice 0.029 98.54 %
Leopoldov 0.030 98.50 %
Krásno nad Kysucou 0.032 98.39 %
Bytča 0.034 98.27 %
Source: Population and Housing Census, 2001.
Figure 3. Ethnically homogeneous settlements in 1880 and 2001
http://rcin.org.pl

197Ethnic diversity of Slovakia
the dynamics of ethnic processes springs from rather unstable political circumstances in
the fi rst half of the 20th century, that infl uenced willingness of not declaring own ethnic
affi liation, and secondly, there were evident processes coming from inside of ethnic groups as
a response to impetus coming from outside of ethnic groups. Towns in 1880 were centers of
diverse ethnic structure of population, while rural settlements were more stable due to social
and cultural patterns and low ethnic heterogamy. If there were more ethnic groups present
in one community in history, the interaction was usually only offi cial with low rate of intermar-
riage. Ethnic intermarriage was usually not fully accepted by local community at that time.
This period was the time of fast growing of Hungarian population not only from natural
increase, but rather from different ethnic identity between the generation of parents and chil-
dren. In 1910, more than 1/3 of the population in the area of today´s Slovakia was Hungarian.
The last period started in 1918, and refl ected in census 1930. The new geopolitical situation
Figure 4. Ethnic diversity of regions of Slovaia in 1880
Figure 5. Ethnic diversity of regions of Slovaia in 2001
http://rcin.org.pl
198 Juraj Majo, Marcel Horňák
in Carpathian Basin had certainly impact on new ethnic processes. Share of non-Slovaks (or
Czechoslovaks) started to decrease. Though, thirties were not the period of the most evident
ethnic minorities decrease. Such period emerged after 1945, mostly due to postwar confer-
ences resolution including German and Hungarian ethnic groups in Czechoslovakia.
Research of ethnic processes and their spatial impact would be another interesting topic.
The era of Socialism in Slovakia had activated fast growth of towns, industrialization and new
and numerous migration fl ows. The set of such extensive changes in society infl uenced the tra-
ditional cultural patterns, including growth of ethnic heterogamy, and rather descending rates
of most of the ethnic groups living in Slovakia. The problem is in data arrangement. As far as
we know, the data from Census 1950 were not so far processed, so we miss the most important
and the most valuable data presenting impacts of postwar political processes.
The Census data 2001 were here presented only for the purpose of comparison between
the era 1880-1930 and what „had been preserved” today.
ACKNOWLEDGEMENT
This work was supported by Research and Development Assistance Agency under the contract
No. APVT-20-016704.
REFERENCES
A magyar korona országaiban az 1881.év elején végrehajtott népszámlálás föbberedményei megyék
és községek szerint részletezve, 2., Pesti Könyvnyomda – Részvény – Társaság, Budapest.
Population and Housing census (2001) Statistical offi ce of the Slovak Republic.
Selected indicators – Methodological notes. Census of Population and Housing. Available at:
–http://portal.statistics.sk/showdoc.do?docid=4486 (cited November 2nd 2007)
Yeoh K. K (2003) Phenotypical, linguistic or religious? On the concept of ethnic fragmenta-
tion, Malaysian Journal of Economic Studies, 40, 1, 2, 23–47.
http://rcin.org.pl