eu 2016 - d2ouvy59p0dg6k.cloudfront.netd2ouvy59p0dg6k.cloudfront.net/downloads/maximiser... ·...
TRANSCRIPT

Maximising auctioning revenues from the EU Emissions Trading System
SMART CASH FOR THE CLIMATE
2016EU
THIS REPORT WAS FINANCED BY:

December 2016
Front cover photo ©iStock
Authors:
ECOLOGIC INSTITUTEMatthias Duwe, Head, ClimateEmail: [email protected] Karola Velten, Fellow, Climate and EnergyEmail: [email protected] Straße 43/4410717 Berlin
WWF contacts:
WWF EUROPEAN POLICY OFFICEImke Lübbeke, Project Director - MaxiMiseR / Head of Climate and Energy UnitEmail: [email protected] Wallace-Jones, Project Manager - MaxiMiseREmail: [email protected] van den Plas, Climate policy officerEmail: [email protected] du Commerce 123 - 1000 Brussels Website: www.maximiser.euTwitter: @MaxiMiseREU

A full version of this report, and an accompanying interactive webtool, can be found on www.maximiser.eu
SUMMARY REPORT
The MaxiMiseR project has been funded through the EU’s LIFE programme and the MAVA Foundation. It is delivered by WWF’s European Policy Office. More information: www.maximiser.eu
Maximising auctioning revenues from the EU Emissions Trading System
SMART CASH FOR THE CLIMATE

SMART CASH FOR THE CLIMATE
4
Glossary of key ETS terms
Auctioning revenues – When companies buy emissions allowances, the money goes to the Member State where the company bought the emission allowances from.
Allowances in circulation – The technical term for ‘surplus allowances’. There are too many allowances currently available, meaning the carbon price is low and it is cheap to emit carbon. This is mainly due to large amounts of international carbon offsets which were allowed into the EU carbon market earlier, and partly due to the economic downturn.
Carbon price – The cost on the ETS market of one tonne of CO2. Currently at just €4-5 per tonne, it is
estimated that it should be at least €30 to encourage the deployment of cleaner technologies in Europe.
Emissions cap – An upper limit on the total amount of greenhouse gas emissions that can be released into the atmosphere. The cap for 2020 is set at 21% below 2005 emissions. This is reduced every year by a certain agreed amount – the Linear reduction factor.
Emissions Trading System – The European Union Emissions Trading System (ETS) is a tool for reducing the EU’s CO
2 emissions by putting a price on carbon from certain sectors: energy-intensive
industry, the energy sector and commercial aviation. There is a cap – or limit – on the emissions which can be released, and under this companies can buy or sell ‘emissions allowances’ permitting them to pollute. In Europe, about 11.000 industrial installations are covered by the EU ETS, responsible for around 45% of the EU’s greenhouse gas pollution.
Free allocation – A certain number of ETS allowances are given for free (rather than auctioned) to heavy industry and the power sector in some Member States.
Linear reduction factor – The ETS emissions cap gets lower every year by a fixed amount in order to gradually reduce emissions: this amount is the ‘Linear Reduction Factor’. Currently it is set at 1.74% and proposed to increase to 2.2% after 2020.
Market stability reserve – A certain amount of surplus allowances are to be taken temporarily out of the carbon market into the ‘market stability reserve’ with the aim of creating more scarcity of emission allowances on the carbon market and so making it more expensive to pollute.
Re-basing – Moving the starting point of the ETS emission cap to the level of actual emissions, which are lower than the currently suggested level for the starting point. Doing this for the fourth trading phase (2021-2030) would help to avoid creating more surplus emissions allowances on the ETS market, since emission levels are expected to remain below the emission cap up to 2020 and beyond.
Trading phase – Allowances are allocated for a set period of time, known as a ‘trading phase’. Phase 1 was 2005-2007 and 2 from 2008-2012. The current EU ETS trading phase (Phase 3) runs from 2013 - 2020. Proposed changes are currently being discussed for Phase 4, from 2021-2030.
Contents
EXECUTIVE SUMMARY 5
I. Smarter spending: ensuring auction revenue is used for climate action 5
II. Smarter rules: ETS reforms could maximise auction revenue 6
III. Smarter information: reduce deficiencies in the reporting of auction revenues and their use 6
INTRODUCTION AND REPORT 7
Part A. How much auctioning revenue is there and how are Member States handling it? 7
Part B. How would reforms to the EU ETS affect auctioning revenues and use? 15
Part C. Recommendations for a smarter ETS design for maximum value of auction revenues 20
NOTES 22

SMART CASH FOR THE CLIMATE
5
Executive Summary
The Paris Agreement on climate change saw countries commit to keeping global warming well below 2°C, and to pursuing efforts to keep it below 1.5°C.
These goals require public and private expenditure to be urgently shifted to investment in clean technology.
Revenues from instruments that put a price on carbon can be a key source of climate finance. In the EU, many emitters of greenhouse gases have to pay to pollute by buying ‘emissions allowances’ under the Emissions Trading System (EU ETS).
EU Member States are not required to spend the money they get from selling emissions allowances in any specific way, but the EU’s ETS Directive recommends 50% go towards tackling climate change.
This report looks at how these auctioning revenues have been spent so far. It reviews the ways in which proposed reforms to the EU ETS would affect the auctioning revenues and their use. Some of the key recommendations it makes in order to maximise auctioning revenues for the climate are as follows:
I. Smarter spending: ensuring auction revenue is used for climate action
EU Member States report that they have spent an average of 85% – or nearly EUR 10 billion – of their total Emissions Trading System (ETS) auction revenues on climate related purposes (2013 to 2015). They are thus outperforming the 50% level recommended by the current ETS Directive. However, the money can still be spent better and more transparently for the climate and the Commission proposal for an updated Directive for 2021-2030 sadly does not make improvements in this regard.
Our recommendations:
• Require that Member States earmark or specifically designate ETS auction revenues to tackle climate change.
• Require, rather than suggest, that a certain percentage of auction revenues go toward climate action and increase the percentage to 100%.
• No activities that can increase emissions (such as electricity price compensation payments) should be allowed to count towards the share for climate related purposes.
• A distinct minimum share should go to international climate action – because this is at only 9% as per current national reports.
• Create a sizable new EU International Climate Finance Fund to ensure that a certain guaranteed minimum amount of funding is going towards supporting developing countries in tackling climate change and its impacts – in addition to expenditure for this purpose by Member States.

SMART CASH FOR THE CLIMATE
6
II. Smarter rules: ETS reform could maximise auction revenue The current Commission proposal for ETS reform represents an additional EUR 120 billion in lost revenues due to free allocation, on top of EUR 40 billion value already handed out under the current rules – creating a 12-digit price tag for Member States. Several proposals exist that would remedy this situation and maximise auction revenue.
Our recommendations:
• Reduce the level of free allocation compared to the Commission proposal – move towards full auctioning as the current ETS Directive intended.
• Create more scarcity, and thereby a higher carbon price, by permanently removing surplus emission allowances from the market. This can be achieved by implementing a higher linear reduction factor, a lower initial starting point for the cap, and cancellation of surplus allowances from the Market Stability Reserve.
• Implement measures at Member State level to support the carbon price signal indirectly through national cancellation of surplus allowances or directly by setting a carbon price floor.
III. Smarter information: reduce deficiencies in the reporting of auction revenues and their use
The information provided by Member States at present is fraught with inaccuracies and inconsistencies and also the reporting framework has weaknesses – hampering transparency as well as comparability and aggregation of data.
Our recommendations:
• Improve the reporting template Member States are given by including more input fields, more standardising features, and more guidelines for entering data.
• Provide specific detail and additional information, including on: details on any earmarking, the committed and the disbursed value, past funding, individual programmes funded and their main purpose.
• Install a quality review of the reports that is carried out at regular intervals.
The report is accompanied by an online interactive tool on www.maximiser.eu/ets-tool
SMART CASH FOR THE CLIMATE
7
Introduction
The Paris Agreement’s temperature limit of 1.5°C requires net zero energy and industry CO
2 emissions globally by around 2050 1. This in turn requires the
economy to be transformed, with public and private expenditure urgently shifted to investment in clean technology to avoid further lock-in to high emissions. For the EU, this decarbonisation implies investment in the order of EUR 270 billion per year up to 2050 – investment that would be balanced almost completely by savings in avoided fuel costs 2. Globally, the EU and other industrialised countries have promised to mobilise international climate finance amounting to USD 100 billion annually from 2020 and an even higher sum after 2025 3. While a share of this may come from the private sector, significant public funds will be required to leverage the total.
In this context, revenues from putting a price on pollution represent a key source for climate finance. Through the auctioning of emission allowances in the EU Emissions Trading System (EU ETS), many emitters of greenhouse gases (GHG) have to pay for their emissions by buying so-called allowances. Member States are not required to spend those revenues in any specific way, but the ETS Directive recommends 50% go on climate action.
This publication summarises the findings of a technical report 4 that looked at how these auctioning revenues are spent – that is, to what extent they are used for climate-friendly purposes (Part A). It also reviews the ways in which proposed reforms to the EU ETS for the period 2021-2030 5 would affect auctioning revenues and use going forward (Part B). Based on this information, it concludes with recommendations for maximising auction revenue and its use to tackle climate change (Part C).
The report is accompanied by an online interactive tool on www.maximiser.eu/ets-tool.
Part A. How much auctioning revenue is there and how are Member States handling it?
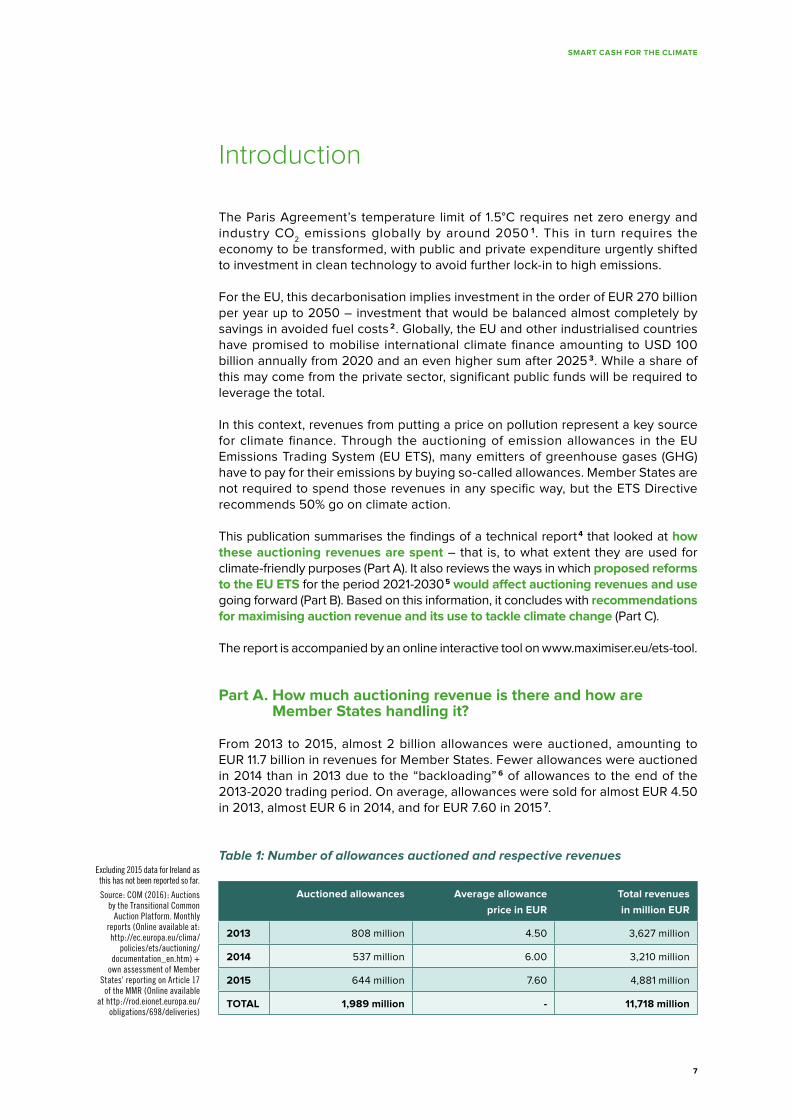
From 2013 to 2015, almost 2 billion allowances were auctioned, amounting to EUR 11.7 billion in revenues for Member States. Fewer allowances were auctioned in 2014 than in 2013 due to the “backloading” 6 of allowances to the end of the 2013-2020 trading period. On average, allowances were sold for almost EUR 4.50 in 2013, almost EUR 6 in 2014, and for EUR 7.60 in 2015 7.
Table 1: Number of allowances auctioned and respective revenues
Auctioned allowances Average allowance
price in EUR
Total revenues
in million EUR
2013 808 million 4.50 3,627 million
2014 537 million 6.00 3,210 million
2015 644 million 7.60 4,881 million
TOTAL 1,989 million - 11,718 million
Excluding 2015 data for Ireland as this has not been reported so far.
Source: COM (2016): Auctions by the Transitional Common
Auction Platform. Monthly reports (Online available at: http://ec.europa.eu/clima/
policies/ets/auctioning/documentation_en.htm) +
own assessment of Member States’ reporting on Article 17
of the MMR (Online available at http://rod.eionet.europa.eu/
obligations/698/deliveries)

€120 billion more for the climate? Here’s how.
The Emissions Trading System reform is a chance for the EU to free up more smart cash for the climate. The time is now! Check out the tool and report for more: www.maximiser.eu
PRICE PER ALLOWANCE
AMOUNT AUCTIONED
ALLOWANCES
AUCTIONING REVENUES
©ph
oto
WW
F
€12 billion in revenues (2013-2015) 85% spent on climate Country spending data hard to find
EU actionTake more permits
Move towards full auctioning100% revenues earmarked for off market climate
TomorrowHigh price
Fewer free pollution permitsUp to €120 billion more in revenues all spent on climate
TO
DA
Y
Low priceLots
of free allowances
€12 billion in revenues (2013-2015)
85% spent on climate Country spending data hard to find
EU
AC
TIO
N
Take more permits off
market
Move towards full auctioning
100% revenues earmarked for climate
TO
MO
RR
OW
High priceFewer free pollution permits
Up to €120 billion more in revenues,
all spent on climate
Better reporting
templates ®ular review
MORE AND SMARTER CASH
FOR THE CLIMATE

SMART CASH FOR THE CLIMATE
9
The total amount of revenues for single Member States varied widely, just as their total emissions covered by the EU ETS do. Small countries such as Malta and Luxembourg earned between EUR 4 million to 7 million per year, while the biggest emitter Germany had an income of up to EUR 1.1 billion (over 22% of the total), followed by the UK which generated almost EUR 600 million, Italy at EUR 550 million and Spain which earned almost EUR 500 million from auctioned allowances (all numbers for 2015).
Figure 1: Total revenues from auctioning of allowances for each Member State (2013-2015)
1,200
1,000
800
600
400
200
0
2013 2014 2015
Au
stri
a
Be
lgiu
m
Bu
lgari
a
Cyp
rus
Cze
ch R
ep
ub
lic
Ge
rman
y
De
nm
ark
Est
on
ia
Gre
ece
Sp
ain
Fin
lan
d
Fra
nce
Cro
ati
a
Hu
ng
ary
Ire
lan
d
Italy
Lith
uan
ia
Luxe
mb
ou
rg
Latv
ia
Malt
a
Ne
the
rlan
ds
Po
lan
d
Po
rtu
gal
Ro
man
ia
Sw
ed
en
Slo
ven
ia
Slo
vakia
Un
ite
d K
ing
do
m
Excluding 2015 data for Ireland as this has not been reported so far; Croatia only started auctioning allowances in 2015. Exact figures can be seen in the accompanying technical report on www.maximiser.eu
Source: own assessment of Member States’ reporting on Article 17 of the MMR (Available online at http://rod.eionet.europa.eu/obligations/698/deliveries)
© P
hoto
: WW
F / G
loba
l War
min
g Im
ages
SMART CASH FOR THE CLIMATE
10
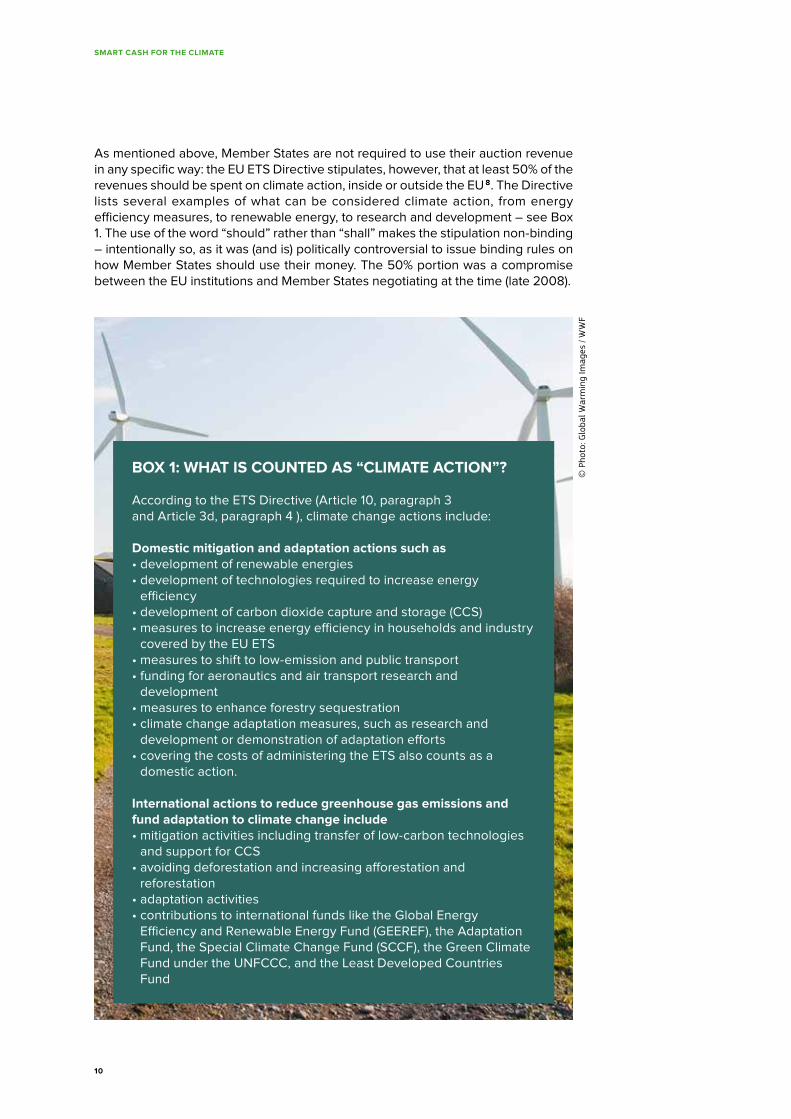
As mentioned above, Member States are not required to use their auction revenue in any specific way: the EU ETS Directive stipulates, however, that at least 50% of the revenues should be spent on climate action, inside or outside the EU 8. The Directive lists several examples of what can be considered climate action, from energy efficiency measures, to renewable energy, to research and development – see Box 1. The use of the word “should” rather than “shall” makes the stipulation non-binding – intentionally so, as it was (and is) politically controversial to issue binding rules on how Member States should use their money. The 50% portion was a compromise between the EU institutions and Member States negotiating at the time (late 2008).
BOX 1: WHAT IS COUNTED AS “CLIMATE ACTION”?
According to the ETS Directive (Article 10, paragraph 3 and Article 3d, paragraph 4 ), climate change actions include:
Domestic mitigation and adaptation actions such as• development of renewable energies• development of technologies required to increase energy
efficiency• development of carbon dioxide capture and storage (CCS)• measures to increase energy efficiency in households and industry
covered by the EU ETS• measures to shift to low-emission and public transport• funding for aeronautics and air transport research and
development• measures to enhance forestry sequestration• climate change adaptation measures, such as research and
development or demonstration of adaptation efforts• covering the costs of administering the ETS also counts as a
domestic action.
International actions to reduce greenhouse gas emissions and fund adaptation to climate change include• mitigation activities including transfer of low-carbon technologies
and support for CCS• avoiding deforestation and increasing afforestation and
reforestation• adaptation activities • contributions to international funds like the Global Energy
Efficiency and Renewable Energy Fund (GEEREF), the Adaptation Fund, the Special Climate Change Fund (SCCF), the Green Climate Fund under the UNFCCC, and the Least Developed Countries Fund
© P
hoto
: Glo
bal W
arm
ing
Imag
es /
WW
F

SMART CASH FOR THE CLIMATE
11
To assess whether and how actual use of auction revenues is living up to these parameters, Member States are required to submit annual reports. They are provided with a template, intended to standardise information on the amount of revenue overall, what portion is used for climate action, as well as the share going towards domestic and international climate action. The reports are submitted to a database managed by the European Environment Agency (EEA). So far, submis-sions from Member States cover years 2013, 2014 and 2015 and are the source for the above data on revenue amounts.
BOX 2: REPORTING NEEDS WORK!
A detailed look at the auctioning revenue submissions of Member States reveals major deficiencies in the existing reporting framework, which hamper comparability and aggregation. These include among others: the use of different exchange rates in the same report to convert auctioning revenues and the funds spent on individual domestic climate actions; double listing of funds spent in the different tables (which risks leading to double-counting); different use of committed and disbursed values, and missing and incomprehensible information on revenues received as well as on specific programmes.
Another common reporting issue is that Member States provided values for total funds spent on climate action that are inconsistent with the sum of funds spent on domestic and international climate action together. There are currently six Member States who have done this, among them Austria, which provides a list of projects that were financed by the state budget adding up to a higher amount than its auctioning revenues; Germany channels the money to a fund which had higher expenses than the auctioning revenues; and Portugal reported in the overall table only on disbursed amounts while its table on domestic actions also included committed amounts. Another specific question is whether activities listed as counting towards the 50% climate related expenses (as per Article 10 para 3 ETS Directive) should really be categorised as such (see example of Germany in Box 3).
© P
hoto
: Ram
pani
/ W
WF

SMART CASH FOR THE CLIMATE
12
Despite the fact that national submissions are available to the public, the data does not provide an easily accessible picture of what the revenue is used for – because the submissions are deeply tucked away on a website, contain mistakes and inconsistencies (see Box 2) and insufficient detail on key aspects (e.g. on the programmes being financed). It is unclear why these weaknesses have not already been identified and appropriate corrections requested by the European Commission (or the EEA) as part of a quality review to ensure accuracy of the reporting and the data submitted through the system.
Addressing these deficiencies involves improving the reporting template Member States use and making its correct use mandatory – here are some specific recommended improvements:• Providing clear input fields and features that standardise relevant calculations.
For instance, providing an automated link to the European Commission’s exchange rate calculator would allow national programmes and projects to be reported in the local currency and be automatically converted to EUR using the same exchange rate.
• Differentiating between financing amounts committed to climate action vs. already disbursed in a given year – and the amount carried over from previous years. This prevents “double counting” of funds.
To the extent the data contained in Member States’ submissions can be analysed despite these problems 9, it shows that countries have generally put more than 50% of their auction revenues toward climate action. On average, 85% – or nearly EUR 10 billion – of the nearly EUR 12 billion in total auction revenue is reported as having been spent on climate related activities inside and outside of the EU from 2013 to 2015.
BOX 3: FINANCING INCREASING EMISSIONS SHOULD NOT BE A “CLIMATE RELATED PURPOSE”!
Germany reports all expenditure under its national Energy and Climate Fund as counting towards (domestic) climate action. It is not further differentiated into individual programmes and thus is counted fully as “cross-cutting”.
The fund’s expenditure also contains payments to companies as compensation for the indirect cost of CO
2. This cost arises through an
increased electricity price caused by the cost of carbon. Such state aid payments are allowed under the ETS Directive – but counting them as a mitigation measure is misleading at best, as the compensation eliminates the carbon price signal and may lead to additional emissions by the companies concerned. The respective payments amount to around EUR 700 million for the years 2013-2015, a quarter of Germany’s auctioning revenues and 6% of total EU wide revenues.
Taking this amount off the EU wide sum reported as spent on climate, the share would not be 85% but 79% instead. This would be further reduced in the future if other Member States should emulate this practice going forward (e.g. Belgium (Flanders), Finland).
© P
hoto
: Glo
bal W
arm
ing
Imag
es /
WW
F

SMART CASH FOR THE CLIMATE
13
According to Member State reporting, 82% (EUR 8,691 million) of the revenue spent on climate was allocated to domestic climate actions, while less than 10% (EUR 1,048 million) of that climate related amount was spent on international action. Another 8% (EUR 808 million) went to unspecified climate related purposes 10. Figure 2 shows the allocation of revenues at Member State level and puts the split between domestic and international use in relation to the overall share of revenues spent on climate.
As Figure 2 shows, most Member States report to have spent the vast majority of their auctioning revenues on domestic climate actions (blue circle on top right). Denmark, Ireland and Romania say that they used (almost) 100% of their auctioning revenues for climate change actions, with 50% going to domestic actions and 50% going to climate actions (green circle, top centre). Luxembourg and Italy also report an (almost) equal split between domestic actions and international actions on average from 2013 to 2015 (but only report around 50% of all revenues going to climate related expenditure). Finland on the other hand reports to have spent 100% of its revenues so far for climate action at the international level (purple circle on middle left) – although there are indications that this is meant to change going forward 11.
Figure 2: Allocation of the EU ETS auctioning revenues over the period 2013-2015 as reported by Member States
Source: based on Member States’ reporting on Article 17 of the MMR (Online available at http://rod.eionet.europa.eu/obligations/698/deliveries). Belgium and the Netherlands did not provide information on domestic and international use and so these Member States are not included.
NOTE: Positions of Member States labels in this graph are indicative of the general positioning but do not in all cases represent their accurate position, because the values for some Member States are the same. This graph has been adjusted to show all MS labels. The figure excludes shares used for climate action but without specifying if domestic or international action. The graph goes up to 110% because six Member States provided values for total funds spent on climate action that are more than the sum of funds spent on domestic and international climate action together.
Four countries spent 100% of their revenues on domestic climate action: France, Greece, Latvia, Slovakia.
150%
125%
100%
75%
50%
25%
0%
100% share international action
Share spent on domestic action
Re
ve
nu
es
use
d t
o t
ack
le c
lim
ate
ch
an
ge
FI
100% share domestic action
0% 10% 20% 30% 40% 50% 60% 70% 90% 100% 110%
IT
LU
SE
DK IE UK
PTRO
LT ES FR
SKLV
DE
MT
BG
CZ
SI
PLEE
HU
HR
EL
CY
AT

SMART CASH FOR THE CLIMATE
14
In terms of the type of climate actions, the largest portion of total auction revenue went to initiatives that can be considered “cross-cutting” in that they include more than one type of action (e.g. a fund that finances mitigation and adaptation activities). Also popular were renewable energy and energy efficiency initiatives – Figure 3 provides a breakdown of auction revenue “destinations” by type, based on Member State reporting.
The reason the cross-cutting category is so large is that Germany’s actions (contri-butions to its Energy and Climate Fund) are listed as cross-cutting, and Germany’s auction revenue accounts for over one-fifth of the total EU revenue. The validity of the reported figures by Germany under domestic action may, however, be questioned – see Box 3.
Figure 3: Overview on the auctioning revenues and their use in the EU over the period 2013-2015
Source: all numbers in million EUR; own compilation based on Member States’ reporting on Article 17 of the MMR (Online available at http://rod.eionet.europa.eu/obligations/698/deliveries) using SankeyMatic ®
Mitigation: 291
Adaptation: 43
not specified: 464
Other: 1,005
Renewables: 2785
Energy efficiency: 1499
not specified: 808
Cross-cutting action: 3,652
not used for climate action: 1,748
Total revenues: 11,718
Other streams: 578 for international action: 1,048
for domestic action: 8,691
for climate action: 10,548

SMART CASH FOR THE CLIMATE
15
There are also more specific uses: spending on renewable energies is done by Spain (37% on average of the reporting period), the UK (26%), and Greece (17%). Spain and Greece report that they use the money to support renewable electricity generation, while the UK finances its renewable heat initiative. Reported auction revenues used for energy efficiency stem largely from France’s spending on building energy efficiency improvements via its “Habiter Mieux” programme (50%). With most of the revenue going toward domestic actions, Figure 4 breaks down revenue use by type of domestic action and by year.
In assessing all of these uses of revenue, a key factor to take into account is that Member States treat the revenues in their respective budgetary systems differently: some “earmark” revenues by requiring them to go toward a specific support programme or a fund directly (this is also known as “ringfencing” revenue for a specific purpose – or by the technical term “hypothecation”), while others put the funds into the country’s general budget and then count the portion of that budget spent on climate-friendly programmes as the Member State’s contribution to climate action.
In the latter case, the direct flow of money specifically from auctioning of the country’s allowances to climate change actions cannot be established: Member States can show mitigation or adaptation spending in their budget that is at the level of half their auction revenues as “proof” that they have used auction revenues toward the purposes laid out in the guidelines. This is the case even if that spending would or could have taken place without the additional ETS auction revenues.
Earmarking the auction revenue, however, also does not necessarily mean the Member State is making that amount of money available for additional climate-related purposes: the money may simply be replacing amounts that previously came from the state budget. In all these cases, the real climate benefits of the Member States practices regarding the use -and, where applicable, earmarking- of ETS auctioning revenues cannot be quantified.
Figure 4: Auctioning revenues spent on individual domestic climate actions
Source: own compilation on the basis of reported data. Abbreviations: R&D: Research and Development, Other: Forestry, Agriculture, Adaptation, Carbon Capture and Storage, Costs to administer the ETS system.
4,000
3,500
3,000
2,500
2,000
1,500
1,000
500
0
million EUR
2013 2014 2015
Other
Transport
R&D
Renewables
Energy Efficiency
Cross-cutting actions

SMART CASH FOR THE CLIMATE
16
There are seventeen Member States that do not earmark their auctioning revenues, but instead finance climate actions from the state budget. The UK, for instance, puts ETS auction revenue into the general budget, programmes of which already support climate change mitigation and adaptation. Eleven Member States earmark their auctioning revenues by allocating them to a specific support programme or climate fund. France channels all auctioning revenues to the “Habiter Mieux” [live better] programme managed by the National Agency for Housing (Anah) – this programme supports measures to improve the energy efficiency of housing.
Part B. How would reforms to the EU ETS affect auctioning revenues and use?
The current EU ETS trading phase goes until 2020. Proposed changes are currently being discussed for Phase 4, which runs from 2021-2030. Proposals for Phase 4 vary in terms of their effect on the amount of revenue Member States will accrue through the auctioning of allowances, and how they could use that revenue. The following is an overview of those proposals and their potential impact on revenue amounts and revenue use.
Maximising revenues from auctioning
Stepping back to basic economics, the formula for calculating auction revenue is volume (how many allowances are sold) times price (the selling price of each allowance). Having more allowances to sell can increase revenue if the price remains stable. An increase in the price, with the auction volume remaining the same, would also increase revenue. Having said this, measures to affect either one of the two factors may have an effect on the other: reducing the amount of allowances auctioned means fewer emission allowances are in circulation – they are thus relatively more scarce, and their price goes up accordingly; a simple case of supply and demand. However, modelling of price developments in the EU ETS shows that reducing the volume of allowances for auction causes price increases to a level that outweighs the fact that fewer allowances are being sold, as demand for the allowances is relatively inelastic. As a result, auction revenue still goes up even when volume is reduced.
© P
hoto
: Glo
bal W
arm
ing
Imag
es /
WW
F

SMART CASH FOR THE CLIMATE
17
Measures that affect volume include: • the allocation rules – what portion of the total allowances is auctioned vs. given
to emitters for free; and• the cap – the number of allowances being put into circulation in the first place
The main measures affecting price are:• perceived scarcity of emission allowances, meaning the extent to which the
demand for the allowances corresponds to their supply• some form of price control mechanism e.g. through a floor and/or ceiling price
The ETS reform proposal published by the European Commission in July 2015 includes a more stringent cap, which is expected to increase the carbon price. However, it would scrap the current ETS Directive’s plan to phase out free alloca-tion entirely by 2027. Doing so would have ensured that more and more (eventually all) allowances were auctioned rather than given out for free to emitters, but would still imply free allowances worth around EUR 40 billion, representing foregone auctioning revenues.
The Commission’s proposal of July 2015 would cause additional “lost revenue” to the tune of EUR 120 billion – representing a 12-digit price tag for Member States in order to allow emission intensive industry to carry on emitting for free.
Various stakeholders (see table below), on other hand, have brought forth alterna-tive reform suggestions that would affect auctioning revenue, mostly intended to “tighten” the cap even further: • Making the cap get lower faster (increasing its so-called “linear reduction factor”
or LRF) • Having the cap “start” at a lower level in the first place, to adjust it for emission
reductions that have taken place already (and erase a source of surplus) • Cancelling allowances by removing them from the Market Stability Reserve• Making the MSR function faster (taking more allowances out of circulation per
year than currently planned) or earlier (having the MSR begin operating before the currently planned date of 2019
BOX 4: EXPLAINING “STRUCTURAL SURPLUS” AND THE “MSR”
In recent years, the price of allowances in the EU ETS (called EUAs) has been low, due to a surplus of EUAs in the market, that was generated by two main factors: 1) emission credits from outside of the EU coming onto the market (so-called offsets) and 2) a stronger than anticipated decline in emissions during and after the economic downturn. The low price has thus led to lower than anticipated revenue from (an increasing volume of) EUAs being auctioned. To address the surplus, a new mechanism has already been adopted – the so-called Market Stability Reserve (MSR) removes EUAs from circulation to increase their scarcity and therefore their price. It operates automatically on the basis of quantitative triggers to collect and release allowances.
© G
etty
Imag
es

SMART CASH FOR THE CLIMATE
18
Additionally, taking an example from North American carbon markets – which feature price floors – some stakeholders called for an auction reserve or minimum price specifically targeting revenue maximisation. The EU has historically shied away from such direct price control measures, but arguments that an intentionally steadily increasing carbon price makes it possible to guarantee foreseeable returns is appealing to Member States in the context of potential carbon market volatility.
The table below summarises several of the main reform proposals, who made them, and their potential effect on auctioning revenues.
Table 2: Overview of influencing factors on auctioning revenues
SPECIFIC LEVER PROPOSAL PROPOSED BY EFFECT ON REVENUE
THE CAP
Direct reduction of the cap
LRF of 2.2% European Commission on the basis of the October 2014 Council Conclusions
Increasing effect
LRF of 2.8%
LRF is at least 2.6%
European Parliament Development Committee
Fortum Energy Company
Increasing effect
Adjusting the starting point (Rebasing)
Moving the starting point to actual emissions levels
European Parliament Environment Committee’s amendments
CAN-Europe
Increasing effect
Surplus reduction Cancel 2 billion EUAs from the MSR CAN-Europe Likely increasing effect
Scope changes No changes to the scope Proposed by the European Commission Neutral – effect unclear
Scope changes Include individual heating appliances in buildings
Fortum Energy Company Effect unclear
Offset use No access to offsets (from outside of the EU)
Proposed by the European Commission Increasing effect
ALLOCATION RULES
Relation between auctioning and free allocation
Freeze auctioning ratio at 57% – maintain free allocation
Proposed by the European Commission on the basis of the October 2014 Council Conclusions
Strong decreasing effect compared to current rules
Reduce auctioning ratio to 52%. increase free allocation to industry
Change Partnership (some energy intensive industry associations ask for the same or similar reductions in auctioning)
Likely increasing effect compared to COM proposal
Move to full auctioning, phase-out free allocation
CAN-Europe Strong increasing effect
Source of allowances for NER (for free allocation)
Take NER from the cap and not from the MSR
Several NGOs Likely increasing effect
Allowances for air carriers
EUAA for aviation should be calculated from the same LRF as other sectors, all EUAAs are auctioned
European Parliament Committee on Development
Increasing effect
PRICE CONTROL
Indirect supply-demand balance mechanism
Market Stability Reserve Already adopted in the form of amendments to the ETS Directive
Increasing effect
Increase MSR uptake Double the MSR’s uptake to 24% Change Partnership Increasing effect
Bring forward the MSR’s start date CAN-Europe et al Increasing effect
Direct price control Price floor at 20€ The Shift Project Strong increasing effect
Source: own compilation, not exhaustive

SMART CASH FOR THE CLIMATE
19
Improving the requirements on how money is spent
The Commission proposal simply retains the current non-binding guidance for Member States that more than half their auctioning revenue should be spent on climate action.
Other proposals to reform the ETS, however, made by various stakeholders, contain many options for changing the way Member States are required to use their auctioning revenue.
• One is not to make the revenue available to Member States in the first place: trade unions, the EU Parliament’s industry committee, and environmental groups propose creating set-asides – specific funds at EU level into which allowances to be auctioned are placed and toward which revenues go, instead of ending up in the hands of Member States to auction. These include an International Climate Action Reserve to be channelled to international climate finance and a “Just Transition Fund” to support workers during the transition to a low-carbon economy.
• Another proposal is to raise the percentage of auctioning revenue Member States are required to use for climate action – from the current 50% to 80% (EU Parliament Industry Committee) or even to 100% (Development Committee).
• Along those lines, environmental groups as well as some EU Parliament Committees call for the word “should” in the ETS Directive to be changed to “shall” so that the use of auction revenues for climate action is binding upon Member States.
• The Institute for Climate Economics suggests “soft measures” to reduce uncertainty in the climate friendly use of auction revenue, including insurance for large-scale projects in the form of minimum funding guarantees to lower risks associated with major green investments.
The only direct change the Commission proposal contains is the addition of three types of actions that should count as having been spent on climate related purposes under Article 10 paragraph 3: 1) electricity price compensation payments, 2) climate financing in vulnerable countries and 3) actions to allow for a soft transition by the workforce in sectors under transformation. The first element would legitimise the current approach taken by Germany (see Box 3) and thus explicitly allow activities that may lead to increasing emissions to be counted as “climate related”. The ETS Directive allows for such compensation under certain circumstances and it is thus connected to the impacts of a climate policy instrument. However, it is highly questionable to make these payments (which would counteract the precise function of the EU ETS) equivalent to other actions to reduce emissions or support adaptation.

SMART CASH FOR THE CLIMATE
20
Part C. Recommendations for a smarter ETS design for maximum value of auction revenues
On the basis of the analysis of the reporting data and the proposals for ETS design and their impact on revenues, we make recommendations in three areas: 1. Increasing auctioning revenues;2. Strengthening use of revenues for climate action; 3. Improving information on revenue use.
1. Maximising revenues: increase both volume AND price
• Reduce the level of free allocation compared to the Commission proposal - move towards full auctioning as the current ETS Directive intended. A large and growing share of the allowances in circulation should be auctioned, rather than given to emitters for free.
• Create more scarcity, and thereby a higher carbon price, by reducing the amount of allowances in circulation with a higher linear reduction factor (= more rapidly declining cap), a lower initial starting point for the cap (so that its downward trajectory is lower to begin with), and cancellation of surplus allowances “stored” in the Market Stability Reserve.
• Implement measures at member state level to support the carbon price signal indirectly through national cancellation of surplus allowances or directly by setting a carbon price floor through implementing a minimum auction price.
2. Strengthening use: mandatory earmarking & a new EU international climate finance fund
• Require that Member States earmark or specifically designate auction revenue to tackle climate action, rather than placing those funds in their budget and calculating retroactively how much of that budget went toward climate action.
• Require, rather than suggest, that the vast majority of auction revenue go toward climate action by changing the wording in the Directive to “shall” rather than “should,” and increasing that required percentage towards 100%.
• No activities that can increase emissions (such as electricity price compen-sation payments) should be allowed to count towards the share for climate related purposes.
• A distinct minimum percentage share should go to international climate action – because this is at only 9% as per current national reports
• Create a sizable new EU International Climate Finance Fund to ensure that a certain guaranteed minimum amount of funding is going towards supporting developing countries in tackling climate change and its impacts – in addition to expenditure for this purpose by Member States.
3. Better information: improve the way Member States report on their use of auctioning revenues
• Improve the reporting template Member States are given by including more input fields, more standardising features, and more guidelines for entering data.
• Provide specific detail and additional information, including on: details on any earmarking, the committed and the disbursed value, past funding, individual programmes funded and their main purpose.
• Install a quality review of the annual reports to ensure transparency, consistency and completeness of reporting.

SMART CASH FOR THE CLIMATE
21
© P
hoto
: Chr
is M
arti
n / W
WF

SMART CASH FOR THE CLIMATE
22
1. Rogelj et al (2015) Timetables for Zero emissions and 2050 reductions: State of the Science for the ADP Agreement. Available online at http://climateanalytics.org/publications/2015/timetables-for-zero-emissions-and-2015-emissions-reductions.html
2. COM (2011): Impact assessment of the European Commission’s “Roadmap for moving to a competitive low carbon economy in 2050. Staff Working Document, Accompanying Document to the Communication “A Roadmap for moving to a competitive low carbon economy in 2050”, SEC(2011) 289 final. Online available at: http://eur-lex.europa.eu/legal-content/EN/TXT/PDF/?uri=CELEX:52011SC0288&from=EN
3. UNFCCC (2015): Decision of the Conference of the Parties to the United Nations Framework Convention on Climate Change, 1/CP.21, UN Doc. FCCC/CP/2015/10, Add,1.
4. Velten, Duwe et al. (2016) Smart Cash for the Climate. Maximising Auctioning Revenues from the EU Emissions Trading System. Full Version. An analysis of current reporting by Member States and options for improvement. Study for the MaxiMiseR project of the WWF-EPO – available online at www.maximiser.eu
5. The basis for political debate on the future design of the EU ETS beyond 2020 is the legislative proposal published by the European Commission in July 2015, which suggests specific changes to the text of the existing Directive (last general reform adopted in 2009): European Commission 2015. Proposal for a Directive of the European Parliament and of the Council amending Directive 2003/87/EC to enhance cost-effective emission reductions and low-carbon investments” – COM/2015/0337. Online available at: http://eur-lex.europa.eu/legal-content/EN/TXT/?uri=CELEX:52015PC0337
6. 400 million allowances in 2014, 300 million allowances in 2015 and 200 million allowances in 2016 according to Commission Regulation (EU) No 1210/2011
7. Own calculations and COM (2016): Auctions by the Transitional Common Auction Platform. Monthly reports. Online available at: http://ec.europa.eu/clima/policies/ets/auctioning/documentation_en.htm. The fact that the average price per allowance was slightly higher in 2014 did not make up for the lower volume of allowances auctioned in that year, resulting in overall ETS revenues being slightly higher in 2013 than in 2014. In 2015 overall revenues were higher than in the previous two years because relatively more allowances were sold and the price per allowance was higher.
8. ETS Directive: Directive 2003/87/EC of the European Parliament and of the Council of 13 October 2003 establishing a scheme for greenhouse gas emission allowance trading within the Community and amending Council Directive 96/61/EC. Online available at: http://eur-lex.europa.eu/legal-content/EN/TXT/PDF/?uri=CELEX:02003L0087-20140430&from=EN, Article 10
9. Where this was possible, the authors have made a number of minor adjustments to the data set to make up for the inconsistencies – for full details please consult the full technical report.
10. These figures are based on the bottom-up sums of reported usage by Member States – a total that is derived from reported detailed usage which comes to EUR 10,547 million instead of 9,970 million that is the total for climate action spent reported on another table in the submissions. This is one of the consequences of the inconsistencies in the current reporting framework.
11. Personal communication, WWF Finland
Notes

SMART CASH FOR THE CLIMATE
23
The EU and other industrialised countries have pledged to cut greenhouse gas emissions by at least 40% by 2030, and by 80-95% by 2050. EU Member States must produce ‘Low Carbon Development Strategies’ (LCDS) to show how they will do so. Ensuring that these LDCS are ambitious and of a high quality, and are developed in a participative, transparent manner is key to meeting the EU’s emissions reductions goals. Helping this to happen is the aim of the MaxiMiseR project. MaxiMiseR is funded by the EU LIFE Programme for the Environment and the MAVA Foundation.www.maximiser.eu
The Ecologic Institute conducts inter- and transdisciplinary environmental research. The experts at Ecologic Institute also prepare political analyses and function as consultants. Ecologic Institute operates branches in Berlin, Brussels and Washington DC. In its role as a private, independent organization, Ecologic Institute is dedicated to the preparation of relevant sociopolitical aspects of sustainability research and contributing new knowledge to environmental policy. Innovative research methods, an orientation on practice and a transdisciplinary approach ensure scientific excellent and social relevance. The work done at Ecologic Institute covers the spectrum of environmental topics and includes the integration of environment-related issues into other political spheres. www.ecologic.eu
WWF’s mission is to stop the degradation of the planet’s natural environment and to build a future in which humans live in harmony with nature, by conserving the world’s biological diversity, ensuring that the use of renewable natural resources is sustainable, and promoting the reduction of pollution and wasteful consumption.The WWF European Policy Office The European Policy Office contributes to the achievement of WWF’s global mission by leading the WWF network to shape EU policies impacting on the European and global environment. www.wwf.eu

2016EU
www.maximiser.eu