ethnic polarization, potential con⁄ict, and civil wars
TRANSCRIPT

Ethnic Polarization, Potential Con�ict,
and Civil Wars
Jose G. Montalvo
Universitat Pompeu Fabra
and IVIE�
Marta Reynal-Querol
The World Bank
March 2005
Abstract
This paper analyzes the relationship between ethnic fractionalization, polarization, and con-
�ict. In recent years many authors have found empirical evidence that ethnic fractionalization
has a negative e¤ect on growth. One mechanism that can explain this nexus is the e¤ect of
ethnic heterogeneity on rent-seeking activities and the increase in potential con�ict, which is
negative for investment. However the empirical evidence supporting the e¤ect of ethnic frac-
tionalization on the incidence of civil con�icts is very weak. Although ethnic fractionalization
may be important for growth, we argue that the channel is not through an increase in potential
ethnic con�ict. We discuss the appropriateness of indices of polarization to capture con�ictive
dimensions. We develop a new measure of ethnic heterogeneity that satis�es the basic proper-
ties associated with the concept of polarization. The empirical section shows that this index of
ethnic polarization is a signi�cant variable in the explanation of the incidence of civil wars. This
result is robust to the presence of other indicators of ethnic heterogeneity, alternative sources
of data for the construction of the indicators, and alternative data for civil wars.
JEL Classi�cation numbers: D74, D72, Z12, D63�Instituto Valenciano de Investigaciones Economicas. We are grateful for comments by Antonio Villar, Joan
Esteban, Paul Collier, Tim Besley and two anonymous referees. We thank the participants of seminars at the World
Bank, Institut de la Mediterranea, Toulouse, Brown University, the European Economic Association Meetings and the
Winter Meetings of the Econometric Society. We would like to thank Sergio Kurlat, Bill Easterly and Anke Hoe er
for sharing their data with us. Financial support from the BBVA Foundation and the Spanish Secretary of Science
and Technology (SEC2003-04429) is kindly acknowledged

1 Introduction
The increasing incidence of ethnic con�icts and its much publicized consequences have attracted the
interest of many researchers in the social sciences. Many studies have addressed directly the issue of
ethnic diversity and its e¤ects on social con�icts and civil wars. Political scientists have stressed the
importance of institutions in the attenuation or intensi�cation of social con�ict in ethnically divided
societies. Recently economists have connected ethnic diversity with important economic phenomena
like investment, growth or the quality of government (Easterly and Levine 1997, Alesina et al. 2003
and La Porta et al. 1999). The number of papers dealing with the e¤ects of ethnic diversity on
issues of economic interest is growing rapidly.
In this respect it is common in recent work to include as a regressor in empirical growth esti-
mations an index of ethnic fractionalization. There are several reasons to include such an indicator.
First, some authors have argued that ethnically diverse societies have a higher probability of ethnic
con�icts, which may lead to a civil war. Otherwise the political instability caused by potential ethnic
con�icts has a negative impact on investment and, indirectly, on growth. Second, ethnic diversity
may generate a high level of corruption which, in turn, could also deter investment. Finally it
has been argued that in heterogeneous societies the di¤usion of technological innovations is more
di¢ cult, specially when there is ethnic con�ict among groups in a country. Business as usual is
not possible in a society with a high level of potential ethnic con�ict, since this situation a¤ects all
levels of economic activities. Trade may be restricted to individuals of the same ethnic group; public
infrastructures can have an ethnic bias; government expenditure may favor some ethnic groups, etc.
The common element in all these mechanisms is the existence of an ethnic con�ict which, through
social and political channels, spreads to the economy.
However many empirical studies �nd no relationship between ethnic fractionalization1 , ethnic
con�icts, and civil wars. There are at least three alternative explanations for this lack of explanatory
power. First, it could be the case that the classi�cation of ethnic groups in the Atlas Nadorov Mira
(ANM), source of the traditional index of ethnolinguistic fractionalization (ELF), is not properly
constructed. Some authors2 have used other sources, di¤erent from the ANM, to construct datasets
of ethnic groups for a large sample of countries. In general the correlation between the index of
fractionalization obtained using these alternative data sources is very high (over 0.8). Second, Fearon
1Measured by the index of ethnolinguistic fractionalization (ELF) using the data of the Atlas Nadorov Mira.2Montalvo and Reynal-Querol (2000), Alesina et al (2003) or Fearon (2003).
1

(2003)3 has argued that it is important to measure the �ethnic distance�across groups in order to
obtain indicators of cultural diversity. He measures these �distances� in terms of the proximity in
a tree diagram of the families of languages of di¤erent countries. As in the case of alternative data
sources, the correlation of the index of ethnic fractionalization, using these �distances�, with the
original ELF is very high, 0.82.
The third alternative is the one we pursue in this paper. Up to now the alternative data on
ethnic diversity and distances of ethnic groups in a country have been aggregated using indices of
fractionalization. However, it is not clear to what extent an index of diversity could capture potential
ethnic con�ict. In principle claiming a positive relationship between an index of fractionalization
and con�icts implies that the more ethnic groups there are the higher is the probability of a con�ict.
Many authors would dispute such an argument. Horowitz (1985), which is the seminal reference
on the issue of ethnic groups in con�ict, argues that the relationship between ethnic diversity and
civil wars is not monotonic: there is less violence in highly homogeneous and highly heterogeneous
societies, and more con�icts in societies where a large ethnic minority faces an ethnic majority.
If this is so then an index of polarization should capture better the likelihood of con�icts, or the
intensity of potential con�ict, than an index of fractionalization.
The objective of this paper is to analyze the empirical support for the link between ethnicity
and con�ict. We pursue this objective by reexamining the evidence on the causes of civil wars using
alternative indices to measure ethnic diversity. In the empirical section we show that the index of
ethnic polarization is a signi�cant explanatory variable for the incidence of civil wars. This result
is robust to the use of other proxies for ethnic heterogeneity, alternative sources of data, and the
use of a cross section instead of panel data. Therefore it seems that the weak explanatory power of
ethnic heterogeneity on the incidence of civil wars found by several recent studies is due to the use
of an index of fractionalization instead of an index of polarization.
This paper is organized as follows. Section 2 describes the characteristics of the index of frac-
tionalization and compares it with an index of polarization. Section 3 presents the empirical results
obtained by applying the index of fractionalization and the index of polarization to data on ethnic
diversity. It is shown that for very high levels of fractionalization the level of the index of polarization
can be very low. In fact, for high levels of diversity the correlation between fractionalization and
polarization is negative. In this section we also discuss the source of data on ethnic and religious
heterogeneity. Section 4 analyzes the causes of civil wars and compares the empirical performance of
3See also Caselli and Colleman (2003).
2

the polarization index proposed in this paper vis-à-vis the fractionalization index and other indices
of ethnic heterogeneity. Section 5 contains a set of robustness checks. Section 6 summarizes the
conclusions.
2 Ethnic heterogeneity and potential con�ict
Several authors have stressed the importance of ethnic heterogeneity in the explanation of growth,
investment, and the e¢ ciency of government or civil wars. Easterly and Levine (1997) �nd empirical
evidence to support their claim that the very high level of ethnic diversity of countries in Africa ex-
plains an important part of their poor economic performance. However their theoretical arguments,
as they recognize explicitly, are based on �polarized societies�4 not on highly fractionalized cases.
The e¤ect of ethnic polarization on growth follows a more indirect channel: the choice of poor public
policies which, in the end, negatively in�uences long-run growth. In particular ethnic polarization
transforms economic policy via a rent seeking mechanism. Additionally ethnic polarization generate
problems in the design of structural policies related to infrastructure and education. La Porta et
al. (1999) point out that ethnic diversity leads to corruption and low e¢ ciency governments that
expropriate the ethnic losers.
Several authors have interpreted the �nding of a negative relationship between ethnic diversity
and growth to be a consequence of the high probability of con�ict associated with a highly fraction-
alized society. For this reason many papers use the index of ethnolinguistic fractionalization (ELF)
as the indicator of ethnic heterogeneity. The raw data for this index come from the Atlas Narodov
Mira (1964) compiled in the former Soviet Union in 1960. The index ELF was originally calculated
by Taylor and Hudson (1972). In general any index of fractionalization can be written as
FRAC=1-NXi=1
�2i =NXi=1
�i(1� �i) (1)
where �i is the proportion of people that belong to the ethnic (religious) group i and N is the number
of groups. The index of ethnic fractionalization has a simple interpretation as the probability that
two randomly selected individuals from a given country will not belong to the same ethnic group.5
However many authors have found that, even though ethnic fractionalization seems to be a
powerful explanatory variable for economic growth, it is not signi�cant in the explanation of civil
4See pages 1205, 1232 or 1241.5Mauro (1995) uses this index as an instrument in his analysis of the e¤ect of corruption on investment.
3

wars and other kinds of con�icts. These results has led many authors to disregard ethnicity as a
source of con�ict and civil wars. Fearon and Laitin (2003) and Collier and Hoe er (2002) �nd that
neither ethnic fractionalization nor religious fractionalization have any statistically signi�cant e¤ect
on the probability of civil wars.
We argue that one possible reason for the lack of explanatory power of ethnic heterogeneity
on the probability of armed con�icts and civil wars is the measure for heterogeneity. In empirical
applications researchers should consider a measure of ethnic polarization, the concept used in most
of the theoretical arguments, instead of an index of ethnic fractionalization. We propose an index
of ethnic polarization with the form
Q = 1�NXi=1
�1=2� �i1=2
�2�i = 4
NXi=1
�2i (1� �i):
The original purpose of this index was to capture how far is the distribution of the ethnic groups
from the (1/2,0,0,...0,1/2) distribution (bipolar), which represents the highest level of polarization6 .
This type of reasoning is frequently present in the literature on con�ict7 and, in particular, on
ethnic con�ict. Esteban and Ray (1999) show, using a behavioral model and a quite general metric
of preferences, that a two-point symmetric distribution of population maximizes con�ict.
In addition Horowitz (1985) points out that ethnic con�icts will take place in countries where
a large ethnic minority faces an ethnic majority. Therefore ethnic dominance, or the existence of
a large ethnic group, although close to being a necessary condition for a high probability of ethnic
con�ict, is not su¢ cient. You also need that the minority is not divided into many di¤erent groups
but is also large. The Q index captures the idea of a large majority versus a large minority as the
worst possible situation since the index in this case is close to the maximum.
Collier and Hoe er (1998) note �coordination cost would be at their lowest when the population
is polarized between an ethnic group identi�ed with the government and a second, similarly sized
ethnic group, identi�ed with the rebels.�Collier (2001) also emphasizes that the relationship between
ethnic diversity and the risk of violent con�icts is not monotonic. Highly heterogeneous societies
have even a lower probability of civil wars than homogeneous societies. The highest risk is associated
with the middle range of ethnic diversity.8 The Q index satis�es this condition.
Notice also that Fearon (2003) points out that the index of fractionalization, being not sensitive
6See also Reynal-Querol (2002).7Montalvo and Reynal-Querol (2005) show how to obtain the Q index from a pure contest model.8Horowitz (1985) also argues that there is less violence in highly homogeneous and highly heterogeneous countries.
4
to discontinuities, cannot capture important di¤erences in ethnic structures. In particular the idea
of majority rule is not well re�ected by the index of fractionalization. By contrast the sensitivity of
the Q is the highest when groups are close to 50%.
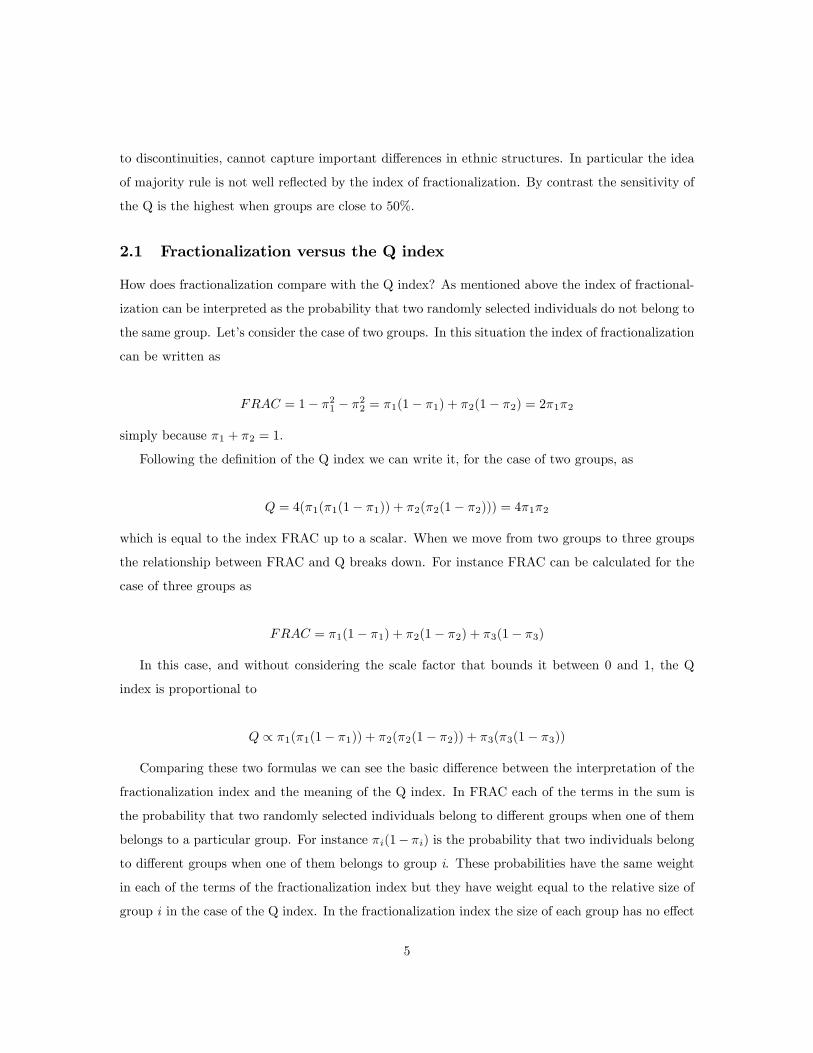
2.1 Fractionalization versus the Q index
How does fractionalization compare with the Q index? As mentioned above the index of fractional-
ization can be interpreted as the probability that two randomly selected individuals do not belong to
the same group. Let�s consider the case of two groups. In this situation the index of fractionalization
can be written as
FRAC = 1� �21 � �22 = �1(1� �1) + �2(1� �2) = 2�1�2
simply because �1 + �2 = 1:
Following the de�nition of the Q index we can write it, for the case of two groups, as
Q = 4(�1(�1(1� �1)) + �2(�2(1� �2))) = 4�1�2
which is equal to the index FRAC up to a scalar. When we move from two groups to three groups
the relationship between FRAC and Q breaks down. For instance FRAC can be calculated for the
case of three groups as
FRAC = �1(1� �1) + �2(1� �2) + �3(1� �3)
In this case, and without considering the scale factor that bounds it between 0 and 1, the Q
index is proportional to
Q / �1(�1(1� �1)) + �2(�2(1� �2)) + �3(�3(1� �3))
Comparing these two formulas we can see the basic di¤erence between the interpretation of the
fractionalization index and the meaning of the Q index. In FRAC each of the terms in the sum is
the probability that two randomly selected individuals belong to di¤erent groups when one of them
belongs to a particular group. For instance �i(1� �i) is the probability that two individuals belong
to di¤erent groups when one of them belongs to group i. These probabilities have the same weight
in each of the terms of the fractionalization index but they have weight equal to the relative size of
group i in the case of the Q index. In the fractionalization index the size of each group has no e¤ect
5

on the weight of the probabilities of two individuals belonging to di¤erent groups whereas in the Q
index these probabilities are weighted by the relative size of each group.
Looking at both indices one may wonder how much large and small groups contribute to the
value of the index with respect to their relative size. The di¤erent weighting scheme is crucial to
answer this question. Let�s de�ne ci as the proportional contribution of group i to the index of
fractionalization, that is ci = �i(1 � �i)=(P�i(1 � �i)): De�ne eci as the proportional contribution
of group i to the index of polarization, that is eci = �2i (1��i)=(P�2i (1��i)): If all the groups have
equal size the proportional contribution of each of the groups is equal to its relative size in both,
fractionalization and polarization, that is ci = eci = �i: Imagine now that we increase the size of onegroup by epsilon and decrease the size of another group by the same amount. Now the proportional
contribution of the largest group in the index of fractionalization is smaller than its relative size,
ci < �i; and the reverse happens for the smallest group. In the index of polarization the result is
the opposite: the proportional contribution of the largest group in the index of polarization is larger
than its relative size, eci > �i; and the reverse happens to the smallest group. Loosely speaking9 wecan say that large (small) groups contribute to the index of polarization proportionally more (less)
than their relative size. The opposite is true for the index of fractionalization: large (small) groups
contribute to the index less (more) than their relative size.
3 From income inequality to ethnic fractionalization
The index of fractionalization has, at least, two theoretical justi�cations based on completely di¤erent
contexts. In industrial organization the literature on the relationship between market structure and
pro�tability has used the Her�ndahl-Hirschman index to measure the level of market power in
oligopolistic markets.10 The derivation of the index in this context starts with a noncooperative
game where oligopolistic �rms play Cournot strategies. Therefore the index can summarize the
market power in games that work through the market.11
The second theoretical foundation for the index of fractionalization comes from the theory of
inequality measurement. One of the most popular measures of inequality is the Gini index, G, that
has the general form
9Montalvo and Reynal-Querol (2002) for a formal proof of this claim.10This index has been also used in antitrust cases.11However the index of fractionalization may not be appropriate when the structure of power works through political
or military processes as they appear to follow rent-seeking or con�ict models.
6

G=NXi=1
NXj=1
�i�j jyi � yj j
where yi represent the income level of groups i and �i is its proportion with respect to the total
population. This formulation is specially suited to measure income and wealth inequality. However,
if we want to measure ethnic diversity the "distance" between ethnic groups may be a very di¢ cult
concept to measure. In addition the dynamics of the "we" versus "you" distinction is more powerful
than the antagonism generated by the "distance" between them. For these reason we may want to
consider only if an individual belongs or does not belong to an ethnic group. If we substitute the
Euclidean income distance �(yi; yj) = jyi � yj j, by a discrete metric (belong/do not belong)
�(yi; yj) = 0 if i = j
= 1 if i 6= j
Therefore the discrete Gini (DG) index can be written as
DG =NXi=1
Xj 6=i
�i�j :
It is easy to show that the discrete Gini index (DG) calculated using a discrete metric is simply
the index of fractionalization
DG =NXi=1
Xj 6=i
�i�j =NXi=1
�iXj 6=i
�j =NXi=1
�i(1� �i) = (1�NXi=1
�2i ) = FRAC:
3.1 From income polarization to discrete polarization and the Q index
We showed in the previous section that the index of fractionalization can be interpreted as a Gini
index with a discrete metric (belong/do not belong to the group) instead of an Euclidean income
distance. The Q index can be interpreted as the polarization measure of Esteban and Ray (1994)
with a discrete metric. By imposing three reasonable axioms Esteban and Ray (1994) narrow down
the class of allowable polarization measures to only one measure, P , with the following form
P= kNXi=1
NXj=1
�1+�i �j jyi � yj j
7

for some constants k > 0 and � 2 (0; ��] where �� ' 1:6. Notice that when � = 012 and k = 1 this
polarization measure is precisely the Gini coe¢ cient. Therefore the fact that the share of each group
is raised to the 1+� power, which exceeds one, is what makes the polarization measure signi�cantly
di¤erent from inequality measures. The parameter � can be treated as the degree of �polarization
sensitivity.�If we substitute the Euclidean income distance �(yi; yj) = jyi� yj j, by a discrete metric
(belong/do not belong), then we have what we call discrete polarization
DP (�; k) = kNXi=1
Xj 6=i
�1+�i �j
The discrete nature (belong/do not belong) of the distance across groups has important impli-
cations for the properties of the index. In particular, and in contrast with the polarization index
of Esteban and Ray (1994), there is only one level of polarization sensitivity (� = 1) for which the
discrete polarization measure satis�es the properties of polarization. In addition there is only one
value of k (k = 4) such that the index DP ranges between 0 and 1. The Q index is precisely the
index DP (1; 4)13 .
The index of polarization of Esteban and Ray (1994) was initially thought as a measure of
income or wealth polarization. As such it is di¢ cult to implement empirically since its value depends
critically on the number of groups, the value of k and the value of �14 . However in terms of income
or wealth it is not clear which levels distinguish di¤erent groups with a common identity. Where
does the middle class start? How �rich� is rich? This di¢ culty together with the uncertainty over
the right parameter for � has reduced the empirical applicability of the polarization index. In the
case of ethnic diversity the identity of the groups is less controversial. Additionally the discrete
nature of the distance (belong/do not belong) �xes the values of � and k: This makes the Q index
easily applicable to data on ethnic and religious diversity.
12Strictly speaking for � = 0 this is not an index of polarization.13For proofs of these claims and all the technical details on the relationship between fractionalization, polarization
and the Q index see Montalvo and Reynal-Querol (2002).14See Duclos et al. (2004) for a recent reconsideration of the empirical measurement of polarization with Euclidean
distances.
8
4 The empirical relationship between fractionalization and
polarization
In this section we compare the empirical content of measures of fractionalization and indicators
of polarization. Keefer and Knack (2002) argue that their income based measures of polarization
are similar to the Gini coe¢ cient suggesting that in practice the divergence between income-based
polarization and inequality is more theoretical than actual. However the di¤erence between ethnic
polarization and fractionalization is both theoretical and actual. Theoretically, as we showed in
sections 2, discrete polarization and fractionalization represent quite di¤erent concepts. In this
section we describe the alternative data sources for ethnic and religious heterogeneity and we show
that the index of fractionalization and polarization are very di¤erent independent of the source of
data used in their calculation.
4.1 Sources of data on ethnic heterogeneity
There are basically three sources of ethnolinguistic diversity across countries: the World Chris-
tian Encyclopedia (WCE), the Encyclopedia Britannica (EB) and the Atlas Narodov
Mira (ANM) (1964). For reasons that we have explained elsewhere15 we think the most accurate
description of ethnic diversity is the one in the WCE, which contains details for each country on the
most diverse classi�cation level, which may coincide with an ethnolinguistic family or subfamilies,
subpeoples, etc. We follow Vanhanen (1999) in taking into account only the most important ethnic
divisions and not all the possible ethnic di¤erences or groups. Vanhanen (1999) uses a measure of
genetic distance to separate di¤erent degrees of ethnic cleavage. The proxy for genetic distance is
�the period of time that two or more compared groups have been separated from each other, in the
sense that intergroup marriage has been very rare. The longer the period of endogamous separation
the more groups have had time to di¤erentiate.� This criterion is reasonable since we are using
discrete distances and, therefore, we have to determine the identity of the relevant groups.
Another source of data on ethnic diversity is the Encyclopedia Britannica (EB)16 which uses
the concept of geographical race. A third source of data on ethnolinguistic diversity is provided
by the Atlas Narodov Mira (ANM) (1964), the result of a large project of the Department of
Geodesy and Cartography of the State Geological Committee of the old USSR.
15For a detailed discussion of the di¤erences between these data sources see Montalvo and Reynal-Querol (2000).16This is the basic source of data on ethnic heterogeneity of Alesina et al. (2003).
9

There are also several possible sources of data on religious diversity. Barret�s (1982) World
Christian Encyclopedia (WCE) provides information on the size of religious groups for a large
cross-section of countries. The WCE has several well-known shortcomings when dealing with data
on religion.17 L�Etat des Religions Dans le Monde (ET), which is based on a combination
of national data sources and the WCE, provides information on the proportions of followers of
Animist and Syncretic cults, which we believe is important for the calculation of indices of religious
heterogeneity. For this reason we use the ET as our primary source for the religious data.18 Alesina
et al. (2003) use the data on religious diversity compiled by the Encyclopedia Britannica (EB).19
4.2 Are empirical polarization and fractionalization very di¤erent?
Once we have described the di¤erent sources of data available to measure ethnic and religious
heterogeneity we need to show the empirical relationship between both indices. Figure 1 presents
the relationship between ethnolinguistic polarization and fractionalization using our data sources. It
shows that for low levels of fractionalization the correlation between ethnic fractionalization20 and
polarization is positive and high. In particular, from our previous discussion in section 2.1 we know
that when there are only two ethnic groups ethnic polarization is two times ethnic fractionalization.
That is the reason why the slope of the line is 1/2 for ethnic polarization up to 0.421 . However for
the medium range the correlation is zero and for high levels of fractionalization the correlation with
polarization is negative.
Figure 2 presents the scatterplot of religious fractionalization versus religious polarization. It
shows a similar pattern: for low levels of religious fractionalization the correlation with polarization
is positive. However for intermediate and high levels of religious fractionalization the correlation
is zero. Therefore the correlation is low when there is a high degree of heterogeneity, which is the
interesting case.
Figures 3 and 4 con�rm that the previous results do not depend on the source of data used
in the construction of the indices. Figure 3 shows the relationship between the index of ethnic
17See L�Etat des Religions dans le Monde (1987) pages 7-9.18Our secondary source is The Statesman�s Yearbook (ST) which is only based on national sources.19The correlation of the indices constructed with the di¤erent sources of religious diversity is very high, as it was
in the case of ethnic heterogeneity.20The index of ethnic fractionalization calculated with our data has a correlation of 0.86 with the index obtained
using the Atlas Nadorov Mira (ELF). The correlation with the index of Alesina et al. (2003) is 0.83.21Nevertheless we should notice that only in 3,6% of the countries the number of groups is equal to two.
10

Figure 1: Ethnic fractionalization versus polarization. Source: WCE.
fractionalization and ethnic polarization constructed using the data of Alesina et al. (2003). The
shape in �gure 3 is very similar to the one in �gure 1. Figure 4 shows ethnic fractionalization and
polarization calculated using the data from the Atlas Nadorov Mira, the third basic source of data
on ethnic diversity. The graph is very similar to �gures 1 and 3.
A previous version of this paper22 shows that nine out of the ten most ethnically polarized
countries have su¤ered a civil war during the sample period (1960-95). In the case of ethnic frac-
tionalization only four out of the ten most fractionalized countries have su¤ered a civil war. It is
interesting to describe the situation of a countries that have a high degree of polarization but a low
degree of fractionalization (close or below the average). Guatemala is a good example of this situa-
tion. The ethnic composition of the population is 55% Ladino (Mestizo), 42% Maya (Amerindian)
and 3% other small groups. This implies a very high degree of polarization (0.96), and a low level
of fractionalization (0.52).
During the same sample period civil wars occurred in 7 out of 10 countries with the highest
level of religious polarization. However only three out of the ten countries with the highest level
22Montalvo and Reynal-Querol (2004).
11

Figure 2: Religious fractionalization versus polarization. Source: ET.
12

Figure 3: Ethnic fractionalization versus polarization. Source: Atlas Nadorov Mira.
13

Figure 4: Ethnic fractionalization versus polarization. Source: Alesina et al. (2003).
14

of religious fractionalization su¤ered a civil war. For instance in Nigeria there is a high level of
religious polarization between Christians (49%) and Muslims (45%) similar to the case of Bosnia
(50% Christians and 40% Muslims). In both cases the degree of religious fractionalization is low.
5 Regression results
Several authors have stressed the importance of ethnic heterogeneity in many economic phenomena
(growth, investment, etc.). One basic element that explains the relationship between heterogeneity
and development is the existence of potential ethnic con�ict that, through social and political chan-
nels spreads to the economy. There is no doubt that civil wars are traumatic events that damage
economic development. We argued earlier that the index of polarization is a good indicator to cap-
ture the extent of social con�icts. But then, is it polarization or fractionalization that matters in
the explanation of con�icts in heterogeneous societies?
In this section we present the estimation of a logit model for the incidence of civil wars as a func-
tion of polarization and fractionalization measures of ethnic and religious heterogeneity. The sample
includes 138 countries during 1960-99. We divide the sample into �ve-year periods. The endogenous
variable is the incidence of a civil war. We use the Peace Research Institute of Oslo (PRIO) dataset
for civil wars. Our basic endogenous variable corresponds to the de�nition of intermediate and high
intensity civil wars of PRIO, which we call PRIOCW. PRIO de�nes an intermediate and high in-
tensity armed con�ict23 as a contested incompatibility that concerns government and/or territory
where the use of armed force between two parties, of which at least one is the government of a state,
results in at least 25 yearly battle-related deaths and a minimum of 1,000 during the course of the
civil war. We focus only on civil wars, categories 3 and 4 of con�ict of PRIO, which cover civil
con�icts with and without interference from other countries.
The explanatory variables follow the basic speci�cations of Fearon and Laitin (2003), Doyle and
Sambanis (2000) and Collier and Hoe er (2002). Fearon and Laitin (2003) argue that income per
capita is a proxy for �state�s overall �nancial, administrative, police and military capabilities.�Once
a government is weak rebels can expect a higher probability of success. In addition a low level of
income per capita reduces the opportunity cost of engaging in a civil war. Recently Miguel et al.
(2004) have argued that the measurement of the impact of GDP growth on civil wars is complicated
since there are endogeneity issues. Their set-up is very di¤erent from ours. They use annual data
23See the Appendix I for more details on this de�nition.
15
and GDP growth. In this situation the potential endogeneity problem of GDP growth with respect
to con�ict is very high. For this reason Miguel et al. (2004) use rainfall as an instrument for GDP
growth. We use periods of �ve years for civil wars and the GDP per capita at the beginning of each
period. This set up reduces also the potential endogeneity problem.
The size of the population is another usual suspect in the explanation of civil wars. First, the
usual de�nitions of civil war set always a threshold in the number of deaths, which suggests that one
should control by population as a scale factor. Second, Collier and Hoe er (2002) consider that the
size of the population is an additional proxy for the bene�ts of a rebellion since it measures potential
labor income taxation. Finally Fearon and Laitin (2003) indicate that a large population implies
di¢ culties in controlling what goes on at the local level and increases the number of potential rebels
that can be recruited by the insurgents.
Mountains are another dimension of opportunity since this terrain could provide a safe haven for
rebels. Long distances from the center of the state�s power also favors the incidence of civil wars,
specially if there is a natural frontier between them, like a sea or other countries. Collier and Hoe er
(2002) point out that the existence of natural resources provide an opportunity for rebellion since
these resources can be used to �nance the war and increases the payo¤ if victory is achieved. Finally
most of the literature considers the e¤ect of democracy.
Therefore the explanatory variables for the core speci�cation of the incidence of civil wars include
the log of real GDP per capita in the initial year (LGDPC), the log of the population at the beginning
of the period (LPOP), primary exports (PRMEXP), mountains (MOUNTAINS), noncontiguous
states (NONCONT), and the level of democracy (DEMOCRACY). Using this core speci�cation
we check the empirical performance of indices of fractionalization and polarization as well as other
measures of ethnic and religious heterogeneity.
5.1 Ethnic heterogeneity and the incidence of civil wars
Table 1 reports the results obtained using alternatively measures of fractionalization and polariza-
tion24 . The �rst column shows that the index of ethnolinguistic fractionalization (ETHFRAC) has
no statistically signi�cant e¤ect on the incidence of civil wars. This result is consistent with Fearon
and Laitin (2003) and Collier and Hoe er (1998). However if we substitute the index of ethnic
fractionalization by the Q index of ethnic polarization, ETHPOL, we �nd (column 2) a positive
and statistically signi�cant e¤ect on the incidence of civil wars. The initial GDP per capita has a
24All the tables show the z statistic tests calculated using the standard errors adjusted for clustering.
16

negative e¤ect25 in the incidence of civil wars while the log of population has a positive e¤ect.26 We
�nd no signi�cant e¤ect of mountains, noncontinguous states or primary exports on the incidence of
civil wars. Finally the level of democracy has a positive but not statistically signi�cant coe¢ cient.
Column 3 checks the relative strength of the index of ethnic polarization versus fractionalization and
shows that the coe¢ cient on ethnic fractionalization is not signi�cantly di¤erent from zero while the
one on polarization is positive and signi�cant.
[Insert Table 1 about here]
The e¤ect of ethnic polarization is not only statistically signi�cant but also economically impor-
tant. Using the results in column 3, if the level of polarization increases from the average (0.51)
to the level of Guinea (0.84) then the probability of con�ict almost doubles. An increase in one
standard deviation (0.24) of the average polarization increases the probability of con�ict by 67%.
Another potential dimension of social heterogeneity that can generate con�ictive situations is
religion. Column 4 shows that religious fractionalization (RELFRAC) is not statistically signi�cant.
Neither is the coe¢ cient of religious polarization (RELPOL) in column 5. Column 6 shows the basic
logit regressions using both religious fractionalization and religious polarization. The coe¢ cient of
the index of religious fractionalization (RELFRAC) is marginally insigni�cant while the index of
religious polarization (RELPOL) is statistically signi�cant. When both indicators are included in
the same speci�cation, religious polarization has the expected positive sign but fractionalization has
a negative impact on the probability of civil wars. This means that, conditional on a given degree
of polarization, more religious diversity decreases the probability of a civil war. We argued before
that a high number of di¤erent groups increases the coordination problems and, therefore, given a
level of polarization, the probability of civil wars may be smaller. For instance Korea and Sri Lanka
have the same level of religious polarization (0.72). However Sri Lanka, which su¤ered a civil war,
has a degree of religious fractionalization of 0.49 while Korea, with a much higher level (0.79), did
not experience a civil war.
In column 7 we include together the index of ethnic polarization and religious polarization. Only
the estimated coe¢ cient of the �rst one is statistically signi�cant. If we add also as explanatory
variables the degree of ethnic fractionalization and religious fractionalization (column 8) only the
25Depending on the particular speci�cation this e¤ect could be statistically signi�cant or not. In the next section
we show that the coe¢ cient of the initial GDP per capita is very signi�cant and robust when we use other datasets
on civil wars di¤erent from PRIOCW.26The same results are reported by Doyle and Sambanis (2000), Fearon and Laitin (2003) and Collier and Hoe er
(1998, 2002).
17

coe¢ cient of ethnic polarization is signi�cantly di¤erent from 0. It seems clear that ethnic polar-
ization has a robust and powerful explanatory power on civil wars in the presence of other indices
of fractionalization and polarization while the statistical relevance of religious polarization depends
on the particular speci�cation27 . Therefore in the rest of the paper we check the robustness of the
results of table 1 using only ethnic polarization.
5.2 Robustness to alternative measures of heterogeneity
Table 2 reports the performance of the Q index in the presence of other indicators of ethnolinguistic
heterogeneity. Columns 1 displays, to simplify the comparisons, the results of table 1 for the core
speci�cation. Besides the indices of fractionalization and polarization the literature has proposed
some other indicators of potential ethnic con�ict. Collier (2001) notices that ethnic diversity could
be not only an impediment for coordination but also an incitement to victimization. Dominance, or
one ethnic group in a majority, can produce victimization and, therefore, increase the risk of a civil
war. Therefore the e¤ect of ethnic diversity will be conditional on being measured as dominance
or fractionalization. In principle fractionalization should make coordination more di¢ cult and,
therefore, civil wars will be less probable since it will be di¢ cult to maintain cohesion among rebels.
Collier (2001) argues that the problem with the results in Easterly and Levine (1997) is that they are
unable to distinguish between fractionalization and dominance. The empirical results reported by
Collier (2001) seems to indicate that a good operational de�nition of dominance implies a group that
represents between 45% and 90% of the population28 . However Collier and Hoe er (2002) �nd that
dominance, de�ned as mentioned above, has only a weak positive e¤ect on the incidence of civil wars.
In column 2 of table 2 we show that ethnic dominance (ETHDOM) does not have any signi�cant
e¤ect in our core speci�cation. When ethnic dominance is included with the Q index, column 3,
its coe¢ cient is not signi�cant while ethnic polarization continues being a signi�cant explanatory
variable on the probability of civil wars. Caselli and Coleman (2002) propose another indicator
which is the product of the largest ethnic group (ETHLRG) by primary exports (PRIMEXP). In
column 4 we can see that this variable has a coe¢ cient that is not signi�cantly di¤erent from 0.
27For a more detailed account of the performance of religious polarization in the context of many di¤erent speci�-
cations see Montalvo and Reynal-Querol (2000).28Collier (2001) justi�es his choice by arguing that "the level of signi�cance and the size of the coe¢ cient of
dominance reach a maximum when dominance is de�ned on the range of 45%-90% of the population". Since we
want to check the robustness of our index Q to alternative measures we have chosen the "statistically most powerful"
empirical de�nition for dominance.
18

In column 5 we show that the index of polarization is signi�cant even when the product of the
largest ethnic group by primary exports is included as an explanatory variable. Finally we could
also include the size of the largest minority (LARGMINOR) as another way to proxy polarization.
Column 6 shows that the coe¢ cient on this new variable is not statistically signi�cant while ethnic
polarization continues to be signi�cant even in the presence of this new variable (column 7).
[Insert table 2 about here]
6 Some additional test of robustness
The previous section has shown that the relevance of ethnic polarization in the explanation of
civil wars is robust to the presence of other indicators of ethnic heterogeneity like fractionalization,
dominance or the product of the size of the largest group by the proportion of primary exports. In
this section we explore the robustness of previous results. In particular, we discuss: (a) di¤erent
de�nitions of civil wars; (b) the inclusion of regional dummies or the elimination of particular regions;
(c) the use of di¤erent data sources to construct the indices; (d) cross-section regressions covering
the whole period.
6.1 The operational de�nition of civil war
In this section we check the robustness of the results to the use of an alternative de�nition of civil war.
Up to this point we have worked with the de�nition proposed by PRIO for intermediate and high
intensity armed con�icts29 , which we name PRIOCW. PRIO o¤ers also series to construct armed
con�icts that generate more than 25 deaths per year, PRIO25, and very intense armed con�icts
(more than 1,000 deaths yearly), PRIO1000. Another source of data is Doyle and Sambanis (2000)
(DSCW), who de�ne civil war as an armed con�ict with the following characteristics: �(a) it caused
more than 1,000 deaths; (b) it challenged the sovereignty of an internationally recognized state; (c)
it occurred within the recognized boundary of that state; (d) is involves the state as a principal
combatant; (e) it included rebels with the ability to mount organized armed opposition to the state;
and (f) the parties were concerned with the prospects of living together in the same political unit
after the end of the war.�30
Finally Fearon and Laitin (2003) use a di¤erent operational de�nition of civil war (FLCW). For
29Those causing more than 25 yearly deaths and a minimum of 1,000 deaths over the course of the war.30This de�nition is practically identical to Singer and Small (1994) in their Correlates of Wars project (COW).
19

these authors a violent con�ict should meet the following criteria to be coded as a civil war: (1)
it should involve the ��ghting between agents of (or claimants to) a state and organized, non-state
groups who sought either to take control of a government, take power in a region, or use violence to
change government policies, (2) the con�ict killed or has killed at least 1,000 over its course, with a
yearly average of at least 100 deaths, (3) at least 100 were killed on both sides (including civilians
attacked by rebels).�
[Insert table 3 about here]
Table 3 shows the proportion of armed con�icts over total observations using di¤erent de�nitions
of armed con�ict and di¤erent periodicity. The closest de�nitions are the PRIOCW and Doyle and
Sambanis (DSCW). For annual data the proportion of armed con�icts ranges from 5.9% (PRIO1000)
to 15.2% (PRIO25). For �ve years periods the proportions are between 10.1% and 22.2%. Finally
if we consider the whole period the proportions range from 29.2% up to 53.6%.
[Insert table 4 about here]
Table 4 shows the results of the basic speci�cation using the di¤erent de�nitions of armed con-
�icts. Columns 1 shows that ethnic polarization is statistically signi�cant when we use as dependent
variable the de�nition of civil wars of Doyle and Sambanis (2000). In fact we can see that the size
of the coe¢ cient on ethnic polarization is very similar to the one obtained using the intermediate
and high de�nition of armed con�ict of PRIO (PRIOCW). We already argued that in practice the
data of Doyle and Sambanis (2000) and the PRIOCW are very similar. Column 2 shows that ethnic
polarization is marginally statistically signi�cant if we use the de�nition of civil war of Fearon and
Laitin (2003). Columns 3 and 4 show that the statistical signi�cance of the coe¢ cient on ethnic
polarization is robust to the use of the other two de�nitions of PRIO. In fact it is interesting to
notice that the coe¢ cient that measures the e¤ect of ethnic polarization on the probability of civil
wars increases monotonically with the intensity of the con�ict (2.05 including minor con�icts; 2.28
for intermediate and high intensity con�icts, and 2.33 for the most violent con�icts). Another inter-
esting fact in columns 1 to 4 of table 4 is the robustness of the coe¢ cient of initial GDP per capita.
It seems that the relative weakness of the coe¢ cient of this variable in tables 1 and 2 is due to the
de�nition of civil war used (intermediate and high intensity types following PRIO).
Finally we should notice that using the data of Doyle and Sambanis (2000) and Fearon and Laitin
(2003) the importance of initial level of democracy is much larger than using the dataset of PRIO.
Since using the PRIO dataset democracy is very far from being statistically signi�cant and it reduces
the sample size we also consider the e¤ect of excluding this variable from the speci�cation. Column
20
5 shows that the results of table 1 are robust to the exclusion of the DEMOCRACY variable, but the
sample size increases signi�cantly due to the large number of missing data in that variable. Columns
6 to 9 show that the statistical signi�cance of ethnic polarization in the explanation of civil wars is
robust to the use of alternative datasets for the endogenous variable even if we do not consider the
DEMOCRACY variable in the speci�cation.
6.2 Robustness to regional e¤ects
Are the results robust to including dummy variables for the di¤erent regions of the world? Are
they robust to the elimination of regions that are considered specially con�ictive? We investigate
this questions in table 5. Columns 1 and 2 show that ethnic polarization is statistically signi�cant
in the presence of regional dummies31 , with and without the inclusion of ethnic fractionalization,
which is not signi�cant. The elimination from the sample of the countries in Sub-Saharan Africa,
column 3, does not a¤ect the statistical signi�cance of ethnic polarization. If we eliminate those
African countries and include in the regression the index of ethnic fractionalization, column 4, then
the coe¢ cient on ethnic polarization is not signi�cant. However, as we argued before, since ethnic
fractionalization is not statistically signi�cant it seems clear that its presence increases the standard
error of the ethnic polarization estimated coe¢ cient. Columns 5 and 6 show the robustness of ethnic
polarization to eliminating from the sample the Latin American countries. Finally, columns 7 and
8 con�rm that the e¤ect of ethnic polarization on civil wars is robust to the elimination from the
sample of the Asian countries.
[Insert table 5 about here]
6.3 The e¤ect of alternative data sources for ethnic heterogeneity
One may wonder if part of the results in the previous sections are driven by the data used in
the construction of the indices of polarization and fractionalization. We pointed out that there
are three basic sources of data on ethnic heterogeneity: the World Christian Encyclopedia (base
of our data), the Encyclopedia Britannica (source of the indices of Alesina et al. 2003) and the
Atlas Nadorov Mira (ANM) (source of the well-known ELF). We argued before that the correlation
between our indicators and the ones calculated using other sources of data is quite high. The
Q index of polarization calculated using the row data of Alesina et al. (2003)32 has a positive
31The dummies are for Sub-Saharan Africa, Latin America and Asia.32We thank Sergio Kurlat and Bill Easterly for sharing with us the row data of Alesina et al. (2003).
21

(1.93) and statistically signi�cant e¤ect (z=2.32) on the incidence of civil wars (PRIOCW), opposite
to what happens with the coe¢ cient of the index of fractionalization calculated using the same
source (estimated coe¢ cient=1.27 and z=1.67). When we run the regression with the Q index of
polarization calculated using the row data of the Atlas Nadorov Mira, we �nd out that it has a
positive e¤ect (estimated coe¢ cient=2.35 and z=3.33) on the probability of civil wars, while the
index of fractionalization calculated with the same dataset is not statistically signi�cant (estimated
coe¢ cient=1.20 and z=1.41).
The results using other de�nitions of civil wars are equally supportive of the robustness of the
results. For instance for intense civil wars (PRIO1000 de�nition) the coe¢ cient on ethnic polarization
calculated using the data of Alesina et al. (2003) is 1.95 (z=2.22). If ethnic polarization is calculated
using the ANM then its estimated coe¢ cient on the incidence of intense civil wars is 1.98 (z=2.63).
In both cases ethnic fractionalization is not statistically signi�cant.
6.4 Cross-section regressions
In the empirical section we have been working with a panel of countries divided in �ve-year periods.
However it seems reasonable to perform a �nal robustness check running the logit regressions in a
cross section. The dependent variable takes now value 1 if a country has su¤ered a civil war during
the whole sample period (1960-1999) and zero otherwise. GDP per capita, population, democracy
and primary exports are measured at the beginning of the period (1960). Table 6 shows that the
index of ethnolinguistic polarization is signi�cantly di¤erent from zero with (column 1) or without
including the regional dummy variables (column 2)33 . The result is robust to the use of di¤erent
dataset for civil wars like Doyle and Sambanis (2000), columns 3 and 4, or Fearon and Laitin (2003),
columns 5 and 6.
[Insert table 6 about here]
7 Conclusions
Several recent papers have documented the negative e¤ect of ethnic fractionalization on economic
development. Some authors have argued that a high degree of ethnic fractionalization increases
potential con�ict, which has negative e¤ects on investment and increases rent seeking activities.
33 If instead of ethnic polarization we include ethnic fractionalization the estimated coe¢ cient is 1.50 with a z-statistic
of 1.57.
22

However, many of the theoretical arguments supporting the e¤ect of ethnic heterogeneity on potential
con�ict were developed in the context of polarized societies. In addition researchers use frequently
the index of fractionalization to capture the concept of polarization. We argue that the measure
of ethnic heterogeneity appropriate to capture potential con�ict should be a polarization measure.
In fact Horowitz (1985), in his seminal book on ethnic groups in con�ict, points out that the most
severe con�icts arise in societies where a large ethnic minority faces an ethnic majority. The index
of ethnic fractionalization is not able to capture this idea appropriately.
We de�ne an index of polarization based on a discrete metric that we call discrete polarization.
It turns out that our index is related with the original index of income polarization of Esteban
and Ray (1994). We describe a particular case of discrete polarization, the Q index, that satis�es
the basic properties associated with the concept of polarization. Keefer and Knack (2002) argue
that their income-based measures of polarization are very similar to the Gini coe¢ cient suggesting
that in practice the divergence between income-based polarization and inequality is more theoretical
than actual. In this paper we have shown that the di¤erence between ethnic polarization and
fractionalization is both theoretical and actual.
In the empirical section we show that the index of ethic fractionalization does not have a signi�-
cant e¤ect on the likelihood of con�icts. Therefore it is unlikely that ethnic fractionalization a¤ects
economic development through an increase in the probability of con�icts. This �nding, however,
does not mean that ethnic diversity has no role in the explanation of civil wars. In fact ethnic
polarization is a signi�cant explanatory variable for the incidence of civil wars if we use the Q index
of polarization. This result is robust to the use of other proxies for ethnic heterogeneity, alterna-
tive sources of data, regional dummies and the use of a single cross section of data. Therefore it
seems that the weak explanatory power of ethnic heterogeneity on the incidence of civil wars found
by several recent studies is due to the use of an index of fractionalization instead of an index of
polarization. In addition Montalvo and Reynal-Querol (2005) con�rm that ethnolinguistic fraction-
alization has a direct negative e¤ect on growth, probably due to its impact on the transmission of
ideas. However they also �nd that an increase in ethnic polarization has an indirect negative e¤ect
on growth because it increases the incidence of civil wars and public consumption and reduces the
rate of investment.
23

Appendix I: De�nition of the variables
PRIOCW: Intermediate and war de�nition of armed con�ict from PRIO. This is a contested
incompatibility that concerns government and/or territory where the use of armed force between
two parties, of which at least one is the government of a state, results in at least 25 battle-related
deaths yearly and a minimum of 1,000 deaths over the course of the civil war. We only consider
types 3 and 4 (internal armed con�icts).
PRIO1000: PRIO de�nition including armed con�icts that generate more than 1,000 deaths
yearly (war de�nition following PRIO classi�cation). We only consider types 3 and 4 (internal armed
con�icts).
PRIO25: PRIO de�nition including armed con�icts that generate more than 25 deaths yearly
(minor armed con�icts plus intermediate plus war following PRIO classi�cation). We only consider
types 3 and 4 (internal armed con�icts).
DSCW: Civil wars using the dataset of Doyle and Sambanis (2000). Their de�nition considers
a con�ict as a civil war if
a) it caused more than 1,000 deaths,
b) it challenged the sovereignty of an internationally recognized state,
c) it occurred within the recognized boundary of that state,
d) is involves the state as a principal combatant
e) it included rebels with the ability to mount organized armed opposition to the state
f) the parties were concerned with the prospects of living together in the same political unit after
the end of the war.
This de�nition is nearly identical to the de�nition of Singer and Small (1994).
FLCW: The de�nition of civil war of Fearon and Laitin (2003) is a con�ict that
a) involves �ghting between agents of (or claimants to) a state and organized, nonstate groups
who sought either to take control of a government , to take power in a region , or to use violence to
change government policies,
b) the con�ict killed at least 1000 over its course, with a yearly average of at least 100,
c) at least 100 were killed on both sides (including civilians attacked by rebels). The last condition
is intended to rule out massacres where there is no organization or e¤ective opposition.
LGDPC: Log of real GDP per capita of the initial period (1985 international prices) from
the Penn World Tables 5.6. Updated with the data of the Global Development Network Growth
Database (World Bank).
24
LNPOP: Log of the population al the beginning of the period from the Penn World Tables.5.6.
Updated with the data of the Global Development Network Growth Database (World Bank).
PRIMEXP: Proportion of primary commodity exports of GDP. Primary commodity exports.
Source: Collier and Hoe er (2001).
MOUNTAINS: Percent Mountainous Terrain: This variable is based on work by geographer
A.J Gerard for the World Bank�s �Economics of Civil war, Crime, and Violence�project.
NONCONT: Noncontiguous state: Countries with territory holding at least 10,000 people and
separated from the land area containing the capital city either by land or by 100 kilometers of water
were coded as �noncontiguous.�Source: Fearon and Laitin (2003)
DEMOCRACY: Democracy score: general openness of the political institutions (0=low; 10=high).
Source: Polity IV dataset. We transform the score in a dummy variable that takes value 1 if the
score is higher or equal to 4. This variable is very correlated with the variable Freedom of the
Freedom House.
ETHFRAC: index of ethnolinguistic fractionalization calculated using the data of the World
Christian Encyclopedia.
ETHPOL: index of ethnolinguistic polarization calculated using the data of the World Christian
Encyclopedia.
ETHDOM: index of ethnic dominance. It takes value 1 if one ethnolinguistic group represents
between 45% and 90% of the population. Source: WCE.
ETHLRG: proportion of the largest ethnic group. Source: WCE.
RELFRAC: index of religious fractionalization. Source: L�Etat des Religions dans le Monde
and The Statesmen Yearbook.
RELPOL: index of religious polarization. Source: L�Etat des Religions dans le Monde and The
Statesmen Yearbook.
25

References
[1] Alesina, A., Devleeschauwer, A., Easterly, W., Kurlat, S. and R. Wacziarg (2003) �Fractional-
ization.�Journal of Economic Growth, 8, 155-194.
[2] Atlas Narodov Mira (Atlas of the People of the World). Moscow: Glavnoe Upravlenie Geodezii
i Kartogra�i, 1964.Bruck, S.I., and V.S. Apenchenko (eds.).
[3] Barret, D. ed. (1982) World Christian Encyclopedia. Oxford University Press.
[4] Caselli and Coleman (2002) �On the theory of ethnic Con�ict.�mimeo.
[5] Collier, Paul (2001) �Implications of Ethnic Diversity.�Economic Policy (April ) .
[6] Collier, P., and A. Hoe er (2002) �Greed and Grievances in Civil Wars.�Center for the Study
of African Economies, WP2002-01.
[7] ______ and ______ (1998) �On Economic Causes of Civil Wars.� Oxford Economic
Papers 50: 563-73.
[8] Doyle, M. W., and N. Sambanis (2000) �International Peacebuilding: A Theoretical and Quan-
titative Analysis.�American Political Science Review 94:4 (December).
[9] Duclos, J., Esteban, J. and D. Ray (2004), �Polarization: concept, measurement and estima-
tion.�forthcoming in Econometrica.
[10] Easterly, W., and Levine (1997) �Africa�s growth tragedy: Policies and Ethnic divisions.�Quar-
terly Journal of Economics.
[11] Encyclopedia Britannica (2000). Chicago: Encyclopedia Britannica.
[12] Esteban, J., and Ray (1994) �On the measurement of polarization.�Econometrica 62(4): 819-
851.
[13] ________ and _______ (1999) �Con�ict and Distribution.�Journal of Economic The-
ory 87: 379-415.
[14] Fearon, J. (2003), "Ethnic and cultural diversity by country," Journal of Economic Growth, 8,
195-222.
26

[15] Fearon, J. and Laitin, D. (2003). �Ethnicity, Insurgency, and Civil War,�American Political
Science Review 97 (February )
[16] Grossman, H. (2001), �The Creation of E¤ective Property Rights,�American Economic Review,
91, 2, 347-352.
[17] Horowitz, D. (1985). Ethnic Groups in Con�ict. Berkeley: University of California Press.
[18] Keefer, P. and S. Knack (2002) �Polarization, politics and property rights: links between in-
equality and growth.�Public Choice 11: 127-154.
[19] La Porta, R., Lopez de Silanes, F., Shleifer and R. Vishny (1999) �The Quality of Government.�
Journal of Law, Economics and Organization 15(1): 222-279.
[20] L�État des Religions. Éditions La Découverte et Éditions du Cerf , Paris, 1987.
[21] Mauro, P. (1995), "Corruption and Growth," Quarterly Journal of Economics, CX, 681-712.
[22] Miguel, E., Satyanath, S. and E. Sergenti (2004), �Economic Shocks and Civil Con�icts: an
Instrumental Variables Approach,�forthcoming in the Journal of Political Economy.
[23] Montalvo, J. G. and Reynal-Querol, M. (2000), �The E¤ect of Ethnic and Religious Con�ict
on Growth.�http://www.wc�a.harvard.edu/programs/prpes.
[24] ____________and____________(2002), �Why Ethnic Fractionalization? Polar-
ization, Ethnic Con�ict and Growth�UPF Working Paper 660.
[25] ____________and____________(2005), "Ethnic Diversity and Economic Devel-
opment," Journal of Development Economics, 76, 293-323.
[26] Reynal-Querol, M. (2002), "Ethnicity, Political Systems and Civil War," Journal of Con�ict
Resolution, 46 (1), 29-55.
[27] Singer, J.D. and M. Small (1994) �Correlates of War Project: International and Civil War Data,
1816-1992.�(ICPSR 9905). Ann Arbor, Mich.
[28] Taylor, C., and M.C. Hudson (1972) The World Handbook of Political and Social Indicators,
2nd ed.(New Haven, CT: Yale University Press.
[29] Vanhaven, T. (1999). "Domestic Ethnic Con�ict and Ethnic Nepotism: A Comparative Analy-
sis" Journal Of Peace Research, vol.36, no.1, pp. 55-73.
27

TABLE 1 Logit regressions for the incidence of civil wars.
Basic indicators of ethnolinguistic/religious heterogeneity. (1) (2) (3) (4) (5) (6) (7) (8) Constant -5.82
(2.06) -6.26 (1.93)
-6.29 (2.01)
-5.27 (1.66)
-6.03 (1.85)
-6.89 (2.26)
-6.77 (1.94)
-7.47 (2.32)
LGDPC -0.28 (1.27)
-0.44 (1.99)
-0.42 (1.79)
-0.40 (1.44)
-0.32 (1.11)
-0.33 (1.13)
-0.37 (1.32)
-0.37 (1.33)
LPOP 0.34 (2.18)
0.41 (2.40)
0.40 (2.21)
0.40 (2.47)
0.39 (2.39)
0.43 (3.01)
0.40 (2.31)
0.43 (2.72)
PRIMEXP -0.90 (0.52)
-1.01 (0.54)
-1.07 (0.57)
-0.36 (0.21)
-0.56 (0.32)
-0.35 (0.21)
-1.21 (0.64)
-0.89 (0.48)
MOUNTAINS 0.00 (0.49)
0.00 (0.25)
-0.00 (0.19)
0.00 (0.36)
0.00 (0.41)
0.00 (0.29)
-0.00 (0.15)
-0.00 (0.16)
NONCONT 0.08 (0.13)
0.29 (0.49)
0.28 (0.48)
0.04 (0.07)
0.08 (0.13)
0.31 (0.49)
0.32 (0.52)
0.47 (0.79)
DEMOCRACY 0.07 (0.21)
0.03 (0.09)
0.03 (0.09)
0.10 (0.29)
0.10 (0.28)
0.01 (0.05)
0.03 (0.08)
-0.03 (0.09)
ETHFRAC 1.19 (1.89)
0.17 (0.19)
0.04 (0.05)
ETHPOL 2.37 (2.97)
2.28 (2.23)
2.27 (2.84)
2.09 (2.03)
RELFRAC 0.37 (0.36)
-4.97 (1.65)
-4.45 (1.39)
RELPOL 0.73 (1.00)
3.90 (1.97)
0.44 (0.65)
3.29 (1.59)
Pseudo R2 0.10 0.12 0.12 0.09 0.10 0.11 0.12 0.13 N 846 846 846 846 846 846 846 846 The sample includes 138 countries for the period 1960-99. The dependent variable is the incidence of civil wars following the definition of PRIO that includes intermediate and high intensity armed conflicts (PRIOCW). The method of estimation is logit. The absolute z-statistics in parenthesis are calculated using standard errors adjusted for clustering. Explanatory variables: LGDPC: log of real GDP per capita in the initial year; LPOP: the log of the population at the beginning of the period; PRMEXP: primary exports (Collier and Hoeffler); MOUNTAINS: mountains; NONCONT: noncontiguous states; DEMOCRACY: degree of democracy (Polity IV); ETHFRAC: ethnic fractionalization (Source: WCE); ETHPOL: ethnic polarization (Source: WCE); RELFRAC: Religious fractionalization (Source: ET); RELPOL: religious polarization (Source: ET).

TABLE 2 Logit regressions for the incidence of civil wars.
Robustness to alternative indicators of ethnolinguistic heterogeneity
(1) (2) (3) (4) (5) (6) (7) C -6.29
(2.01) -4.82 (1.59)
-6.37 (2.03)
-5.07 (1.74)
-6.22 (1.93)
-5.10 (1.70)
-6.41 (1.96)
LGDPC -0.42 (1.79)
-0.49 (2.35)
-0.42 (1.94)
-0.40 (1.85)
-0.43 (1.95)
-0.49 (2.15)
-0.41 (1.76)
LPOP 0.40 (2.21)
0.40 (2.46)
0.41 (2.43)
0.40 (2.40)
0.40 (2.29)
0.42 (2.64)
0.39 (2.32)
PRIMEXP -1.07 (0.57)
-0.17 (0.10)
-1.11 (0.60)
1.19 (0.50)
-0.52 (0.18)
-0.20 (0.11)
-1.25 (0.69)
MOUNTAINS -0.00 (0.19)
0.00 (0.03)
-0.00 (0.21)
0.00 (0.38)
-0.00 (0.22)
0.00 (0.11)
-0.00 (0.26)
NONCONT 0.28 (0.48)
0.22 (0.37)
0.26 (0.46)
0.03 (0.06)
0.28 (0.49)
0.18 (0.30)
0.28 (0.46)
DEMOCRACY 0.03 (0.09)
0.06 (0.18)
0.04 (0.11)
0.09 (0.25)
0.03 (0.10)
0.07 (0.22)
0.03 (0.08)
ETHPOL 2.28 (2.23)
2.54 (2.79)
2.35 (2.82)
2.91 (2.62)
ETHFRAC 0.17 (0.19)
ETHDOM 0.44 (1.16)
-0.14 (0.34)
ETHLRG*PRIMEXP -2.92 (0.78)
-0.98 (0.21)
LARMINOR 2.22 (1.32)
-1.36 (0.61)
N 846 846 846 846 846 846 846 Pseudo R2 0.12 0.09 0.12 0.09 0.13 0.10 0.12 The sample includes 138 countries for the period 1960-99. The dependent variable is the incidence of civil wars following the definition of PRIO that includes intermediate and high intensity armed conflicts (PRIOCW). The method of estimation is logit. The absolute z-statistics in parenthesis are calculated using standard errors adjusted for clustering. Explanatory variables: LGDPC: log of real GDP per capita in the initial year; LPOP: the log of the population at the beginning of the period; PRMEXP: primary exports (Collier and Hoeffler); MOUNTAINS: mountains; NONCONT: noncontiguous states; DEMOCRACY: degree of democracy (Polity IV); ETHFRAC: ethnic fractionalization (Source: WCE); ETHPOL: ethnic polarization (Source: WCE); ETHDOM: ethnic dominance (Source: WCE); ETHLARG*PRIMEXP: largest ethnic group by primary exports; LARMINOR: size of the largest minority (Source: WCE).

TABLE 3 Proportion of observations with civil wars (1960-99).
Alternative sources of data and time periods
Annual Five years periods
All period (1960-99)
PRIO1000 5.9% 10.1% 29.2% PRIOCW 10.8% 14.4% 33.1% PRIO25 15.2% 22.2% 53.6% Doyle-Sambanis (DSCW) 11.4% 15.3% 35.5% Fearon-Laitin (FLCW) 13.0% 16.6% 34.8%

TABLE 4 Logit regressions for the incidence of civil wars.
Comparing alternative data on civil wars
Dependent variable:
DSCW FLCW PRIO1000
PRIO25
PRIOCW DSCW FLCW PRIO1000
PRIO25
(1) (2) (3) (4) (5) (6) (7) (8) (9) Constant -1.84
(0.76) -2.47 (0.89)
-4.32 (1.54)
-4.16 (1.61)
-7.29 (2.59)
-3.26 (1.46)
-4.25 (1.67)
-5.22 (2.02)
-5.69 (2.44)
LGDPC -0.86 (3.89)
-1.19 (4.65)
-0.62 (2.78)
-0.62 (3.28)
-0.45 (1.93)
-0.82 (3.63)
-1.08 (4.52)
-0.66 (3.22)
-0.60 (3.14)
LPOP 0.35 (2.36)
0.51 (2.68)
0.30 (1.94)
0.39 (2.35)
0.47 (2.77)
0.44 (3.04)
0.58 (3.22)
0.38 (2.56)
0.48 (3.05)
PRIMEXP -0.91 (0.54)
-0.55 (0.37)
-0.01 (0.01)
0.24 (0.20)
-0.87 (0.49)
-0.68 (0.45)
-0.37 (0.27)
0.04 (0.03)
0.27 (0.26)
MOUNTAINS -0.00 (0.80)
0.00 (1.04)
0.00 (0.54)
0.00 (0.22)
-0.00 (0.20)
-0.00 (0.63)
0.00 (1.03)
0.00 (0.50)
0.00 (0.18)
NONCONT 0.25 (0.45)
0.90 (1.59)
0.30 (0.50)
0.69 (1.59)
0.16 (0.29)
0.18 (0.35)
0.82 (1.64)
0.13 (0.24)
0.54 (1.37)
DEMOCRACY 0.43 (1.25)
0.53 (1.65)
0.03 (0.09)
0.18 (0.68)
ETHFRAC -0.52 (0.65)
0.01 (0.01)
0.57 (0.62)
-0.06 (0.09)
0.18 (0.20)
-0.73 (0.92)
-0.14 (0.15)
0.57 (0.63)
-0.17 (0.23)
ETHPOL 2.31 (2.76)
1.95 (1.97)
2.33 (2.16)
2.05 (2.41)
2.31 (2.23)
2.32 (2.74)
2.11 (2.02)
2.35 (2.12)
2.13 (2.48)
Pseudo R2 0.13 0.25 0.13 0.14 0.15 0.16 0.26 0.16 0.17 N 846 846 846 846 990 990 990 990 990
The sample includes 138 countries for the period 1960-99. The method of estimation is logit. The absolute z-statistics in parenthesis are calculated using standard errors adjusted for clustering. The endogenous variables are: PRIOCW: intermediate and high intensity armed conflict (PRIO); DSCW: Doyle and Sambanis (2000) definition of civil war; FLCW: Fearon and Laitin (2003) definition of civil war; PRIO1000: armed conflict generating more than 1,000 deaths yearly (PRIO); PRIO25: armed conflict generating more than 25 deaths yearly (PRIO). Explanatory variables: LGDPC: log of real GDP per capita in the initial year; LPOP: the log of the population at the beginning of the period; PRMEXP: primary exports (Collier and Hoeffler); MOUNTAINS: mountains; NONCONT: noncontiguous states; DEMOCRACY: degree of democracy (Polity IV); ETHFRAC: ethnic fractionalization (Source: WCE); ETHPOL: ethnic polarization (Source: WCE);
.

Table 5
Robustness of the results to the inclusion of regional dummies and the elimination of countries in specific regions.
(1) (2) (3) (4) (5) (6) (7) (8) C -6.17
(1.74) -6.07 (1.68)
-4.59 (1.19)
-4.23 (1.06)
-7.47 (1.93)
-7.60 (2.01)
-5.50 (1.69)
-5.39 (1.66)
LGDPC -0.43 (1.84)
-0.41 (1.71)
-0.45 (1.78)
-0.43 (1.57)
-0.37 (1.59)
-0.34 (1.43)
-0.40 (1.72)
-0.43 (1.78)
LPOP 0.40 (2.34)
0.38 (2.08)
0.33 (1.75)
0.29 (1.37)
0.46 (2.35)
0.45 (2.24)
0.33 (2.01)
0.35 (1.93)
PRIMEXP -1.08 (0.56)
-1.15 (0.59)
-0.94 (0.45)
-1.14 (0.55)
-0.55 (0.30)
-0.60 (0.33)
-0.92 (0.43)
-0.81 (0.37)
MOUNTAINS -0.00 (0.15)
-0.00 (0.11)
-0.01 (0.64)
-0.01 (0.65)
-0.00 (0.57)
-0.00 (0.50)
-0.00 (0.02)
-0.00 (0.09)
NONCONT 0.11 (0.17)
0.09 (0.14)
0.12 (0.20)
0.05 (0.09)
-0.06 (0.09)
-0.07 (0.11)
0.12 (0.15)
0.14 (0.17)
DEMOCRACY 0.09 (0.25)
0.09 (0.26)
0.01 (0.02)
-0.00 (0.02)
0.06 (0.16)
0.06 (0.16)
0.16 (0.43)
0.16 (0.44)
ETHPOL 2.48 (3.10)
2.35 (2.23)
2.40 (2.60)
1.98 (1.32)
2.20 (2.80)
2.12 (2.15)
2.46 (2.92)
2.61 (2.43)
ETHFRAC 0.26 (0.29)
0.63 (0.42)
0.19 (0.21)
-0.30 (0.32)
Reg. Dummies Yes Yes No No No No No No Eliminated region None None SAfrica SAfrica Laam Laam Asiae AsiaeN 846 846 580 580 678 678 781 781 Pseudo R2 0.13 0.13 0.12 0.12 0.12 0.12 0.11 0.11
The sample includes 138 countries for the period 1960-99 The dependent variable is the incidence of civil wars following the definition of PRIO that includes intermediate and high intensity armed conflicts (PRIOCW). The method of estimation is logit. The absolute z-statistics in parenthesis are calculated using standard errors adjusted for clustering. Explanatory variables: LGDPC: log of real GDP per capita in the initial year; LPOP: the log of the population at the beginning of the period; PRMEXP: primary exports (Collier and Hoeffler); MOUNTAINS: mountains; NONCONT: noncontiguous states; DEMOCRACY: degree of democracy (Polity IV); ETHFRAC: ethnic fractionalization (Source: WCE); ETHPOL: ethnic polarization (Source: WCE). Regional dummies: SAFRICA: Sub-Saharan Africa; LAAM: Latin America; ASIAE: Asia.
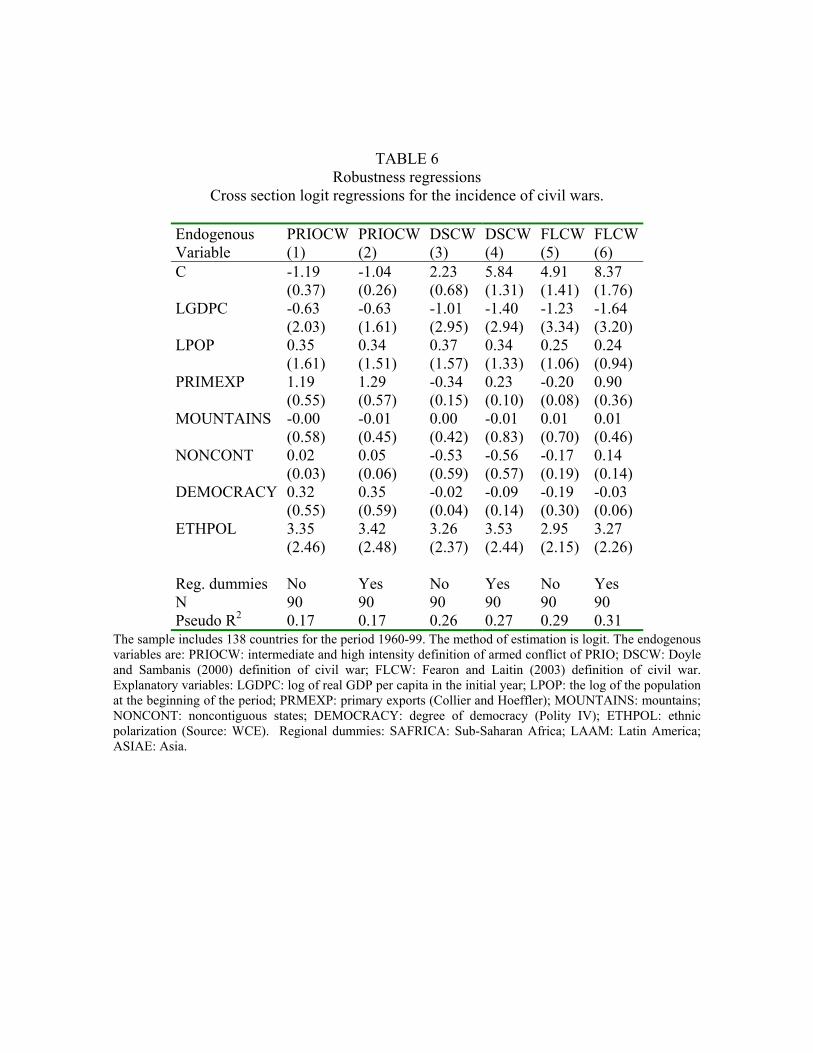
TABLE 6 Robustness regressions
Cross section logit regressions for the incidence of civil wars.
Endogenous Variable
PRIOCW(1)
PRIOCW(2)
DSCW(3)
DSCW(4)
FLCW (5)
FLCW (6)
C -1.19 (0.37)
-1.04 (0.26)
2.23 (0.68)
5.84 (1.31)
4.91 (1.41)
8.37 (1.76)
LGDPC -0.63 (2.03)
-0.63 (1.61)
-1.01 (2.95)
-1.40 (2.94)
-1.23 (3.34)
-1.64 (3.20)
LPOP 0.35 (1.61)
0.34 (1.51)
0.37 (1.57)
0.34 (1.33)
0.25 (1.06)
0.24 (0.94)
PRIMEXP 1.19 (0.55)
1.29 (0.57)
-0.34 (0.15)
0.23 (0.10)
-0.20 (0.08)
0.90 (0.36)
MOUNTAINS -0.00 (0.58)
-0.01 (0.45)
0.00 (0.42)
-0.01 (0.83)
0.01 (0.70)
0.01 (0.46)
NONCONT 0.02 (0.03)
0.05 (0.06)
-0.53 (0.59)
-0.56 (0.57)
-0.17 (0.19)
0.14 (0.14)
DEMOCRACY 0.32 (0.55)
0.35 (0.59)
-0.02 (0.04)
-0.09 (0.14)
-0.19 (0.30)
-0.03 (0.06)
ETHPOL 3.35 (2.46)
3.42 (2.48)
3.26 (2.37)
3.53 (2.44)
2.95 (2.15)
3.27 (2.26)
Reg. dummies No Yes No Yes No Yes N 90 90 90 90 90 90 Pseudo R2 0.17 0.17 0.26 0.27 0.29 0.31
The sample includes 138 countries for the period 1960-99. The method of estimation is logit. The endogenous variables are: PRIOCW: intermediate and high intensity definition of armed conflict of PRIO; DSCW: Doyle and Sambanis (2000) definition of civil war; FLCW: Fearon and Laitin (2003) definition of civil war. Explanatory variables: LGDPC: log of real GDP per capita in the initial year; LPOP: the log of the population at the beginning of the period; PRMEXP: primary exports (Collier and Hoeffler); MOUNTAINS: mountains; NONCONT: noncontiguous states; DEMOCRACY: degree of democracy (Polity IV); ETHPOL: ethnic polarization (Source: WCE). Regional dummies: SAFRICA: Sub-Saharan Africa; LAAM: Latin America; ASIAE: Asia.

Appendix 2. Ethnic polarization and fractionalization (Source: WCE) Country ETHPOL ETHFRAG Afghanistan 0.786 0.603Algeria 0.514 0.299Angola 0.572 0.805Argentina 0.579 0.408Australia 0.492 0.315Austria 0.240 0.128Bahamas, The 0.705 0.441Bahrain 0.569 0.383Bangladesh 0.132 0.068Barbados 0.366 0.199Belgium 0.871 0.544Benin 0.436 0.868Bolivia 0.767 0.708Botswana 0.650 0.485Brazil 0.773 0.644Burundi 0.512 0.286Cameroon 0.576 0.817Canada 0.672 0.767Cape Verde 0.822 0.435Central African Republic 0.578 0.787Chad 0.665 0.768Chile 0.723 0.432China 0.661 0.599Colombia 0.789 0.675Comoros 0.127 0.061Congo, Dem. Rep. 0.586 0.799Congo, Rep. 0.674 0.721Costa Rica 0.420 0.241Cote d'Ivoire 0.432 0.874Cyprus 0.652 0.357Denmark 0.097 0.049Dominica 0.370 0.202Dominican Republic 0.725 0.460Ecuador 0.837 0.657Egypt, Arab Rep. 0.427 0.247El Salvador 0.279 0.145Ethiopia 0.778 0.695Fiji 0.930 0.559Finland 0.294 0.148France 0.294 0.147Gabon 0.519 0.834Gambia, The 0.689 0.728Germany 0.227 0.123Ghana 0.661 0.731Greece 0.186 0.099Grenada 0.945 0.542Guatemala 0.955 0.520Guinea 0.843 0.649

Guinea-Bissau 0.532 0.829Guyana 0.813 0.634Haiti 0.207 0.104Honduras 0.430 0.254Hong Kong, China 0.066 0.034Hungary 0.308 0.167Iceland 0.055 0.028India 0.348 0.901Indonesia 0.529 0.793Iran, Islamic Rep. 0.598 0.756Iraq 0.665 0.390Ireland 0.141 0.072Israel 0.548 0.286Italy 0.154 0.080Jamaica 0.600 0.354Japan 0.067 0.034Jordan 0.982 0.515Kenya 0.381 0.890Korea, Rep. 0.028 0.014Kuwait 0.980 0.513Lesotho 0.343 0.185Liberia 0.390 0.890Luxembourg 0.596 0.298Madagascar 0.017 0.050Malawi 0.736 0.684Malaysia 0.762 0.695Mali 0.420 0.862Malta 0.167 0.083Mauritania 0.536 0.334Mauritius 0.803 0.482Mexico 0.654 0.576Morocco 0.897 0.475Mozambique 0.499 0.838Myanmar 0.650 0.474Nepal 0.652 0.682Netherlands 0.214 0.113New Zealand 0.366 0.196Nicaragua 0.681 0.496Niger 0.698 0.718Nigeria 0.404 0.885Norway 0.090 0.045Oman 0.408 0.239Pakistan 0.698 0.608Panama 0.586 0.048Papua New Guinea 0.669 0.354Paraguay 0.310 0.174Peru 0.817 0.658Philippines 0.497 0.843Poland 0.099 0.051Portugal 0.020 0.010Rwanda 0.401 0.221Samoa 0.388 0.199

Saudi Arabia 0.114 0.059Senegal 0.560 0.809Seychelles 0.160 0.084Sierra Leone 0.600 0.793Singapore 0.666 0.421Solomon Islands 0.258 0.139Somalia 0.679 0.385South Africa 0.718 0.469Spain 0.693 0.436Sri Lanka 0.749 0.452St. Lucia 0.958 0.540St. Vincent and the Grenadines 0.773 0.527Sudan 0.699 0.711Suriname 0.734 0.729Swaziland 0.318 0.178Sweden 0.337 0.189Switzerland 0.724 0.560Syrian Arab Republic 0.373 0.207Taiwan, China 0.685 0.363Tanzania 0.271 0.959Thailand 0.582 0.361Togo 0.673 0.732Tonga 0.066 0.034Trinidad and Tobago 0.842 0.662Tunisia 0.167 0.087Turkey 0.342 0.185Uganda 0.279 0.932United Arab Emirates 0.640 0.320United Kingdom 0.571 0.373United States 0.691 0.583Uruguay 0.426 0.260Vanuatu 0.285 0.155Venezuela 0.758 0.539Yemen, Rep. 0.063 0.032Yugoslavia, FR (Serb./Mont.) 0.599 0.782Zambia 0.606 0.787Zimbabwe 0.698 0.534