estuarine, coastal and shelf scienceoceandatacenter.ucsc.edu/home/publications/2015/1-s2.0-s... ·...
TRANSCRIPT
lable at ScienceDirect
Estuarine, Coastal and Shelf Science xxx (2015) 1e14
Contents lists avai
Estuarine, Coastal and Shelf Science
journal homepage: www.elsevier .com/locate/ecss
Death from below: Investigation of inhibitory factors in bloomdevelopment during a wastewater effluent diversion
Raphael M. Kudela a, *, Andrew J. Lucas b, Kendra Hayashi a, Meredith Howard c,Karen McLaughlin c
a Ocean Sciences and Institute for Marine Sciences, University of California, Santa Cruz, 1156 High Street, Santa Cruz, CA, 95064, USAb Scripps Institution of Oceanography, University of California, San Diego, 9500 Gilman Drive #0226, La Jolla, CA, 92093, USAc Southern California Coastal Water Research Project, 3535 Harbor Blvd, Suite 110, Costa Mesa, CA, 92626, USA
a r t i c l e i n f o
Article history:Received 24 October 2014Received in revised form17 July 2015Accepted 21 July 2015Available online xxx
Keywords:PhytoplanktonPhotosynthesisAmmonium compoundsVariable fluorescenceWastewater treatmentEffluents
* Corresponding author.E-mail address: [email protected] (R.M. Kudela).
http://dx.doi.org/10.1016/j.ecss.2015.07.0210272-7714/© 2015 Published by Elsevier Ltd.
Please cite this article in press as: Kudela, Rwastewater effluent diversion, Estuarine, Co
a b s t r a c t
Eutrophication of coastal waters is an urgent and globally increasing problem. A significant source ofnutrients to Southern California coastal waters is direct discharge of secondarily treated wastewatereffluent from regional Publicly Owned Treatment Works. The planned diversion of treated wastewaterfrom the Orange County Sanitation District's main (5-mile) pipe to a shallow 1-mile pipe off HuntingtonBeach, CA in autumn 2012 provided an unprecedented opportunity to monitor the response of thecoastal phytoplankton community to a major anthropogenic loading event. Despite the continuousrelease of approximately 11.07 � 106 m3 of effluent containing 1743 mM ammonium, there was virtuallyno detectable change in phytoplankton biomass, in striking contrast to the harmful algal bloom domi-nated community that quickly developed in response to a comparable diversion in Santa Monica Bay in2006. Field and laboratory studies demonstrate that disinfection byproducts associated with enhanceddechlorination were present in the discharged water, and that these compounds had a strong inhibitoryimpact on phytoplankton photophysiology and growth, lasting 24 h for photosynthetic performance andat least 3 d for growth, assessed as change in chlorophyll. Thus, the perhaps fortuitous unintendedconsequence of enhanced chlorination was the production of inhibitory compounds that suppressed thepotential phytoplankton response over a large swath of the continental shelf during the diversion.
© 2015 Published by Elsevier Ltd.
1. Introduction
Eutrophication of coastal waters is a well-recognized problem(c.f. Howarth, 2008), perhaps the single greatest problem facing themajority of surface waters today (Smith and Schindler, 2009).Eutrophication has been directly or indirectly linked to increasingfrequency of harmful algal blooms (Anderson et al., 2002; Heisleret al., 2008) and coastal hypoxia (Diaz and Rosenberg, 2008).Wastewater discharge is also associated with contamination ofcoastal waters from metals, pharmaceuticals, and pathogenic bac-teria (c.f. Islam and Tanaka, 2004). To combat this, Publicly OwnedTreatment Works (POTWs) in large metropolitan regions, such asSouthern California, have implemented aggressive regulatory andmanagement practices to minimize potential impacts in the lastfew decades (Lyon and Sutula, 2011). While significant reductions
.M., et al., Death from belowastal and Shelf Science (2015
have beenmade, Howard et al. (2014) showed that nitrogen loadingfrom POTW effluent discharge in Southern California greatly ex-ceeds riverine and atmospheric contributions, and can be on parwith coastal upwelling.
The Orange County Sanitation District (OCSD) is one of four largePOTWs that discharges secondarily treated effluent into the coastalocean in the greater Los Angeles basin. OCSD serves a population ofmore than 2.6 million residents; OCSD collects, treats, and disposesof sewage from two plants, discharged in the coastal ocean nearHuntington Beach, CA. A 120-inch outfall pipe extends 5 miles fromthe shoreline and delivers approximately 138 million gallons d�1
(528 � 106 L d�1) of secondarily treated effluent to a depth of55e60 m.
In autumn (11 September to 3 October) 2012, OCSD divertedapproximately 528 � 106 L d�1 of secondarily-treated effluent fromtheir primary outfall pipe to a nearshore (1 mile) 78-inch outfallpipe (Fig. 1) as part of Project J-112: Ocean Outfall Land Section andOcean Outfall Booster Pump Station Piping Rehabilitation Project.
: Investigation of inhibitory factors in bloom development during a), http://dx.doi.org/10.1016/j.ecss.2015.07.021
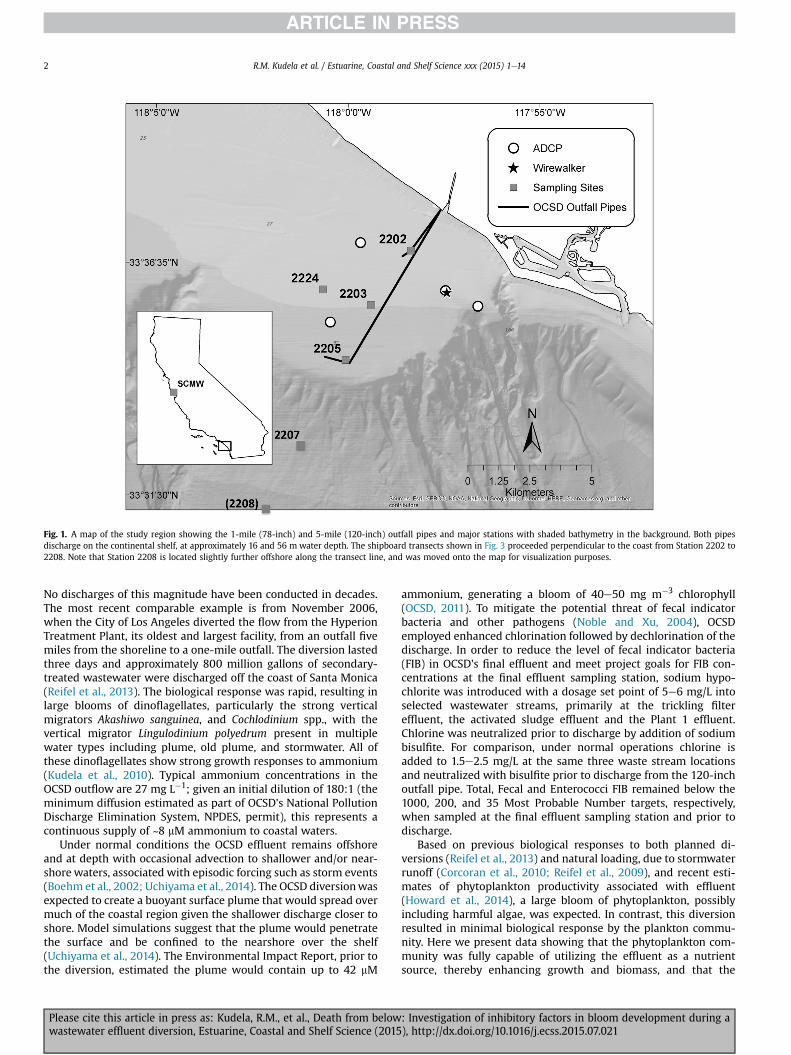
Fig. 1. A map of the study region showing the 1-mile (78-inch) and 5-mile (120-inch) outfall pipes and major stations with shaded bathymetry in the background. Both pipesdischarge on the continental shelf, at approximately 16 and 56 m water depth. The shipboard transects shown in Fig. 3 proceeded perpendicular to the coast from Station 2202 to2208. Note that Station 2208 is located slightly further offshore along the transect line, and was moved onto the map for visualization purposes.
R.M. Kudela et al. / Estuarine, Coastal and Shelf Science xxx (2015) 1e142
No discharges of this magnitude have been conducted in decades.The most recent comparable example is from November 2006,when the City of Los Angeles diverted the flow from the HyperionTreatment Plant, its oldest and largest facility, from an outfall fivemiles from the shoreline to a one-mile outfall. The diversion lastedthree days and approximately 800 million gallons of secondary-treated wastewater were discharged off the coast of Santa Monica(Reifel et al., 2013). The biological response was rapid, resulting inlarge blooms of dinoflagellates, particularly the strong verticalmigrators Akashiwo sanguinea, and Cochlodinium spp., with thevertical migrator Lingulodinium polyedrum present in multiplewater types including plume, old plume, and stormwater. All ofthese dinoflagellates show strong growth responses to ammonium(Kudela et al., 2010). Typical ammonium concentrations in theOCSD outflow are 27 mg L�1; given an initial dilution of 180:1 (theminimum diffusion estimated as part of OCSD's National PollutionDischarge Elimination System, NPDES, permit), this represents acontinuous supply of ~8 mM ammonium to coastal waters.
Under normal conditions the OCSD effluent remains offshoreand at depth with occasional advection to shallower and/or near-shore waters, associated with episodic forcing such as storm events(Boehm et al., 2002; Uchiyama et al., 2014). The OCSD diversionwasexpected to create a buoyant surface plume that would spread overmuch of the coastal region given the shallower discharge closer toshore. Model simulations suggest that the plume would penetratethe surface and be confined to the nearshore over the shelf(Uchiyama et al., 2014). The Environmental Impact Report, prior tothe diversion, estimated the plume would contain up to 42 mM
Please cite this article in press as: Kudela, R.M., et al., Death from belowwastewater effluent diversion, Estuarine, Coastal and Shelf Science (2015
ammonium, generating a bloom of 40e50 mg m�3 chlorophyll(OCSD, 2011). To mitigate the potential threat of fecal indicatorbacteria and other pathogens (Noble and Xu, 2004), OCSDemployed enhanced chlorination followed by dechlorination of thedischarge. In order to reduce the level of fecal indicator bacteria(FIB) in OCSD's final effluent and meet project goals for FIB con-centrations at the final effluent sampling station, sodium hypo-chlorite was introduced with a dosage set point of 5e6 mg/L intoselected wastewater streams, primarily at the trickling filtereffluent, the activated sludge effluent and the Plant 1 effluent.Chlorine was neutralized prior to discharge by addition of sodiumbisulfite. For comparison, under normal operations chlorine isadded to 1.5e2.5 mg/L at the same three waste stream locationsand neutralized with bisulfite prior to discharge from the 120-inchoutfall pipe. Total, Fecal and Enterococci FIB remained below the1000, 200, and 35 Most Probable Number targets, respectively,when sampled at the final effluent sampling station and prior todischarge.
Based on previous biological responses to both planned di-versions (Reifel et al., 2013) and natural loading, due to stormwaterrunoff (Corcoran et al., 2010; Reifel et al., 2009), and recent esti-mates of phytoplankton productivity associated with effluent(Howard et al., 2014), a large bloom of phytoplankton, possiblyincluding harmful algae, was expected. In contrast, this diversionresulted in minimal biological response by the plankton commu-nity. Here we present data showing that the phytoplankton com-munity was fully capable of utilizing the effluent as a nutrientsource, thereby enhancing growth and biomass, and that the
: Investigation of inhibitory factors in bloom development during a), http://dx.doi.org/10.1016/j.ecss.2015.07.021
R.M. Kudela et al. / Estuarine, Coastal and Shelf Science xxx (2015) 1e14 3
“missing” bloom was likely due to the perhaps fortuitous produc-tion of disinfection byproduct compounds that had a deleteriouseffect on algal physiology.
2. Materials and methods
2.1. Overview of field sampling
Field sampling was conducted within the Southern CaliforniaBight in the vicinity of the Orange County Sanitation District (OCSD)outfall pipes (Fig. 1). OCSD monitored residual chloride in theeffluent, flow to, and ammonium at the outfall. Additional discretesamples for nitrate þ nitrite, ammonium, dissolved inorganicphosphorus, and silicic acid were sampled on 6 and 20 Septemberand 17 October 2012. Chlorination of the effluent was achievedthrough addition of 5e6 mg L�1 sodium hypochlorite (used as adisinfecting agent) followed by dechlorination with an equivalent(molar) concentration of sodium bisulfite (the neutralizer/quencher). Total chlorine residual, or residual chloride, was deter-mined using a digital colorimeter following method SM 4500-Cl_G(APHA, 1995). When chlorine as sodium hypochlorite is added towastewater, the chlorine first reacts with organic material andmetals. This is referred to as the chlorine demand. The remainingunreacted chlorine is the total chlorine. Residual chlorine (orchloride) is a term used to describe the concentration remaining oftotal chlorine as measured by method SM 4500-Cl_G, and is re-ported as the average of measurements over a 24 h period, as perOCSD NPDES permit requirements.
Monthly chlorophyll and sea surface temperature climatologies(2003e2013) and anomalies for the general region (34e35� N,117.5e118.5� W) were obtained from MODIS Aqua at 4 km resolu-tion from the Giovanni online data system, developed and main-tained by the NASA GES DISC.
For this study, a subset of the full field data collected as part ofthe diversion experiment were used, focusing on an onshore-offshore transect following the diversion pipe for 6, 20 September2012, 17 October 2012, and 6 November 2012 (Table 1). Underwayconductivity (salinity), temperature, and variable fluorescencewere measured from a flow-through system aboard the R/V Yel-lowfin and M/V Nerissa using surface (<2 m) seawater pumpedthrough a cooler with a YSI 6600v2 CTD sonde and Turner DesignsPhytoFlash sampling the flow-through water. The ship tracks fol-lowed a line perpendicular to the coast starting at Station 2202 andending at Station 2208 (Fig. 1). These data were merged with GPSposition at 5-min intervals. Vertical profiles of conductivity, tem-perature, and depth were collected from instrumented rosettes(SBE-911 CTD) aboard the research vessels, processed using
Table 1Locations and environmental conditions for reported sampling sites. The first column inexperiment), Laboratory.
Experiment Date Station Depth (m) Lat. (� N) Lon. (� W) Temp. (� C
Grazer Dilut. 6-Sep-2012 2203 15 33.595 117.989 15.37Grazer Dilut. 20-Sep-2012 2203 7.5 33.595 117.989 18.74Grazer Dilut. 17-Oct-2012 2203 15 33.595 117.989 17.23Amendment 6-Sep-2012 2202 5 33.615 117.972 19.10Amendment 6-Sep-2012 2203 5 33.595 117.989 19.38Amendment 6-Sep-2012 2205 5 33.575 118.000 19.17Amendment 20-Sep-2012 2202 5 33.595 117.989 17.68Amendment 20-Sep-2012 2203 7.5 33.595 117.989 18.74Amendment 20-Sep-2012 2205 8 33.595 117.989 19.10Amendment 17-Oct-2012 2203 15 33.595 117.989 17.23Amendment 17-Oct-2012 2205 34 33.595 117.989 14.43Amendment 6-Nov-2012 2224 24 33.600 118.010 15.08Laboratory 10-Jun-2013 SCMW 0 36.958 122.017 12.9Laboratory 25-Mar-2014 SCMW 0 36.958 122.017 13.4
Please cite this article in press as: Kudela, R.M., et al., Death from belowwastewater effluent diversion, Estuarine, Coastal and Shelf Science (2015
standard oceanographic methods. For field experiments, water wascollected into acid-cleaned polycarbonate carboys prior todispensing into acid-cleaned HDPE bottles. To correct for anapparent downward drift in the YSI salinity with time, the YSI datarecord was adjusted by matching the salinities from the YSI(pumped) and SBE-911 (vertical profile) data at each station for theshallowest available depth from the SBE-911. A constant offset wasapplied to each cruise, with the offset determined (for each cruise)using the matched salinity data.
Additional laboratory experiments were conducted with surfacewater collected from the Santa Cruz Municipal Wharf (SCMW; 36�
57.480 N, 122� 1.020 W) on 10 June 2013 and 25 March 2014 using aclean plastic bucket. For laboratory experiments, water was trans-ported to the laboratory and experiments were initiated within24 h of collection.
Water was processed in the field or laboratory within less than1 h for total chlorophyll, dissolved nutrients (nitrate þ nitrite(hereafter referred to as nitrate), dissolved inorganic phosphorus(DIP), silicic acid (Si), ammonium, and urea), and phytoplanktonenumeration following standard procedures (cf. Lane et al., 2009).
2.2. Moorings
A combination of moored assets collected observations of thecurrents, temperature and salinity structure, and the distribution ofchlorophyll a over the shelf in the vicinity of the outfall. Fourbottom-mounted Acoustic Doppler Current Profilers (ADCPs) weredeployed for the duration of the experiment. The vertical andtemporal resolution of the ADCPs were 1 m and 6 min, respectively.Concurrently, a trio of moored wave-powered profiling vehicles,the Wirewalker (Pinkel et al., 2011), collected profiles of tempera-ture, salinity, chlorophyll fluorescence every ~5 min. ADCP velocitydata were used to calculate progressive vector diagrams across theshelf for the 48 h bracketing each sampling event described above.Time series of temperature, salinity, and chlorophyll fluorescencefrom the Wirewalkers were used to investigate the structure of theplume.
2.3. Grazer-dilution experiments
Water collected in the vicinity of the OCSD outfall pipe on 6September, 20 September, and 17 October 2012 was amended withf/20 nutrients (Guillard, 1975) with 10 mM ammonium as the ni-trogen source. The amendedwholewater was then filtered throughan acid-cleaned Supor 0.2 mm capsule filter. Water was dispensedinto 1 L polycarbonate bottles using 100, 20, and 10% whole water.Bottles were incubated with neutral density screening at 50%
dicates the experiment type; Grazer Dilution (field experiment), Amendment (field
) Sal. NH4 (mM) Urea (mM) NO3 (mM) DIP (mM) Si (mM) Chl (mg m�3)
33.39 0.05 0.68 0.06 0.62 4.36 1.0233.37 0.17 0.33 0.11 0.30 0.19 2.7933.40 0.22 0.11 0.48 0.45 2.22 1.5933.40 0.0 0.60 1.39 0.42 3.46 0.9333.45 0.61 2.20 4.24 0.47 1.73 0.2833.37 0.0 0.37 0.28 0.47 4.95 1.0233.38 0.29 0.26 0.10 0.38 1.18 1.1933.37 0.17 0.33 0.11 0.29 0.19 2.7933.36 0.47 0.19 0.13 0.28 1.18 2.0933.40 0.22 0.11 0.48 0.44 2.21 1.5933.35 0.40 0.06 1.53 0.69 3.50 0.5133.40 2.30 e 1.36 0.16 3.40 4.7533.00 1.88 5.11 3.31 1.02 9.62 26.6733.10 0.98 4.41 4.77 0.73 11.06 5.54
: Investigation of inhibitory factors in bloom development during a), http://dx.doi.org/10.1016/j.ecss.2015.07.021
R.M. Kudela et al. / Estuarine, Coastal and Shelf Science xxx (2015) 1e144
ambient light levels at ambient surface water temperature in theharbor at the Southern California Marine Institute in San Pedro, CA.Initial and final chlorophyll samples, collected in triplicate, wereused to calculate phytoplankton growth and microzooplanktongrazing using a “modified 3-point method” as described byGallegos (1989) andWorden and Binder (2003). Briefly, the data arefit using linear regression, with the slope providing the grazermortality term and the intercept providing the phytoplanktongrowth rate in the absence of grazer mortality.
2.4. Nutrient amendment field experiments
Water was collected from 5 to 35 m depth (the chlorophyllmaximum) at a series of stations (2202, 2203, 2205; Fig. 1) alongthe outfall pipe on 6 September, 20 September, and 17 October2012. Water was dispensed into 0.25 L polycarbonate bottles andincubated as the grazer-dilution experiments, with sampling ofchlorophyll on the initial day and 24 h later. Various amendmentswere conducted; here we focus on the control (no amendment),ammonium (10 mM ammonium), dissolved inorganic phosphorus(DIP; 10 mM), and f/20 nutrients with ammonium (10 mM) as thenitrogen source. Chlorophyll data were used to estimate netphytoplankton growth rates by difference between the initial and24-h time point using log-transformed chlorophyll for allexperiments.
2.5. Variable fluorescence
In addition to the PhytoFlash data collected from the underwaysystem, discrete samples were analyzed using a Heinz-Walz WA-TER-PAM. Both instruments were blanked with 0.2 mm filteredseawater. Discrete samples were dark-adapted for 30 min, and thenthe gain was adjusted on the WATER-PAM. Subsequent samplesused the same gain setting, with typically triplicate aliquots of thedark-adapted water analyzed. The initial reading provided variablefluorescence (Fv/Fm, or yield). Subsequent measurements of thesame aliquot of water were then subjected to increasing ambientirradiance to calculate the relative Electron Transport Rate (rETR)response curve (Kudela et al., 2008). A more detailed discussion ofthe methodology and terminology is available in Kromkamp andForster (2003). Results from the rETR measurements were used toestimate maximum rETR (unitless), Ek (mmol photons m�2 s�1) anda (initial slope of rETR versus irradiance) using a hyperbolic tangentfunction (Jassby and Platt, 1976).
2.6. Effluent laboratory experiments
Raw effluent, sodium hypochlorite (Olin Chlor Alkali Products)and sodium bisulfite (Jones Chemical Inc.) were obtained from theOrange County Sanitation District. For phytoplankton amendments,three treatments were used: effluent, effluent with sodium hypo-chlorite, and effluent with sodium hypochlorite and sodiumbisulfite. Treatments were designed to mimic the typical conditionsused by OCSD during the enhanced disinfection employed for thediversion. Sodium hypochlorite was added at a concentration of5.5 mg L�1 using a 12.5% solution (0.69 mg L�1 hypochlorite finalconcentration), and sodium bisulfite was added at a concentrationof 4.3 mg L�1 using a 25% solution, sufficient to neutralize the hy-pochlorite. The effluent was held for at least 2 h after addition ofhypochlorite before adding bisulfite, and the combined mixturewas held for at least 15 min before using as an amendment withseawater samples. For some experiments the effluent plus hypo-chlorite was held longer to determine the impact of holding time.The treated effluent was then added to seawater at 3% concentra-tion, with Milli-Q water used at the same percentage for non-
Please cite this article in press as: Kudela, R.M., et al., Death from belowwastewater effluent diversion, Estuarine, Coastal and Shelf Science (2015
effluent treatments. The same chemicals were used for separateadditions (e.g. hypochlorite and bisulfite were added directly toseawater for some treatments).
The first of a series of laboratory experiments was conducted on6 November 2012 at the Southern California Coastal WaterResearch Project Authority (SCCWRP) with seawater collected from24m depth (the chlorophyll maximum) at station 2224. Therewere12 treatments conducted in triplicate 1 L bottles that included thefollowing: control, sodium bisulfite, sodium hypochlorite, sodiumbisulfite and sodium hypochlorite, effluent, effluent with sodiumbisulfite, effluent with sodium hypochlorite, effluent with sodiumhypochlorite and sodium bisulfite, and 4 effluent ‘mimic’ treat-ments, of f/20 nutrients with ammonium (10 mM) as the nitrogensource, with the same amendments as the effluent, sodium bisul-fite, sodium hypochlorite, sodium bisulfite and sodiumhypochlorite.
The treatments were incubated in an environmental chamber at150 mmol photonsm�2 s�1 irradiance (12:12 light:dark) at 15 �C andrun for 96 h, sampled daily. Chlorophyll a samples were collected asdescribed above but were analyzed using a model 10AU fluorom-eter (Turner Designs, CA) using the acidification method (Parsonset al., 1984). The average chlorophyll concentration was calculatedfor each treatment, each day, from triplicate bottle replicates andwere used to estimate net phytoplankton growth rates from all 5time points using log-transformed chlorophyll.
Laboratory experiments were conducted with SCMW water on10 June 2013 and 25 March 2014 at University of California, SantaCruz. Whole water was incubated in an environmental chamber(15 �C, ~100 mmol photons m�2 s�1, 12:12 light:dark) with varioustreatments including a control, effluent, effluent plus hypochlorite,effluent plus hypochlorite and bisulfite, and f/20 nutrients. Samplesfrom the laboratory experiment conducted on 25 March 2014 werecollected for enumeration of heterotrophic bacteria by flowcytometry (Peacock and Kudela, 2012) at the initial time point, 24and 48 h. All other treatments were sampled from 5 min to 48 h(depending on the experiment) for chlorophyll, variable fluores-cence, and rETR curves.
3. Results
3.1. Environmental setting
In preparation for the planned diversion, the Orange CountySanitation District began enhanced disinfection procedures on 4August 2012, and ended the enhanced disinfection on 2 October2012. During this period a dosage set point of 5e6 mg L�1 chlorinewas targeted, with neutralization to less than 1.0 mg L�1 prior todischarge. These measurements occur prior to the wastewatersludge being discharged through the diversion outfall pipe, andtherefore prior to dilution (minimum of 180:1) within the receivingwaters. Diversion to the 78-inch outfall pipe commenced 11September 2012 and ended 2 October 2012, when dischargeresumed at the 120-inch outfall pipe (Fig. 1; Table 2). For the periodAugusteNovember, ammonium concentrations and discharge ratesremained fairly constant, resulting in uniform load (Fig. 2).
Based on discrete nutrient samples collected on 6 and 20September and 17 October, ammonium accounted for ~72% of thedissolved inorganic nitrogen, with an elevated N:P ratio of 116:1(molar) within the plume. In contrast, chlorine residuals measuredin the effluent were quite variable with maximum instantaneousresiduals between 0 and 1.5 mg L�1 for several months, includingduring the diversion. OCSD reported exceedances for maximumdaily residual chlorine on three separate occasions during thediversion, and reported that the runningmedianwas in exceedancefor the entire period of the diversion, although that runningmedian
: Investigation of inhibitory factors in bloom development during a), http://dx.doi.org/10.1016/j.ecss.2015.07.021
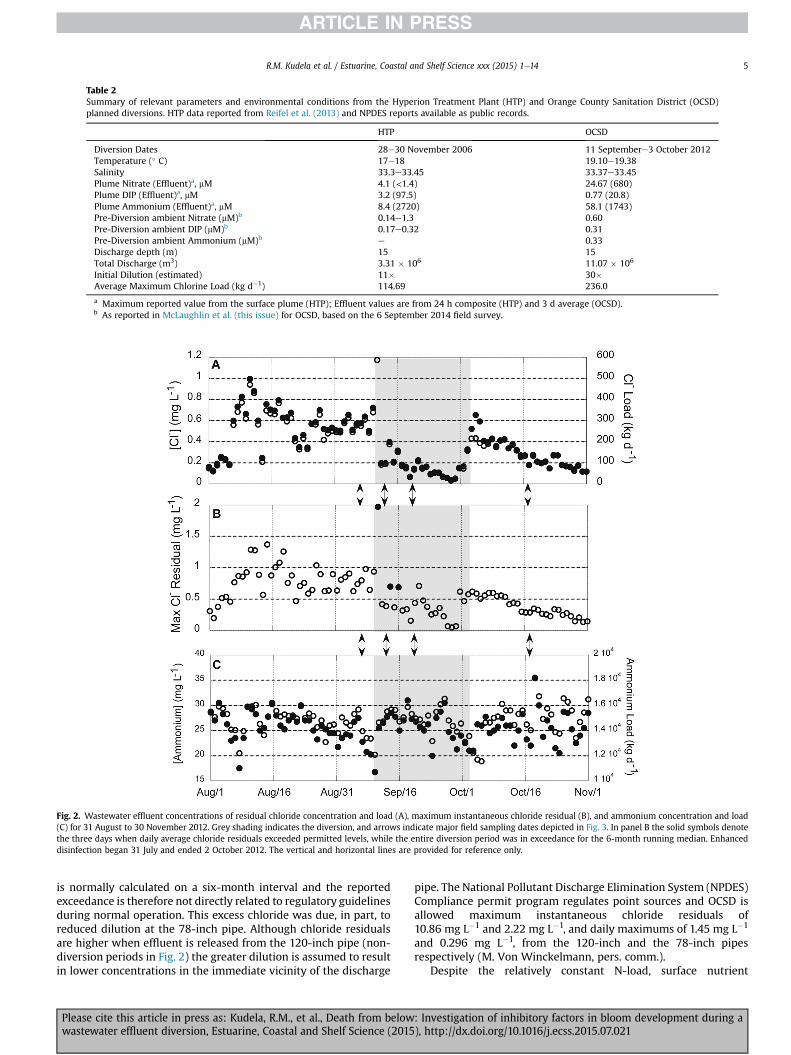
Table 2Summary of relevant parameters and environmental conditions from the Hyperion Treatment Plant (HTP) and Orange County Sanitation District (OCSD)planned diversions. HTP data reported from Reifel et al. (2013) and NPDES reports available as public records.
HTP OCSD
Diversion Dates 28e30 November 2006 11 Septembere3 October 2012Temperature (� C) 17e18 19.10e19.38Salinity 33.3e33.45 33.37e33.45Plume Nitrate (Effluent)a, mM 4.1 (<1.4) 24.67 (680)Plume DIP (Effluent)a, mM 3.2 (97.5) 0.77 (20.8)Plume Ammonium (Effluent)a, mM 8.4 (2720) 58.1 (1743)Pre-Diversion ambient Nitrate (mM)b 0.14e1.3 0.60Pre-Diversion ambient DIP (mM)b 0.17e0.32 0.31Pre-Diversion ambient Ammonium (mM)b e 0.33Discharge depth (m) 15 15Total Discharge (m3) 3.31 � 106 11.07 � 106
Initial Dilution (estimated) 11� 30�Average Maximum Chlorine Load (kg d�1) 114.69 236.0
a Maximum reported value from the surface plume (HTP); Effluent values are from 24 h composite (HTP) and 3 d average (OCSD).b As reported in McLaughlin et al. (this issue) for OCSD, based on the 6 September 2014 field survey.
Fig. 2. Wastewater effluent concentrations of residual chloride concentration and load (A), maximum instantaneous chloride residual (B), and ammonium concentration and load(C) for 31 August to 30 November 2012. Grey shading indicates the diversion, and arrows indicate major field sampling dates depicted in Fig. 3. In panel B the solid symbols denotethe three days when daily average chloride residuals exceeded permitted levels, while the entire diversion period was in exceedance for the 6-month running median. Enhanceddisinfection began 31 July and ended 2 October 2012. The vertical and horizontal lines are provided for reference only.
R.M. Kudela et al. / Estuarine, Coastal and Shelf Science xxx (2015) 1e14 5
is normally calculated on a six-month interval and the reportedexceedance is therefore not directly related to regulatory guidelinesduring normal operation. This excess chloride was due, in part, toreduced dilution at the 78-inch pipe. Although chloride residualsare higher when effluent is released from the 120-inch pipe (non-diversion periods in Fig. 2) the greater dilution is assumed to resultin lower concentrations in the immediate vicinity of the discharge
Please cite this article in press as: Kudela, R.M., et al., Death from belowwastewater effluent diversion, Estuarine, Coastal and Shelf Science (2015
pipe. The National Pollutant Discharge Elimination System (NPDES)Compliance permit program regulates point sources and OCSD isallowed maximum instantaneous chloride residuals of10.86 mg L�1 and 2.22 mg L�1, and daily maximums of 1.45 mg L�1
and 0.296 mg L�1, from the 120-inch and the 78-inch pipesrespectively (M. Von Winckelmann, pers. comm.).
Despite the relatively constant N-load, surface nutrient
: Investigation of inhibitory factors in bloom development during a), http://dx.doi.org/10.1016/j.ecss.2015.07.021
R.M. Kudela et al. / Estuarine, Coastal and Shelf Science xxx (2015) 1e146
concentrations were generally low (McLaughlin et al. this issue;Table 1), but not completely depleted. Chlorophyll in surface waterswas similarly low, never exceeding 5 mg m�3 in water collected forexperiments (Table 1). Phytoplankton composition was relativelyconstant throughout the experiment with diatoms and di-noflagellates dominant and a background of other phytoplankton atan order of magnitude lower concentration, but with an increase inSynechococcus during the diversion (Caron et al. this issue).Consistent with the low ambient nutrients and phytoplanktonabundance, the larger region (33e34� N, 117.5e118.5� W) exhibitedpositive SST anomalies (0.45e1.37 �C) and negative chlorophyllanomalies (0.26e0.56 mg m�3 chlorophyll) for AugusteNovember.SST anomalies were within one standard deviation (SD) of theclimatology except for September (1.37 �C, 2 SD from climatology),while chlorophyll anomalies werewithin 1 SDwith the exception ofAugust 2012, which exceeded 1 SD.
As discussed in this issue (Seegers et al. this issue) the effluentplume was easily tracked from both the 120-inch and 78-inchoutfall pipes using a combined signature of low salinity andelevated colored dissolved organic material (CDOM) absorbance orfluorescence. Temperature was a less consistent proxy, dependenton the prevailing physical conditions, but the plume was generallyassociated with cooler water and a surface thermal anomaly(Gierach et al. this issue). Underway data from the four dates whenwe collected the majority of the field samples exhibited a clearsignature of lower salinity associated with surface manifestation ofplume water (Figs. 3 and 4). This lower salinity water was alsoassociated with lower variable fluorescence.
The surface expression of the plume was variable in space(based on salinity and Fv/Fm). While the discharge from the 120-inch pipe is expected to remain below the pycnocline, lowsalinity, low Fv/Fm waters were located further offshore along thetransect on 6 September (before diversion) and again on 20September (during the diversion), and centered over the 78-inchoutfall pipe (shoreward) on 12 September during the diversion,but also on 17 October after the diversion was terminated. Prior tothe diversion, salinity in the region was gradually declining withtransient decreases in observed salinity from moorings and shorestations to ~33.1 (Farrara et al., this issue).
It is not clear why the underway mapping data exhibited muchlower salinity (Fig. 3). Possibilities include an offset in the instru-ment calibration that was not corrected by comparison to the SBE-911 salinity, fresher water in the very near surface, or local fresh-water sources in the region. Here we focus on the relative spatialpatterns along the transects, and interpret the absolute salinityvalues from the underway mapping data with caution. Progressivevector diagrams from ADCP data collected at several moored sites(Lucas and Kudela, this issue) and WireWalker data demonstratedvariable flow patterns (Fig. 4) but consistent retention for at least48 h on the shelf within the vicinity of the outfall discharge pipes,suggesting that the spatial variability observed in Fig. 3 is consistentwith small-scale mixing of plume waters discharged from the 78-inch outfall pipe during the diversion. We attribute the presenceof low salinity, low yield waters on 17 October to residual plumewaters from the 78-inch outfall pipe since there was no direct ev-idence for surface expression of wastewater from the deeper, 120-inch pipe (see also Seegers et al., this issue).
Variable fluorescence yield was consistently low in the plume(low salinity) waters, ranging from approximately 0.1e0.4, whileoutside the plume values were higher, ranging from 0.4 to 0.6.Higher values were associated with both more (20 September) andless biomass (17 October), demonstrating that standing stock andphysiological “health” were not tightly correlated along the tran-sects. The relationship between salinity and variable fluorescencefor the data presented in Fig. 3 was tested using ordinary least
Please cite this article in press as: Kudela, R.M., et al., Death from belowwastewater effluent diversion, Estuarine, Coastal and Shelf Science (2015
squares regression. Pre-diversion, there was no relationship(p ¼ 0.63). For the remaining three dates, there was a noisy butsignificant (p < 0.01) relationship between decreasing salinity anddecreasing yield, with the relationship improving as the experi-ment progressed (6, 20 September and 17 October) as determinedby increasing R2 values of 0.2, 0.3, and 0.5, respectively. Variablefluorescence is quenched by solar irradiance, and the underwaydatawere not corrected for this effect. Absolute values are thereforesuppressed relative to dark-adapted values, but sky conditionswere consistent for each cruise and there was no obvious correla-tion between fluorescence yield and time of day or solar irradiance,suggesting that the spatial patterns were associated primarily withwater masses rather than light history.
3.2. Phytoplankton growth rates
The initial experimental design for the field programwas basedon the assumption that the diversion would result in rapid phyto-plankton growth as was seen in a previous planned diversion(Reifel et al., 2013). The predicted conditions for the OCSD diversion(based on the 2006 diversion results) were a shallow plume withaverage ammonium concentrations of 42 mMwithin the plume anda biological response of up to 40e50 mg m�3 chlorophyll (OCSD,2011). Experiments were therefore designed to assess loss pro-cesses (grazer-dilution experiments) and limiting nutrients(amendments), as well as to compare the response of phyto-plankton communities at the offshore (120-inch) and nearshore,(78-inch) outfall pipes. The grazer-dilution data showed reasonablereproducibility among replicates (Table 3) but one of the threeexperiments did not produce easily interpreted results. Salinity andvariable fluorescence (Fig. 3) indicated that Station 2203 was notstrongly influenced by the plume (as expected since the dischargewas at station 2205). Grazing rates were negative, and growth rateswere very low but positive. Subsequent experiments on 20September and 17 October exhibited relatively high growth (m) andnet growth (k) values consistent with the nutrient amendmentexperiments, given that the grazer-dilution experiments wereconducted with f/20 nutrients and 10 mM ammonium as the Nsource.
Nutrient amendment field experiments conducted on the samedays (but at multiple stations and varying depths) suggested thatphytoplankton were N-limited with possible secondary limitationby some other nutrient (Table 4). The 6 September experimentsshowed a positive response to DIP at station 2203 but not at station2202 or 2205. Additionally, there was a strong response toammonium at the onshelf stations (2202 and 2203), but not at theoffshore (2205) outfall station. Growth rates from other watersamples at varying depths (amendments) compared to grazer-dilution data indicated faster growth in the deep chlorophyllmaximum (DCM) for 6 September, with net growth rate of 0.53 d�1
in the control bottle compared to 0.12 d�1 from the grazer-dilutionexperiment. Comparison of the data from 20 September and 17October provided variable net growth rates of 0.91 (m, d�1) and 0.56(k, d�1) versus �0.03 and 1.43 d�1 from the amendments (20September and 17 October respectively), while nearby station 2202provided rates of 0.84 and 1.04 d�1 for the f/20 amendments on 6and 20 September respectively.
During the diversion (20 September 2012), therewas no obviousdifference in growth rates from the nutrient amendments betweenthe short and long outfall pipe stations, despite significant changesin nitrification rates at the offshore location (McLaughlin et al. thisissue). Both grazer-dilution and amendment bottles were incu-bated at 50% light and were collected from the same depth for thelatter experiments. Some of the differences between experimentsare undoubtedly due to experimental variability, but it is not clear
: Investigation of inhibitory factors in bloom development during a), http://dx.doi.org/10.1016/j.ecss.2015.07.021

Fig. 3. Salinity and temperature (color shading) in the left panels, and, variable fluorescence and phytoplankton biomass as chlorophyll fluorescence (color shading) in the rightpanels for the four onshore-offshore transects used for the majority of field sampling. The 1-mile and 5-mile pipe locations are indicated along the bottom axis, and the majorstations (see Fig. 1) are indicated along the top axis. Distance is relative to the shoreline. (For interpretation of the references to colour in this figure legend, the reader is referred tothe web version of this article.)
R.M. Kudela et al. / Estuarine, Coastal and Shelf Science xxx (2015) 1e14 7
why the grazer-dilution experiment exhibited negative grazing forthe 6 September experiment.
Growth rates in the presence of added N (as 10 mM ammoniumor f/20 with 10 mM ammonium) generally increased, with valuesranging from�0.02 to 1.36 d�1. This corresponds to an average 2.5-fold increase in growth relative to the control bottles. Based onthese results it was concluded that the phytoplankton assemblageshould respond strongly to effluent discharge given the high loadsof ammonium (Table 1, Fig. 2). Subsequent experiments focused onidentifying potential inhibitors present in the effluent plume.
3.3. Effluent influences on phytoplankton
Preliminary experiments (not shown) and nutrient amend-ments demonstrated that phytoplankton growth rates, determinedfrom change in chlorophyll, increased with the addition of effluentas expected. Subsequent experiments focused on treated effluent toassess the impact of chloride residuals. The field experiment from 6November 2012 included treatments with varying combinations ofeffluent, hypochlorite, bisulfite, and f/20 nutrients (Fig. 5). Theeffluent plus hypochlorite treatment exhibited significantly
Please cite this article in press as: Kudela, R.M., et al., Death from belowwastewater effluent diversion, Estuarine, Coastal and Shelf Science (2015
decreased (paired t-test, p < 0.05) variable fluorescence comparedto all other treatments (Fig. 5A). All treatments except effluent plushypochlorite exhibited positive but insignificant (ANCOVA,p > 0.05) increased growth relative to the control (Fig. 5B).Consistent with the field amendments, the phytoplanktonresponded strongly to nutrient additions as either effluent or as f/20 nutrients. There was no significant response to the presence ofhypochlorite alone or in combination with nutrients or bisulfite(two-tailed t-test, p > 0.05). In contrast to the other treatments, thehypochlorite plus effluent exhibited a strong and significantdecrease in growth (ANCOVA, p < 0.05) compared to the effluent,effluent plus bisulfite, effluent plus bisulfite plus hypochlorite, andall nutrient additions, and a nearly significant (p < 0.1) decreasecompared to the control, bisulfite, hypochlorite, and hypochloriteplus bisulfite treatments.
Variable fluorescence measurements taken at 24, 48, and 72 hshow a similar strong negative response to effluent plus hypo-chlorite (Fig. 6A, the 24 h time point is shown) persisting for 72 h,while other treatments exhibited a gradual increase in variablefluorescence at 48 and 72 h. Estimated rETRmax values (equivalentto PBmax for photosynthesis versus irradiance curves) were not
: Investigation of inhibitory factors in bloom development during a), http://dx.doi.org/10.1016/j.ecss.2015.07.021

Fig. 4. 48 h of (A) temperature, (B) salinity, and (C) chlorophyll fluorescence data from a Wirewalker profiler deployed on the 18 m isobath 3 km south of the diversion outfall. Lowsalinity waters associated with the effluent plume regularly impacted the mooring locations. The effluent waters were distributed in the surface or at the pycnocline, and were notassociated with elevated chlorophyll fluorescence anomalies. In general, chlorophyll was low in both local shelf waters and low salinity waters.
Table 3Summary of growth and grazing rates from the grazer-dilution experiments. [SE] is the standard error of the linear regression, while growth and grazing are estimatedfrom the slope and intercept of the regression.
6 September 2012 20 September 2012 17 October 2012
Growth [SE] (m, d�1) 0.12 [0.33] 1.19 [0.04] 0.73 [0.10]Grazing [SE] (g, d�1) �0.30 [0.17] 0.28 [0.05] 0.17 [0.07]Net growth (k, d�1) 0.42 0.91 0.56R2 0.78 0.78 0.41
Table 4Chlorophyll and estimated net growth rates for the 24-h nutrient amendment experiments. Stations refer to the locations depicted in Fig. 1. Growthwas estimated from changein chlorophyll over the 24-h period. SD represents the standard deviation of replicate chlorophyll samples.
Date Station Treatment Chlorophyll (mg m�3) [SD] Growth rate (m, d�1)
6-Sep-2012 2202 Initial 0.93 [0.03]6-Sep-2012 2202 Control 0.68 [0.04] �0.3176-Sep-2012 2202 Ammonium 2.1 [0.26] 0.8406-Sep-2012 2202 Phosphate 0.75 [0.04] �0.2186-Sep-2012 2203 Initial 0.28 [0.01]6-Sep-2012 2203 Control 0.48 [0.04] 0.5336-Sep-2012 2203 Ammonium 0.85 [0.04] 1.116-Sep-2012 2203 Phosphate 0.68 [0.39] 0.8806-Sep-2012 2205 Initial 0.23 [0.06]6-Sep-2012 2205 Control 0.24 [0.09] 0.0466-Sep-2012 2205 Ammonium 0.24 [0.06] 0.0396-Sep-2012 2205 Phosphate 0.17 [0.01] �0.314
12-Sep-2012 2202 Initial 1.2 [0.23]12-Sep-2012 2202 Control 2.3 [0.79] 0.65612-Sep-2012 2202 f/20 3.4 [0.96] 1.0412-Sep-2012 2203 Initial 2.8 [0.81]12-Sep-2012 2203 Control 2.5 [0.89] �0.10012-Sep-2012 2203 f/20 2.7 [0.21] �0.02612-Sep-2012 2205 Initial 5.1 [0.51]12-Sep-2012 2205 Control 6.7 [0.71] 0.26612-Sep-2012 2205 f/20 12 [1.01] 0.898
17-Oct-2012 2203 Initial 1.6 [0.75]17-Oct-2012 2203 Control 1.9 [0.65] 0.16817-Oct-2012 2203 Ammonium 6.2 [ 0.73] 1.3617-Oct-2012 2203 f/20 6.6 [1.3] 1.4317-Oct-2012 2205 Initial 0.51 [0.45]17-Oct-2012 2205 Control 0.88 [0.14] 0.54417-Oct-2012 2205 Ammonium 0.83 [0.31] 0.49017-Oct-2012 2205 f/20 0.71 [0.37] 0.324
R.M. Kudela et al. / Estuarine, Coastal and Shelf Science xxx (2015) 1e148
Please cite this article in press as: Kudela, R.M., et al., Death from below: Investigation of inhibitory factors in bloom development during awastewater effluent diversion, Estuarine, Coastal and Shelf Science (2015), http://dx.doi.org/10.1016/j.ecss.2015.07.021

Fig. 5. Variable fluorescence at 24 h (A) and calculated growth rates (B) for the 6November 2012 field experiment. Error bars in (A) indicate the minimum andmaximum yield for 24, 48, and 72 h; error bars in (B) are based on the standard error ofthe linear regression slope. The hypochlorite þ effluent treatment exhibited signifi-cantly lower variable fluorescence (t-test, p < 0.05) compared to all other treatments,while for growth the hypochlorite þ effluent treatment was significantly or nearlysignificantly lower (ANCOVA, p < 0.1) for all treatments (see main text for details).
Fig. 6. rETR curves for (A) the 6 November 2012 field experiment and (B) the 10 June2013 laboratory experiment. H ¼ Hypochlorite; EH ¼ Effluent þ Hypochlorite;EHB ¼ Effluent þ Hypochlorite þ Bisulfite. Panel A provides data from the 24 h timepoint; Panel B provides data from the time series, with curves annotated.
R.M. Kudela et al. / Estuarine, Coastal and Shelf Science xxx (2015) 1e14 9
significantly different for all other treatments, but were reduced30e70% at 24, 48, and 72 h (Fig. 6A). There was a correspondingdecrease in a for the effluent plus hypochlorite treatment rangingfrom 24 to 75%, while other treatments were not significantlydifferent.
Please cite this article in press as: Kudela, R.M., et al., Death from belowwastewater effluent diversion, Estuarine, Coastal and Shelf Science (2015
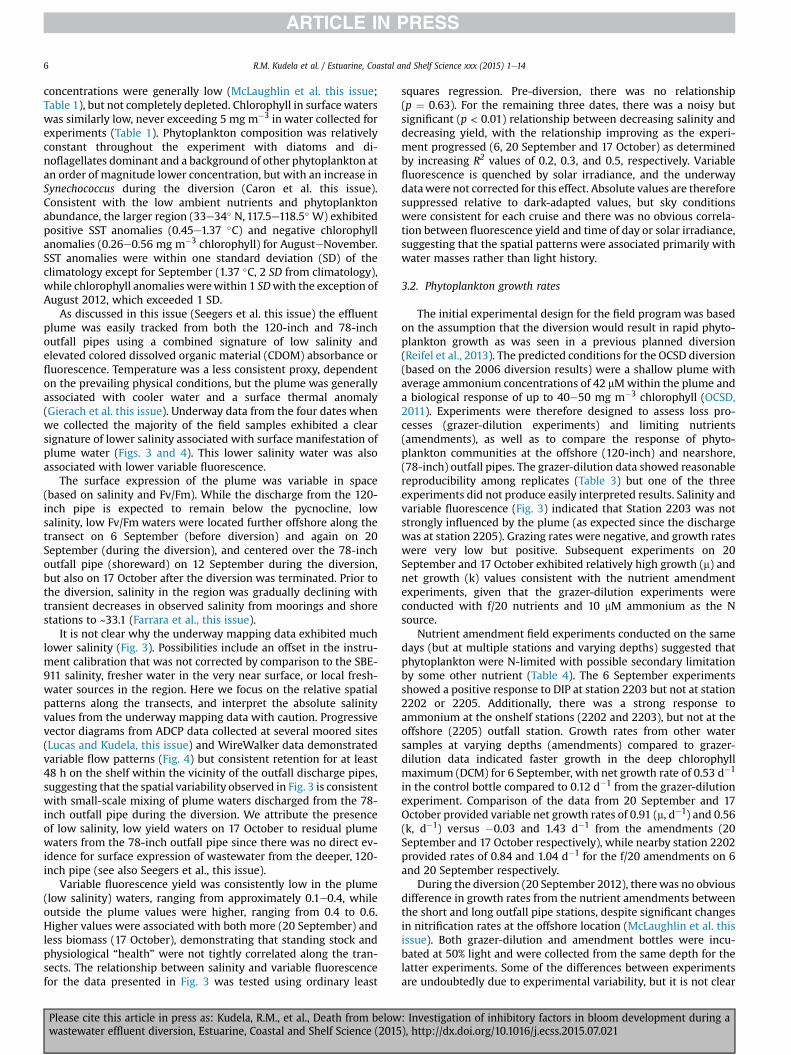
A series of experiments conducted with water from the SantaCruz Municipal Wharf corroborated these initial findings. The 10June 2013 experiment included finer temporal sampling to deter-mine how quickly the negative photophysiological response toeffluent plus hypochlorite occurs. There was a gradual recovery ofphotosynthetic competence as determined from rETR curves con-ducted for 24 h after exposure to hypochlorite and effluent (Fig. 6B).Separate analysis of variable fluorescence from the treatedseawater exhibited a decrease after 4 h relative to the control (buthad not decreased at 90 min) and continued to decrease over thefirst 24 h, followed by recovery at 48 h. Biomass (as extractedchlorophyll) decreased in the control, increased dramatically withthe addition of effluent, hypochlorite, and bisulfite, and decreasedat a more rapid rate than the control over the 48 h for the effluentplus hypochlorite treatment (Fig. 7). Thus physiological impairmentof photosynthesis was alleviated between 24 and 48 h after expo-sure (faster for aged effluent plus hypochlorite; not shown), butbiomass and corresponding growth rate did not show an equivalentrecovery.
: Investigation of inhibitory factors in bloom development during a), http://dx.doi.org/10.1016/j.ecss.2015.07.021
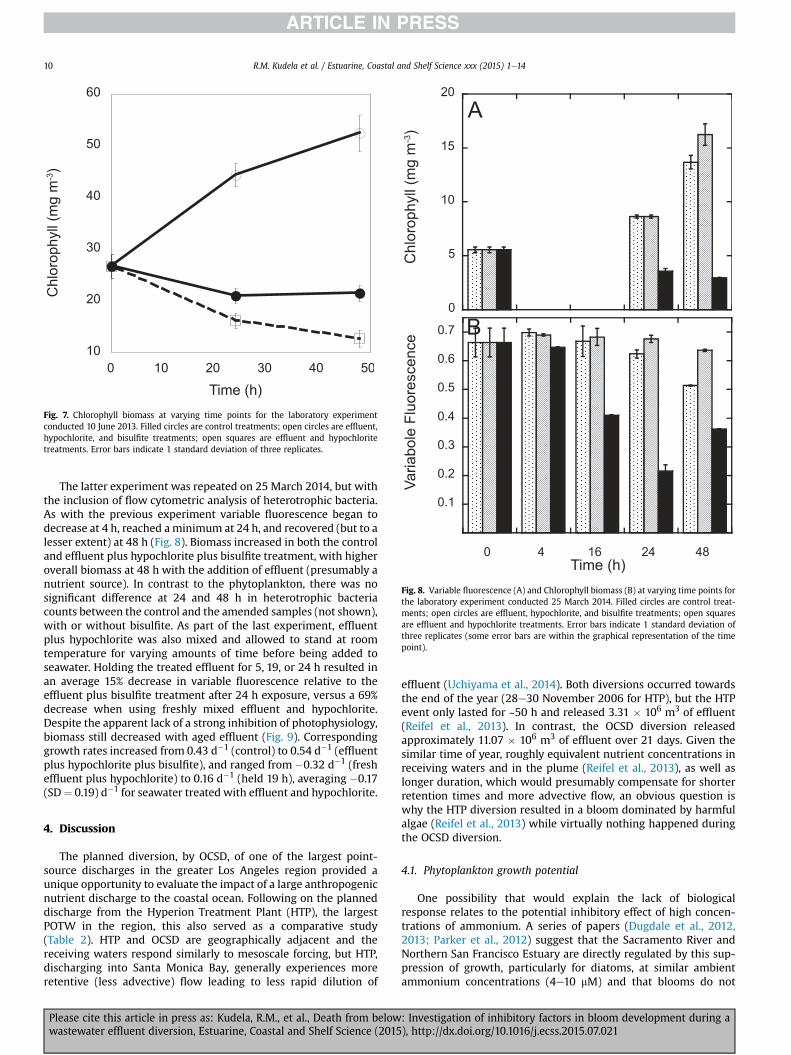
Fig. 7. Chlorophyll biomass at varying time points for the laboratory experimentconducted 10 June 2013. Filled circles are control treatments; open circles are effluent,hypochlorite, and bisulfite treatments; open squares are effluent and hypochloritetreatments. Error bars indicate 1 standard deviation of three replicates.
Fig. 8. Variable fluorescence (A) and Chlorophyll biomass (B) at varying time points forthe laboratory experiment conducted 25 March 2014. Filled circles are control treat-ments; open circles are effluent, hypochlorite, and bisulfite treatments; open squaresare effluent and hypochlorite treatments. Error bars indicate 1 standard deviation ofthree replicates (some error bars are within the graphical representation of the timepoint).
R.M. Kudela et al. / Estuarine, Coastal and Shelf Science xxx (2015) 1e1410
The latter experiment was repeated on 25 March 2014, but withthe inclusion of flow cytometric analysis of heterotrophic bacteria.As with the previous experiment variable fluorescence began todecrease at 4 h, reached aminimum at 24 h, and recovered (but to alesser extent) at 48 h (Fig. 8). Biomass increased in both the controland effluent plus hypochlorite plus bisulfite treatment, with higheroverall biomass at 48 h with the addition of effluent (presumably anutrient source). In contrast to the phytoplankton, there was nosignificant difference at 24 and 48 h in heterotrophic bacteriacounts between the control and the amended samples (not shown),with or without bisulfite. As part of the last experiment, effluentplus hypochlorite was also mixed and allowed to stand at roomtemperature for varying amounts of time before being added toseawater. Holding the treated effluent for 5, 19, or 24 h resulted inan average 15% decrease in variable fluorescence relative to theeffluent plus bisulfite treatment after 24 h exposure, versus a 69%decrease when using freshly mixed effluent and hypochlorite.Despite the apparent lack of a strong inhibition of photophysiology,biomass still decreased with aged effluent (Fig. 9). Correspondinggrowth rates increased from 0.43 d�1 (control) to 0.54 d�1 (effluentplus hypochlorite plus bisulfite), and ranged from �0.32 d�1 (fresheffluent plus hypochlorite) to 0.16 d�1 (held 19 h), averaging �0.17(SD¼ 0.19) d�1 for seawater treated with effluent and hypochlorite.
4. Discussion
The planned diversion, by OCSD, of one of the largest point-source discharges in the greater Los Angeles region provided aunique opportunity to evaluate the impact of a large anthropogenicnutrient discharge to the coastal ocean. Following on the planneddischarge from the Hyperion Treatment Plant (HTP), the largestPOTW in the region, this also served as a comparative study(Table 2). HTP and OCSD are geographically adjacent and thereceiving waters respond similarly to mesoscale forcing, but HTP,discharging into Santa Monica Bay, generally experiences moreretentive (less advective) flow leading to less rapid dilution of
Please cite this article in press as: Kudela, R.M., et al., Death from belowwastewater effluent diversion, Estuarine, Coastal and Shelf Science (2015
effluent (Uchiyama et al., 2014). Both diversions occurred towardsthe end of the year (28e30 November 2006 for HTP), but the HTPevent only lasted for ~50 h and released 3.31 � 106 m3 of effluent(Reifel et al., 2013). In contrast, the OCSD diversion releasedapproximately 11.07 � 106 m3 of effluent over 21 days. Given thesimilar time of year, roughly equivalent nutrient concentrations inreceiving waters and in the plume (Reifel et al., 2013), as well aslonger duration, which would presumably compensate for shorterretention times and more advective flow, an obvious question iswhy the HTP diversion resulted in a bloom dominated by harmfulalgae (Reifel et al., 2013) while virtually nothing happened duringthe OCSD diversion.
4.1. Phytoplankton growth potential
One possibility that would explain the lack of biologicalresponse relates to the potential inhibitory effect of high concen-trations of ammonium. A series of papers (Dugdale et al., 2012,2013; Parker et al., 2012) suggest that the Sacramento River andNorthern San Francisco Estuary are directly regulated by this sup-pression of growth, particularly for diatoms, at similar ambientammonium concentrations (4e10 mM) and that blooms do not
: Investigation of inhibitory factors in bloom development during a), http://dx.doi.org/10.1016/j.ecss.2015.07.021
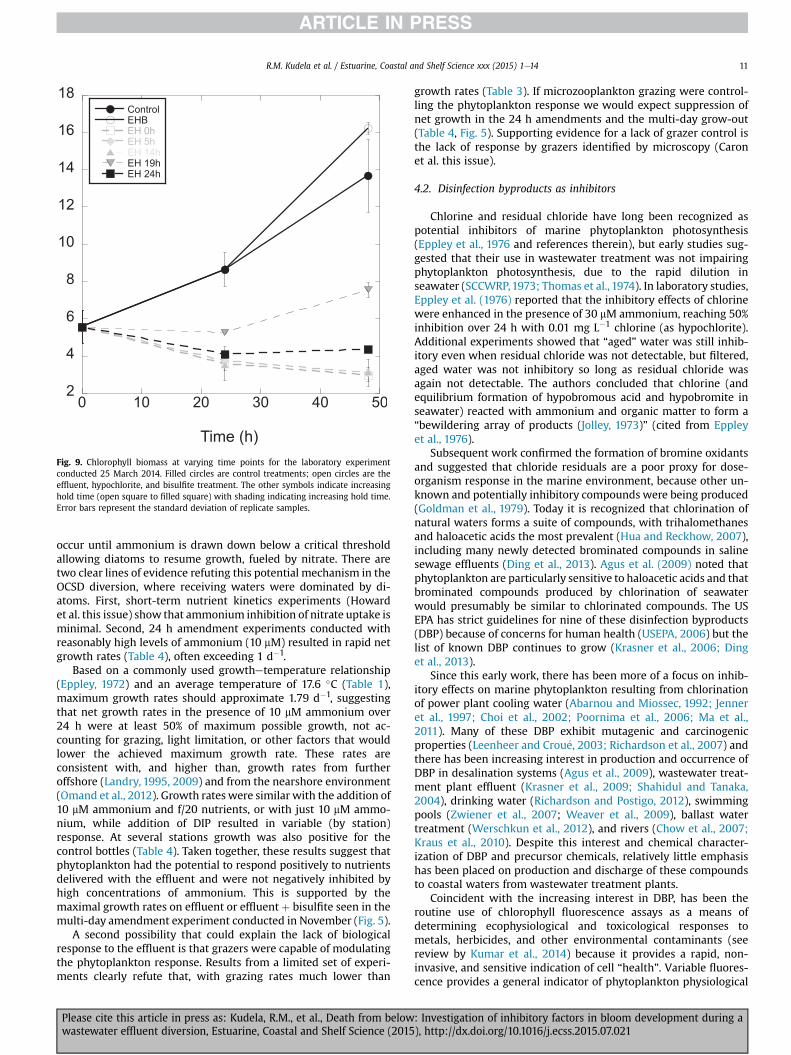
Fig. 9. Chlorophyll biomass at varying time points for the laboratory experimentconducted 25 March 2014. Filled circles are control treatments; open circles are theeffluent, hypochlorite, and bisulfite treatment. The other symbols indicate increasinghold time (open square to filled square) with shading indicating increasing hold time.Error bars represent the standard deviation of replicate samples.
R.M. Kudela et al. / Estuarine, Coastal and Shelf Science xxx (2015) 1e14 11
occur until ammonium is drawn down below a critical thresholdallowing diatoms to resume growth, fueled by nitrate. There aretwo clear lines of evidence refuting this potential mechanism in theOCSD diversion, where receiving waters were dominated by di-atoms. First, short-term nutrient kinetics experiments (Howardet al. this issue) show that ammonium inhibition of nitrate uptake isminimal. Second, 24 h amendment experiments conducted withreasonably high levels of ammonium (10 mM) resulted in rapid netgrowth rates (Table 4), often exceeding 1 d�1.
Based on a commonly used growthetemperature relationship(Eppley, 1972) and an average temperature of 17.6 �C (Table 1),maximum growth rates should approximate 1.79 d�1, suggestingthat net growth rates in the presence of 10 mM ammonium over24 h were at least 50% of maximum possible growth, not ac-counting for grazing, light limitation, or other factors that wouldlower the achieved maximum growth rate. These rates areconsistent with, and higher than, growth rates from furtheroffshore (Landry, 1995, 2009) and from the nearshore environment(Omand et al., 2012). Growth rates were similar with the addition of10 mM ammonium and f/20 nutrients, or with just 10 mM ammo-nium, while addition of DIP resulted in variable (by station)response. At several stations growth was also positive for thecontrol bottles (Table 4). Taken together, these results suggest thatphytoplankton had the potential to respond positively to nutrientsdelivered with the effluent and were not negatively inhibited byhigh concentrations of ammonium. This is supported by themaximal growth rates on effluent or effluent þ bisulfite seen in themulti-day amendment experiment conducted in November (Fig. 5).
A second possibility that could explain the lack of biologicalresponse to the effluent is that grazers were capable of modulatingthe phytoplankton response. Results from a limited set of experi-ments clearly refute that, with grazing rates much lower than
Please cite this article in press as: Kudela, R.M., et al., Death from belowwastewater effluent diversion, Estuarine, Coastal and Shelf Science (2015
growth rates (Table 3). If microzooplankton grazing were control-ling the phytoplankton response we would expect suppression ofnet growth in the 24 h amendments and the multi-day grow-out(Table 4, Fig. 5). Supporting evidence for a lack of grazer control isthe lack of response by grazers identified by microscopy (Caronet al. this issue).
4.2. Disinfection byproducts as inhibitors
Chlorine and residual chloride have long been recognized aspotential inhibitors of marine phytoplankton photosynthesis(Eppley et al., 1976 and references therein), but early studies sug-gested that their use in wastewater treatment was not impairingphytoplankton photosynthesis, due to the rapid dilution inseawater (SCCWRP,1973; Thomas et al., 1974). In laboratory studies,Eppley et al. (1976) reported that the inhibitory effects of chlorinewere enhanced in the presence of 30 mM ammonium, reaching 50%inhibition over 24 h with 0.01 mg L�1 chlorine (as hypochlorite).Additional experiments showed that “aged” water was still inhib-itory even when residual chloride was not detectable, but filtered,aged water was not inhibitory so long as residual chloride wasagain not detectable. The authors concluded that chlorine (andequilibrium formation of hypobromous acid and hypobromite inseawater) reacted with ammonium and organic matter to form a“bewildering array of products (Jolley, 1973)” (cited from Eppleyet al., 1976).
Subsequent work confirmed the formation of bromine oxidantsand suggested that chloride residuals are a poor proxy for dose-organism response in the marine environment, because other un-known and potentially inhibitory compounds were being produced(Goldman et al., 1979). Today it is recognized that chlorination ofnatural waters forms a suite of compounds, with trihalomethanesand haloacetic acids the most prevalent (Hua and Reckhow, 2007),including many newly detected brominated compounds in salinesewage effluents (Ding et al., 2013). Agus et al. (2009) noted thatphytoplankton are particularly sensitive to haloacetic acids and thatbrominated compounds produced by chlorination of seawaterwould presumably be similar to chlorinated compounds. The USEPA has strict guidelines for nine of these disinfection byproducts(DBP) because of concerns for human health (USEPA, 2006) but thelist of known DBP continues to grow (Krasner et al., 2006; Dinget al., 2013).
Since this early work, there has been more of a focus on inhib-itory effects on marine phytoplankton resulting from chlorinationof power plant cooling water (Abarnou and Miossec, 1992; Jenneret al., 1997; Choi et al., 2002; Poornima et al., 2006; Ma et al.,2011). Many of these DBP exhibit mutagenic and carcinogenicproperties (Leenheer and Crou�e, 2003; Richardson et al., 2007) andthere has been increasing interest in production and occurrence ofDBP in desalination systems (Agus et al., 2009), wastewater treat-ment plant effluent (Krasner et al., 2009; Shahidul and Tanaka,2004), drinking water (Richardson and Postigo, 2012), swimmingpools (Zwiener et al., 2007; Weaver et al., 2009), ballast watertreatment (Werschkun et al., 2012), and rivers (Chow et al., 2007;Kraus et al., 2010). Despite this interest and chemical character-ization of DBP and precursor chemicals, relatively little emphasishas been placed on production and discharge of these compoundsto coastal waters from wastewater treatment plants.
Coincident with the increasing interest in DBP, has been theroutine use of chlorophyll fluorescence assays as a means ofdetermining ecophysiological and toxicological responses tometals, herbicides, and other environmental contaminants (seereview by Kumar et al., 2014) because it provides a rapid, non-invasive, and sensitive indication of cell “health”. Variable fluores-cence provides a general indicator of phytoplankton physiological
: Investigation of inhibitory factors in bloom development during a), http://dx.doi.org/10.1016/j.ecss.2015.07.021

R.M. Kudela et al. / Estuarine, Coastal and Shelf Science xxx (2015) 1e1412
status and ranges from 0 (senescent or dead) to ~0.7 (maximalvalue for phytoplankton); it can also be used to describe thephotosynthesis-irradiance response (e.g. Kromkamp and Forster,2003). It is a sensitive indicator of nutrient stress (e.g. Beardallet al., 2001) and is often used as an ecotoxicological assay forvarious metals, petrochemicals, and herbicides (Kumar et al., 2014;Ralph et al., 2007).
Of relevance to this study, Ma et al. (2011) examined the impactof residual chloride on the marine diatom Phaeodactylum tri-cornutum using a PAM fluorometer system to monitor changes inyield and rETR. They reported a sharp decrease in yield and rETR atchloride concentrations of 0.4 mg L�1. In contrast, we saw no sig-nificant change in yield or rETR parameters (Fig. 6A) for the hy-pochlorite treatment from 6 November 2012 (nominally0.69 mg L�1 but this did not account for the chloride demand fromthe ambient organic material in the seawater). Under typicaldischarge conditions, it is unlikely that residual chloride, despitethe relatively high concentrations in the concentrated effluent(Fig. 2B), had any direct impact on the phytoplankton in receivingwaters. However, when hypochlorite was mixed with effluent,there was a consistent decrease in both yield and rETR parameters(Figs. 5e8). This is consistent with the production of DBP with toxicor inhibitory effects on phytoplankton photosynthesis independentof residual chloride concentration.
Inhibition of yield occurred at least 4 h after addition of theeffluent plus hypochlorite (Fig. 7), and the photophysiologicalresponse could be neutralized by addition of bisulfite or byholding the effluent plus hypochlorite for several hours. However,while the fluorescence response recovered, effluent plus hypo-chlorite continued to inhibit biomass accumulation (growth) whenthe effluent plus hypochlorite was held for up to 24 h beforeaddition to seawater (Fig. 9). This is consistent with other studiesthat showed inhibition of chlorinated estuarine water after agingfor 24 h (Eppley et al., 1976) and between 10 and 35 d (Sanders,1984).
We did not directly measure DBP or residual chloride inreceiving waters around the outfalls, but several lines of evidencesuggest that inhibitory compounds were present long enough toimpact the phytoplankton in the region. Surface mapping of vari-able fluorescence (Fig. 3) shows a consistent relationship with lowyield associated with lower salinity water. Progressive vector dia-grams (Lucas and Kudela, this issue) and modeling studies(Uchiyama et al., 2014) suggest that compounds released with theeffluent would be retained on the shelf for several days. Addition ofeffluent or nitrogen as ammonium to seawater samples duringamendment experiments exhibit positive growth, while the gen-eral region surrounding the outfalls were anomalously low inbiomass and productivity during the study period. And finally,there was evidence for suppressed yield (Fig. 3) both before thediversion (but after initiation of enhanced chlorination), and afterthe diversion; the continued association between lower salinitywaters and reduced yield suggests that either DBP were still beingproduced after the diversion, or that the inhibitory compoundswere still present 15 days after the effluent was diverted back to the5-mile pipe.
While limited, the results from the 25 March 2014 laboratorystudy suggest that the inhibition of phytoplankton in the presenceof DBP was not seen for the heterotrophic bacteria community. At24 and 48 h therewas no significant decline in bacterial abundance;counts were actually enhanced at 24 h relative to the control andeffluent, hypochlorite, and bisulfite treatments. This may partiallyexplain the apparent paradox of the 2012 diversion, with largequantities of ammonium released and retained over the coastalshelf but with no phytoplankton bloom. If the heterotrophic bac-teria were less impacted, then biological utilization and
Please cite this article in press as: Kudela, R.M., et al., Death from belowwastewater effluent diversion, Estuarine, Coastal and Shelf Science (2015
biogeochemical conversion could conceivably account for the“missing” nitrogen (McLaughlin et al., Caron et al., this issue).
4.3. Ecological and management implications
Returning to the comparison between the HTP and OCSD di-versions, we propose that the most consistent explanation for thedramatically different biological response is the formation of DBP athigher than normal rates due to enhanced chlorination, combinedwith the surface expression and retention of the plume at theshallower coastal site. This leads to the conclusion that productionof DBP may have mitigated any phytoplankton response to thediversion, including a potential harmful algal bloom, seen in theHTP study (Reifel et al., 2013), but increased the risk of exposure totoxic, mutagenic, and carcinogenic compounds. OCSD implementedenhanced chlorination to mitigate potential impacts of fecal indi-cator bacteria and associated pathogens. While this was successful,with FIB counts remaining below State of California water contractstandards during the diversion (Rogowski et al., 2014), it clearly hadan unintended impact on biomass and productivity of receivingwaters. As has been recommended elsewhere (e.g. Kumar et al.2014), the use of chlorophyll fluorescence may provide a rapidand sensitive monitoring tool to assess the impact of the potentiallylarge suite of disinfection byproducts released from wastewatertreatment plants from the chlorination process on the phyto-plankton assemblage. Management of future planned diversions aswell as normal operations for wastewater treatment plants shouldtake into account the potential impact of DBP on receiving waters,especially because monitoring of residual chloride likely provides apoor indication of impacts on the phytoplankton community.
Acknowledgments
We thank the many other participants in the OCSD Diversionsampling effort and OCSD staff including Mike VonWinkleman,Samuel Choi, Kathy Waldron, Michael Mengel, and Lee Lindel.George Robertson (OCSD) in particular was instrumental in makingthis project possible. We also thank two anonymous reviewers andguest editor Larry Harding, whose comments helped to improvethe manuscript. Funding for this study was provided by the Na-tional Science Foundation through RAPID award OCE1251573 (RMKand AJL), the NOAA ECOHAB program through awardNA11NOS4780030 (RMK andMDH), the Southern California CoastalWater Research Project Authority, and as in-kind support from theOrange County Sanitation District for access to research vessels andfield sampling equipment. This is NOAA ECOHAB PublicationNumber 818.
References
Abarnou, A., Miossec, L., 1992. Chlorinated waters discharged to the marine envi-ronment chemistry and environmental impact. An overview. Sci. Total Environ.126, 173e197.
Agus, E., Voutchkov, N., Sedlak, D.L., 2009. Disinfection by-products and their po-tential impact on the quality of water produced by desalination systems: aliterature review. Desalination 237, 214e237.
Anderson, D.M., Glibert, P.M., Burkholder, J.M., 2002. Harmful algal blooms andeutrophication: nutrient sources, composition, and consequences. Estuaries 25,704e726.
APHA (American Public Health Association), 1995. Standard Methods for the Ex-amination of Water and Wastewater, nineteenth ed. APHA, Washington, DC,USA.
Beardall, J., Young, E., Roberts, S., 2001. Approaches for determining phytoplanktonnutrient limitation. Aquat. Sci. 63, 44e69.
Boehm, A.B., Grant, S.B., Kim, J.H., Mowbray, S.L., McGee, C.D., Clark, C.D.,Foley, D.M., Wellman, D.E., 2002. Decadal and shorter period variability of surfzone water quality at Huntington Beach, California. Environ. Sci. Technol. 36,3885e3892.
Choi, D.H., Park, J.S., Hwang, C.Y., Huh, S.H., Cho, B.C., 2002. Effects of thermal
: Investigation of inhibitory factors in bloom development during a), http://dx.doi.org/10.1016/j.ecss.2015.07.021

R.M. Kudela et al. / Estuarine, Coastal and Shelf Science xxx (2015) 1e14 13
effluents from a power station on bacteria and heterotrophic nanoflagellates incoastal waters. Mar. Ecol. Prog. Ser. 229, 1e10.
Chow, A.T., Dahlgren, R.A., Harrison, J.A., 2007. Watershed sources of disinfectionbyproduct precursors in the Sacramento and San Joaquin rivers, California.Environ. Sci. Technol. 41, 7645e7652.
Corcoran, A.A., Reifel, K.M., Jones, B.H., Shipe, R.F., 2010. Spatiotemporal develop-ment of physical, chemical, and biological characteristics of stormwater plumesin Santa Monica Bay, California (USA). J. Sea Res. 63, 129e142.
Diaz, R.J., Rosenberg, R., 2008. Spreading dead zones and consequences for marineecosystems. Science 321, 926e929.
Ding, G., Zhang, X., Yang, M., Pan, Y., 2013. Formation of new brominated disin-fection byproducts during chlorination of saline sewage effluents. Water Res.47, 2710e2718.
Dugdale, R., Wilkerson, F., Parker, A.E., Marchi, A., Taberski, K., 2012. River flow andammonium discharge determine spring phytoplankton blooms in an urbanizedestuary. Est. Coast Shelf Sci. 115, 187e199.
Dugdale, R.C., Wilkerson, F.P., Parker, A.E., 2013. A biogeochemical model ofphytoplankton productivity in an urban estuary: the importance of ammoniumand freshwater flow. Ecol. Model. 263, 291e307.
Eppley, R.W., 1972. Temperature and phytoplankton growth in the sea. Fish. Bull. 70,1068e1085.
Eppley, R.W., Renger, E.H., Williams, P.M., 1976. Chlorine reactions with seawaterconstituents and the inhibition of photosynthesis of natural marine phyto-plankton. Est. Coast Mar. Sci. 4, 147e161.
Farrara, J.D., Chao, Y., Zhang, H., Seegers, B.N., Teel, E.N., Caron, D.A., Howard, M.,Jones, B.H., Robertson, G., Rogowski, P., Terrrill, E., 2015. Oceanographic condi-tions during the Orange County Sanitation District diversion experiment asrevealed by observations and model simulations. Estuar. Coast. Shelf Sci. (in thisissue).
Gallegos, C.L., 1989. Microzooplankton grazing on phytoplankton in the RhodeRiver, Maryland: nonlinear feeding kinetics. Mar. Ecol. Prog. Ser. 57, 23e33.
Gierach, M.M., Holt, B., Trinh, R., Pan, B., Rains, C., 2014. Satellite detection ofwastewater diversion plumes in Southern California. Est. Coast Shelf Sci. (in thisissue).
Goldman, J.C., Quinny, H.L., Capuzzo, J., 1979. Chlorine disappearance in sea-water.Water Res. 13, 315e323.
Guillard, R.R.L., 1975. Culture of phytoplankton for feeding marine invertebrates. In:Culture of Marine Invertebrate Animals. Springer, US, pp. 29e60.
Heisler, J., Glibert, P.M., Burkholder, J.M., Anderson, D.M., Cochlan, W.,Dennison, W.C., Dortch, Q., Gobler, C.J., Heil, C.A., Humphries, E., Lewitus, A.,Magnien, R., Marshall, H.G., Sellner, K., Stockwell, D.A., Stoecker, D.K.,Suddleson, M., 2008. Eutrophication and harmful algal blooms: a scientificconsensus. Harmful Algae 8, 3e13.
Howard, M., Sutula, M., Caron, D.A., Chao, Y., Farrara, J.D., 2014. Anthropogenicnutrient sources rival natural sources on small scales in the coastal waters ofthe Southern California Bight. Limnol. Oceanogr. 99, 285e297.
Howarth, R.W., 2008. Coastal nitrogen pollution: a review of sources and trendsglobally and regionally. Harmful Algae 8, 14e20.
Hua, G., Reckhow, D.A., 2007. Comparison of disinfection byproduct formation fromchlorine and alternative disinfectants. Water Res. 41, 1667e1678.
Islam, M.S., Tanaka, M., 2004. Impacts of pollution on coastal and marine ecosys-tems including coastal and marine fisheries and approach for management: areview and synthesis. Mar. Pollut. Bulletin 48, 624e649.
Jassby, A.D., Platt, T., 1976. Mathematical formulation of the relationship betweenphotosynthesis and light for phytoplankton. Limnol. Oceanogr. 21, 540e547.
Jenner, H.A., Taylor, C.J.L., Van Donk, M., Khalanski, M., 1997. Chlorination by-products in chlorinated cooling water of some European coastal power sta-tions. Mar. Environ. Res. 43, 279e293.
Jolley, R.L., 1973. Chlorination Effects on Organic Constituents in Effluents fromDomestic Sanitary Waste Treatment Plants. ORNL-TM-4290 Oak Ridge NationalLaboratory.
Krasner, S.W., Weinberg, H.S., Richardson, S.D., Pastor, S.J., Chinn, R., Sclimenti, M.J.,Onstad, G.D., Thruston, A.D., 2006. Occurrence of a new generation of disin-fection byproducts. Environ. Sci. Technol. 40, 7175e7185.
Krasner, S.W., Westerhoff, P., Chen, B., Rittmann, B.E., Amy, G., 2009. Occurrence ofdisinfection byproducts in United States wastewater treatment plant effluents.Environ. Sci. Technol. 43, 8320e8325.
Kraus, T.E.C., Anderson, C.A., Morgenstern, K., Downing, B.D., Pellerin, B.A.,Bergamaschi, B.A., 2010. Determining sources of dissolved organic carbon anddisinfection byproduct precursors to the McKenzie River, Oregon. J. Environ.Qual. 39, 2100e2112.
Kromkamp, J.C., Forster, R.M., 2003. The use of variable fluorescence measurementsin aquatic ecosystems: differences between multiple and single turnovermeasuring protocols and suggested terminology. Eur. J. Phycol. 38, 103e112.
Kudela, R.M., Ryan, J.P., Blakely, M.D., Lane, J.Q., Peterson, T.D., 2008. Linking thephysiology and ecology of Cochlodinium to better understand harmful algalbloom events: a comparative approach. Harmful Algae 7, 278e292.
Kudela, R.M., Seeyave, S., Cochlan, W.P., 2010. The role of nutrients in regulation andpromotion of harmful algal blooms in upwelling systems. Prog. Oceanogr. 85,122e135.
Kumar, K.S., Dahms, H.U., Lee, J.S., Kim, H.C., Lee, W.C., Shin, K.H., 2014. Algalphotosynthetic responses to toxic metals and herbicides assessed by chloro-phyll a fluorescence. Ecotoxicol. Environ. Saf. 104, 51e71.
Landry, M., 1995. Zooplankton grazing, phytoplankton growth, and export flux:inferences from chlorophyll tracer methods. ICES J. Mar. Sci. 52, 337e345.
Please cite this article in press as: Kudela, R.M., et al., Death from belowwastewater effluent diversion, Estuarine, Coastal and Shelf Science (2015
Landry, M.R., Ohman, M.D., Goericke, R., Stukel, M.R., Tsyrklevich, K., 2009.Lagrangian studies of phytoplankton growth and grazing relationships in acoastal upwelling ecosystem off Southern California. Prog. Oceanogr. 83,208e216.
Lane, J.Q., Raimondi, P.T., Kudela, R.M., 2009. Development of a logistic regressionmodel for the prediction of toxigenic Pseudo-nitzschia blooms in Monterey Bay,California. Mar. Ecol. Prog. Ser. 383, 37e51.
Leenheer, J.A., Crou�e, J.-P., 2003. Peer reviewed: characterizing aquatic dissolvedorganic matter. Environ. Sci. Technol. 37, 18Ae26A.
Lucas, A.J., Kudela, R.M., 2015. The fine-scale vertical variability of a wastewaterdischarge plume in stratified waters. Estuar. Coast. Shelf Sci. (in this issue).
Lyon, G., Sutula, M., 2011. In: Schiff, K.C., Miller, K. (Eds.), Effluent Discharges to theSouthern California Bight from Large Municipal Wastewater Treatment Facil-ities from 2005 to 2009. Southern California Coastal Water Research ProjectAnnual Report, Costa Mesa, CA.
Ma, Z., Gao, K., Li, W., Xu, Z., Lin, H., Zheng, Y., 2011. Impacts of chlorination and heatshocks on growth, pigments and photosynthesis of Phaeodactylum tricornutum(Bacillariophyceae). J. Exp. Mar. Biol. Ecol. 397, 214e219.
McLaughlin, K., Howard, M.D.A., Beck, C.D.A., Kudela, R., Nezlin, N., Robertson, G.,2015. Tracking the fate of anthropogenic nitrogen from wastewater dischargeinto the coastal ocean, Southern California, USA. Estuar. Coast. Shelf Sci. (in thisissue).
Noble, M., Xu, J., 2004. Huntington Beach Shoreline Contamination Investigation,Phase III, Final Report, Coastal Circulation and Transport Patterns: The Likeli-hood of OCSD's Plume Impacting Huntington Beach Shoreline. USGS Open-FileReport 2004-1019, Vers. 1.0. Available from. http://pubs.usgs.gov/of/2004/1019.
OCSD, 2011. Outfall Land Section and OOBS Piping Rehabilitation Draft Environ-mental Impact Report, vol. 2. Appendices. Available online: http://www.ocsd.com/Home/ShowDocument?id¼10785 (accessed 03.10.14.).
Omand, M.M., Feddersen, F., Guza, R.T., Franks, P.J.S., 2012. Episodic vertical nutrientfluxes and nearshore phytoplankton blooms in Southern California. Limnol.Oceanogr. 57, 1673e1688.
Parker, A.E., Dugdale, R.C., Wilkerson, F.P., 2012. Elevated ammonium concentra-tions from wastewater discharge depress primary productivity in the Sacra-mento River and the Northern San Francisco Estuary. Mar. Poll. Bull. 64,574e586.
Peacock, M.B., Kudela, R.M., 2012. A method for determining alkaline phosphataseactivity in marine phytoplankton using spectrofluorometry. J. Microbiol.Methods 89, 209e212.
Pinkel, R., Goldin, M.A., Smith, J.A., Sun, O.M., Aja, A.A., Bui, M.N., Hughen, T., 2011.The wirewalker: a vertically profiling instrument carrier powered by oceanwaves. J. Atmos. Ocean. Technol. 28, 426e435.
Poornima, E.H., Rajadurai, M., Rao, V.N.R., Narasimhan, S.V., Venugopalan, V.P.,2006. Use of coastal waters as condenser coolant in electric power plants:impact on phytoplankton and primary productivity. J. Therm. Biol. 31, 556e564.
Parsons, T., Takahashi, M., Hargrave, B., 1984. Biological Oceanographic Processes,3rd ed. Pergamon Press, England, p. 330.
Ralph, P.J., Smith, R.A., Macinnis-Ng, C.M.O., Seery, C.R., 2007. Use of fluorescence-based ecotoxicological bioassays in monitoring toxicants and pollution inaquatic systems: review. Toxicol. Environ. Chem. 89, 589e607.
Reifel, K.M., Corcoran, A.A., Cash, C., Shipe, R., Jones, B.H., 2013. Effects of a surfacingeffluent plume on a coastal phytoplankton community. Cont. Shelf Res. 60,38e50.
Reifel, K.M., Johnson, S.C., DiGiacomo, P.M., Mengel, M.J., Nezlin, N.P., Warrick, J.A.,Jones, B.H., 2009. Impacts of stormwater runoff in the Southern California Bight:relationships among plume constituents. Cont. Shelf Res. 29, 1821e1835.
Richardson, S., Plewa, M., Wagner, E., Schoeny, R., Demarini, D., 2007. Occurrence,genotoxicity, and carcinogenicity of regulated and emerging disinfection by-products in drinking water: a review and roadmap for research. Mutat. Res./Rev. Mutat. Res. 636, 178e242.
Rogowski, P., Terrill, E., Thomas, J., Rosenfeld, L., Largier, J., 2014. 2012 OrangeCounty Sanitation District (OCSD) Outfall Diversionesummary Report. FinalReport prepared for the Orange County Sanitation District. March 25, 2014, 92pp, plus appendices.
Richardson, S.D., Postigo, C., 2012. Drinking water disinfection by-products. In:Emerging Organic Contaminants and Human Health. Springer Berlin Heidel-berg, pp. 93e137.
Sanders, J.G., 1984. The longevity of algal inhibition after chlorination of estuarinewater. Environ. Sci. Technol. 18, 383e385.
SCCWRP, 1973. The Ecology of the Southern California Bight: Implications for WaterQuality Management. Southern California Coastal Water Research Project, ElSegundo, California, p. 531.
Shahidul, I.M., Tanaka, M., 2004. Impacts of pollution on coastal and marine eco-systems including coastal and marine fisheries and approach for management:a review and synthesis. Mar. Poll. Bull. 48, 624e649.
Smith, V.H., Schindler, D.W., 2009. Eutrophication science: where do we go fromhere? Trends Ecol. Evol. 24, 201e207.
Thomas, W.H., Seibert, D.L.R., Dodson, A.N., 1974. Phytoplankton enrichment ex-periments and bioassays in natural coastal seawater and in sewage outfallreceiving waters off Southern California. Estuar. Coast. Shelf Sci. 2, 191e206.
Uchiyama, Y., Idica, E.Y., McWilliams, J.C., Stolzenbach, K.D., 2014. Wastewatereffluent dispersal in Southern California Bays. Cont. Shelf Res. 76, 36e52.
USEPA, 2006. Stage 2 Disinfectants and Disinfection Byproducts Rule. EPA-HQ-OW-2002-0043.
Weaver, W.A., Li, J., Wen, Y., Johnston, J., Blatchley, M.R., Blatchley III, E.R., 2009.
: Investigation of inhibitory factors in bloom development during a), http://dx.doi.org/10.1016/j.ecss.2015.07.021

R.M. Kudela et al. / Estuarine, Coastal and Shelf Science xxx (2015) 1e1414
Volatile disinfection by-product analysis from chlorinated indoor swimmingpools. Water Res. 43, 3308e3318.
Werschkun, B., Sommer, Y., Banerji, S., 2012. Disinfection by-products in ballastwater treatment: an evaluation of regulatory data. Water Res. 46, 4884e4901.
Worden, A.Z., Binder, B.J., 2003. Application of dilution experiments for measuring
Please cite this article in press as: Kudela, R.M., et al., Death from belowwastewater effluent diversion, Estuarine, Coastal and Shelf Science (2015
growth and mortality rates among Prochlorococcus and Synechococcus pop-ulations in oligotrophic environments. Aquat. Microb. Ecol. 30, 159e174.
Zwiener, C., Richardson, S.D., De Marini, D.M., Grummt, T., Glauner, T., Frimmel, F.H.,2007. Drowning in disinfection byproducts? Assessing swimming pool water.Environ. Sci. Technol. 41, 363e372.
: Investigation of inhibitory factors in bloom development during a), http://dx.doi.org/10.1016/j.ecss.2015.07.021