coastal and estuarine observing in north … and estuarine observing in north carolina ... coastal...
TRANSCRIPT

COASTAL AND ESTUARINE OBSERVING IN NORTH CAROLINA
INTEGRATING OBSERVATIONS & SCIENCE TO UNDERSTAND OUR
COASTAL ENVIRONMENT
Lynn Leonard, Department of Geography and Geology, UNC-W; Jennifer Dorton, Center for Marine Science, UNC-W; Stephen Culver, Department of Geological Sciences, ECU
Robert Christian, Department of Biology, ECU
With contributions by:Troy Alphin1, D. Reide Corbett2, Scott Curtis3, Greg Dusek4; David Eggleston5; Douglas Gamble6, Benjamin Horton7, Andrew Kemp7, Rick Luettich8, David Mallinson9; Richard Miller10; Michael O’Driscoll9, Steve Pfaff11, Martin Posey12, Stanley Riggs9, Harvey Seim4, J.P. Walsh2
1Center for Marine Science, UNC-W, 2Department of Geological Sciences and Institute for Coastal Science and Policy, ECU, 3Department of Geography, ECU, 4Department of Marine Sciences, UNC-CH, 5Center for Marine Sciences and Technologies, NCSU, 6Department of Geography and Geology, UNC-W, 7Department of Earth and Environmental Science, University of Pennsylvania, 8Institute of Marine Sciences, UNC-CH, 9Department of Geological Sciences, ECU, 10Department of Geological Sciences, ECU and UNC
Coastal Studies Institute, 11NOAA’s National Weather Service Office-Wilmington, 12Department of Biology and Marine Biology, UNC-W
COASTAL AND ESTUARINE OBSERVING IN NORTH CAROLINA

FRONT COVER PHOTOGRAPH. Coastal Ocean Research and Monitoring Program at the University of North Carolina Wilmington deploys a marine weather and oceanographic buoy from the RV Savannah. Photo UNCW/Jamie Moncrief.

COASTAL AND ESTUARINE OBSERVING IN NORTH CAROLINA:
INTEGRATING OBSERVATIONS AND SCIENCE TO UNDERSTAND OUR COASTAL
ENVIRONMENT
A White Paper by:
Lynn Leonard, Department of Geography and Geology, UNC-W ([email protected])Jennifer Dorton, Center for Marine Science, UNC-W ([email protected])Stephen Culver, Department of Geological Sciences, ECU ([email protected])
Robert Christian, Department of Biology, ECU ([email protected])
With contributions by:
Troy Alphin1, D. Reide Corbett2, Scott Curtis3, Greg Dusek4; David Eggleston5; Douglas Gamble6, Benjamin Horton7, Andrew Kemp7, Rick Luettich8, David Mallinson9; Richard Miller10; Michael O’Driscoll9, Steve
Pfaff11, Martin Posey12, Stanley Riggs9, Harvey Seim4, J.P. Walsh2
1Center for Marine Science, UNC-W, 2Department of Geological Sciences and Institute for Coastal Science and Policy, ECU, 3Department of Geography, ECU, 4Department of Marine Sciences, UNC-CH, 5Center for Marine Sciences and Technologies, NCSU, 6Department of Geography and Geology, UNC-W, 7Department of Earth and Environmental Science, University of Pennsylvania, 8Institute of Marine Sciences, UNC-CH, 9Department of Geological Sciences,
ECU, 10Department of Geological Sciences, ECU and UNC Coastal Studies Institute, 11NOAA’s National Weather Service Office-Wilmington, 12Department of Biology and Marine Biology, UNC-W

TAblE OF CONTENTs
INTRODUCTION .............................................................................................................................. 1
What is Coastal and Estuarine Observing? .................................................................... 1
Doesn’t an Observing System already exist? ............................................................... 2
Users of Coastal and Estuarine Observing Data and Information ....................... 3
PROTECTING lIVEs IN NORTH CAROlINA: APPlICATION OF COAsTAl
ObsERVING INFORMATION .................................................................................................... 3
Coastal Marine Forecasts and Predictions Powered by Coastal Observing
Efforts ................................................................................................................................... 3
Beach Hazards – Rip Currents ........................................................................................... 5
How rip currents work ............................................................................................... 6 Existing warnings – and room for improvements .............................................. 7ClIMATE CHANGE: HOW WIll ObsERVING HElP NORTH CAROlINA
UNDERsTAND POssIblE IMPACTs? ..................................................................................... 8
Past Conditions in Coastal North Carolina .................................................................... 9
The Present and Near Future Scenarios: ....................................................................... 9
Climate Change in Coastal North Carolina: Impact of Coastal Inundation and
Storms ................................................................................................................................. 11
COAsTAl ECOsYsTEMs: HOW DOEs COAsTAl ObsERVING CONTRIbUTE TO
sUsTAINING HEAlTHY COAsTAl ECOsYsTEMs IN NORTH CAROlINA? .......... 13
Effects of Climate Change in North Carolina’s Coastal and Estuarine
Ecosystems: Focus on the Albemarle-Pamlico System ................................... 14
How Does Monitoring Help? ............................................................................................. 16
FerryMon and ModMon: Evaluating Human and Climatically-Driven Impacts
on Water Quality and Fisheries Habitat in North Carolina’s Pamlico Sound
System ................................................................................................................................. 16
Southern and Central Coastal Ecosystems: Monitoring and Observing Efforts
Aimed at Understanding the Unique Habitats that Support our North
Carolina Tidal Creeks and Sounds ............................................................................. 19
CAsE sTUDIEs: HOW COAsTAl ObsERVING CAN CONTRIbUTE TO REsOURCE
MANAGEMENT IssUEs IN NORTH CAROlINA .............................................................. 22
Water Resources Management in Response to Climate Change ...................... 22
Barrier Island and Coastal Management in Response to Climate Change ..... 24
FINAl THOUGHTs: COsTs AND bENEFITs .................................................................... 27
ACKNOWlEDGEMENTs .......................................................................................................... 28
REFERENCEs CITED ................................................................................................................. 29
1
North Carolina’s estuaries and coastal ocean are ecologically diverse and economically important systems for the state. There are over 4000 miles of tidally-influenced shoreline in the Carolinas which includes the nation’s longest chain of barriers islands, extensive salt marshes, and freshwater marshes and swamps behind these islands. These environments support a range of essential economic activities, including coastal development, shipping and commerce, fishing, boating and tourism. The waterways and coastal ocean areas are vulnerable to a variety of natural and man-made hazards which regularly threaten resources, property and lives. The impacts related to these hazards include: fish kills, harmful algal blooms, oil and chemical spills, severe beach erosion, and inundation from storms and hurricanes. North Carolina ranks among the top states experiencing billion-dollar climate and weather disasters over the last three decades (http://www.ncdc.noaa.gov/img/reports/billion/state2008.pdf ). There is a compelling need to understand and predict estuarine and coastal maritime conditions so that tools can be developed to mitigate potential problems associated with coastal hazards. To do this requires the establishment of an observational network that provides routine, real-time, and archived information on water, weather, and environmental conditions in North Carolina’s estuaries and coastal waters.
What is Coastal and Estuarine Observing?
Coastal and estuarine observing systems couple data collected by platforms and sensors, with data analysis and modeling to provide information that describes the present state of our coastal waters, including its living resources. This improves our ability to rapidly detect changes in marine ecosystems and to predict and mitigate human and natural change.
Knowledge of physical, chemical, and biological conditions is needed at a variety of time and space scales - from seconds to years, and from inches to miles. Observations, such as sea surface temperature, dissolved oxygen, surface currents, wave heights, or wind speed, must be collected to feed models designed to understand and predict events of interest to coastal managers. For example, in order to predict fish stocks, fisheries managers need to understand the factors that affect fish life-cycles. Many
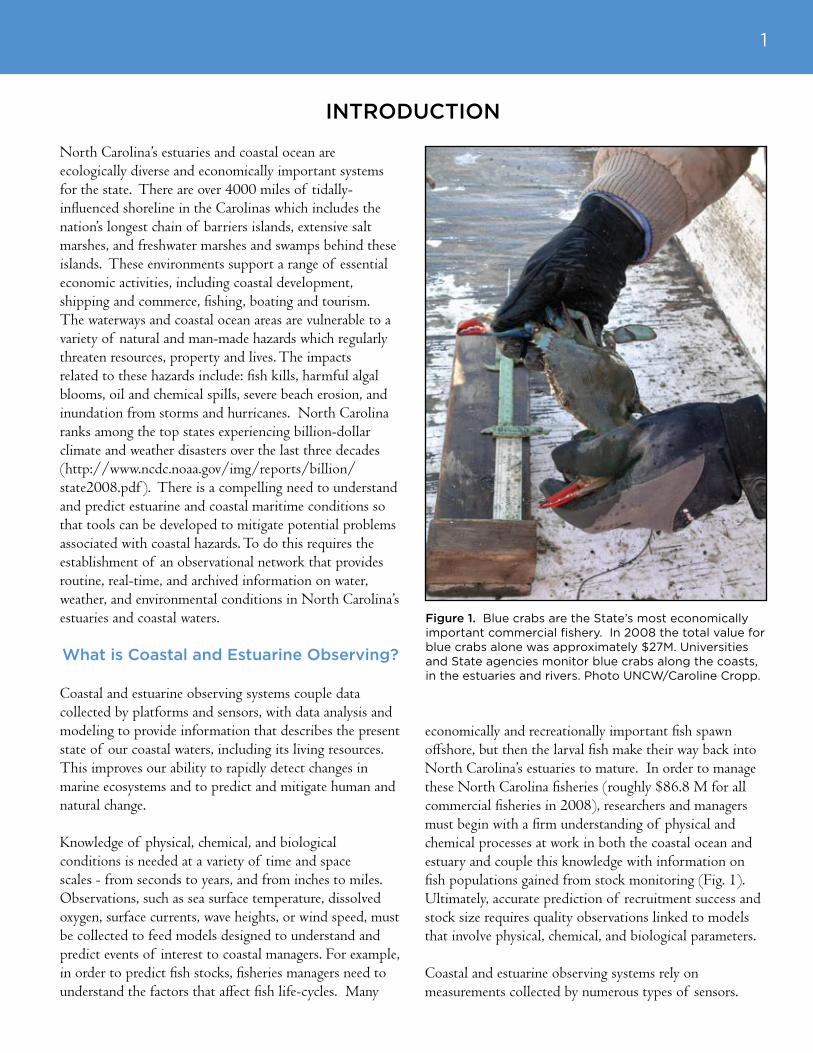
economically and recreationally important fish spawn offshore, but then the larval fish make their way back into North Carolina’s estuaries to mature. In order to manage these North Carolina fisheries (roughly $86.8 M for all commercial fisheries in 2008), researchers and managers must begin with a firm understanding of physical and chemical processes at work in both the coastal ocean and estuary and couple this knowledge with information on fish populations gained from stock monitoring (Fig. 1). Ultimately, accurate prediction of recruitment success and stock size requires quality observations linked to models that involve physical, chemical, and biological parameters.
Coastal and estuarine observing systems rely on measurements collected by numerous types of sensors.
INTRODUCTION
Figure 1. Blue crabs are the State’s most economically important commercial fishery. In 2008 the total value for blue crabs alone was approximately $27M. Universities and State agencies monitor blue crabs along the coasts, in the estuaries and rivers. Photo UNCW/Caroline Cropp.
2
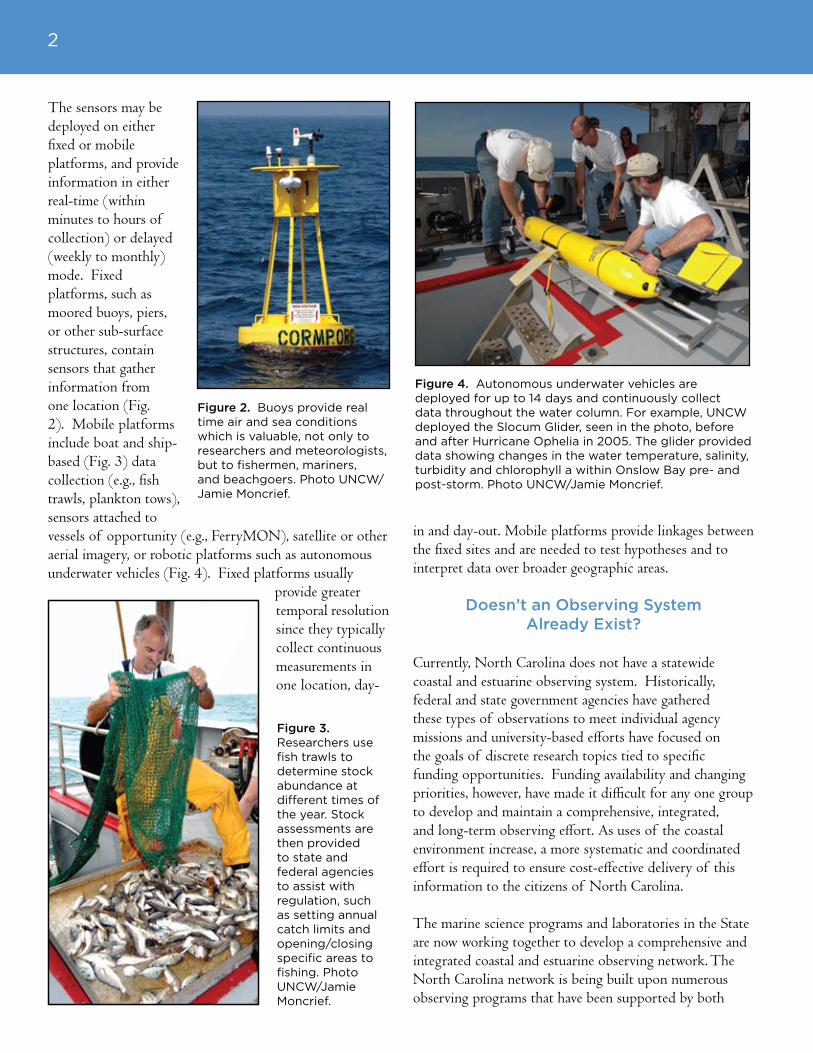
Figure 2. Buoys provide real time air and sea conditions which is valuable, not only to researchers and meteorologists, but to fishermen, mariners, and beachgoers. Photo UNCW/Jamie Moncrief.
The sensors may be deployed on either fixed or mobile platforms, and provide information in either real-time (within minutes to hours of collection) or delayed (weekly to monthly) mode. Fixed platforms, such as moored buoys, piers, or other sub-surface structures, contain sensors that gather information from one location (Fig. 2). Mobile platforms include boat and ship-based (Fig. 3) data collection (e.g., fish trawls, plankton tows), sensors attached to vessels of opportunity (e.g., FerryMON), satellite or other aerial imagery, or robotic platforms such as autonomous underwater vehicles (Fig. 4). Fixed platforms usually
provide greater temporal resolution since they typically collect continuous measurements in one location, day-
in and day-out. Mobile platforms provide linkages between the fixed sites and are needed to test hypotheses and to interpret data over broader geographic areas.
Doesn’t an Observing system Already Exist?
Currently, North Carolina does not have a statewide coastal and estuarine observing system. Historically, federal and state government agencies have gathered these types of observations to meet individual agency missions and university-based efforts have focused on the goals of discrete research topics tied to specific funding opportunities. Funding availability and changing priorities, however, have made it difficult for any one group to develop and maintain a comprehensive, integrated, and long-term observing effort. As uses of the coastal environment increase, a more systematic and coordinated effort is required to ensure cost-effective delivery of this information to the citizens of North Carolina.
The marine science programs and laboratories in the State are now working together to develop a comprehensive and integrated coastal and estuarine observing network. The North Carolina network is being built upon numerous observing programs that have been supported by both
Figure 3. Researchers use fish trawls to determine stock abundance at different times of the year. Stock assessments are then provided to state and federal agencies to assist with regulation, such as setting annual catch limits and opening/closing specific areas to fishing. Photo UNCW/Jamie Moncrief.
Figure 4. Autonomous underwater vehicles are deployed for up to 14 days and continuously collect data throughout the water column. For example, UNCW deployed the Slocum Glider, seen in the photo, before and after Hurricane Ophelia in 2005. The glider provided data showing changes in the water temperature, salinity, turbidity and chlorophyll a within Onslow Bay pre- and post-storm. Photo UNCW/Jamie Moncrief.

3
Federal and non-federal sources including: University of North Carolina Coastal Studies Institute, UNC-W’s Center for Marine Science, UNC-CH’s Institute for Marine Science, NCSU’s Center for Marine Sciences and Technology, ECU’s Institute for Coastal Science and Policy, and the Duke University Marine Lab among others. Together these groups, in partnerships with a variety of State and Federal agencies, are building the foundation of a coordinated, statewide, observation and information system for the North Carolina coastline that will provide timely information on estuarine and coastal ocean conditions and enable improved decision-making regarding living and non-living marine resources.
Users of Coastal and Estuarine Observing Data and Information
An estuarine and coastal ocean observing system is expensive to operate and requires skilled personnel to assure that platforms remain operational. However, the benefits of a fully functioning observing system far outweigh the costs. These systems provide valuable information used by State and Federal management officials to issue predictions, forecasts and warnings related to ocean, weather and climate conditions in North
Carolina. University and agency researchers rely on this information to create and improve predictive models used to make forecasts related to both long-term (i.e., climate and sea-level rise) and short-term (i.e., severe storms and dangerous rip current) events of consequence to coastal citizens. Observing platforms along the coast and within the sounds can also provide County and State Emergency Management officials with information on the changing atmospheric and oceanographic conditions ahead of approaching storms, including tropical systems. This information is then used to make public safety decisions such as when to evacuate coastal communities as hurricanes approach or when to close bridges due to high winds. Observing data such as wave height, wave period, and wind speed, gust and direction also are used by mariners who use these observations to determine if it is safe to travel offshore for their boating or fishing needs. Lastly, fisheries data are used by State and Federal fisheries managers to make stock assessments and to open and close specific fisheries based on size and abundance throughout the year. In the following sections, we describe how coastal observing is used by researchers, managers, and federal agencies and to demonstrate why a statewide investment in these activities will directly affect the residents of coastal North Carolina
PROTECTING lIVEs IN NORTH CAROlINA: APPlICATION OF COAsTAl ObsERVING INFORMATION
Coastal Marine Forecasts and Predictions Powered by Coastal Observing Efforts
A number of real time and non-real time stations currently exist in North Carolina’s coastal waters. These systems collect and report weather and oceanographic conditions used by the general public as well as by a number of State and Federal agencies. Wave height, period and direction, wind speed, gust and direction, air temperature and water temperature are all pieces of information that help NOAA’s National Weather Service (NWS) make forecasts related to marine conditions and weather. These stations collect information via surface and sub-surface equipment mounted on buoys (Fig. 2), piers (Fig. 5), or other platforms. The collected information is relayed to land-based receiving stations, hourly or even more frequently, by means of satellites orbiting the Earth
(Fig. 6). The receiving station then transmits the data to computers, which typically perform instantaneous quality control checks. The information is then forwarded to NWS local offices and released to the general public. Amazingly, this entire process takes under 5 minutes!
NOAA’s NWS meteorologists routinely use observing data from the existing array of weather buoys and platforms. The real-time weather buoy network directly supports the NWS’s mission to provide accurate and timely forecasts and issue life-saving warnings which have a direct impact on the Nation’s commerce, public safety, and decision support during critical maritime events. Observational data provide the basis for all forecasting and modeling and without buoys marine weather conditions become extremely difficult to predict (Fig. 7).Marine forecasters look for trends in buoy observations

4
Figure 6. Data gathered by buoys is communicated to end-users via satellites orbiting the Earth. The data collected at the mooring station are transmitted to the satellite, forwarded to a land-based receiving station and then on to computers which perform instantaneous quality control checks on the data. The information is provided to NWS local offices and released to the general public. Image UNCW/Melissa Smith.
Figure 5. Pier stations, while limited to a few in the coastal waters,
provide weather and wave data to researchers and
NWS meteorologists. The information provided
is used by the NWS to generate rip current
forecasts and by surfers to decide if the waves are good. Wave and current
data are acquired from instruments deployed
approximately 1000 ft from the end of the pier and
information flows from the instruments back to the
pier via an armored cable. An RF link to a computer
in the pier house then transmits the data out for
public consumption. Image UNCW/Melissa Smith.
and analyze wind and wave data to determine actual conditions and gauge model initialization. From these analyses the NWS is able to predict the onset of hazardous marine conditions prompting the issuance of Small Craft Advisories, Gale and Storm Warnings. For instance, during March 2007 the network of buoys off the
Cape Fear coast indicated the passage of a cold front much earlier than models were predicting. As a result the NWS was able to adjust the start time for a Small Craft Advisory which gave mariners extra time to prepare for the stronger winds in the wake of the front.
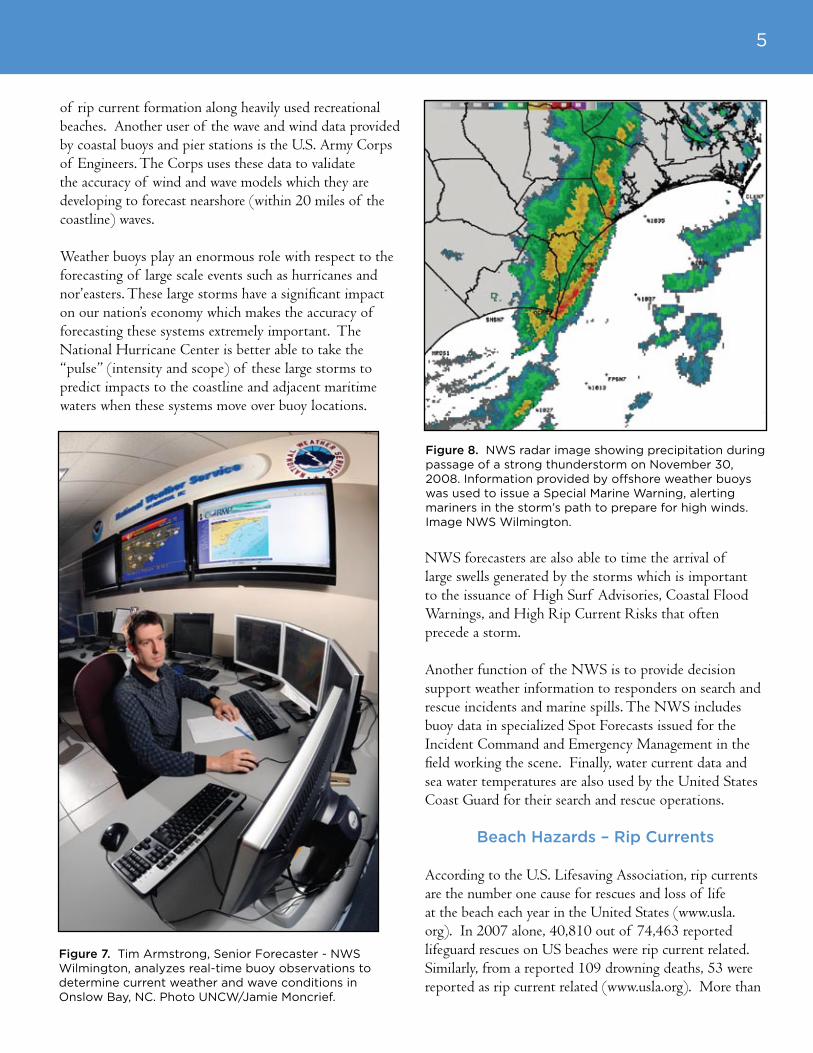
During hazardous marine thunderstorms, such as squall lines or super-cells, the NWS uses weather buoys to provide “sea truth” information about the passage of these storms. The winds reported by these stations inform mariners about conditions they can expect as the storms move through. For example, on November 30, 2008 a weather buoy 25 miles east of Wrightsville Beach indicated strong winds with the passage of a thunderstorm (Fig 8). As a result, the NWS issued a Special Marine Warning to alert mariners in the path of the thunderstorm to prepare for high winds. The thunderstorm eventually produced 35 to 40 knot winds as it moved toward the southeast NC coast. The inclusion of buoy reports in marine warnings and statements adds credibility to NWS warnings which motivates boaters to take action.
Wave buoys also provide key information used by the NWS for surf zone, rip current, and marine forecasts. Spectral wave data, which relate wave energy to wave frequency or period, are used to identify changes in wave steepness that may impair safe navigation, especially near inlets or port entrances, and/or increase the likelihood
5
Figure 7. Tim Armstrong, Senior Forecaster - NWS Wilmington, analyzes real-time buoy observations to determine current weather and wave conditions in Onslow Bay, NC. Photo UNCW/Jamie Moncrief.
Figure 8. NWS radar image showing precipitation during passage of a strong thunderstorm on November 30, 2008. Information provided by offshore weather buoys was used to issue a Special Marine Warning, alerting mariners in the storm’s path to prepare for high winds. Image NWS Wilmington.
of rip current formation along heavily used recreational beaches. Another user of the wave and wind data provided by coastal buoys and pier stations is the U.S. Army Corps of Engineers. The Corps uses these data to validate the accuracy of wind and wave models which they are developing to forecast nearshore (within 20 miles of the coastline) waves.
Weather buoys play an enormous role with respect to the forecasting of large scale events such as hurricanes and nor’easters. These large storms have a significant impact on our nation’s economy which makes the accuracy of forecasting these systems extremely important. The National Hurricane Center is better able to take the “pulse” (intensity and scope) of these large storms to predict impacts to the coastline and adjacent maritime waters when these systems move over buoy locations.
NWS forecasters are also able to time the arrival of large swells generated by the storms which is important to the issuance of High Surf Advisories, Coastal Flood Warnings, and High Rip Current Risks that often precede a storm.
Another function of the NWS is to provide decision support weather information to responders on search and rescue incidents and marine spills. The NWS includes buoy data in specialized Spot Forecasts issued for the Incident Command and Emergency Management in the field working the scene. Finally, water current data and sea water temperatures are also used by the United States Coast Guard for their search and rescue operations.
beach Hazards – Rip Currents
According to the U.S. Lifesaving Association, rip currents are the number one cause for rescues and loss of life at the beach each year in the United States (www.usla.org). In 2007 alone, 40,810 out of 74,463 reported lifeguard rescues on US beaches were rip current related. Similarly, from a reported 109 drowning deaths, 53 were reported as rip current related (www.usla.org). More than

6
“buoys can be extremely useful in search & Rescue (sAR) planning. During a sAR case, the weather buoys provide Coast Guard Command Center personnel with real-time weather data that are useful in determining what type of resource and/or crew will be used to respond to the scene. Additionally, the water temperature data from a weather buoy are often used in cold water survivability modeling during a sAR case.” - LT John Strasburg, USCG Sector NC
“The Us Army Corps of Engineers Field Research Facility (FRF) in Duck, NC is working with University and National Weather service (NWs) partners to use coastal observations collected by North Carolina monitoring programs to develop and implement improved wind, wave and storm surge prediction models for the Carolinas. A regional coastal process modeling test bed has been set up which employs the Automated Model Evaluation and Diagnostics system (AutoMEDs) to fuse observations made at coastal and estuarine locations with model predictions for the real-time assessment of coastal process model performance. Presently AutoMEDs is being used to evaluate the performance of a new coastal wave model prediction capability that has been developed for the NWs. The results provide NWs forecasters with the confidence they need to select which modeling products to use for a given operational forecast.”
- Dr. Jeff Hanson, U.S. Army Corps of Engineers
3.75 million people visited North Carolina beaches in 2007. Among these beachgoers there were 765 rip current or surf rescues and 4 drowning deaths. The number of rescues and deaths due to rip currents in North Carolina highlight the need for better rip current forecasts. Coastal ocean observing systems that measure and report wave information including height, period, and direction are key tools that can help local lifeguards and National Weather Service forecasters improve predictions of dangerous rip current activity on local beaches.
How rip currents work
Rip currents (often incorrectly referred to as ‘rip tides’) “are powerful, channeled currents of water flowing away from shore. They typically extend from the shoreline, through the surf zone, and past the line of breaking waves. Rip currents can occur at any beach with breaking waves” (http://www.ripcurrents.noaa.gov/) and often occur near structures such as piers or groins. It is important to note, however, that there is no obvious shoreline feature that can be used to identify a probable rip current location (Fig. 9).
The characteristics of rip current systems can vary significantly. Rip currents can be relatively stable, existing at a certain location for months at a time or can be present for only a few minutes before moving alongshore or dissipating. They generally have speeds ranging from 0.2 - 5 mph (0.1 - 2 m/s) which are either relatively persistent or pulse with varying wave conditions (MacMahan et al., 2006). A single rip current will generally range from 165-500 feet (50-150 meters) wide and can extend up to 1300 feet (400 meters) seaward.
In general, rip currents form when there is alongshore variation in the
Figure 9. Kill Devil Hills Beach during summer 2008. A small rip current (marked with the red arrow) is visible as a low in the break line, with foam on the surface of the outward flowing water. Photo UNC-CH/Greg Dusek.

7
characteristics of the waves – that is, differences in the height of the breaking waves or how far from shore they break. In some cases, this variation occurs if there are waves approaching the beach from multiple directions and these waves interact with each other to cause areas of higher breaking waves and areas of lower breaking waves. The rip currents form when water flows from the region of high waves to the region of smaller waves. Rip currents produced by this mechanism are usually weak and short-lived due to the constantly changing wave conditions.A second way to generate the alongshore wave variability required to form rip currents is through differences in
the alongshore bathymetry or shape of the bottom. These bathymetric differences are frequently associated with features such as nearshore sand bars. When waves encounter the shallower water over the sand bar, they begin to shoal and eventually break. Where the sand bar is absent or cut by a channel, and the water is deeper, the waves do not break. Waves breaking over the sand bar produce higher water levels onshore than waves in the channel, thus leading to currents shoreward of the bar that flow toward the channel. Where the alongshore current converges, the water has nowhere else to go except offshore, and a strong, narrow jet of offshore current, the rip
current, results (Fig. 10). Rip currents formed by this mechanism can be stronger and more persistent than those caused by interacting waves.
Existing warnings – and room for improvements
NOAA’s National Weather Service Weather Forecast Offices (WFOs) currently forecast and disseminate rip current predictions for many populated coastal areas. Although these forecasts have successfully and correctly predicted rip current activity (Engle et al., 2002), the consistency, accuracy and functionality of these forecasting tools can be improved. Some shortcomings of the present rip current forecasts are:
1. Forecasts do not account for nearshore bathymetry. Wave and tidal conditions, which also influence rip current activity, are accounted for but how these conditions contribute to the formation of rip currents is influenced by the presence of features such as sand bars. Nearshore bathymetric information that accounts for the presence or absence of these features is needed to improve the accuracy of rip current forecasts. Without this information, the forecasts may be inaccurate and increased rip activity may exist when it might otherwise not be expected based on wave and tidal conditions alone.
2. Wave data used for rip current forecasts is limited. There are only a handful of nearshore wave observations collected at piers or nearshore
wave buoys. Therefore, most wave data for use in forecasts is typically collected from deep water buoys as much as 40 miles from shore and not necessarily representative of nearshore wave fields. Forecasts also frequently rely on bulk wave parameters, such as peak
Figure 10. North Carolina Sea Grant, the US Lifesaving Association and NOAA developed “Break the Grip of the Rip” posters and signs for posting at public beach access points across coastal North Carolina. The signs are used to educate beachgoers on how to recognize and safely escape rip currents. http://www.srh.noaa.gov/ripcurrents/signs-brochures.shtml

8
Figure 11. Currently rip current forecasts for the NWS WFO Morehead City Warning Area are divided into seven zones attempting to best capture the complex coastline as well as adhering to county boundaries. The breakpoints are shown in the above figure. Rip current forecast zones range in distance from 12 to 45 miles. Image NWS/Scott Kennedy.
Global warming and climate change frequent today’s news headlines. Pictures of vanishing glaciers or polar bears drifting out to sea on a small piece of ice offer dramatic illustrations of the impacts of a warming climate. However, for many residents of North Carolina these pictures do not answer the most important question, “How will effects of climate change in North Carolina affect me?” Such a question offers one of the greatest challenges of climate change research. Many scientists, researchers, and government officials are grappling with the difficult task of determining how the global process of climate change will manifest itself in a specific location such as coastal North Carolina. One of the difficulties in determining the impacts of climate change is that global climate models only provide analysis and predictions at very large scales, perhaps the entire North Carolina coast,
and are unable to create reliable, accurate predictions for individual locations such as Wilmington, Morehead City or Kitty Hawk. The best strategy to develop more reliable and accurate predictions for specific locations along coastal North Carolina is through the collection of accurate meteorological and oceanographic data, particularly in estuaries and the coastal ocean. Such data can be combined with existing model predictions and provide insight as to how coastal North Carolina will respond to a change in climate.
In this section, potential impacts of climate change on coastal North Carolina and how these impacts can be better understood by creating observing stations in North Carolina’s estuaries and coastal waters will be discussed. Before doing so, however, it is important to place North
ClIMATE CHANGE: HOW WIll ObsERVING HElP NORTH CAROlINA UNDERsTAND POssIblE IMPACTs?
period and peak direction; parameters that omit detail needed to fully describe nearshore waves that originate from different directions or sources. When this information is lost, the quality of the rip current forecast can be compromised.
3. Rip current forecasts in North Carolina typically cover 12-45 miles of coastline (Fig. 11); however, rip current activity can be much more isolated. Thus a single forecast may predict high rip current activity for an entire coverage area while half of that coverage area is experiencing low or no rip activity. Accurate wave models now exist (such as the Simulating WAves Nearshore (SWAN) model) which can represent variation in waves on kilometer scales. If validated with appropriate wave observations from nearshore sensors, the wave models may provide a mechanism to significantly improve the spatial resolution of the rip current forecasts.
Through appropriate nearshore bathymetry mapping, increased wave observations at the coast, rescue reporting, and modeling efforts, there is a potential to greatly improve our understanding and our ability to forecast beach-wide rip current activity.

9
Carolina within an overall understanding of climate change. Below, is a summary of the current understanding of past, present, and potential future patterns of climate change in coastal North Carolina.
Past Conditions in Coastal North Carolina
Climate change is a natural phenomenon that reflects variability in the amount of sunlight striking the Earth at various latitudes, changes in ocean and atmospheric circulation patterns, and the concentration of greenhouse gases within the atmosphere. Although natural change is the norm, human fossil fuel combustion and other practices have altered the equation to the point of significantly amplifying and accelerating climate change (IPCC, 2007). Long-term monitoring is one tool that can be used to differentiate rates of natural change from those exacerbated by human activity or to detect when significant changes in long-term patterns are occurring.
An important first step in this process is identifying long-term patterns. To do this, geoscientists commonly look to the past. Analysis of past scenarios of rapid natural climate change provides scientists with clues to the controls, rates and magnitudes of future change. Of greatest significance to modern studies is the last 1.8 million years, which were characterized by extreme and rapid changes from glacial conditions to interglacial conditions (Fig. 12A). Rates of sea-level rise have varied considerably in the past. The highest natural rates (as much as 17 ft or 5 m per century) occurred during the transition period between glacial and interglacial climates, when the continental ice sheets were rapidly melting (Fairbanks et al., 1990; Blanchon and Shaw, 1995; Locker et al., 1996). Although it is unlikely that sea level will rise that rapidly in the near future, it is a stark reminder of how quickly conditions can change.
It is significant that over the last 400,000 years, sea level has been near its present height only four times: 125,000, 200,000, 330,000 and 400,000 years ago (Imbrie et al., 1993). Additionally, three of those four times, sea level rose to heights well above present sea level (Imbrie et al., 1993; Droxler and Farrell, 2000) (Fig. 12A). The data suggest that during the last interglacial (ca. 125,000 years ago) sea level was similar to today for several millennia, before a rapid rise of 20 ft (6 m) ensued (Hearty et al., 2007) (Fig. 12B). This rapid rise
in sea level was the result of the melting of the Greenland Ice Sheet, and perhaps portions of the West Antarctic Ice Sheet (WAIS). In North Carolina, the shoreline was situated along the Suffolk Scarp (a.k.a., Suffolk Shoreline; Mallinson et al., 2008) between 125,000 and 80,000 years ago. The Suffolk Scarp is north-south oriented and runs from Edenton to Bath, and further south to Minnesott Beach along the Neuse River (Fig. 12C). All counties east of this shoreline (Dare, Hyde, Tyrrell, Washington, Camden, Currituck, Pasquotank, Perquimans, Pamlico, and Carteret) were fully or partially submerged and part of the shallow continental shelf.
Over the last 18,000 years, sea level has risen along the North Carolina coast. The rate of sea level rise approximately 10,000 years ago was higher than today averaging roughly 30 inches per 100 years (8 mm per year) (Table 1). Approximately 8000 years ago, the rate of sea-level rise decreased significantly, but then increased rapidly near the start of the 20th century. This increase in the absolute rate of sea-level rise in North Carolina is broadly synchronous with findings from other studies along the Atlantic coast and, during the 20th century, was approximately 3mm per year. This translates to approximately a 1 foot sea level rise over the last 100 years (Table 1) – but the trend continues clearly to be that of an increasing rate of rise.
The Present and Near Future scenarios
The IPCC Fourth Assessment Report indicates global warming of 0.74°C (0.59 °F) since 1906 (IPCC, 2007) and long-term data indicate that the warming trend over the last 50 years is nearly double the warming rate observed between 100 and 50 years ago. In short, global warming is expected to increase by 0.6 to 4.0°C (1.1-7.2 °F) over the next 100 years (Fig. 13). In
Table 1. The varying rate of relative sea-level rise in northeastern North Carolina for the last 11,000 years (from data in Horton et al., 2008, in press; Kemp et al., 2008).
11,000 - 8,000 yrs ago 8 mm / yr or 30 inches / 100 yrs
8,000 - 2,100 yrs ago 1.5 mm / yr or 6 inches / 100 yrs
2,100 - 200 yrs ago (100 BC - 1800 AD)
1 mm / yr or 3 inches / 100 yrs
100 – 0 yrs ago (1900 AD - 2000 AD)
3 mm / yr or 12 inches / 100 yrs

10
Figure 12. A) The record of sea-level change for the last 500,000 years based upon oxygen isotope data of deep sea foraminifera (modified from Imbrie et al., 1993). Interglacials and glacials are indicated by red and blue arrows, respectively. b) The record of rapid sea-level rise in the Bahamas, during the last interglacial highstand (modified from Hearty et al., 2007). C) Eastern NC elevation, from LIDAR data, showing the location of the Suffolk Shoreline (dashed line) which formed during the last interglacial sea-level highstand between 125,000 and 80,000 years ago. Image ECU/David Mallinson.
response, widespread melting of glaciers and ice sheets is anticipated and average global sea-level rise is projected to rise by 0.18 to 0.59 m (6 inches to 21 inches) during the next 100 years assuming that rates do not accelerate.Is this rate of relative sea-level rise significant for the North Carolina coastal system? Since major portions of Currituck, Carteret, Dare, Hyde, Tyrell, and Pamlico counties are only 1 to 2 ft (30-60 cm) above present sea level, even such a seemingly small rate of sea level rise can result in significant inundation over the next 100 years. Given that the rate of sea-level rise is projected to accelerate over the next several decades, sea-level rise may be much greater and the potential effect on North Carolina’s coastal zone may be profound. Existing data indicate that the rate of melting of the Greenland Ice Sheet is increasing (Zwally et al., 2002; IPCC, 2007) and that the rate of relative sea-level rise in North Carolina is accelerating (Kemp et al., 2008). However, without additional measurements, it will be difficult to constrain current and future rates of sea-level rise at specific locations in
the State. These measurements are particularly needed in areas where subsidence (i.e., sinking of the land surface) is occurring.
As the Greenland Ice Sheet continues to melt, the future North Carolina shoreline will likely move back

11
Figure 13. Left panel: Solid lines are multi-model global averages of surface warming (relative to 1980-1999) for the SRES scenarios A2, A1B and B1, shown as continuations of the 20th century simulations. The orange line is for the experiment where concentrations were held constant at year 2000 values. The bars in the middle of the figure indicate the best estimate (solid line within each bar) and the likely range assessed for the six SRES marker scenarios at 2090-2099 relative to 1980-1999. The assessment of the best estimate and likely ranges in the bars includes the Atmosphere-Ocean General Circulation Models (AOGCMs) in the left part of the figure, as well as results from a hierarchy of independent models and observational constraints. Right panel: Projected surface temperature changes for the early and late 21st century relative to the period 1980-1999. The panels show the multi-AOGCM average projections for the A2 (top), A1B (middle) and B1 (bottom) SRES scenarios averaged over decades 2020-2029 (left) and 2090-2099 (right). (IPCC, 2007, Fig 3.2, p. 46).
to the ancient Suffolk Shoreline once again (Fig. 12C). However, the geologic response to rising water levels and accelerated sea-level rise will not be characterized by a simple, gradual shift westward of the current coastline and deepening of the water. North Carolina will have to deal with a suite of ecological and geological changes that will affect key resources in the State.
Another big question regarding climate change is the likely amount of future precipitation increase. One theory suggests a small (1-3%) increase in precipitation globally, because the atmosphere is warmer and will hold more water vapor (Allen and Ingram, 2002). Other models show a larger (7%) increase, possibly due to weakened atmospheric circulation. A little over half of the existing climate models show a slight increase (5-10%) in US East Coast precipitation. While there is less consensus on precipitation increases due to global climate change compared to sea-level rise, North Carolina still needs to be prepared for the environmental changes to which both will contribute.
Climate Change in Coastal North Carolina: Impact of Coastal Inundation and storms
The low relief of coastal North Carolina, combined with its susceptibility to impact by tropical cyclones and nor’easters, makes this region particularly vulnerable to coastal flooding, erosion and damage due to storm surge and waves. The State has experienced more direct hurricane strikes than any other Atlantic coast state except Florida (Fig.14); resulting in dynamic changes in the coastline. Nonetheless, very few robust marine weather observing stations capable of measuring and reporting winds, air and water temperature, and atmospheric pressure in real-time exist along the coast. In fact, there is not a single continuously operating water level station (i.e., tide gauge) in the Albemarle-Pamlico Sound system even though it is highly vulnerable to coastal flooding. In North Carolina, higher sea level will increase the vulnerability of low lying coastal areas to storm surge and wave action; especially if severe storms also become more intense or more frequent. When combined with

12
Figure 14. Hurricane storm tracks impacting the Carolinas since 1970. Copyright © 2007 Environmental Defense Fund. Used by Permission. Image is available at http://www.edf.org/article.cfm?contentid=5376.
even a seemingly insignificant 1 foot rise in sea-level, the potential risk of flood, flood damage, and major changes in the coastal landscape increase profoundly.
There is clear evidence that North Atlantic tropical cyclones have become more intense since 1970 (IPCC, 2007; Knutson et al., 2008, Emanuel et al., 2008) and there are indications that the severity of tropical storms will also increase (e.g., fewer category 1-2 and more category 4-5 storms) if the climate continues to warm (Bengtesson et al., 2007; Webster et al., 2005). Some studies indicate that a 1°C increase in sea surface temperature may cause as much as a 31% increase in category 4-5 storms, with the strongest increase occurring in the Atlantic Basin and the Northern Indian Ocean (Elsner et al., 2008). If a 2°C increase in sea surface temperature occurs by the year 2100 as other studies suggest (IPCC, 2007), North Carolina may experience more frequent high intensity storms that will have dramatic consequences for coastal communities (Fig 15). Since 1900, for example, only 24% of the US tropical cyclones that made landfall have been category 3-5 storms, but these storms have caused 85% of all damages (Pielke et al., 2008).
In North Carolina the potential effects of increased severe storm activity and rising sea level include: • Systematic inundation of low-lying coastal regions• Erosion of barrier islands to the extent that the
back barrier sounds, including the Albemarle-Pamlico Sound, are exposed to significantly different tidal conditions or coastal wave conditions. Increased tidal conditions would exacerbate flooding of low-lying land at times of high tide while exposure to increased wave conditions would increase erosion of sound shorelines.
• Increased susceptibility of flooding from severe storms such as nor’easters and tropical cyclones (e.g., hurricanes).
• Exposure of fresh water ecosystems to increased salinity levels from direct inundation or the introduction of salt water into the extensive ditching network that has been created to drain low coastal areas.
The effects listed above are likely to be most profound in the area between Cape Lookout and the mouth of Chesapeake Bay, which comprises the third largest area of land vulnerable to sea-level rise in the United States. However, it is difficult to predict the full extent of potential impact due to several factors
including the lack of a high quality historical record, lack of a sufficient number of observation platforms to record key data, and significant uncertainty in climate models, which has resulted in dissenting views in the scientific literature (Donnelly and Woodruff, 2007; Landsea, 2007; Vecchi and Soden, 2007, Knutson et al., 2008). As a result, the issue remains very much unresolved (Emanuel et al., 2008).
Identifying the potential impact of sea-level rise and storms is further complicated by changing coastal development patterns. Over the period 1900-2005, US damages from tropical cyclones have been closely correlated to coastal population and housing units (Pielke et al., 2008). The continuing development of North Carolina coastal regions, both along the Outer Banks and more recently the Inner Banks estuarine shoreline, has placed substantial population and economic investment in areas that are highly vulnerable to the effects of climate change. At this point, given the extensive development occurring in North Carolina’s coastal regions, the reality of sea-level rise, and the possibility of more intense

13
tropical cyclone activity, the effects of future storm surge and wave conditions merit careful consideration and planning by coastal officials.
Determining how society should respond (over both short-term and longer-term scales) to the threats posed by sea-level rise is a major challenge for scientists and coastal policy makers. Long-term research and monitoring is required to separate natural from human-induced changes, and to determine linkages between cause and effect. When coupled with sound scientific research and modeling, coastal and estuarine observing information can be used to predict changes in the future and detect when these changes begin to occur. High quality long-term meteorological observations are critical for understanding the variability and trends in climate, but, unfortunately, very few long-term and high quality observations exist for temperature and precipitation along North Carolina’s coast. Thus, the State lacks sufficient information to define specific climate change trends in the North Carolina coastal region. By investing in coastal and estuarine observing systems, State agencies and officials can start implementing adaptation strategies that will help local towns and cities deal with the effects of our changing environment. Ultimately, these efforts will contribute to the development and implementation of new and innovative coastal zone management and planning approaches that protect life and property
in the face of accelerated rise in sea level and increased intensity of coastal storms.
The concept of ecosystem-based management involves applying a holistic approach to resource management rather than focusing on a single species, habitat, or issue. The basic idea is very intuitive—the elements of an ecosystem have inter-connections that have evolved over time allowing these systems to be resilient to major disturbances such as floods and droughts. However, human impacts are reducing the resiliency of natural systems through, for example, degradation of water quality and habitats, and loss of key species. It makes sense to manage species, habitats and humans as a whole
rather than as a series of unrelated elements. This concept of applying an “ecosystem approach” has been widely endorsed by management organizations worldwide, and environmental observing systems are vital to allowing us to properly manage coastal ecosystems for resilience. Coordinated estuarine and coastal ocean observing efforts are fundamental to providing the suite of information needed by the State. Further, these efforts will ensure that the data derived from the monitoring are managed and communicated in a way that provides valuable information to those responsible for our resources. In this section
COAsTAl ECOsYsTEMs: HOW DOEs COAsTAl ObsERVING CONTRIbUTE TO sUsTAINING HEAlTHY COAsTAl ECOsYsTEMs
IN NORTH CAROlINA?
Figure 15. A NASA TERRA visible satellite image of Hurricane Isabel as it made landfall across North Core Banks, North Carolina on September 18, 2003. Low lying coastal areas across the eastern US will be more vulnerable to flooding and other effects of tropical systems as sea level rises.

14
Figure 16. The coastal zone of North Carolina. Imagery from a NASA MODIS sensor provided by the Institute for Marine Remote Sensing of the College of Marine Science, University of South Florida. Courtesy of Dorothea Ames.
we characterize some of the important ecosystems of coastal North Carolina, discuss how ecosystem services are provided, and illustrate the value of observing systems to the understanding and management of our ecosystems.
Effects of Climate Change in North Carolina’s Coastal and Estuarine
Ecosystems: Focus on the Albemarle-Pamlico system
North Carolina has one of the most extensive estuarine systems in the US. The estuaries are the interface between the ocean and continent; a mixing zone of fresh and
salt water. In the northeastern part of the state, large yet shallow sound systems are dominant (Fig. 16). In fact, the Albemarle-Pamlico estuary is the second largest estuarine complex in the lower 48 states and the largest coastal lagoon. Along the central and southern coasts, large estuaries give way to smaller sounds, riverine estuaries and tidal creeks (Fig 16). North Carolina’s estuaries and coastal lagoons are surrounded by forested riparian wetlands, non-tidal marshes and tidal marshes depending on location, salinity and intensity of tidal signal. These wetlands are primary features of the lands of eastern North Carolina and are an important resource for the State (Riggs and Ames, 2003) since they provide habitat

15
Figure 17. Tributary to the Neuse River Estuary demonstrating salt marshes abutting wetland forests with opportunities for transgression with sea-level rise. Photo ECU/Mark Brinson.
for a variety of animals, including birds, fish, reptiles, amphibians, mammals and invertebrates. The Neuse, Pamlico and Chowan River estuaries drain substantial portions of North Carolina and some of Virginia into the Albemarle and Pamlico Sounds. These sounds are the permanent or temporary home to many fish and shellfish, including economically important species for the State.
North Carolina’s coastal environments and the ecosystems that they support are highly vulnerable to changes in climate. While the direct impacts of higher sea level are apparent, other anticipated changes in climate, including changes in temperature and precipitation, as well as storm frequency and/or intensity, also have the potential to significantly impact the state’s estuarine and wetland ecosystems. Estuarine and coastal monitoring not only provide the baseline information required to determine the current condition of these systems, but is the critical first step in detecting when changes begin to occur. Current research and monitoring efforts in our estuaries and coastal waters are providing the necessary data and scientific background to better manage our coastal and estuarine ecosystems in the face of climate change (see http://carolinasrcoos.org and http://www.coastal.geology.ecu.edu/NCCOHAZ/). Over the last several years, researchers from ECU, UNC-CH, NCSU and the Coastal Studies Institute (CSI) have been monitoring waves, currents, water quality and fish sounds in the Neuse River estuary, Pamlico River estuary, and Pamlico and Albemarle sounds; some of these data have been available in real time while others were downloaded after equipment retrieval. At present, ECU, CSI and Elizabeth City State University, with support from the U.S. Army Corps of Engineers (USACE) and the NC Renaissance Computing Institute, are measuring real-time conditions in Albemarle Sound. This information is important to providing wave data for the USACE and the National Weather Service. However, other monitoring efforts, such as the addition of water level stations in our sounds and estuaries are sorely needed. These systems will allow the State to directly quantify rates of sea-level rise along our coast and relate the observations to national and global scale models.
The Albemarle-Pamlico system is unique in that it is large and shallow, and has very few inlets connecting it to the open ocean. Because of its geomorphology, the Albemarle-Pamlico experiences a limited astronomical tidal range (~4
inches/10 cm) and is dominated by wind-tides and waves. As a potential consequence of climate change, increased storm activity may open new inlets thereby allowing greater exchange of water between the estuary and the open ocean and increasing tidal action. This enhanced exchange of water will impact the physical and chemical dynamics within the estuaries and increase the salinity content (Brinson et al., 1985, 1995; Corbett et al., 2007) such as during Hurricane Isabel when the opening of a new Inlet near Hatteras, NC allowed large amounts of salt water to enter the sounds and estuaries in the northeastern part.
Across North Carolina, wetland systems surrounding the estuaries have maintained their position relative to sea level through the combination of trapping sediments from coastal waters, production of organic matter by plants (a dominant process in the marshes of the Albemarle-Pamlico
16
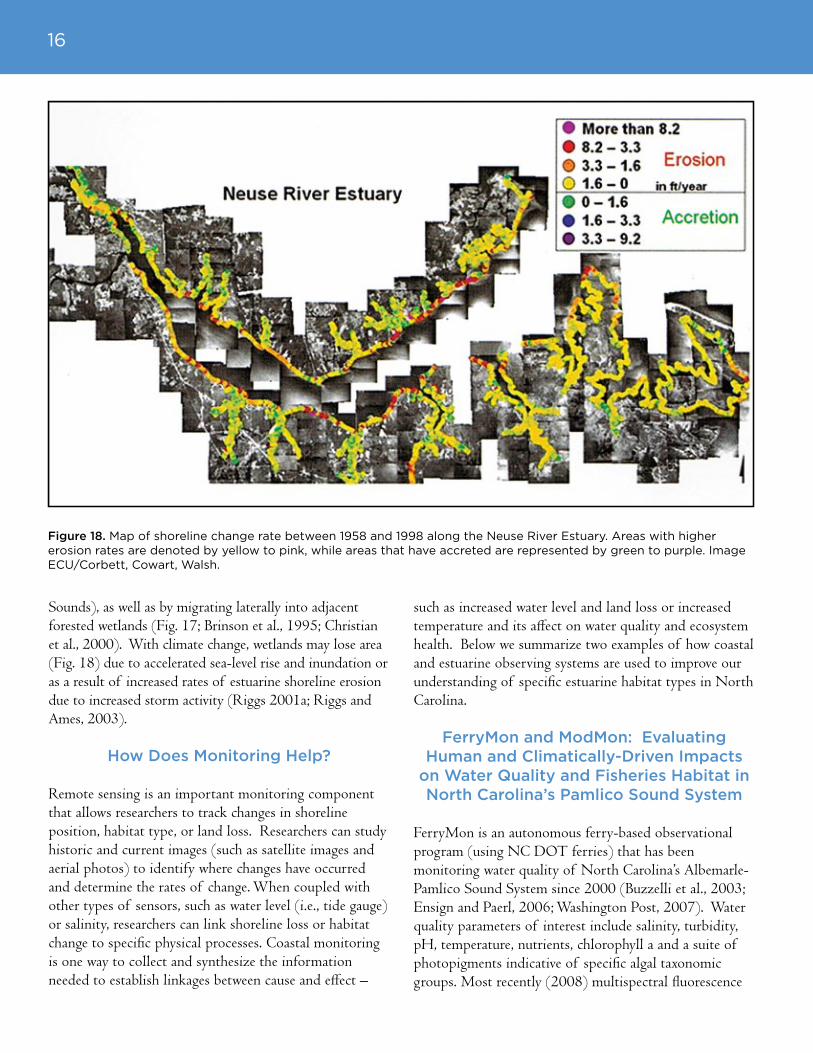
Sounds), as well as by migrating laterally into adjacent forested wetlands (Fig. 17; Brinson et al., 1995; Christian et al., 2000). With climate change, wetlands may lose area (Fig. 18) due to accelerated sea-level rise and inundation or as a result of increased rates of estuarine shoreline erosion due to increased storm activity (Riggs 2001a; Riggs and Ames, 2003).
How Does Monitoring Help?
Remote sensing is an important monitoring component that allows researchers to track changes in shoreline position, habitat type, or land loss. Researchers can study historic and current images (such as satellite images and aerial photos) to identify where changes have occurred and determine the rates of change. When coupled with other types of sensors, such as water level (i.e., tide gauge) or salinity, researchers can link shoreline loss or habitat change to specific physical processes. Coastal monitoring is one way to collect and synthesize the information needed to establish linkages between cause and effect –
such as increased water level and land loss or increased temperature and its affect on water quality and ecosystem health. Below we summarize two examples of how coastal and estuarine observing systems are used to improve our understanding of specific estuarine habitat types in North Carolina.
FerryMon and ModMon: Evaluating Human and Climatically-Driven Impacts
on Water Quality and Fisheries Habitat in North Carolina’s Pamlico sound system
FerryMon is an autonomous ferry-based observational program (using NC DOT ferries) that has been monitoring water quality of North Carolina’s Albemarle-Pamlico Sound System since 2000 (Buzzelli et al., 2003; Ensign and Paerl, 2006; Washington Post, 2007). Water quality parameters of interest include salinity, turbidity, pH, temperature, nutrients, chlorophyll a and a suite of photopigments indicative of specific algal taxonomic groups. Most recently (2008) multispectral fluorescence
Figure 18. Map of shoreline change rate between 1958 and 1998 along the Neuse River Estuary. Areas with higher erosion rates are denoted by yellow to pink, while areas that have accreted are represented by green to purple. Image ECU/Corbett, Cowart, Walsh.
17
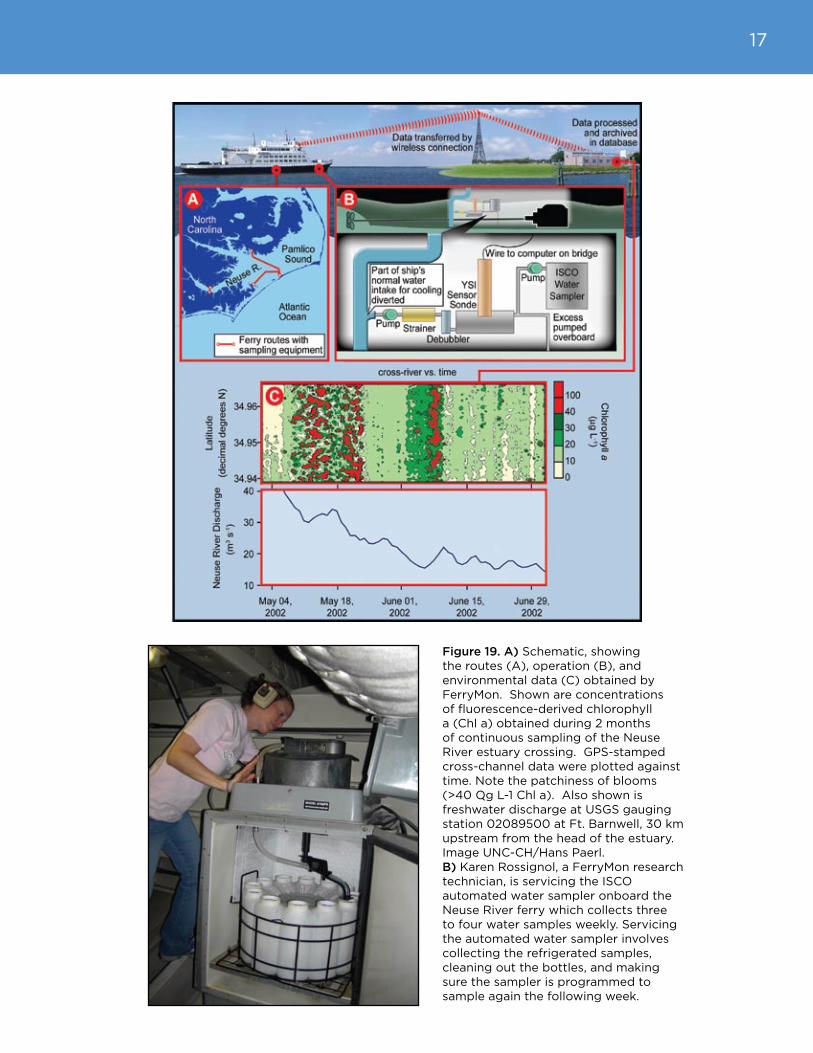
Figure 19. A) Schematic, showing the routes (A), operation (B), and environmental data (C) obtained by FerryMon. Shown are concentrations of fluorescence-derived chlorophyll a (Chl a) obtained during 2 months of continuous sampling of the Neuse River estuary crossing. GPS-stamped cross-channel data were plotted against time. Note the patchiness of blooms (>40 µg L-1 Chl a). Also shown is freshwater discharge at USGS gauging station 02089500 at Ft. Barnwell, 30 km upstream from the head of the estuary. Image UNC-CH/Hans Paerl. b) Karen Rossignol, a FerryMon research technician, is servicing the ISCO automated water sampler onboard the Neuse River ferry which collects three to four water samples weekly. Servicing the automated water sampler involves collecting the refrigerated samples, cleaning out the bottles, and making sure the sampler is programmed to sample again the following week.
18
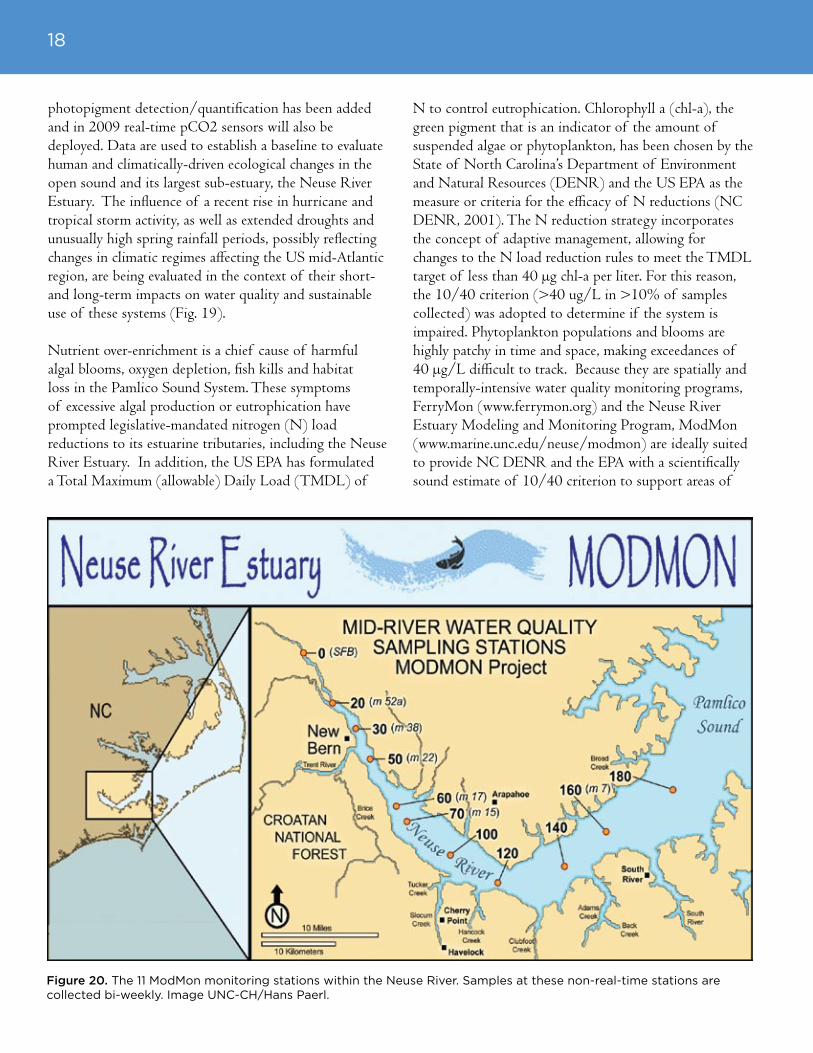
Figure 20. The 11 ModMon monitoring stations within the Neuse River. Samples at these non-real-time stations are collected bi-weekly. Image UNC-CH/Hans Paerl.
photopigment detection/quantification has been added and in 2009 real-time pCO2 sensors will also be deployed. Data are used to establish a baseline to evaluate human and climatically-driven ecological changes in the open sound and its largest sub-estuary, the Neuse River Estuary. The influence of a recent rise in hurricane and tropical storm activity, as well as extended droughts and unusually high spring rainfall periods, possibly reflecting changes in climatic regimes affecting the US mid-Atlantic region, are being evaluated in the context of their short- and long-term impacts on water quality and sustainable use of these systems (Fig. 19).
Nutrient over-enrichment is a chief cause of harmful algal blooms, oxygen depletion, fish kills and habitat loss in the Pamlico Sound System. These symptoms of excessive algal production or eutrophication have prompted legislative-mandated nitrogen (N) load reductions to its estuarine tributaries, including the Neuse River Estuary. In addition, the US EPA has formulated a Total Maximum (allowable) Daily Load (TMDL) of
N to control eutrophication. Chlorophyll a (chl-a), the green pigment that is an indicator of the amount of suspended algae or phytoplankton, has been chosen by the State of North Carolina’s Department of Environment and Natural Resources (DENR) and the US EPA as the measure or criteria for the efficacy of N reductions (NC DENR, 2001). The N reduction strategy incorporates the concept of adaptive management, allowing for changes to the N load reduction rules to meet the TMDL target of less than 40 μg chl-a per liter. For this reason, the 10/40 criterion (>40 ug/L in >10% of samples collected) was adopted to determine if the system is impaired. Phytoplankton populations and blooms are highly patchy in time and space, making exceedances of 40 μg/L difficult to track. Because they are spatially and temporally-intensive water quality monitoring programs, FerryMon (www.ferrymon.org) and the Neuse River Estuary Modeling and Monitoring Program, ModMon (www.marine.unc.edu/neuse/modmon) are ideally suited to provide NC DENR and the EPA with a scientifically sound estimate of 10/40 criterion to support areas of
19
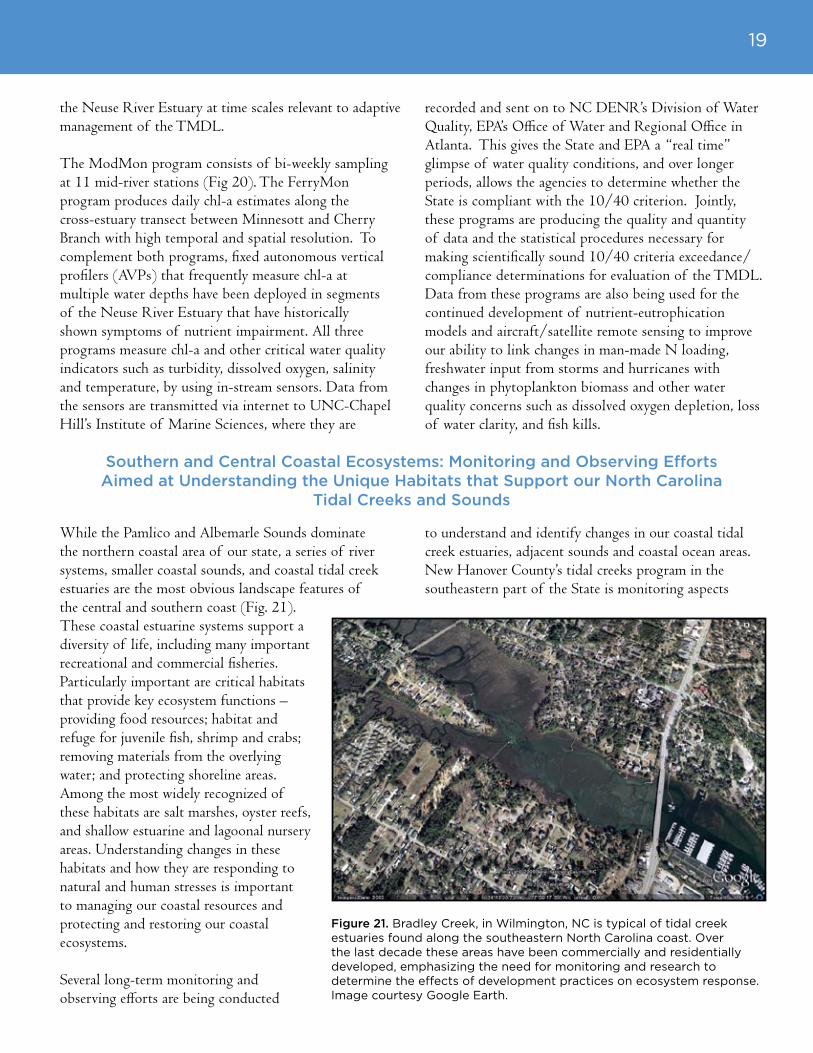
Figure 21. Bradley Creek, in Wilmington, NC is typical of tidal creek estuaries found along the southeastern North Carolina coast. Over the last decade these areas have been commercially and residentially developed, emphasizing the need for monitoring and research to determine the effects of development practices on ecosystem response. Image courtesy Google Earth.
the Neuse River Estuary at time scales relevant to adaptive management of the TMDL.
The ModMon program consists of bi-weekly sampling at 11 mid-river stations (Fig 20). The FerryMon program produces daily chl-a estimates along the cross-estuary transect between Minnesott and Cherry Branch with high temporal and spatial resolution. To complement both programs, fixed autonomous vertical profilers (AVPs) that frequently measure chl-a at multiple water depths have been deployed in segments of the Neuse River Estuary that have historically shown symptoms of nutrient impairment. All three programs measure chl-a and other critical water quality indicators such as turbidity, dissolved oxygen, salinity and temperature, by using in-stream sensors. Data from the sensors are transmitted via internet to UNC-Chapel Hill’s Institute of Marine Sciences, where they are
recorded and sent on to NC DENR’s Division of Water Quality, EPA’s Office of Water and Regional Office in Atlanta. This gives the State and EPA a “real time” glimpse of water quality conditions, and over longer periods, allows the agencies to determine whether the State is compliant with the 10/40 criterion. Jointly, these programs are producing the quality and quantity of data and the statistical procedures necessary for making scientifically sound 10/40 criteria exceedance/compliance determinations for evaluation of the TMDL. Data from these programs are also being used for the continued development of nutrient-eutrophication models and aircraft/satellite remote sensing to improve our ability to link changes in man-made N loading, freshwater input from storms and hurricanes with changes in phytoplankton biomass and other water quality concerns such as dissolved oxygen depletion, loss of water clarity, and fish kills.
While the Pamlico and Albemarle Sounds dominate the northern coastal area of our state, a series of river systems, smaller coastal sounds, and coastal tidal creek estuaries are the most obvious landscape features of the central and southern coast (Fig. 21). These coastal estuarine systems support a diversity of life, including many important recreational and commercial fisheries. Particularly important are critical habitats that provide key ecosystem functions – providing food resources; habitat and refuge for juvenile fish, shrimp and crabs; removing materials from the overlying water; and protecting shoreline areas. Among the most widely recognized of these habitats are salt marshes, oyster reefs, and shallow estuarine and lagoonal nursery areas. Understanding changes in these habitats and how they are responding to natural and human stresses is important to managing our coastal resources and protecting and restoring our coastal ecosystems.
Several long-term monitoring and observing efforts are being conducted
to understand and identify changes in our coastal tidal creek estuaries, adjacent sounds and coastal ocean areas. New Hanover County’s tidal creeks program in the southeastern part of the State is monitoring aspects
southern and Central Coastal Ecosystems: Monitoring and Observing Efforts Aimed at Understanding the Unique Habitats that support our North Carolina
Tidal Creeks and sounds

20
Figure 23. Monitoring of oyster populations in Southeastern, NC. UNCW researchers measure abundance, size and percent cover of oysters and associated animals on an intertidal reef at the mouth of Hewelett’s Creek, New Hanover County. Photo UNCW/Jamie Moncrief.
Figure 22. The North Carolina National Estuarine Research Reserve has recently upgraded monitoring stations to real time. In this photo Byron Toothman and Heather Wells are maintaining the meteorological station on Masonboro Island, NC. Photo NCNERR/Hope Sutton.
of water quality, including nutrients, chlorophyll a, turbidity and suspended solids, and selected pollutants on a monthly basis in a series of coastal estuarine systems. Biological data accompanying this physical monitoring include assessment of oyster reef health and fisheries populations (blue crabs and certain finfish). As part of their state network, the North Carolina Estuarine Research Reserve System
also conducts real-time monitoring of selected water quality characteristics in Masonboro Sound (Fig. 22), adjacent to several tidal creek estuaries. An analogous program provides data on the physical characteristics of the Cape Fear River (ongoing since the early 1990’s and coordinated through the University of North Carolina Wilmington) and more recently the New River. This program monitors water quality parameters at a series of stations from freshwater out to the mouth of the river; including contaminants, dissolved oxygen, nutrients, suspended solids, and chlorophyll a measures. Associated studies have examined bottom communities and fisheries species. Since 1999 a study of the wetland communities along the low salinity to moderately brackish shorelines of the Cape Fear estuary have provided information on hydrological changes, marsh and swamp biochemistry, bottom communities, and fisheries species. Taken together, these river studies have been critical in helping understand the resiliency of these river-dominated estuarine ecosystems to hurricane disturbance and drought, as well as the potential impacts of increased coastal development and sea-level rise.
Oysters represent one of the critical community types affecting ecosystem function and sustainability along the North Carolina coast. In addition to supporting a fishery, oyster reefs provide habitat for many other animals (including fish, shrimp, and crabs that support regional fisheries), remove materials and contaminants

21
Figure 24. Spatfall is a limiting step for reef maintenance. In conjunction with volunteers, researchers are monitoring spatfall across the State to compare the numbers of small oysters settling in different areas and at different times. A) Tiles are deployed in areas of interest and b) the number of larval oysters settling on the tiles are counted and measured to determine recruitment. Photos UNCW/Martin Posey and Troy Alphin.
from the water, and reduce shoreline loss within estuaries. Unfortunately, oysters have declined in their overall cover during the past several decades creating a need for conservation and restoration of oyster
habitats. Oyster reefs are monitored as part of ongoing efforts by several state agencies and universities (Fig. 23). Among these long-term efforts to determine oyster reef health are monitoring of spat (oyster larvae)
along the coast and assessment of reef health and extent. Settlement of small oysters (spatfall) is a limiting step for reef maintenance and extent in many areas. Spatfall monitoring (Fig. 24) is being conducted by volunteers in coastal areas using standardized methodologies that allow for the comparison of the numbers of small oysters settling in different areas and at different times. Through a program at UNC Wilmington, oyster reef health is being monitored through regular sampling that examines density of live oysters relative to shell, cover of an area by oysters, size distribution and occurrence of young oysters, as well as condition and disease incidence of the oysters on reefs.
These long-term monitoring efforts complement specific scientific and fisheries health studies conducted over short periods and designed to address targeted questions on ecosystem health. These questions range from basic ecosystem function (e.g., nutrient impacts on food web dynamics or life histories of estuarine species) to best management practices for restoration efforts. They also include targeted efforts in the adjacent coastal oceans that seek to extend our knowledge from the estuaries and sounds to the offshore regions that support many of the larvae and/or adults of estuarine organisms. By combining multiple long-term monitoring techniques, ranging from physical collection of specimens to real-time environmental observations (i.e., temperature and salinity), with controlled studies of shorter duration, the best opportunities exist to improve our understanding of coastal ecosystems and to develop best management approaches.
22
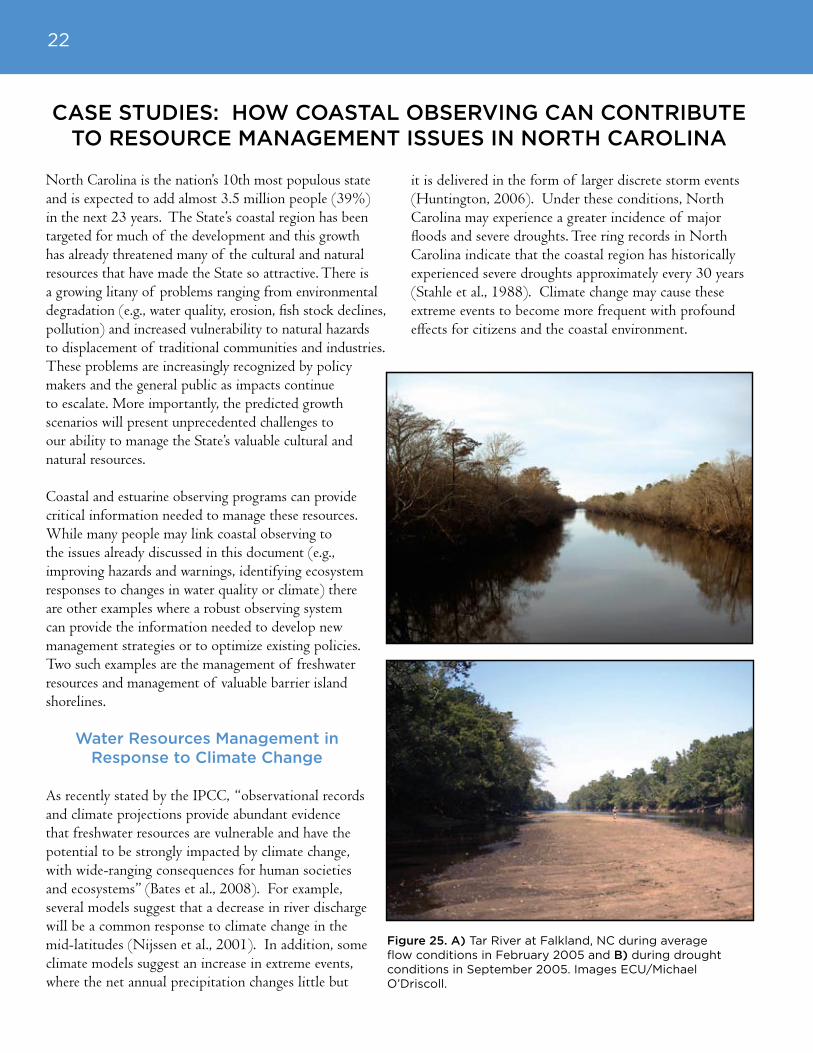
Figure 25. A) Tar River at Falkland, NC during average flow conditions in February 2005 and b) during drought conditions in September 2005. Images ECU/Michael O’Driscoll.
North Carolina is the nation’s 10th most populous state and is expected to add almost 3.5 million people (39%) in the next 23 years. The State’s coastal region has been targeted for much of the development and this growth has already threatened many of the cultural and natural resources that have made the State so attractive. There is a growing litany of problems ranging from environmental degradation (e.g., water quality, erosion, fish stock declines, pollution) and increased vulnerability to natural hazards to displacement of traditional communities and industries. These problems are increasingly recognized by policy makers and the general public as impacts continue to escalate. More importantly, the predicted growth scenarios will present unprecedented challenges to our ability to manage the State’s valuable cultural and natural resources.
Coastal and estuarine observing programs can provide critical information needed to manage these resources. While many people may link coastal observing to the issues already discussed in this document (e.g., improving hazards and warnings, identifying ecosystem responses to changes in water quality or climate) there are other examples where a robust observing system can provide the information needed to develop new management strategies or to optimize existing policies. Two such examples are the management of freshwater resources and management of valuable barrier island shorelines.
Water Resources Management in Response to Climate Change
As recently stated by the IPCC, “observational records and climate projections provide abundant evidence that freshwater resources are vulnerable and have the potential to be strongly impacted by climate change, with wide-ranging consequences for human societies and ecosystems” (Bates et al., 2008). For example, several models suggest that a decrease in river discharge will be a common response to climate change in the mid-latitudes (Nijssen et al., 2001). In addition, some climate models suggest an increase in extreme events, where the net annual precipitation changes little but
it is delivered in the form of larger discrete storm events (Huntington, 2006). Under these conditions, North Carolina may experience a greater incidence of major floods and severe droughts. Tree ring records in North Carolina indicate that the coastal region has historically experienced severe droughts approximately every 30 years (Stahle et al., 1988). Climate change may cause these extreme events to become more frequent with profound effects for citizens and the coastal environment.
CAsE sTUDIEs: HOW COAsTAl ObsERVING CAN CONTRIbUTE TO REsOURCE MANAGEMENT IssUEs IN NORTH CAROlINA
23
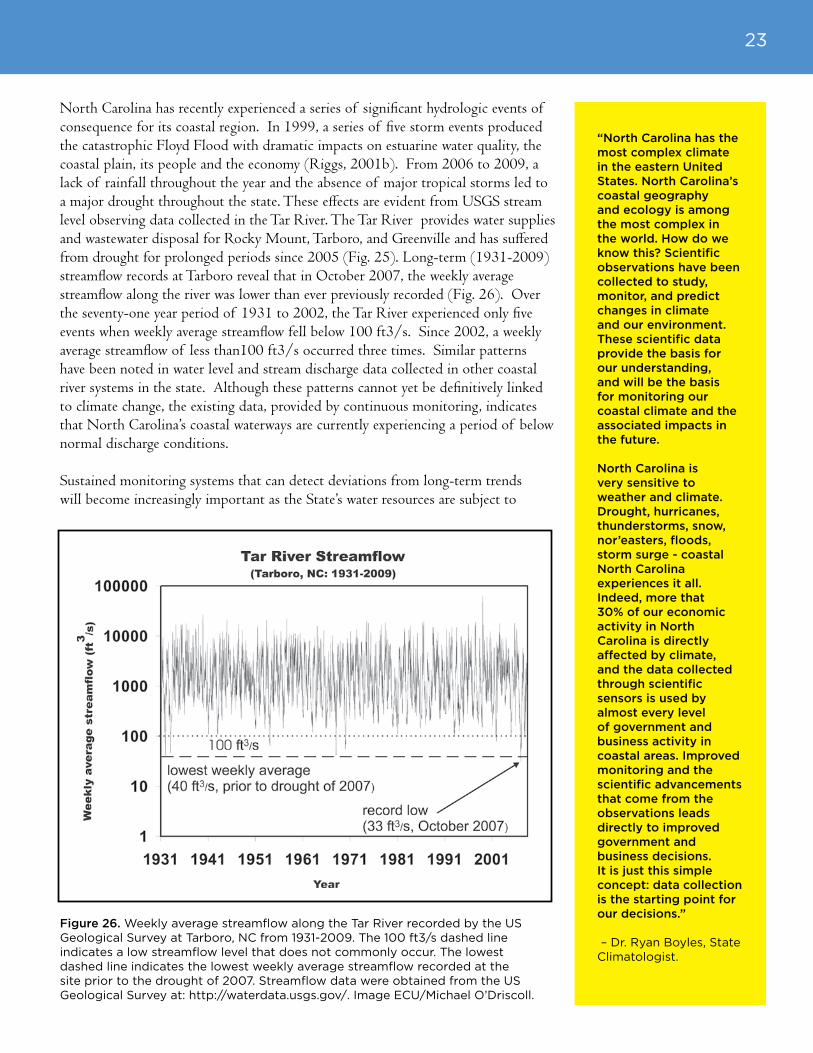
Figure 26. Weekly average streamflow along the Tar River recorded by the US Geological Survey at Tarboro, NC from 1931-2009. The 100 ft3/s dashed line indicates a low streamflow level that does not commonly occur. The lowest dashed line indicates the lowest weekly average streamflow recorded at the site prior to the drought of 2007. Streamflow data were obtained from the US Geological Survey at: http://waterdata.usgs.gov/. Image ECU/Michael O’Driscoll.
North Carolina has recently experienced a series of significant hydrologic events of consequence for its coastal region. In 1999, a series of five storm events produced the catastrophic Floyd Flood with dramatic impacts on estuarine water quality, the coastal plain, its people and the economy (Riggs, 2001b). From 2006 to 2009, a lack of rainfall throughout the year and the absence of major tropical storms led to a major drought throughout the state. These effects are evident from USGS stream level observing data collected in the Tar River. The Tar River provides water supplies and wastewater disposal for Rocky Mount, Tarboro, and Greenville and has suffered from drought for prolonged periods since 2005 (Fig. 25). Long-term (1931-2009) streamflow records at Tarboro reveal that in October 2007, the weekly average streamflow along the river was lower than ever previously recorded (Fig. 26). Over the seventy-one year period of 1931 to 2002, the Tar River experienced only five events when weekly average streamflow fell below 100 ft3/s. Since 2002, a weekly average streamflow of less than100 ft3/s occurred three times. Similar patterns have been noted in water level and stream discharge data collected in other coastal river systems in the state. Although these patterns cannot yet be definitively linked to climate change, the existing data, provided by continuous monitoring, indicates that North Carolina’s coastal waterways are currently experiencing a period of below normal discharge conditions.
Sustained monitoring systems that can detect deviations from long-term trends will become increasingly important as the State’s water resources are subject to
“North Carolina has the most complex climate in the eastern United states. North Carolina’s coastal geography and ecology is among the most complex in the world. How do we know this? scientific observations have been collected to study, monitor, and predict changes in climate and our environment. These scientific data provide the basis for our understanding, and will be the basis for monitoring our coastal climate and the associated impacts in the future.
North Carolina is very sensitive to weather and climate. Drought, hurricanes, thunderstorms, snow, nor’easters, floods, storm surge - coastal North Carolina experiences it all. Indeed, more that 30% of our economic activity in North Carolina is directly affected by climate, and the data collected through scientific sensors is used by almost every level of government and business activity in coastal areas. Improved monitoring and the scientific advancements that come from the observations leads directly to improved government and business decisions. It is just this simple concept: data collection is the starting point for our decisions.”
– Dr. Ryan Boyles, State Climatologist.

24
increased demand. As climate changes occur and the human population grows, the state will face issues related to the availability of fresh water, water quality, and the ecological health of aquatic ecosystems in coastal North Carolina. The state will require new management techniques that encourage conservation, wastewater reuse, and groundwater recharge to reduce the seasonal variability of water supplies and reduce demands on surface water systems during the critical summer months. Coastal observing efforts that combine hydrologic monitoring (e.g., streamflow and precipitation)
with other climate or marine monitoring will provide the information that researchers and decision-makers need to evaluate and mitigate for the effect of climate change on both freshwater and saltwater resources.
barrier Island and Coastal Management in Response to Climate Change
North Carolina has more than 300 miles of barrier island shoreline. These environments not only protect lives, economic infrastructure and cultural/historic
Figure 27. Panel A. A September 25, 2008 photograph shows that the ocean shoreline in South Nags Head has receded so far that sand-bagged houses are now in the surf zone. Septic tanks and associated drain fields are destroyed, the shoreline is actively eroding the access road, and the sand bags have either been moved or sunk into the sand by wave action. Panel b. Photograph shows ocean-side of sandbagged houses in South Nags Head on Bodie Island. Panels C and D show a nearly impenetrable “wall” of structures on Bogue Banks. Moderate storm surges will be funneled between the structures, increasing the risk of flooding and damage to structures further from the ocean front. A very large storm surge may destroy many of the structures, producing large overwash deposits and possibly an inlet if the geologic framework is conducive to inlet development. Photos A and B: ECU/Stan Riggs. Photos C and D: Carteret County Shore Protection Office.

25
landmarks, but are central to one of North Carolina’s largest industries – tourism. Several billion dollars in tourism revenue per year is generated in the State’s 20 coastal counties; areas that are highly vulnerable to tropical storms, hurricanes, and sea-level rise. Sea-level rise and storm activity are the two main processes that drive barrier island migration and coastal erosion (Riggs and Ames, 2007). Coastal observing efforts that provide information about these processes (e.g., water level, waves, winds, currents) are required to determine the geological responses of coastlines. Further, as coastal populations continue to increase, long-term monitoring is required to determine the extent to which human activities influence an island’s response to natural processes.
For example, a cooperative, multi-year research program involving East Carolina University, the North Carolina Geological Survey and the US Geological Survey has shown that, in areas with minimal human influence, sand is transported during storms across the islands
as overwash or funneled through inlets, both of which allow the islands to build width and elevation in the face of rising sea level (Smith et al., 2008). Human modifications such as construction of barrier dune-ridges, hardening of shorelines, filling of newly-opened inlets, as well as construction and maintenance of highways and buildings (Fig. 27), interfere with these natural processes and accelerate erosion on both the ocean and estuarine side of the island. These island segments are likely to undergo the most rapid island recession and may develop multiple inlets in the near future. Construction of fixed structures (e.g., roads, houses, motels, etc.) along the ocean shoreline results in the inevitable conflict between receding shorelines and fragile human structures. For developed islands, the extent of damage depends on the interplay between the type and degree of development and the intensity of the storm surge (Fig. 27). Meteorological (e.g., wind speed, wind direction and barometric pressure), wave, and water level data provided by coastal observing systems are essential to accurate predictions of storm surge which
can be used by coastal managers to develop community-specific land use plans and storm response scenarios.
Routinely collected aerial photography is another form of coastal observing used by coastal managers. The North Carolina Division of Coastal Management (NCDCM, 2004) ocean shoreline erosion data for the Outer Banks, based upon aerial photograph analysis from 1946 to 1998, calculates an average annual erosion rate of 1 ½ feet/year (J. Warren, pers. comm., 2008) with local rates that range upwards to 15 feet/year. Analysis of historic surveys and aerial photographs of the Outer Banks from 1849 to 2003 demonstrated a net landward movement of the ocean shoreline for the past one and a half centuries (Riggs and Ames, 2007). Between Avon and Buxton the ocean shoreline has receded up to 2,500 feet over 151 years, which is an average annual erosion rate of up to 17 feet per year (Fig. 28). Up to 76 % of the island width in 1852 has been lost and NC Highway 12 has been moved westward four times since 1955. In the urbanized area of South Nags Head, the ocean shoreline has receded up to 1,000 feet in 149
Figure 28. A 2003 aerial photograph of the Avon-Buxton portion of the Cape Hatteras National Seashore displays the location of the 1852 shoreline (yellow line) relative to the shoreline location in 2003. NC Highway 12 (black line) was constructed in 1955 and has ‘gone to sea’. The highway was rebuilt in 1974 (red line), in 1999 (white line), and again in 2003 (green line). Figure ECU/Stan Riggs and Dorothea Ames.
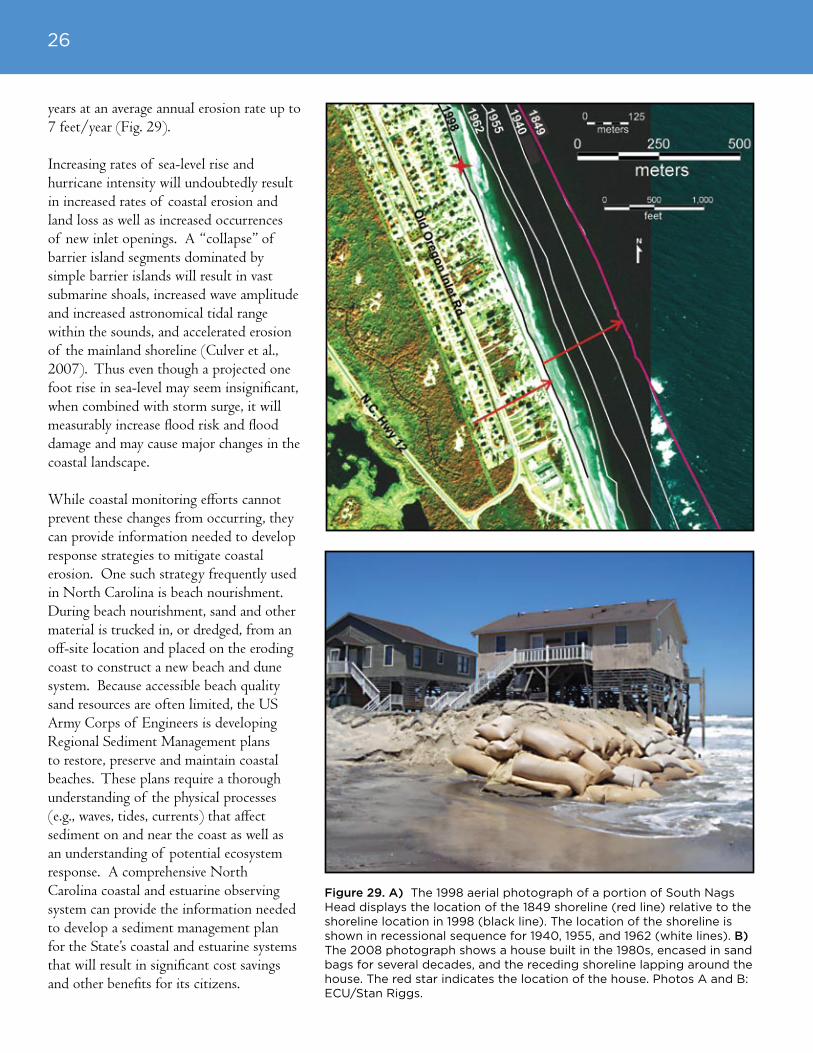
26
Figure 29. A) The 1998 aerial photograph of a portion of South Nags Head displays the location of the 1849 shoreline (red line) relative to the shoreline location in 1998 (black line). The location of the shoreline is shown in recessional sequence for 1940, 1955, and 1962 (white lines). b) The 2008 photograph shows a house built in the 1980s, encased in sand bags for several decades, and the receding shoreline lapping around the house. The red star indicates the location of the house. Photos A and B: ECU/Stan Riggs.
years at an average annual erosion rate up to 7 feet/year (Fig. 29).
Increasing rates of sea-level rise and hurricane intensity will undoubtedly result in increased rates of coastal erosion and land loss as well as increased occurrences of new inlet openings. A “collapse” of barrier island segments dominated by simple barrier islands will result in vast submarine shoals, increased wave amplitude and increased astronomical tidal range within the sounds, and accelerated erosion of the mainland shoreline (Culver et al., 2007). Thus even though a projected one foot rise in sea-level may seem insignificant, when combined with storm surge, it will measurably increase flood risk and flood damage and may cause major changes in the coastal landscape.
While coastal monitoring efforts cannot prevent these changes from occurring, they can provide information needed to develop response strategies to mitigate coastal erosion. One such strategy frequently used in North Carolina is beach nourishment. During beach nourishment, sand and other material is trucked in, or dredged, from an off-site location and placed on the eroding coast to construct a new beach and dune system. Because accessible beach quality sand resources are often limited, the US Army Corps of Engineers is developing Regional Sediment Management plans to restore, preserve and maintain coastal beaches. These plans require a thorough understanding of the physical processes (e.g., waves, tides, currents) that affect sediment on and near the coast as well as an understanding of potential ecosystem response. A comprehensive North Carolina coastal and estuarine observing system can provide the information needed to develop a sediment management plan for the State’s coastal and estuarine systems that will result in significant cost savings and other benefits for its citizens.

27
FINAl THOUGHTs: COsTs AND bENEFITs
The estimated costs of nationwide deployment and operation of coastal ocean observing systems range from tens of millions to billions of dollars per year (Kite-Powell and Colgan, 2001). No specific budget yet exists at the State level but some studies suggest that regional costs may be roughly proportional to national costs on a shoreline miles basis (Dumas and Whitehead, 2003). If this is the case, the cost of maintaining a comprehensive system for North Carolina would cost millions of dollars annually. With so many competing needs in the State, this raises the obvious question of whether or not benefits of such a
system are worth the investment.
Few studies have conducted a complete cost-benefit analysis of coastal observing for North Carolina. However, Dumas and Whitehead (2003) examined the potential economic benefits of coastal ocean observing across the southeast region and determined that for North Carolina, the economic benefit of its existing coastal observing system was more than $20 million per year. The study was based on a conservative estimate of 1% increase in operational efficiency in nine major categories; (1) maritime transportation, (2) commercial fishing, (3) recreational fishing and boating, (4) beach recreation, (5) search and rescue operations, (6) erosion control, (7) natural hazard prediction/evacuation, (8) agricultural benefits and (9) pollution management/oil spills. Thus even a minimal investment of $5 million per year (Baird, 2007), could yield substantial benefits and enhance North Carolina’s long-term capacity to protect life and property as well as manage its natural resources.
Despite the demonstrated need, sustained federal funding is not available for many of the existing networks described in this document, and is decreasing for others. It is clear that the State cannot depend on external funds to address all of its current or future observational needs within North Carolina’s waters. Now is the time for North Carolina to invest in a long-term coastal observing system that broadly engages the State and municipal agencies, private sector partners, and universities within the State (Baird, 2007). This investment is critical to support effective preparation and response to hazards, monitoring and maintaining our coastal resources (e.g., fisheries), and strengthening our educational and tourism interests (e.g., fisheries, boating). Such investment must include funding for expanded observing infrastructure in North Carolina coastal waters including the sounds and estuaries; expansion of existing coverage of real-time, non-real time and people/ship-based monitoring efforts; and development of reliable and comparable monitoring protocols between state agencies and universities.
To learn more about observing, obtain a digital copy of this document, or to access real-time observational data, please refer to http://carolinasrcoos.org and http://www.coastal.geology.ecu.edu/NCCOHAZ/.
“When the scientific community projects sea level rise, they typically report rates in terms of millimeters per year and discuss changes over time scales of centuries. However, the public is rightfully concerned about what their favorite beach is going to look like this summer. Further, raising awareness of the threats of sea-level rise, reported at scales of millimeters per year, has been equated to being fearful of an attack by giant snails. These perceptions make life difficult for coastal managers. so what should we do? • Communicate clearly that the response to sea-level rise will not be linear and threshold conditions could be reached and exceeded. One, two, or even three feet of sea-level rise per century does not seem particularly imposing. but rise-related barrier island breaching will lead to significantly increased tidal range and shoreline erosion. • Moving climate and sea-level policy forward will be a slow process. Elections generally occur on 4-year cycles and the average family/person owns their home for roughly 7 years before moving on. In the field of coastal defense, most shore protection projects have expected life spans of 5 to 10 years. Thus, most of the planning we do is for the short term. stressing “an ounce of prevention is better than a pound of cure” is an important goal.• It is paramount that we build upon the science that exists today to help support coastal management decision making in the future. strategic placement of observation platforms in our estuaries and sounds will provide us with a better understanding of the likely effects of climate change and sea-level rise which, in turn, will aid policy formulation and ensure that North Carolina’s coastal resources are successfully managed and preserved for generations to come.”
-Greg “Rudi” Rudolph, Carteret County Shore Protection Office

28
Many of the findings presented in this document are the product of research conducted by marine scientists, staff, and students of the University of North Carolina System. These institutions include: University of North Carolina Wilmington, East Carolina University, University of North Carolina Chapel Hill, North Carolina State University, and the University of North Carolina Coastal Studies Institute. Additional contributions were provided by scientists from Duke University, the University of Pennsylvania, NOAA’s National Weather Service Wilmington and Newport-Morehead City Forecast Offices, the U.S. Army Corps of Engineers Field Research Facility, the North Carolina State Climate Office, and the Carteret County Emergency Management Office. The observing, monitoring and research activities described in this document have been supported by a variety of federal and state organizations including: NOAA’s Coastal Services Center, NOAA’s Integrated Ocean Observing System, NOAA’s Coastal Ocean Program, NOAA’s National Data Buoy Center, Office of Naval Research, N.C. Division of Coastal Management, U.S. Army Corps of Engineers, N.C. Department of Transportation, N.C. Department of Environmental and Natural Resources, N.C. Sea Grant, N.C. National Estuarine Research Reserve, New Hanover County, The Northeast New Hanover Conservancy, North Carolina Clean Water Management Trust, National Science Foundation, U.S. Geological Survey, NC Renaissance Computing Institute. Finally, we are very grateful for funding provided by University of North Carolina Research Competiveness awards that supported several of these observing activities as well as compilation of this document.
ACKNOWlEDGEMENTs
29
Allen, M.R., and Ingram, W.J. 2002. Constraints on future changes in climate and the hydrological cycle. Nature, 419: 2224–2232. Baird, R. 2007. The North Carolina Integrated Coastal Observing System: A Blueprint for Progress. A report to the University of North
Carolina General Administration. 30p. Bates, B.C., Kundzewicz, Z.W., Wu, S. and Palutikof, J.P. 2008. Climate Change and Water. Technical Paper of the Intergovernmental Panel on
Climate Change, IPCC Secretariat, Geneva, 210 p.Bengtesson, K.I. Hodges, M. Esch, N. Keenlyside, L. Kornbleuh, J.-J. Luo, T. Yamagata. 2007. How may tropical cyclones change in a warmer
climate? Tellus 59A: 539-561.Blanchon, P., and Shaw, J. 1995. Reef drowning during the last deglaciation: evidence for catastrophic sea-level rise and ice-sheet collapse.
Geology, 23: 4-8.Brinson, M.M., Bradshaw, H.D., and Jones, M.N. 1985. Transitions in forested wetlands along gradients of salinity and hydroperiod. Journal of
the Elisha Mitchell Scientific Society, 101: 76-94.Brinson, M. M., Christian, R.R., and Blum, L.K. 1995. Multiple states in the sea-level induced transition from terrestrial forest to estuary.
Estuaries, 18: 648-659. Buzzelli, C.P., Ramus, J.R. and Paerl, H.W. 2003. Ferry-based monitoring of surface water quality in North Carolina estuaries. Estuaries, 26:
975-984.Christian, R. R., Stasavich, L., Thomas, C., and Brinson, M.M. 2000. Reference is a moving target in sea-level controlled wetlands. In M. P.
Weinstein and D. A. Kreeger (eds.), Concepts and Controversies in Tidal Marsh Ecology. Kluwer, The Netherlands, p. 805-825.Corbett, D.R., Vance, D., Letrick, E., Mallinson, D., and Culver, S.J. 2007. Decadal-scale sediment dynamics and environmental change in the
Albemarle estuarine system, North Carolina. Estuarine, Coastal, and Shelf Science, 71: 717-729.Culver, S., Grand Pre, C., Mallinson, D., Riggs, S., Corbett, D., Foley, J., Hale, M., Ricardo, J., Rosenberger, J., Smith, C.G., Smith, C.W., Snyder,
S., Twamley, D., Farrell, K., Horton, B. 2007. Late Holocene Barrier Island Collapse: Outer Banks, North Carolina, U.S.A. The Sedimentary Record, 5: 4-8.
Donnelly, J.P., and J.D. Woodruff. 2007. Intense hurricane activity over the past 5000 years controlled by El Nino and the West African monsoon. Nature 447: 465-468.
Droxler, A., and Farrell, J., 2000. Marine Isotope Stage 11 (MIS 11): new insights for a warm future. Global and Planetary Change, 24: 1-5.Dumas, C.F., and Whitehead, J.C. 2008. The potential economic benefits of integrated and sustainable ocean observation systems: the southeast
Atlantic Region. Coastal Management Journal, 36:146-164.Elsner, J.B., Kossin, J.P., and Jagger, T.H. 2008. The increasing intensity of the strongest tropical cyclones. Nature, 455: 92-95.Emanuel, K., 2005. Increasing destructiveness of tropical cyclones over the past 30 years. Nature, 436: 686-688.Emanuel, K., Sundararajan, R., and Williams, J. 2008. Hurricanes and global warming, Bulletin of the American Meteorological Society, 89: 347-
367.Engle, Jason, J. MacMahan, R. J. Thieke, D. M. Hanes, R. G. Dean. 2002. Formulation of a rip current predictive index using rescue data.
Proceedings, National Conference on Beach Preservation Technology, FSBPA, January 23-25, 2002, Biloxi, MS.Ensign, S.H., and Paerl, H.W. 2006. Development of an unattended estuarine monitoring program using ferries as data collecting platforms.
Limnology and Oceanography Methods, 4:399-405.Fairbanks, R.G., 1990. The age and origin of the Younger Dryas climate event in Greenland ice cores. Paleoceanography, 5: 937-948.Hearty, P.J., Hollin, J.T., Neumann, A.C., O’Leary, M.J., McCulloch, M. 2007. Global sea-level fluctuations during the Last Interglacial (MIS 5e).
Quaternary Science Reviews, 26: 2090-2112.Horton, B.P., Peltier, W. R., Culver, S.J., Drummond, R., Engelhart, S.E., Kemp, A., Mallinson, D.J., Thieler, E.R., Riggs, S.R., and Ames, D.V.
2008. Holocene sea-level changes along the North Carolina coastline: implications for glacial isostatic models and current rates of sea-level change. GSA Annual Meeting, Houston, October, 2008.
Horton, B.P., Peltier, W.R., Culver, S.J., Drummond, R., Engelhart, S.E., Kemp, A.C., Mallinson, D., Thieler, E.R., Riggs, S.R., Ames, D.V., in press. Holocene sea-level changes along the North Carolina coastline and their implications for glacial isostatic adjustment models. Quaternary Science Reviews.
Huntington, T.G. 2006. Evidence for intensification of the global water cycle: review and synthesis. Journal of Hydrology, 319: 83-95.
REFERENCEs CITED
30
Imbrie, J., Berger, A., Boyle, E.A., Clemens, S.C., Duffy, A., Howeard, W.R., Kukla, G., Kutzbach, J., Marinson, D.G., McIntyre, A., Mix, A.C., Molfino, B., Morley, J.J., Peterson, L.C., Pisias, N.G., Prell, W.L., Raymo, M.E., Shackleton, N.J., and Toggweiler, J.R. 1993. On the structure and origin of major glaciation cycles 2. The 100,000-year cycle. Paleoceanography 8: 699-735.
IPCC. 2007. Summary for Policymakers. Climate Change 2007: The Physical Science Basis. Contribution Of Working Group I to the Fourth Assessment Report of the Intergovernmental Panel on Climate Change, Solomon, S., Qin, D., Manning, M., Chen, Z., Marquis, M., Averyt, K.B., Tignor, M., and Miller, H.L., Eds., Cambridge University Press, Cambridge, UK.
Kemp, A., Horton, B.P., Culver, S.J., Corbett, D.R., Van De Plassche, O. and Edwards, R. 2008. Early onset of accelerated relative sea-level rise in North Carolina, USA. GSA Annual Meeting, Houston, October, 2008.
Kite-Powell, H. L., and Colgan, C. 2001. The Potential Economic Benefits of Coastal Ocean Observing Systems: The Gulf of Maine. National Oceanic and Atmospheric Administration and Woods Hole Oceanographic Institution.
Knutson, T.R., Sirutis, J.J., Garner, S.T., Vecchi, G.A., and Held, I.M. 2008. Simulated reduction in Atlantic hurricane frequency under twenty-first-century warming conditions. Nature Geoscience 1: 359-364, doi:1038/nge0202.
Landsea, C. 2007. Counting Atlantic tropical cyclones back in time. EOS Transactions, American Geophysical Union, 88(18):197-200.Locker, S., D., Hine, A.C., Tedesco, L.P., and Shinn, E.A., 1996. Magnitude and timing of episodic sea-level rise during the last deglaciation.
Geology, 24: 827-830.MacMahan, J. H., Thornton, E.B., Reniers, A. J. H. M. 2006. Rip current review. Coastal Engineering, 53: 191-208. Mallinson, D., Burdette, K., Mahan, S., and Brook, G. 2008. Optically stimulated luminescence age controls on late Pleistocene and Holocene
coastal lithosomes: North Carolina, USA. Quaternary Research, 69: 97-109.NCDCM. 2004. North Carolina 1998 long-term average annual erosion rate update: methods report by Benton, S.B., Bellis, C.J., Knisel, J.M.,
Overton, M.F., and Fisher, J.S. North Carolina Division of Coastal Management, Raleigh, NC. Nijssen, B., O’Donnell, G., Hamlet, A., and Lettenmaier, D. 2001. Hydrologic sensitivity of global rivers to climate change. Climatic Change 50:
143–175.North Carolina Dept. of Environment and Natural Resources-Division Water Quality. 2001. Phase II of the Total Maximum Daily Load for
Total Nitrogen to the Neuse River Estuary, NC. NCDENR-DWQ, Raleigh, NC.Pielke, R.A., Jr., Gratz, J., Landsea, C., Collins, D., Saunders, M.A., and Musulin, R. 2008. Normalized hurricane damage in the United States:
1900-2005. Natural Hazards Review, 9: 29-42.Riggs, S. R. 2001a. Shoreline Erosion in North Carolina Estuaries. Raleigh, NC: North Carolina Sea Grant, 68 p.Riggs, S.R. 2001b. Anatomy of a flood. In Maiolo et al. (eds.), Facing Our Future: Hurricane Floyd and Recovery in the Coastal Plain. Coastal
Carolina Press, 29-45.Riggs, S. R. and Ames, D.V. 2003. Drowning the North Carolina Coast: Sea Level Rise and Estuarine Dynamics. Raleigh, NC: North Carolina
Sea Grant, 152 p.Riggs, S.R., and Ames, D.V. 2007. Effect of Storms on Barrier Island Dynamics, Core Banks, Cape Lookout National Seashore, North Carolina,
1960-2001. U.S. Geological Survey, Scientific Investigations Report 2006-5309, 73 p.Smith, C.G., Culver, S.J., Riggs, S.R., Ames, D., Corbett, D.R., and Mallinson, D. 2008. Geospatial analysis of barrier island width of two
segments of the Outer Banks, North Carolina, USA: anthropogenic curtailment of natural self-sustaining processes. Journal of Coastal Research, 24: 70-83.
Stahle, D.W., Cleaveland, M.K., and Hehr, J.G. 1988. North Carolina climate changes reconstructed from tree rings: A.D. 372 to 1985. Science, 240: 1517-1519.
Vecchi, G.A., Soden, B.J. 2007. Increased tropical Atlantic wind shear in model projections of global warming. Geophysical Research Letters, 34: L08702, doi:10.1029/2006GL028905.
Washington Post. 2007. FerryMon: with every trip, new data on Outer Banks. Feature Article, 25 June, 2007.Webster, P.J., Holland, G.J., Curry, J.A. and Chang, H.R., 2005. Changes in tropical cyclone number, duration, and intensity in a warming
environment. Science, 309: 1844-1846.Zwally, H.J., Abdalati, W., Herring, T., Larson, K., Saba, J., Steffen, K., 2002. Surface melt-induced acceleration of Greenland Ice-Sheet flow.
Science, 297: 218-222.

bACK COVER PHOTOGRAPH. An instrumented tripod from East Carolina University is deployed in the Pamlico River estuary to monitor waves, currents and water quality. Photo ECU/J.P. Walsh.
