estimation of walrus populations on sea ice with infrared imagery and aerial photography
TRANSCRIPT

MARINE MAMMAL SCIENCE, 24(1): 57–70 ( January 2008)C© 2007 by the Society for Marine MammalogyDOI: 10.1111/j.1748-7692.2007.00169.x
Estimation of walrus populations on sea ice with infraredimagery and aerial photography
MARK S. UDEVITZ
USGS Alaska Science Center,1011 East Tudor Road,
Anchorage, Alaska 99503, U.S.A.E-mail: mark [email protected]
DOUGLAS M. BURN
MARC A. WEBBER1
U.S. Fish and Wildlife Service,Marine Mammals Management Office,
1011 East Tudor Road,Anchorage, Alaska 99503, U.S.A.
ABSTRACT
Population sizes of ice-associated pinnipeds have often been estimated with visualor photographic aerial surveys, but these methods require relatively slow speeds andlow altitudes, limiting the area they can cover. Recent developments in infraredimagery and its integration with digital photography could allow substantiallylarger areas to be surveyed and more accurate enumeration of individuals, therebysolving major problems with previous survey methods. We conducted a trial surveyin April 2003 to estimate the number of Pacific walruses (Odobenus rosmarus divergens)hauled out on sea ice around St. Lawrence Island, Alaska. The survey used highaltitude infrared imagery to detect groups of walruses on strip transects. Low altitudedigital photography was used to determine the number of walruses in a sample ofdetected groups and calibrate the infrared imagery for estimating the total number ofwalruses. We propose a survey design incorporating this approach with satellite radiotelemetry to estimate the proportion of the population in the water and additionallow-level flights to estimate the proportion of the hauled-out population in groupstoo small to be detected in the infrared imagery. We believe that this approachoffers the potential for obtaining reliable population estimates for walruses andother ice-associated pinnipeds.
Key words: aerial survey, Bering Sea, digital photography, infrared, Odobenus ros-marus divergens, Pacific walrus, Poisson regression, population estimation, regressionestimation, thermal imagery.
1Present address: U.S. Fish and Wildlife Service, Muscatatuck National Wildlife Refuge, 12589 EastU.S. Highway 50, Seymour, Indiana 47274, U.S.A.
57

58 MARINE MAMMAL SCIENCE, VOL. 24, NO. 1, 2008
Population sizes of ice-associated pinnipeds are often estimated with visual orphotographic aerial surveys (Myers and Bowen 1989, Green et al. 1995, Rogers andBryden 1997, Udevitz et al. 2001, Bengtson et al. 2005). Aircraft provide one of thebest means for covering the vast areas of shifting pack ice where these populationsoccur (Erickson et al. 1993, Green et al. 1995). However, the amount of area thatcan be covered is limited by the relatively slow speeds and low altitudes required foreffective photography or visual observation. Photography reduces the potential forobserver bias (Thompson and Harwood 1990, Mansfield and St. Aubin 1991), butphotographic surveys have generally required animals to be detected visually beforethey can be photographed. Continuous, unsupervised photography that producesimages for both detection and enumeration of individuals has only recently begun tobe used in marine mammal surveys (Heide-Jorgensen 2004, Krafft et al. 2006).
Continuous images can also be collected by airborne infrared imaging systems(Burn et al. 2006). These systems have the potential to allow detection of animalsfrom greater altitudes, increasing the area that can be surveyed per unit time (Dunnet al. 2002, Haroldson et al. 2003, Bernatas and Nelson 2004). A variety of infraredimaging systems have been investigated, with mixed results, for applicability tosurveys of marine and terrestrial species, including cetaceans (Cuyler et al. 1992),pinnipeds (Barber et al. 1991, Burn et al. 2006, Chernook, unpublished data2),ungulates (Garner et al. 1995, Dunn et al. 2002, Haroldson et al. 2003), smallmammals (Boonstra et al. 1994), and birds (Garner et al. 1995). Infrared imagingmay be particularly effective for walruses (Odobenus rosmarus) and ice seals because oftheir thermal contrast with the ice (Ray and Fay 1968).
Aerial infrared surveys have been used to estimate population sizes for some ter-restrial wildlife species, where individuals could be distinguished and enumerateddirectly from the imagery (Bernatas and Nelson 2004, Kinzel et al. 2006). The onlyexample of infrared-based population estimation for a marine mammal we are awareof is for harp seals (Pagophilus groenlandicus) in the White Sea (Chernook, unpublisheddata2). In this case, individuals also were enumerated directly from the imagery.Infrared imaging has not been used previously to estimate population size for anyspecies with individuals that could not be separately distinguished within the groupsin the imagery.
The Pacific walrus (Odobenus rosmarus divergens) population is a significant com-ponent of the Bering and Chukchi Sea ecosystems and is an important subsistenceresource for coastal communities in Alaska and Chukotka (Fay et al. 1997), but thesize of this population is unknown (U.S. Fish and Wildlife Service 2002). The U.S.and former Soviet Union made four attempts to jointly estimate this population at5-yr intervals from 1975 to 1990 (Gilbert 1999, Udevitz et al. 2001). However,primarily because of the vast and poorly accessible range of the population, its highlyaggregated distribution, and problems with extreme detection and availability bi-ases, none of these efforts provided reliable population estimates (Estes and Gilbert1978, Hills and Gilbert 1994, Gilbert 1999).
Recent developments in infrared imagery and its integration with digital photog-raphy might allow coverage of vast areas and accurate enumeration, solving majorproblems with previous attempts to estimate walrus populations (Burn et al. 2006).Major aggregations of walruses typically occur during spring in association with poly-nas that form around St. Lawrence Island (Fay 1982). We conducted a trial survey to
2 Personal communication from V. Chernook, GiproRybFlot Fisheries Research Institute, 18–20 M.Morskaya Street, Saint Petersburg 190000, Russia, October 2004.

UDEVITZ ET AL.: ESTIMATION OF WALRUS POPULATIONS 59
estimate the number of walruses hauled out on sea ice in a portion of this region. Thesurvey used high altitude thermal infrared imagery to detect groups of walruses onstrip transects. Individual walruses were not distinguishable within infrared imagesof densely packed groups. Low altitude digital photography was used to determinethe number of walruses in a sample of detected groups and calibrate the infraredimagery for estimating total number of walruses. We used the coefficient of variation(CV) from our trial survey as a basis for a power analysis to estimate the probabilityof detecting population trends with repeated surveys of this type.
METHODS
Aerial Survey
Our survey area consisted of a 95,000-km2 region of pack ice in the Bering Seasurrounding St. Lawrence Island (Fig. 1). The area is characterized by a recurringpolyna and is known to support major concentrations of walruses during the latewinter–early spring breeding season (Fay 1982). The area was partitioned into sevenstrata designed so that each could be surveyed in a single flight. Due to mechanicalproblems and lack of additional suitable weather during the survey period, onestratum was not surveyed, and we developed estimates only for the six surveyed strata.Each stratum was partitioned into parallel north–south strip transects. Transects were6-km wide, corresponding to the field of view for the infrared scanner from our surveyaltitude. A random sample of transects was selected to be surveyed in each stratum,providing approximately 30% coverage of the stratum area (Fig. 1).
Figure 1. Strata boundaries (solid lines), flight lines (dashed lines), and locations of walrusgroups (circles) detected in an infrared aerial survey of sea ice around St. Lawrence Island,Alaska, April 2003.

60 MARINE MAMMAL SCIENCE, VOL. 24, NO. 1, 2008
Surveys were conducted on clear weather days during 5–10 April 2003. We used aDaedelus Airborne Multispectral Scanner, built by SenSyTech, Inc. (now Argon ST)of Ann Arbor, Michigan, and mounted in the tail section of an Aero Commander690B turbine engine aircraft. The scanner had a 1.25 milliradian instantaneous fieldof view and collected imagery across a sensor array that was 1,440 pixels wide. Werecorded six spectral channels of information, with at least one channel in the thermalinfrared (8.5–12.5 �m) range. Each channel was recorded with 12-bit radiometricresolution.
The aircraft flew along the centerline of each selected strip transect at an altitudeof 3,200 m and a speed of 370 km/h. At this altitude, the spatial resolution of theinfrared imagery was 4 m and the scanner field of view was 6 km. An observer in theaircraft monitored the scanner display during survey operations. Walrus groups wereevident as bright spots, contrasting with the darker ice background on the display.
After completing survey transects, the aircraft reduced altitude to 762 m andused GPS coordinates to navigate back to groups detected with the scanner. High-resolution digital photographs were taken of as many of these groups as possible, aswell as any other groups in the vicinity, with a 5.47 megapixel, Nikon D1X cam-era mounted vertically within the aircraft. Photographs were taken with a 180-mmlens that produced an effective ground resolution of 3.4-cm2 pixels. This resolu-tion was sufficient to distinguish and count individual walruses within a group andwas obtained at an altitude that minimized disturbance to resting animals (Burnet al. 2006). Each photograph was encoded with latitude and longitude coordinatesfrom a GPS attached to the camera and loaded directly to a notebook computerthat was also used to control the camera settings and immediately confirm imagequality.
The infrared scanner was also used to detect and record walrus groups while intransit between transects over the study area at the survey altitude. Photographs ofthese additional groups were obtained opportunistically, with emphasis on largergroups only rarely found on survey transects. Data obtained while not on surveytransects were used only for calibrating the infrared imagery and not for estimatingabundance.
Data Preparation
Image processing followed procedures developed by Burn et al. (2006). Infraredimage data were imported directly from 8-mm tape into ERDAS Imagine (LeicaGeosystems, Atlanta, GA) software. We examined the temperature histogram of eachtransect to determine a threshold temperature between walruses and the backgroundenvironment (Burn et al. 2006). Pixels with temperatures warmer than the thresholdvalue were classified as having some portion of their area covered by walruses. Wecalculated an index of the total amount of heat produced by each walrus group as:
h i = a∑
(ti j − Ti ),
where hi was the index for group i, a was the pixel area (m2), tij was the temperaturefor pixel j of group i, Ti was the threshold temperature for the transect containinggroup i, and the summation was over all pixels with temperature values above thethreshold (i.e., pixels with tij > Ti).
To count the number of walruses in the photograph of each group, we used Imaginesoftware and manually marked each walrus with a colored symbol. Each walrus group

UDEVITZ ET AL.: ESTIMATION OF WALRUS POPULATIONS 61
was enumerated three times by one or more observers on different dates, withoutreference to previous counts, using a different colored symbol each time. Finally, allthree counts were displayed simultaneously and compared to resolve any differencesand arrive at a final, rectified count for each group.
We estimated the scanner’s detection limit by comparing photographic counts forthe smallest thermally detected walrus groups to those for the largest groups thatwere not thermally detected.
Estimation
Data from all of the photographed groups were used to develop a regression modelrelating group size to the thermal index. Preliminary examination of the data indi-cated that variances of the photographic counts were proportional to the mean counts.Therefore, we used a generalized linear model (McCullagh and Nelder 1989) withan identity link and a Poisson distribution to estimate the relation between numberof individuals and the thermal index values for the photographed groups. The formof this model was
E (yi ) = � + �h i , Var(yi ) = �(� + �h i ),
where yi is the number of walruses and hi is the thermal index for group i, � isthe minimum size group that can be detected by the scanner, � is the regressioncoefficient estimated with maximum likelihood, and � is the dispersion parameterestimated as Pearson’s chi-square divided by the degrees of freedom. We assessedmodel fit using deviance residuals (McCullagh and Nelder 1989, pp. 398–401) andcumulative residuals (Lin et al. 2002) and used a likelihood ratio test to assess theregression parameter.
This model was then used to estimate the number of walruses in each groupthat was thermally detected on a surveyed transect but not photographed. The totalnumber of hauled-out walruses on a surveyed transect was estimated by summingthe counts of individuals in all the photographed groups and the estimated countsin all the detected groups that were not photographed on that transect. For transectt in stratum b,
N̂tb =c tb∑
g =1
yg tb +Gtb∑
g =c tb +1
(� + �̂h g tb ),
where ygtb is the number of walruses and hgtb is the thermal index for group g ontransect t of stratum b. Photographed groups are indexed 1, . . ., ctb, and groups thatwere not photographed are indexed ctb+1, . . ., Gtb. If there were no photographedgroups on a transect, then ctb = 0.
The total population size was estimated as a sum of separate ratio estimators(Thompson 2002) of the totals for each stratum:
N̂ =B∑
b=1
(R̂b
Tb∑t=1
Atb
)=
B∑b=1
N̂b ,

62 MARINE MAMMAL SCIENCE, VOL. 24, NO. 1, 2008
where
R̂b =
tb∑t=1
N̂tb
tb∑t=1
Atb
,
Atb is the area of transect t in stratum b, Tb is the number of transects in stratum b,tb is the number of surveyed transects in stratum b, and B is the number of strata.
We estimated the variance and confidence intervals for the population estimate witha bootstrap procedure based on the general approach of Booth et al. (1994) for finitepopulations. The procedure involved generating a series of simulated populations,estimating statistics of interest by resampling from each simulated population, andthen averaging these statistics over the simulated populations.
We generated simulated populations of transects (with associated walrus observa-tions) for each stratum by first replicating the complete set of surveyed transects in thestratum as many times as possible without exceeding the total number of potentialtransects in the stratum. We then added a random sample without replacement fromthe surveyed transects to complete the population of potential transects. Bootstrapsurvey samples were obtained by drawing random samples without replacement fromthe simulated populations to give the same number of transects as in the originalsurvey.
For each bootstrap survey sample, we also obtained a bootstrap sample of photo-graphic counts for fitting the regression model. A bootstrap sample of photographedgroups included all of the photographed groups in the bootstrap sample of surveyedtransects if the number of those groups was less than or equal to the number on sur-veyed transects in the original sample. Otherwise, we sampled without replacementfrom the photographed groups in the bootstrap sample of transects to obtain thesame number as in the original survey. We then completed the bootstrap sample ofphotographed groups by sampling with replacement from the entire original sampleof groups photographed off survey transects to obtain the same total sample size (i.e.,number of groups photographed on transects + number of groups photographed offtransects) as in the original survey. This resampling strategy was designed to approx-imate the survey protocol, which supplemented the essentially random distributionof group sizes photographed on survey transects with additional off-transect pho-tographs emphasizing larger groups, thereby obtaining a more even distribution ofgroup sizes for the calibration regression.
Estimation for each bootstrap sample followed the same procedure as for the orig-inal sample. We obtained 100 bootstrap samples and associated estimates of popula-tion size for each simulated population and then calculated the standard error and 2.5and 97.5 percentiles of those estimates. We repeated this process for 500 simulatedpopulations and took the average of the standard errors and 2.5 and 97.5 percentilesas our estimates of standard errors and 95% confidence limits (Manley 1991) for theestimates from the original survey. We checked for convergence of estimates to ensurethe number of bootstrap samples and simulated populations were sufficient.
Power Analysis
We used the estimated CV from our trial survey as a basis for conducting apower analysis with TRENDS software, available at http://swfsc.noaa.gov/prd.aspx
UDEVITZ ET AL.: ESTIMATION OF WALRUS POPULATIONS 63
(Gerrodette 1987, 1991). For comparison to previous surveys, we also considered CVvalues ranging up to 0.60, which was the value estimated by Hills and Gilbert (1994)for the joint Russian–American surveys of the Pacific walrus population conductedfrom 1975 to 1990. Following Taylor et al. (2007), we estimated the probability ofdetecting a “precipitous decline” in the population, which they defined as an expo-nential decline of 5% per year over a 15-yr period. Detection of trend was basedon a t-test of the slope parameter in a linear regression of estimated population sizeversus time. We considered three different monitoring schedules, requiring surveysto be conducted at either 5-yr intervals (an initial survey plus three additional sur-veys), 3-yr intervals (an initial survey plus four additional surveys), or annually (aninitial survey plus 15 additional surveys). The 5-yr interval matched the scheduleof joint Russian–American surveys of the Pacific walrus population (Gilbert 1999,Udevitz et al. 2001). Also following Taylor et al. (2007), we assumed that the CVwas proportional to 1/sqrt(population size), used a one-tailed test of significance, andrequired the customary significance level of � = 0.05. However, this significancelevel may be unduly conservative, giving too much emphasis to guarding againsttype I (overprotection) errors and too little emphasis to guarding against type II (un-der protection) errors (Taylor et al. 2007). Therefore, we also estimated the CV thatwould be required to obtain a power of 0.9 with � = 0.10 and a power of 0.8 with� = 0.20, which balance the probabilities of over- and under protection errors.
RESULTS
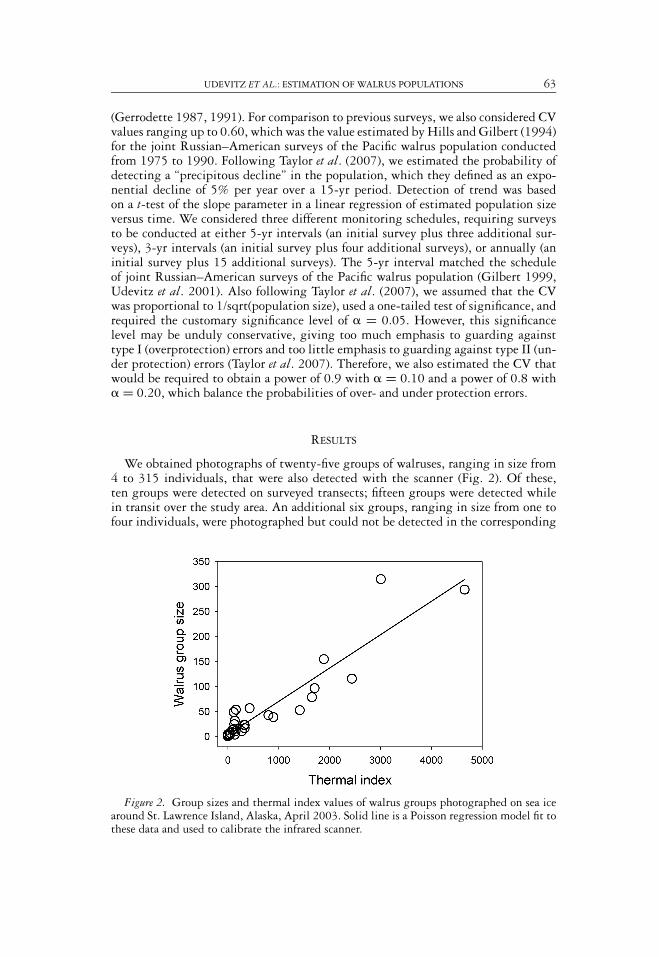
We obtained photographs of twenty-five groups of walruses, ranging in size from4 to 315 individuals, that were also detected with the scanner (Fig. 2). Of these,ten groups were detected on surveyed transects; fifteen groups were detected whilein transit over the study area. An additional six groups, ranging in size from one tofour individuals, were photographed but could not be detected in the corresponding
Figure 2. Group sizes and thermal index values of walrus groups photographed on sea icearound St. Lawrence Island, Alaska, April 2003. Solid line is a Poisson regression model fit tothese data and used to calibrate the infrared scanner.

64 MARINE MAMMAL SCIENCE, VOL. 24, NO. 1, 2008
Table 1. Areas of strata, proportions of areas covered, and walrus groups detected in aninfrared aerial survey of sea ice around St. Lawrence Island, Alaska, April 2003.
Estimated number ofindividuals per detected group
Total area Proportion of Number ofStratum (km2) area surveyed detected groups Mean Range
1 13,808 0.31 15 9 4–282 15,903 0.35 20 36 4–2593 18,455 0.25 8 16 5–424 17,525 0.21 41 7 4–266 15,310 0.30 7 22 4–547 15,900 0.38 1 4 4
infrared images (Fig. 2). The smallest photographed groups that were detected in theinfrared imagery contained four walruses (two groups). We therefore assumed thatthe groups of less than four walruses were not detectable (i.e., � = 4).
There was a strong linear relationship (� 21 = 90.02, P < 0.01) between the number
of walruses in a group and the thermal index (Fig. 2), with a slope parameter estimateof � = 0.067 (SE = 0.0070). Plots of deviance residuals showed no lack of fit to thelinear model or the Poisson variance function. For comparison, a Poisson regressionwithout the assumed detection limit gave very similar estimates of � = 5.94 (SE =2.96) and � = 0.065 (SE = 0.0074).
We surveyed thirty-five transects in six strata, covering 30% of the total area ofthose strata with the scanner (Table 1). A total of 92 walrus groups were detected onsurveyed transects, with estimated number of individuals ranging from 4 to 259 pergroup (Table 1). This gave a total estimate of 4,784 (CV = 0.25) hauled-out walrusesin the six surveyed strata at the time of the survey (Table 2).
Assuming a CV of 0.25 for the population estimate from each survey and requiringa significance level of � = 0.05 to test for trend, we estimated that the probabilityof detecting a precipitous decline in the population would be 0.36 if surveys wereconducted every 5 yr, 0.54 if surveys were conducted every 3 yr, and 0.91 if surveyswere conducted annually (Fig. 3). In all of these cases with � = 0.05, the probabilityof a type I error (overprotection) was greater than the probability of a type II error(under protection). A probability of 0.80 for detecting a precipitous decline couldbe obtained with surveys conducted at 5-yr intervals if the significance criteria for
Table 2. Estimated number of walruses hauled out on sea ice in survey strata around St.Lawrence Island, Alaska, April 2003.
Stratum Total walruses Standard error (SE) 95% confidence interval
1 424 166 131–7612 2,057 846 395–3,6933 509 349 40–1,2524 1,278 509 555–2,2596 505 317 3–1,0507 12 9 0–29Total 4,784 1,186 2,499–7,111

UDEVITZ ET AL.: ESTIMATION OF WALRUS POPULATIONS 65
Figure 3. Probability of detecting a precipitous population decline (Taylor et al. 2007) withrepeated surveys conducted at intervals from 1 to 5 yr, a significance level of � = 0.05, and arange of CV values for population estimates from individual surveys.
the t-test was increased to � = 0.20 (Table 3). This would balance the probabilitiesof over- and under protection errors. Using the CV of 0.60 estimated by Hills andGilbert (1994) for the joint Russian–American surveys and requiring � = 0.05, gavean estimated probability of 0.15 for detecting a precipitous decline with surveysconducted at 5-yr intervals (Fig. 3).
DISCUSSION
Our work provides the first published estimate of a walrus population based onan infrared survey. Our approach addresses the major problems of limited coverageand inaccurate enumeration identified by Gilbert (1999) in previous visual surveys ofwalruses. Use of an infrared scanner flown at relatively high altitude allows detectionof walrus groups over a substantially larger area than was possible with previousvisual surveys. Use of low-level photography to calibrate the infrared imagery allows
Table 3. Minimum CVs for population estimates required to detect precipitous populationdeclines (Taylor et al. 2007) with repeated surveys conducted at intervals from 1 to 5 yr andbalanced probabilities of overprotection (�) and under protection (�) errors.
Interval between surveys (yr)
� = � 1 − � 1 3 5
0.10 0.90 0.30 0.18 0.140.20 0.80 0.49 0.30 0.25
The probability of detecting a precipitous decline is 1 − �.

66 MARINE MAMMAL SCIENCE, VOL. 24, NO. 1, 2008
relatively precise estimation of the number of walruses in the detected groups (Barberet al. 1991, Burn et al. 2006).
Although the region around St. Lawrence Island has long been recognized as animportant spring aggregation area for Pacific walruses (Fay 1982), our trial surveyprovides the first quantitative estimate of the number of walruses in a portion of thisregion. Our estimate is a minimum value however because we did not account for(1) walruses that were in the water and therefore unavailable to be detected by thescanner, (2) walruses hauled out in groups too small to be detected (i.e., group size <four), and (3) walruses in the unsurveyed stratum (stratum 5, Fig. 1). As is typical foraerial surveys, we assumed there was no net movement of individuals among strataduring the survey period or among transects during any survey day.
Stratum 5 was not surveyed due to a mechanical problem with the scanner onthe last remaining day with suitable weather during the survey period. Our surveymethod requires mostly clear skies because infrared radiation does not penetrateclouds. Weather conditions were suitable for surveying at the designated altitude ononly 7 of the 14 d allotted for our trial survey. Thus, the requirement for cloud-freeskies constitutes an important limitation to the application of this approach. Flyingat a lower altitude can circumvent the problem of high clouds, but this will reducethe area that can be covered.
We had very few photographs of groups that were undetected by the scanneron surveyed transects. However, analysis of these photographs indicated that thedetection limit for our scanner was essentially the same as that observed in an earlierpilot study conducted by Burn et al. (2006) under similar conditions. Based on thisconsistency of results and our lack of sufficient data for more rigorous estimation ofthe detection limit and its precision, we treated the apparent detection limit as aknown constant in our analyses. Ideally, the uncertainty in the estimated detectionlimit should be accounted for along with the other sources of uncertainty affecting thepopulation estimate. Reliable estimation of the detection limit will require additionaldata on undetected groups that could be obtained with low-level photography. Low-level photography would be accomplished most efficiently with a second dedicatedaircraft. Recent evidence (USFWS unpublished data) suggests that the detectionlimit may depend on ambient temperature and wind speed. These variables could beused as covariates in the regression model relating the thermal index to group size.
The total number of walruses that were hauled out but undetectable in our surveybecause they occurred in groups of less than four individuals is likely to be relativelysmall. This is because walruses tend to aggregate in large groups on sea ice (Fay 1982),and individuals in small groups account for a very small portion of the hauled-outpopulation (Estes and Gilbert 1978). Nevertheless, in a full population survey, itwould be desirable to estimate the size of the undetectable portion of the hauled-outpopulation. This could be accomplished with a low level visual-photographic linetransect survey conducted on a subset of the transects covered by the scanner. Theestimated size of this portion of the population could then be added to the total forthe rest of the population. The precision of the estimate for this undetectable portionof the population is likely to be low because of the limited sample size that can beobtained with a low level survey. However, the effect on the precision of the overallestimate is likely to be small because the portion of the population accounted forby undetected groups is also likely to be small. An advantage of a resolution thatdoes not detect the smallest groups of walruses is that ice seals are also likely tobe in groups that are too small to be detected and therefore will not inflate walruspopulation estimates.

UDEVITZ ET AL.: ESTIMATION OF WALRUS POPULATIONS 67
Our survey design was similar to stratified double sampling for regression esti-mation (Thompson 2002), but there were not enough walrus groups photographedin secondary samples on transects to support sufficiently precise regression estimateswithin transects or strata. Therefore, walrus groups detected with the infrared scan-ner while in transit between survey transects were also photographed and data fromall photographed groups were pooled to develop a common regression model for allstrata. When a common model is estimated from data taken in different strata, thestrata estimates are correlated, and this requires special consideration in estimatingvariances (Bowden et al. 2003). Our bootstrap approach for estimating standard errorsand confidence intervals accounted for this correlation as well as the other aspects ofthe survey design.
Minimizing the time between infrared scanning and digitally photographing wal-rus groups can reduce variances of calibration estimates. In some cases, up to an hourelapsed between the times when the two images of a group were obtained becausethe aircraft had to reduce altitude and return to photograph groups after completingthe high altitude scan of a transect. Although we have no reason to suspect any bias,sizes of some groups may have changed during this interval, increasing the variabil-ity associated with the calibration regression. Use of a second aircraft dedicated tophotography could reduce the intervals between image acquisitions.
Estimating the total number of walruses in a region would require additionalinformation about the proportion of the population that was not hauled out on the iceand therefore not available to be detected by the infrared scanner. Data for estimatingthis proportion could be obtained from a sample of walruses fitted with satellitetransmitters containing sensors that measure the proportion of time a walrus is inthe water (Hills and Gilbert 1994). This type of transmitter along with a techniquefor remotely deploying relatively large numbers of them has been developed recently(Jay et al. 2006). A Horvitz–Thompson type estimator (Thompson 2002) could beused to adjust the total estimate to account for the proportion of the populationavailable to be detected.
Hills and Gilbert (1994) estimated that using sample of thirty instrumentedwalruses to adjust for the proportion of the population in the water would add 0.02–0.07 to a CV of 0.25 for the estimate of the hauled-out population. Thus, it mightbe reasonable to assume that a CV of around 0.27–0.32 could be achieved for a totalestimate of the Pacific walrus population using the new survey technology. Estimatesof the Pacific walrus population size are required to set conservation policy in Russiaand for compliance with the Marine Mammal Protection Act in the United States, butestimates of population trend will also be required for the most effective managementof this population (Hills and Gilbert 1994). With � = 0.05, the probability ofdetecting a precipitous decline with the new survey technology would probably stillbe unacceptably low, unless surveys could be conducted annually (Fig. 3). With � =0.2, however, a more reasonable probability of about 0.8 for detecting a precipitousdecline could be obtained with intersurvey intervals of 3–5 yr (Table 3). In any case,this would represent a substantial improvement over the ability to detect trendswith the technology used in previous walrus surveys (Hills and Gilbert 1994) or inother surveys of pinnipeds on sea ice (Taylor et al. 2007). The CV could be reducedfurther by surveying more transects or by using an infrared scanner with a smallerinstantaneous field of view and correspondingly larger pixel array.
Gilbert (1999) suggested that a spring survey of the Pacific walrus populationcould be effective because the entire population is distributed near the edges of theBering Sea ice pack at that time. We propose a design for a spring survey that includes

68 MARINE MAMMAL SCIENCE, VOL. 24, NO. 1, 2008
four major components: (1) deployment of satellite transmitters on a representativesample of walruses to estimate the proportion of the population hauled out on iceduring the survey, (2) a high altitude strip transect survey using an infrared scannerto detect groups of hauled-out walruses, (3) low altitude digital photography of asample of walrus groups within the surveyed transects to estimate number of walrusesin groups detected with the scanner, and (4) a low altitude visual-photographic linetransect survey along a subsample of transects covered by the scanner to estimate thenumber of hauled-out walruses in groups too small to be detected by the scanner andto aid in estimating the scanner detection limit. Components (3) and (4) could both beaccomplished by a single aircraft dedicated to low-level photography. The technologyrequired for this approach is now available, and our trial survey has demonstratedthat the key elements of the design are operationally feasible. We believe that thisapproach offers the potential for obtaining the most reliable estimate to date of thePacific walrus population size. These technologies may also prove useful for estimatingpopulations of other ice-associated pinnipeds.
ACKNOWLEDGMENTS
We thank Ralph Aiken for skillful piloting of survey flights and William Baker for operationof the infrared scanner. David Weintraub ensured the survey aircraft was reconfigured to safelyand effectively accommodate the imaging systems. Fred Osterwisch, Tom Ory, and JasonJester provided valuable technical support for the AMS system. Jan Bennett, Lark Wuerth,and Bud Walters insured that the study was conducted in accordance with safety guidelines.Staff from the National Weather Service in Nome, Alaska provided valuable assistance withweather forecasts and mission planning. We appreciate helpful reviews of earlier versions ofthis manuscript by Joel Garlich-Miller, Karen Oakley, Joel Reynolds, Ward Testa, and twoanonymous reviewers. This study was conducted under U.S. Department of Interior Letter ofConfirmation MA-039582. We dedicate this paper to the memory of Ralph Aiken Jr. for hishard work and many contributions to the successful development of these survey techniques.Any use of trade names is for descriptive purposes only and does not imply endorsement bythe U.S. government.
LITERATURE CITED
BARBER, D. G., P. R. RICHARD, K. P. HOCHHEIM AND J. ORR. 1991. Calibration of aerialthermal infrared imagery for walrus population assessment. Arctic 44:58–65.
BENGTSON, J. L., L. M. HIRUKI-RARING, M. A. SIMPKINS AND P. L. BOVENG. 2005. Ringedand bearded seal densities in the eastern Chukchi Sea, 1999–2000. Polar Biology 28:833–845.
BERNATAS, S., AND L. NELSON. 2004. Sightability model for California bighorn sheep inCanyonlands using forward-looking infrared (FLIR). Wildlife Society Bulletin 32:638–647.
BOONSTRA, R., C. J. KREBS, S. BOUTIN AND J. M. EADIE. 1994. Finding mammals usingfar-infrared thermal imaging. Journal of Mammalogy 75:1063–1068.
BOOTH, J. G., R. W. BUTLER AND P. HALL. 1994. Bootstrap methods for finite populations.Journal of the American Statistical Association 89:1282–1289.
BOWDEN, D. C., G. C. WHITE, A. B. FRANKLIN AND J. L. GANEY. 2003. Estimating popula-tion size with correlated sampling unit estimates. Journal of Wildlife Management 67:1–10.
BURN, D. M., M. A. WEBBER AND M. S. UDEVITZ. 2006. Application of airborne thermalimagery to surveys of Pacific walrus. Wildlife Society Bulletin 34:51–58.
UDEVITZ ET AL.: ESTIMATION OF WALRUS POPULATIONS 69
CUYLER, L. C., R. WIULSROD AND N. A. ORITSLAND. 1992. Thermal infrared radiation fromfree living whales. Marine Mammal Science 8:120–134.
DUNN, W. C., J. P. DONNELLY AND W. J. KRAUSMANN. 2002. Using thermal infrared sensingto count elk in the southwestern United States. Wildlife Society Bulletin 30:963–967.
ERICKSON, A. W., D. B. SINIFF AND J. HARWOOD. 1993. Estimation of population sizes.Pages 29–45 in R. M. Laws, ed. Antarctic seals. Cambridge University Press, Cambridge,UK.
ESTES, J. A., AND J. R. GILBERT. 1978. Evaluation of an aerial survey of Pacific walruses(Odobenus rosmarus divergens). Journal of the Fisheries Research Board of Canada 35:1130–1140.
FAY, F. H. 1982. Ecology and biology of the Pacific walrus, Odobenus rosmarus divergens Iliger.North American Fauna 74:1–279.
FAY, F. H., L. L. EBERHARDT, B. P. KELLY, J. J. BURNS AND L. T. QUAKENBUSH. 1997. Statusof the Pacific walrus population 1950–1989. Marine Mammal Science 13:537–565.
GARNER, D. L., H. B. UNDERWOOD AND W. F. PORTER. 1995. Use of modern infraredthermography for wildlife population surveys. Environmental Management 19:233–238.
GERRODETTE, T. 1987. A power analysis for detecting trends. Ecology 68:1364–1372.GERRODETTE, T. 1991. Models for power of detecting trends—A reply to Link and Hatfield.
Ecology 72:1889–1892.GILBERT, J. R. 1999. Review of previous Pacific walrus surveys to develop improved survey
designs. Pages 75–84 in G. W. Garner, S. C. Amstrup, J. L. Laake, B. F. J. Manly, L. L.McDonald and D. G. Robertson, eds. Marine mammal survey and assessment methods.A. A. Balkema, Brookfield, VT.
GREEN, K., H. R. BURTON, V. WONG, R. A. MCFARLANE, A. A. FLAHERTY, B. C. PAHLAND S. A. HAIGH. 1995. Difficulties in assessing population status of ice seals. WildlifeResearch 22:193–199.
HAROLDSON, B. S., E. P. WIGGERS, J. BERINGER, L. P. HANSEN AND J. P. MCANINCH. 2003.Evaluation of aerial thermal imaging for detecting white-tailed deer in a deciduous forestenvironment. Wildlife Society Bulletin 31:1188–1197.
HEIDE-JORGENSEN, M. P. 2004. Aerial digital photographic surveys of narwhals, Monodonmonoceros, in Northwest Greenland. Marine Mammal Science 20:246–261.
HILLS, S., AND J. R. GILBERT. 1994. Detecting Pacific walrus population trends with aerialsurveys: A review. Transactions of the North American Wildlife and Natural ResourcesConference 59:201–210.
JAY, C. V., M. P. HEIDE-JORGENSEN, A. F. FISCHBACH, M. V. JENSEN, D. F. TESSLER ANDA. V. JENSEN. 2006. Comparison of remotely deployed satellite radio transmitters onwalruses. Marine Mammal Science 22:226–236.
KINZEL, P. J., J. M. NELSON, R. S. PARKER AND L. R. DAVIS. 2006. Spring census ofmid-continent sandhill cranes using aerial infrared videography. Journal of WildlifeManagement 70:70–77.
KRAFFT, B. A., K. M. KOVACS, M. ANDERSEN, J. AARS, C. LYDERSEN, T. ERGON AND T.HAUG. 2006. Abundance of ringed seals (Pusa hispida) in the fjords of Spitsbergen,Svalbard, during the peak molting period. Marine Mammal Science 22:394–412.
LIN, D. Y., L. J. WEI AND Z. YING. 2002. Model-checking techniques based on cumulativeresiduals. Biometrics 58:1–12.
MANSFIELD, A. W., AND D. J. ST. AUBIN. 1991. Distribution and abundance of the Atlanticwalrus, Odobenus rosmarus rosmarus, in the Southampton Island–Coats Island region ofnorthern Hudson Bay. Canadian Field-Naturalist 105:95–100.
MANLEY, B. F. J. 1991. Randomization and Monte Carlo methods in biology. Chapman andHall, New York, NY.
MCCULLAGH, P., AND J. A. NELDER. 1989. Generalized linear models, 2nd edition. Chapmanand Hall, Boca Raton, FL.
MYERS, R. A., AND W. D. BOWEN. 1989. Estimating bias in aerial surveys of harp seal pupproduction. Journal of Wildlife Management 53:361–372.
70 MARINE MAMMAL SCIENCE, VOL. 24, NO. 1, 2008
RAY, C., AND F. H. FAY. 1968. Influence of climate on the distribution of walruses, Odobenusrosmarus (Linnaeus). II. Evidence from physiological characteristics. Zoologica 53:19–32.
ROGERS, T. L., AND M. M. BRYDEN. 1997. Density and haul-out behavior of leopard seals(Hydrurga leptonyx) in Prydz Bay, Antarctica. Marine Mammal Science 13:293–302.
TAYLOR, B. L., M. MARTINEZ, T. GERRODETTE, J. BARLOW, AND Y. N. HROVAT. 2007.Lessons from monitoring trends in abundance of marine mammals. Marine MammalScience 23:157–175.
THOMPSON, P. M., AND J. HARWOOD. 1990. Methods for estimating the population size ofcommon seals, Phoca vitulina. Journal of Applied Ecology 27:924–938.
THOMPSON, S. K. 2002. Sampling, 2nd edition. John Wiley and Sons, New York, NY.U. S. FISH AND WILDLIFE SERVICE. 2002. Pacific walrus (Odobenus rosmarus divergens): Alaska
stock. U. S. Fish and Wildlife Service Stock Assessment Report. 6 pp. Available fromUSFWS, 1011 E. Tudor Rd., Anchorage, AK 99503.
UDEVITZ, M. S., J. R. GILBERT AND G. A. FEDOSEEV. 2001. Comparison of methods used toestimate numbers of walruses on sea ice. Marine Mammal Science 17:601–616.
Received: 28 November 2006Accepted: 20 June 2007