estimation of the surface displacement of swiss … · estimation of the surface displacement of...
TRANSCRIPT
ESTIMATION OF THE SURFACE DISPLACEMENT OF SWISS ALPINE GLACIERS USING SATELLITE RADAR INTERFEROMETRY
T. Strozzi1, G.H. Gudmundsson2 and U. Wegmüller1
1. Gamma Remote Sensing, Thunstrasse 130, 3074 Muri BE, Switzerland Tel: +41 31 9517005,
Fax: +41 31 9517008, Email: [email protected] 2. British Antarctic Survey, High Cross, Madingley Rd., Cambridge, CB3 0ET, UK
ABSTRACT A satellite radar interferometric analysis was performed in the Swiss Alps, in an area which in-cludes the largest glacier of the European Alps Großer Aletschgletscher and many others. Particular attention was paid to Unteraargletscher, because extensive in-situ and modelling activities have been dedicated to this glacier. A surface displacement map of Unteraargletscher in the line-of-sight direction of the ERS-1/2 satellites was estimated using two winter Tandem pairs. The line-of-sight surface displacement map of Unteraargletscher shows in detail the component of the displacement in nearly vertical direction. This information is useful in the estimation of the mass-balance distri-bution using the kinematic boundary condition without the use of any ground measurements. This interferometric analysis in the Swiss Alps also demonstrated that similar displacement maps could be derived for many of the other glaciers of the area.
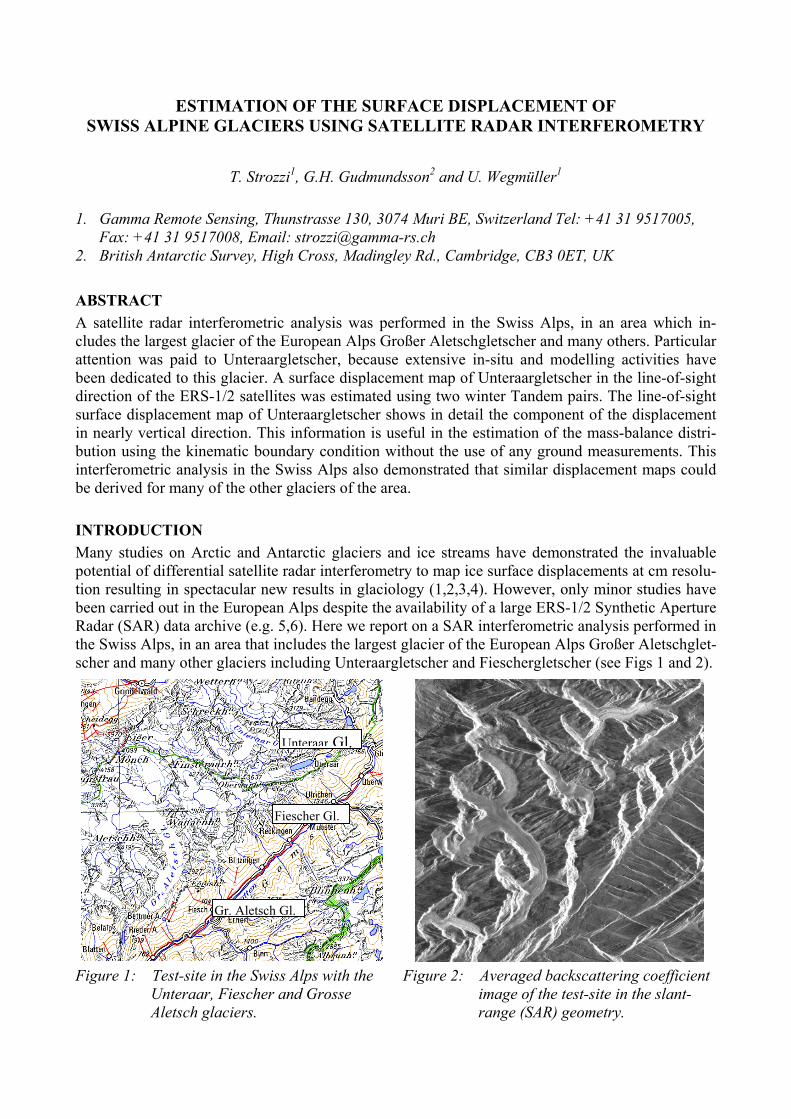
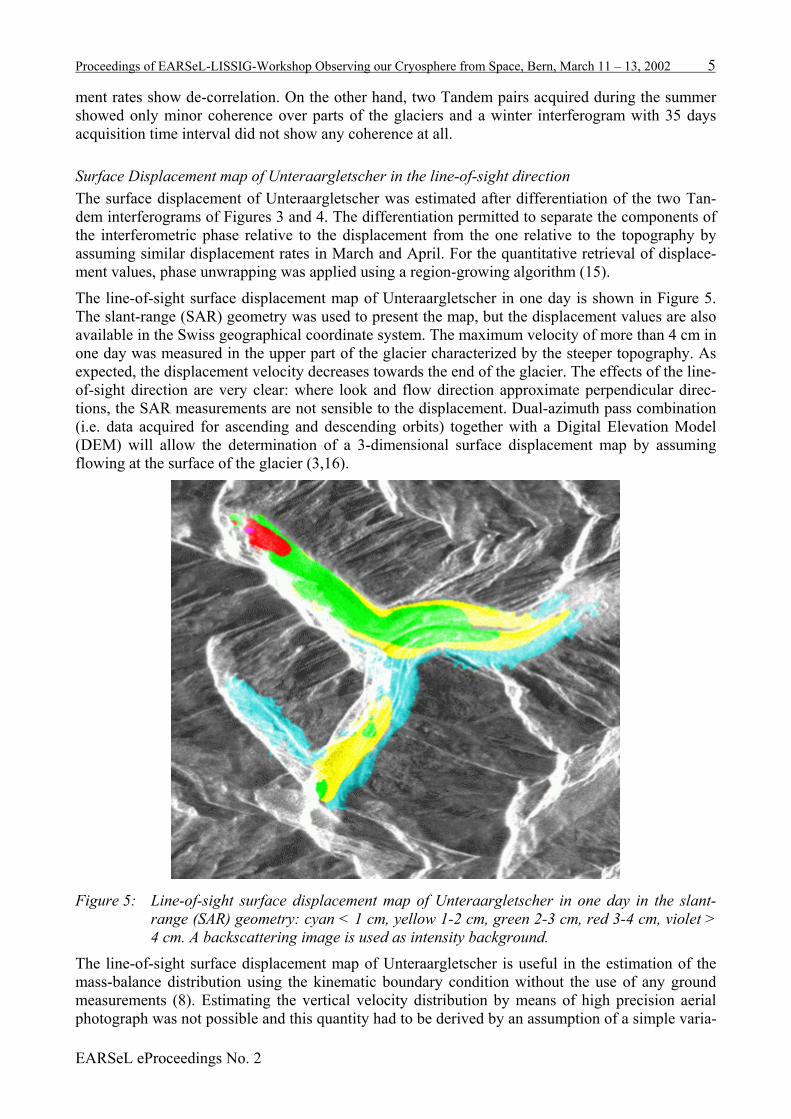
INTRODUCTION Many studies on Arctic and Antarctic glaciers and ice streams have demonstrated the invaluable potential of differential satellite radar interferometry to map ice surface displacements at cm resolu-tion resulting in spectacular new results in glaciology (1,2,3,4). However, only minor studies have been carried out in the European Alps despite the availability of a large ERS-1/2 Synthetic Aperture Radar (SAR) data archive (e.g. 5,6). Here we report on a SAR interferometric analysis performed in the Swiss Alps, in an area that includes the largest glacier of the European Alps Großer Aletschglet-scher and many other glaciers including Unteraargletscher and Fieschergletscher (see Figs 1 and 2).
Figure 1: Test-site in the SwissUnteraar, Fiescher aAletsch glaciers.
.
Unteraar GlGr. Aletsch Gl.
Fiescher Gl.
Alps with the nd Grosse
Figure 2: Averaged backscattering coefficient image of the test-site in the slant-range (SAR) geometry.

Proceedings of EARSeL-LISSIG-Workshop Observing our Cryosphere from Space, Bern, March 11 – 13, 2002 4
Particular attention is paid to Unteraargletscher, Bernese Alps, because over the last few years this glacier has been the focus of a concentrated glaciological process study (7,8,9). As a consequence the flow dynamics of this glacier are known in considerable detail. In particular, the spatial pattern of annually averaged horizontal surface velocities has been mapped with a high resolution, and hourly temporal changes in flow velocities have been measured over periods of months. The meth-ods used to determine surface geometry and velocities include the use of atomized theotolite, an ar-ray of permanently installed GPS receivers, laser scanner measurements, and semi-automized ex-traction of surface velocities from annual aerial photographs. Despite extensive field measurements and the intense use of traditional remote sensing methods on this glacier, the vertical component of the surface motion is, nevertheless, relatively poorly known. Direct measurements of the vertical velocity component are highly desirable. They can be used in combination with other comparatively easily obtained data sets to determine the surface mass-balance distribution, a key quantity describ-ing the state of the glacier with respect to current climate. Recent attempts to obtain the mass-balance distribution in an indirect way without any direct measurements of vertical surface motion have not been successful, and stress the need for developing and testing new approaches towards vertical displacement measurements (8).
ERS SAR data and interferograms In the interferometric approach two complex SAR images acquired from slightly different orbit configurations and at different times are combined to exploit the phase difference of the signals (10,11). The interferometric phase is sensitive to both surface topography and coherent displace-ment along the look vector occurring between the acquisitions of the interferometric image pair. The differential use of two interferograms with similar displacement allows the removal of the to-pographic-related phase from the interferogram to derive a displacement map (12,13,14).
Two winter Tandem pairs (one day acquisition time interval) were considered in this analysis, one acquired on the 7 and 8 March 1996 and one acquired on the 11 and 12 April 1996. The two inter-ferograms have different baselines and are suitable for differential analysis. The interferograms of Figures 3 and 4 show both topography and displacement effects on the phase and are combined with the backscatter intensity.
Figure 3: Flattened, filtered interferogram of
7/8 March 1996. The perpendicular component of the baseline is 35 m.
Figure 4: Flattened, filtered interferogram of 11/12 April 1996. The perpendicular component of the baseline is -97 m.
The coherence was high for most areas of the glaciers. Only the lowest parts of the large glaciers in April (because of melting snow and ice) and some other particular areas with very high displace-
EARSeL eProceedings No. 2
Proceedings of EARSeL-LISSIG-Workshop Observing our Cryosphere from Space, Bern, March 11 – 13, 2002 5
ment rates show de-correlation. On the other hand, two Tandem pairs acquired during the summer showed only minor coherence over parts of the glaciers and a winter interferogram with 35 days acquisition time interval did not show any coherence at all.
Surface Displacement map of Unteraargletscher in the line-of-sight direction The surface displacement of Unteraargletscher was estimated after differentiation of the two Tan-dem interferograms of Figures 3 and 4. The differentiation permitted to separate the components of the interferometric phase relative to the displacement from the one relative to the topography by assuming similar displacement rates in March and April. For the quantitative retrieval of displace-ment values, phase unwrapping was applied using a region-growing algorithm (15).
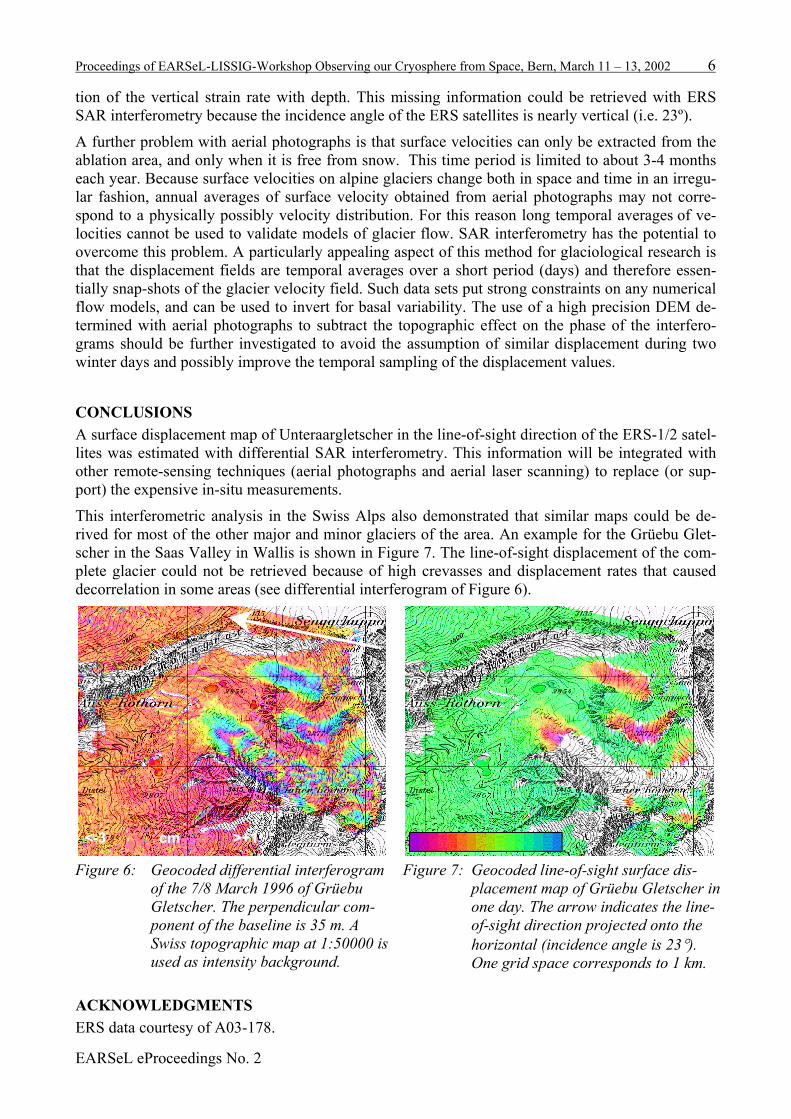
The line-of-sight surface displacement map of Unteraargletscher in one day is shown in Figure 5. The slant-range (SAR) geometry was used to present the map, but the displacement values are also available in the Swiss geographical coordinate system. The maximum velocity of more than 4 cm in one day was measured in the upper part of the glacier characterized by the steeper topography. As expected, the displacement velocity decreases towards the end of the glacier. The effects of the line-of-sight direction are very clear: where look and flow direction approximate perpendicular direc-tions, the SAR measurements are not sensible to the displacement. Dual-azimuth pass combination (i.e. data acquired for ascending and descending orbits) together with a Digital Elevation Model (DEM) will allow the determination of a 3-dimensional surface displacement map by assuming flowing at the surface of the glacier (3,16).
Figure 5: Line-of-sight surface displacement map of Unteraargletscher in one day in the slant-range (SAR) geometry: cyan < 1 cm, yellow 1-2 cm, green 2-3 cm, red 3-4 cm, violet > 4 cm. A backscattering image is used as intensity background.
The line-of-sight surface displacement map of Unteraargletscher is useful in the estimation of the mass-balance distribution using the kinematic boundary condition without the use of any ground measurements (8). Estimating the vertical velocity distribution by means of high precision aerial photograph was not possible and this quantity had to be derived by an assumption of a simple varia-
EARSeL eProceedings No. 2
Proceedings of EARSeL-LISSIG-Workshop Observing our Cryosphere from Space, Bern, March 11 – 13, 2002 6
tion of the vertical strain rate with depth. This missing information could be retrieved with ERS SAR interferometry because the incidence angle of the ERS satellites is nearly vertical (i.e. 23º).
A further problem with aerial photographs is that surface velocities can only be extracted from the ablation area, and only when it is free from snow. This time period is limited to about 3-4 months each year. Because surface velocities on alpine glaciers change both in space and time in an irregu-lar fashion, annual averages of surface velocity obtained from aerial photographs may not corre-spond to a physically possibly velocity distribution. For this reason long temporal averages of ve-locities cannot be used to validate models of glacier flow. SAR interferometry has the potential to overcome this problem. A particularly appealing aspect of this method for glaciological research is that the displacement fields are temporal averages over a short period (days) and therefore essen-tially snap-shots of the glacier velocity field. Such data sets put strong constraints on any numerical flow models, and can be used to invert for basal variability. The use of a high precision DEM de-termined with aerial photographs to subtract the topographic effect on the phase of the interfero-grams should be further investigated to avoid the assumption of similar displacement during two winter days and possibly improve the temporal sampling of the displacement values.
CONCLUSIONS A surface displacement map of Unteraargletscher in the line-of-sight direction of the ERS-1/2 satel-lites was estimated with differential SAR interferometry. This information will be integrated with other remote-sensing techniques (aerial photographs and aerial laser scanning) to replace (or sup-port) the expensive in-situ measurements.
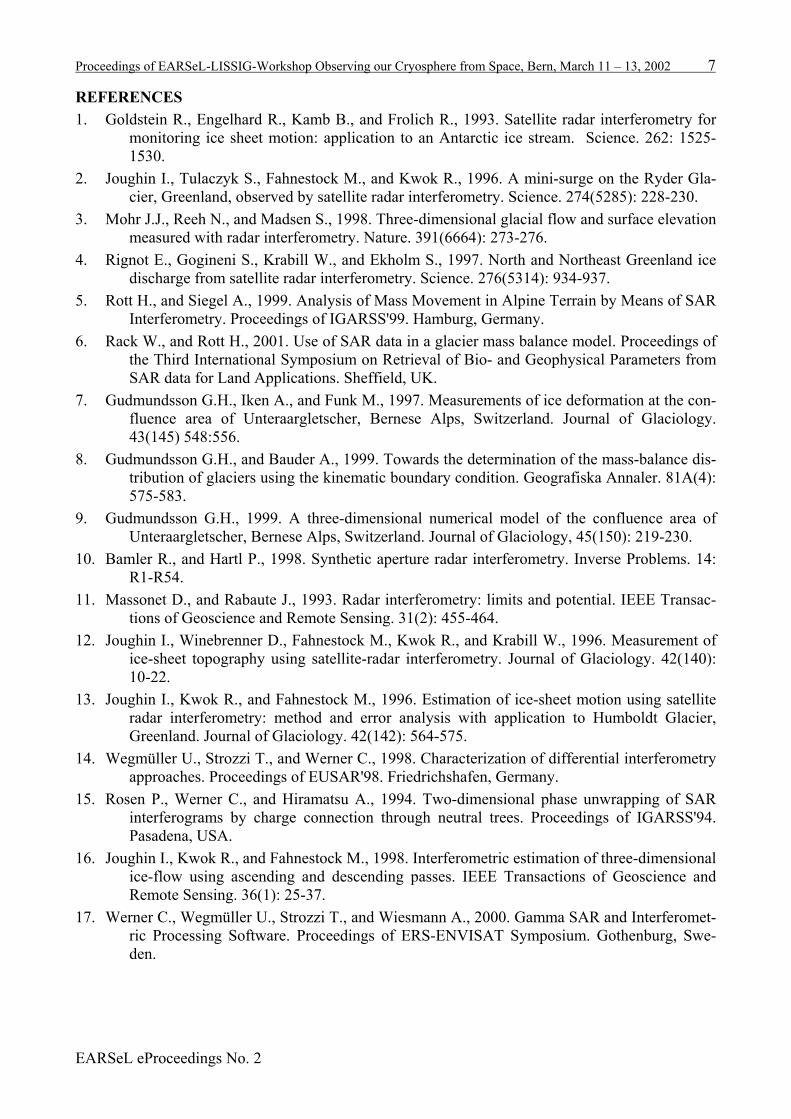
This interferometric analysis in the Swiss Alps also demonstrated that similar maps could be de-rived for most of the other major and minor glaciers of the area. An example for the Grüebu Glet-scher in the Saas Valley in Wallis is shown in Figure 7. The line-of-sight displacement of the com-plete glacier could not be retrieved because of high crevasses and displacement rates that caused decorrelation in some areas (see differential interferogram of Figure 6).
Figure 6: Geocoded differential interferogram
of the 7/8 March 1996 of Grüebu Gletscher. The perpendicular com-ponent of the baseline is 35 m. A Swiss topographic map at 1:50000 is used as intensity background.
Figure 7: Geocoded line-of-sight surface dis-placement map of Grüebu Gletscher in one day. The arrow indicates the line-of-sight direction projected onto the horizontal (incidence angle is 23°). One grid space corresponds to 1 km.
<<--33 ccmm >>++11
ACKNOWLEDGMENTS ERS data courtesy of A03-178.
EARSeL eProceedings No. 2
Proceedings of EARSeL-LISSIG-Workshop Observing our Cryosphere from Space, Bern, March 11 – 13, 2002 7
REFERENCES 1. Goldstein R., Engelhard R., Kamb B., and Frolich R., 1993. Satellite radar interferometry for
monitoring ice sheet motion: application to an Antarctic ice stream. Science. 262: 1525-1530.
2. Joughin I., Tulaczyk S., Fahnestock M., and Kwok R., 1996. A mini-surge on the Ryder Gla-cier, Greenland, observed by satellite radar interferometry. Science. 274(5285): 228-230.
3. Mohr J.J., Reeh N., and Madsen S., 1998. Three-dimensional glacial flow and surface elevation measured with radar interferometry. Nature. 391(6664): 273-276.
4. Rignot E., Gogineni S., Krabill W., and Ekholm S., 1997. North and Northeast Greenland ice discharge from satellite radar interferometry. Science. 276(5314): 934-937.
5. Rott H., and Siegel A., 1999. Analysis of Mass Movement in Alpine Terrain by Means of SAR Interferometry. Proceedings of IGARSS'99. Hamburg, Germany.
6. Rack W., and Rott H., 2001. Use of SAR data in a glacier mass balance model. Proceedings of the Third International Symposium on Retrieval of Bio- and Geophysical Parameters from SAR data for Land Applications. Sheffield, UK.
7. Gudmundsson G.H., Iken A., and Funk M., 1997. Measurements of ice deformation at the con-fluence area of Unteraargletscher, Bernese Alps, Switzerland. Journal of Glaciology. 43(145) 548:556.
8. Gudmundsson G.H., and Bauder A., 1999. Towards the determination of the mass-balance dis-tribution of glaciers using the kinematic boundary condition. Geografiska Annaler. 81A(4): 575-583.
9. Gudmundsson G.H., 1999. A three-dimensional numerical model of the confluence area of Unteraargletscher, Bernese Alps, Switzerland. Journal of Glaciology, 45(150): 219-230.
10. Bamler R., and Hartl P., 1998. Synthetic aperture radar interferometry. Inverse Problems. 14: R1-R54.
11. Massonet D., and Rabaute J., 1993. Radar interferometry: limits and potential. IEEE Transac-tions of Geoscience and Remote Sensing. 31(2): 455-464.
12. Joughin I., Winebrenner D., Fahnestock M., Kwok R., and Krabill W., 1996. Measurement of ice-sheet topography using satellite-radar interferometry. Journal of Glaciology. 42(140): 10-22.
13. Joughin I., Kwok R., and Fahnestock M., 1996. Estimation of ice-sheet motion using satellite radar interferometry: method and error analysis with application to Humboldt Glacier, Greenland. Journal of Glaciology. 42(142): 564-575.
14. Wegmüller U., Strozzi T., and Werner C., 1998. Characterization of differential interferometry approaches. Proceedings of EUSAR'98. Friedrichshafen, Germany.
15. Rosen P., Werner C., and Hiramatsu A., 1994. Two-dimensional phase unwrapping of SAR interferograms by charge connection through neutral trees. Proceedings of IGARSS'94. Pasadena, USA.
16. Joughin I., Kwok R., and Fahnestock M., 1998. Interferometric estimation of three-dimensional ice-flow using ascending and descending passes. IEEE Transactions of Geoscience and Remote Sensing. 36(1): 25-37.
17. Werner C., Wegmüller U., Strozzi T., and Wiesmann A., 2000. Gamma SAR and Interferomet-ric Processing Software. Proceedings of ERS-ENVISAT Symposium. Gothenburg, Swe-den.
EARSeL eProceedings No. 2