estimation of the strain field from full-field displacement noisy data
TRANSCRIPT

Estimation of the strain field from full-field displacementnoisy data :
filtering through Diffuse Approximation and applicationto interlock graphite/epoxy composite
P. Feissel, J. Schneider and Z. Aboura
Laboratoire Roberval de Mécanique, UTC,BP 20529 rue Personne de Roberval 60205 COMPIEGNE
Abstract — This study presents a tool for numerical differentiation of perturbed displacementfields in order to obtain the strain field. The proposed approach lies on the Diffuse Approximation[1] and allows a filtering of the noise while aiming at controling the loss of mechanical informationwithin the strain field. The method is applied to the case of a tensile test on a satin composite wherethe displacement are yielded by CORRELIQ4 [2], a numerical image correlation tool. The choiceof optimal parameters in the coupling of the two tools (correlation and filtering) is also adressedand a first criterium is proposed.
Keywords — full field measurements, numerical differentiation, identification, filtering.
1 IntroductionThe recent development of digitized full-field displacement measurements opens new ways ofcharacterizing materials in solid mechanics [1]. When dealing with composites with large het-erogeneities, the full-field technique allows a much richer description of the behaviour duringthe test than when using standard strain gauges. However, for most of the users of these tech-niques the strain fields rather than the displacement fields provide a real insight into the physicsof the material at different scales. Therefore, except for the techniques which provide directlythe displacement derivatives, it is necessary to differentiate the data. When the gradients of thedisplacement fields are relatively low, for example when the materials still behave elastically, thesmall measurement errors may induce large errors on the computed derivative [2]. So the key workis to develop a stable algorithm, in which it is possible to quantify explicitly the effects inducedby noise differentiation.
A large number of algorithms can be found in the literature, [3]. One widely used way ofperforming this filtering consists in interpolating or approximating the data using smooth basisfunctions. The differentiation of the data is turned into the differentiation of the basis functions.For a given basis of functions, the regularization parameter is tied to the number of functions usedin the basis. A good compromise between the faithfulness of the reconstruction (obtained with alarge number of basis functions) and the efficiency of the low pass filtering (obtained with a smallnumber of basis functions) has to be found.
However, a good choice of the basis functions is essential [4]. Previous studies [5] showedthat a global polynomial basis leads to parasitic oscillations in the reconstruction when the degree
of the polynomials is too large. Indeed, because of the global aspect of this type of bases, localartifacts in the data affect the whole reconstruction. Accordingly, it seems that basis functions thathave limited interactions between each other would be more appropriate.
In [5], two filtering approaches were compared, one based on a global least-square and aFinite Element basis, the other one based on local least squares and polynomial basis, based on theDiffuse Approximation [1]. The two approaches yield similar results in terms of approximationerror and filtering ability and can bu tuned thanks to a length parameter ; nonetheless, the approachbased on the Diffuse Approximation is not suffering from the dependency of the reconstructedstrain field to the meshing (since there is no meshing) and offers a suited theoretical backgroundfor the controling of the error. This approach is therefore adopted here, even though its computingtime was larger.
The Diffuse Approximation filtering technique is applied here to experimental data in orderto adress its efficiency. The chosen test is a ±45 traction test on an interlock composite beam.The full-field measurements are performed by digital image correlation (DIC), through the COR-RELIQ4 software [2]. The first question that is adressed in the paper is to discuss how to tune theparameters of both the correlation software and the filtering tool in order to improve the filteringwhile keeping a good local mechanical information. A pragmatic criterium based on virtual straingauges is then proposed in order to yield a maximum value of the filtering parameter to limit themechanical information loss. Finally, based on the ideas proposed in [3], we try to localize thedevelopment of local non-linearities during the test.
2 Reconstruction of the strain field from the displacement field2.1 Framework and notationsThe proposed approach aims at reconstructing the strain field from displacement data, whateverthe technique could be to get the latter (DIC or grid method, for example). The measurement zoneis denoted Ω and the input data are the displacements on a regular grid of data points, denoted x i.Let the measurements be written as follow:
u(xi) = uex(xi)+δu(xi) , ∀i ∈ [1,N] (1)
where δu represents the perturbation on the measurements and uex is the exact mechanical field.The aim of the reconstruction is to yield a strain field as close as possible to the one associatedwith uex.
The reconstruction operator being linear (see 2.2), one can split the reconstruction of u asthe sum of the reconstruction of the exact field uex and the one of the perturbation alone. Thereconstructed field uap(x), at any x, can therefore be written as:
uap(x) = uex(x)+δuk(x)+δub(x) (2)
where δuk(x) is the approximation error due to the filtering of the exact field and δub(x) is theerror due to the noise. The same splitting can be applied to the reconstructed strain field εap.
2.2 The Diffuse Approximation (DA) as a filtering toolThe proposed approach is based on the use of local weighted least-squares [6]. Here, the localregression tool is the Diffuse Approximation [1]. The parameter controling the filtering is the thespan of the influence zone of each data point. One keypoint of the method is that it yields botha continuous displacement field and its derivatives (in a diffuse way) at ones, as explained in thefollowing.

The reconstructed field is sought at any point of Ω, as the solution of the following minimiza-tion problem:
mina(x)
12
(Pa−U
)TW
(Pa−U
)with, P =
p(x− x1)...
p(x− xN)
i∈V (x)
(3)
where p(x) is the line vector of the monomials of the approximation basis, which is not to benecessarily polynomial. Here, polynomial basis of degree 2 is chosen, because, it appeared in [5]it was a good compromise between filtering and approximation error. With such a basis, the termsa2(x) and a3(x) represent the first order derivatives at point x in a diffuse way. V (x) representsthe nieghbourhood of x collecting the data points xi taken into account in the reconstruction atpoint x. The matrix W is a diagonal matrix made of the weighting functions w(x,x i) which ensurethe continuity of the solution. The weighting functions are such that they equal zero outside theneighbourhood V (x), whose size is described by the span R.
2.3 Theorical filtering of the noiseThe minimization problem of quadratic criterium (3) leads to the solving of a linear system. Thismeans, as suggested above, that one can study individually the filtering of the noise and the ap-proximation error related to the use of too large influence span R.
Denoting Mε the strain reconstruction operator and assessing the perturbation are a white gaus-sian noise sample with known standard deviation γ, the covariance matrix of the reconstructedstrain can be characterized as follow:
COV (δεb) = γ2 MεMεT (4)
Figure 1 presents the ratio of the standard deviation of εXX and the standard deviation of the
PSfrag replacementsspan
offset
Figure 1: Standard deviation on εXX as a function of the span R and the offset, logscale
measurements noise as a function of the span R and the offset of the reconstruction point withrespect to its neighbourhood V (x) (a non-zero offset would occur when reconstructing the strainclose to an edge of the data aera). The increase of the span R improves the filtering and the offsetimplies a larger span R in order to keep the same filtering quality.

3 Tuning of the span R from experimental results3.1 Experiment and measurementsThe following examples are based on a traction test on an interlock composite. During the testimages are taken with a digital camera and then treated by Digital Image Correlation (DIC), by thesoftware CorreliQ4 [2] in order to obtain the displacement fields on the measurement zone. Thesoftware CorreliQ4 is based on a Finite Element formulation of the optical correlation problemand its controling is mainly based, for the end-user,on the meshsize, denoted as the variable ZOI(standing for Zone Of Interest, as in the previous versions of the correlation tool). As for the spanR for the Diffuse Approximation, the increase of the ZOI would enhance the filtering of the noisebut would increase the approximation error due to the filtering of the mechanical field. Thesetwo effects are coupled but their evolution with the ZOI does not behave the same way as theirevolution with the span R in the Diffuse Approximation step. Thereforem a question to adress isto a good value for the couple (ZOI,R) in order to get results as good as possilbe.
In order to adresse this question, two criteria will be studied, firstly the whole heterogeneousstrain field reconstructed on the measurement zone and, then, the mean strain and its standarddeviation under a virtual gauge centered on the zone.
3.2 Filtering of the experimental noise
0 20 40 60 80 100 120 140 1600
0.5
1
1.5
2
2.5
3x 10⁻³
PSfrag replacementstheorical filteringmeasurement ZOI = 8measurement ZOI = 16measurement ZOI = 32
span R, in pixelsstand
ard
devi
atio
non
ε XX
(a) perturbation alone
0
1
2
3
4
5
6
0 20 40 60 80 100 120 140 160
x 10−3
PSfrag replacements
theorical filteringmeasurement ZOI = 8measurement ZOI = 16measurement ZOI = 32
span R, in pixelsstand
ard
devi
atio
non
ε XX
(b) traction test
Figure 2: Standard deviation of εXX as a function of the span R
During the tests, the measurement perturbations on the displacements are not exactly whitenoise samples. Even if the method is not currently able to filter the deterministic part of theperturbation (which would imply some mechanical considerations), we aim at verifying that ourwhite noise hypothesis is reasonnable and that the filtering on real measurements is as expectedfrom a theoretical point of view. To that purpose, the DA filtering is applied on displacementscoming from CorreliQ4 applied on two images, both taken before the loading of the specimen.There are hence no displacement and the signal can be considered as a typical perturbation. Figure2(a) shows the standard deviation under a virtual strain gauge as a function of the span R of theDiffuse Approximation (R is given in pixels of the original digital image). The standard deviationis drawn for three ZOI and in the theoretical case of a white gaussian noise, the magnitude beingscaled to the experimental one. One can note that the curves for the three ZOI are in the continuityof each other, yielding a global curve veriy analogous to the theoretical one. For a given span R,the increase of the ZOI increases the filtering of the noise. This could explain the discrepancybetwwen the theoretical and experimental curves, the latter being the result of two filterings (onethrough CorreliQ4 and one through the DA filtering). Nonetheless, the model of the noise seems

appropriate and this study, before loading, allowed us to characterize the magnitude of the errordue to the noise δεb.
3.3 Experimental strain field - effect of ZOI and RIn this section, the strain fields reconstructed for various span R and ZOI are compared for a givenload during the traction test. The strain field presented on Figure 3 is the εXX field. The subfigureswith a ZOI of 8 pixels show the effect of the span R on the filtering and the approximation. It seemsthat an intermediate span R leads to a good compromise. The use of a larger ZOI (in particularZOI = 32 pixels) seems to yield a larger approximation error without significant imporvementof the filtering. In this example, a ZOI of 8 pixels and a radius between 32 and 48 pixels seemappropriate.
(a) ZOI = 8 withoutDA
(b) ZOI = 8 R = 32 (c) ZOI = 8 R = 48 (d) ZOI = 8 R = 80
(e) ZOI = 16 with-out DA
(f) ZOI = 16 R = 48 (g) ZOI = 32 with-out DA
(h) ZOI = 32 R =96
Figure 3: Strain field εXX reconstructed for various couples (ZOI,R)
3.4 A pragmatic criterium for the choice of the span R and the ZOIA first criterium is proposed in order to help choosing the value of the couple of parameters(ZOI,R). The standard deviation of the strain under the virtual gauge is due to two distinct reasons:the unfiltered perturbations and the spatial variation of the heterogeneous mechanical strain field.In section 3.2, the evolution of the error due to the noise as a function of the span R of the DiffuseApproximation has been studied and its experimental magnitude characterized. One can thereforesuperimpose the theoretical curve of the standard deviation as a function of R (scaled to the levelof noise of the experiment) to the one of the standard deviation under the virtual gauge for agiven load, as in Figure 2(b). When the standard deviation under the virtual gauge reaches a levellower than the minimum level corresponding to the filtering of the noise (horizontal line on Figure2(b)), one can assure that the filtering is affecting the quality of the mechanical field. Therefore,around the horizontal line, there is a compromise to be found between filtering and loss of thedeterministic information. On our example, a ZOI of 32 pixels is too large and the compromise

of a ZOI of 8 pixels and a span R of 32 pixels proposed in section 3.2 is confirmed by this simplecriterium.
4 Detection of non-linearities during the testIn this last section, the εXX strain field is studied along a traction test in order to detect the de-velopment of local-nonlinearities. The following example is based on a ±45 traction test on aninterlock carbon composite with several loadings and unloadings as described in Figure 4. DigitalImage Correlation (DIC) is performed on about 500 images coming from the test, a large numberof pictures is thus available. The DIC is performed with CorreliQ4, with a ZOI of 8 pixels. From
0 100 200 300 400 500 600−0.2
0
0.2
0.4
0.6
0.8
1
1.2
PSfrag replacements
time
Load
Figure 4: Loading as a function of the time - the six studied parts
the ideas proposed in [3], one can define the linear approximation of the strain at each pixel onseveral parts of the test. As represented on Figure 4, six different parts of the test are chosen forthis study, each made up of about 20 snapshots. For each part, the linear response is estimatedfrom the corresponding Nk snapshots, i ∈ 1, ..Nk, Fi being the corresponding load , as the slopeof the response of each pixel:
minεk
lin
Nk
∑i
(Fiεk
lin − ε(x,Fi))2
with, for the kth part (5)
εklin represents the linear approximation field for a load of 1N.
(a) εre flin (b) part 4 (c) part 5 (d) part 6
Figure 5: Linear approximation of the strain field εXX for the various parts
These fields are represented on Figure 5 for a span R of 64 pixels for the different studied partsof the test. Considering Figure 5(a), the mean of the linear approximation on the first three parts
is ploted, and will be considered as the elastic strain field εre flin of the specimen, before damage
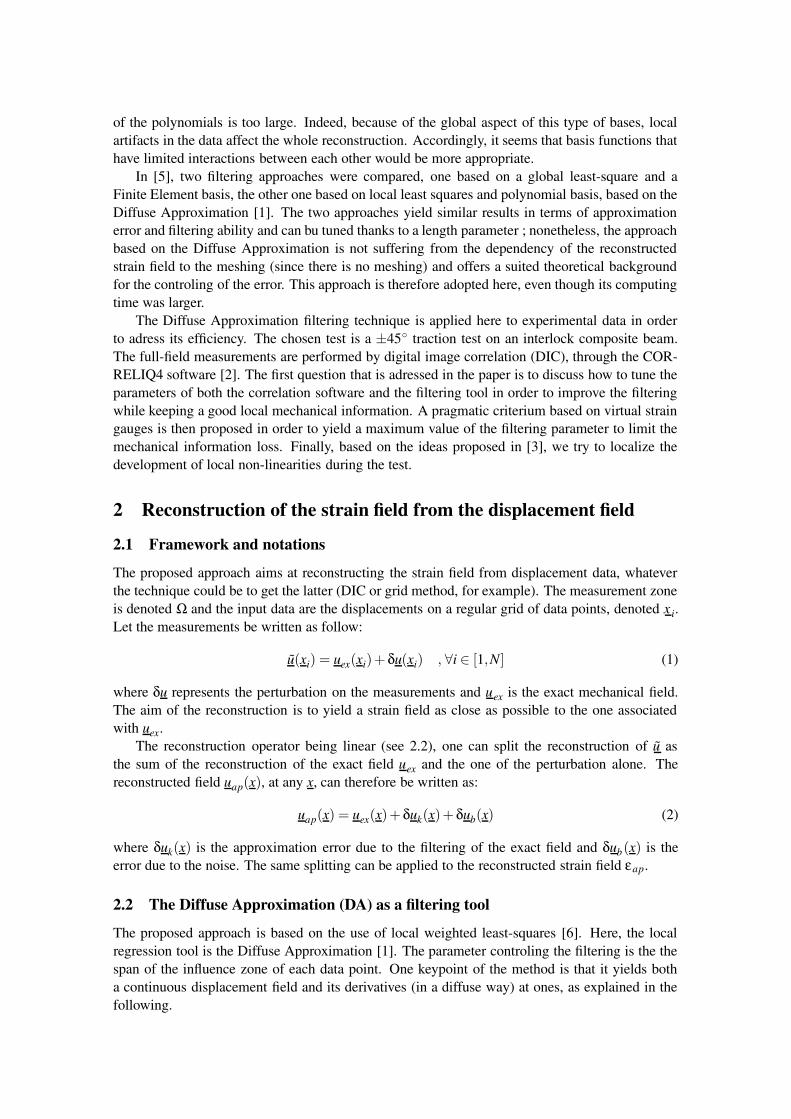
occurs. The other maps are refered by their chronological numbers from Figure 4.From these fields, it is possible to define a gap to the elastic strain for each part as the discrep-
ancy between the linear approximation related to the part and the reference elastic strain field.
∆εk,re flin (x) = εk
lin(x)− εre flin (x) (6)
These ∆εk,re flin fields are drawn on Figure 6 for a span R of 64 pixels. Figure 6(a) gives an idea of
the effect of the noise, since it compares the third part with the reference, and there should be verylittle mechanical discrepancy. Its magnitude is lower than on the following maps. One can notethat the strain increases (due to local damage) on the upper part of the zone in a first time, inducingan unloading of the central zone. In a second time, it seems, the damage propagates to the wholezone following alternative ±45 strips damaging and unloading. This tendencie is confirmed by
(a) ∆ε3,re flin (b) ∆ε4,re f
lin (c) ∆ε5,re flin (d) ∆ε6,re f
lin
Figure 6: Discrepancy to the elastic strain: ∆εk,re flin (6)
the Figure 7 where the incremental discrepancy is ploted. This discrepancy is defined as:
∆εk+1,klin (x) = εk+1
lin (x)− εklin(x) (7)
(a) ∆ε4,3lin (b) ∆ε5,4
lin (c) ∆ε6,5lin
Figure 7: Incremental discrepancy field: ∆εk+1,klin (7)
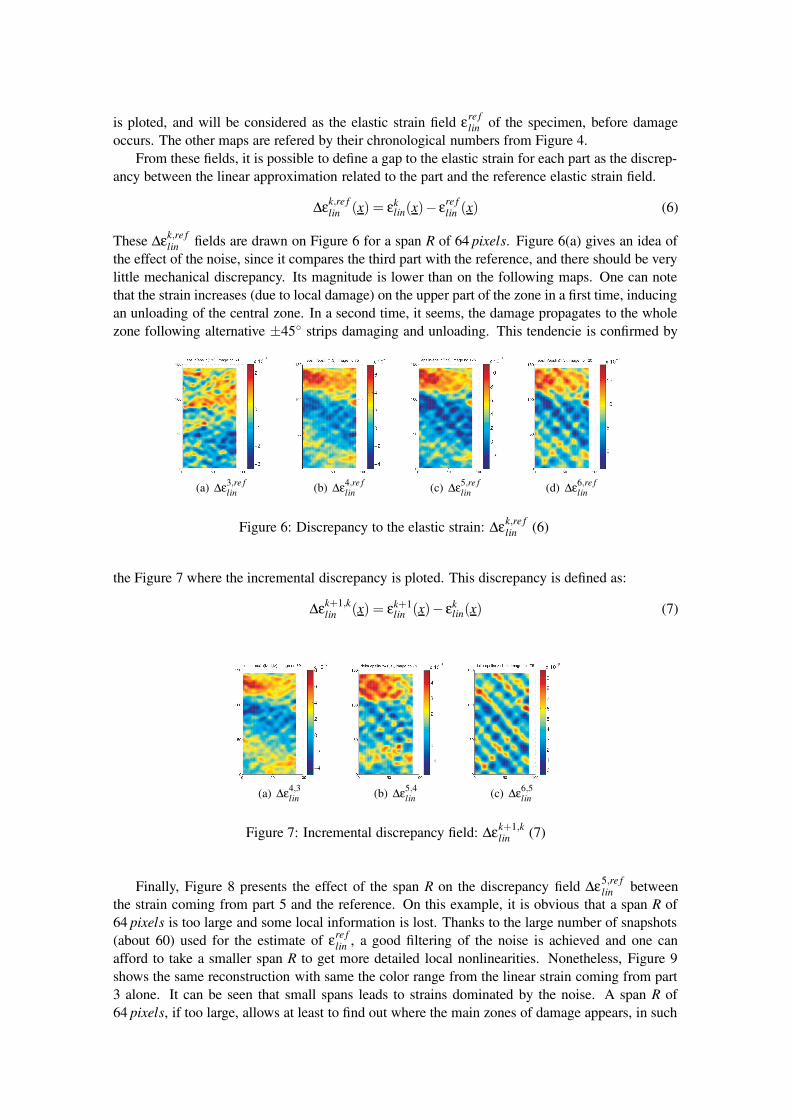
Finally, Figure 8 presents the effect of the span R on the discrepancy field ∆ε5,re flin between
the strain coming from part 5 and the reference. On this example, it is obvious that a span R of64 pixels is too large and some local information is lost. Thanks to the large number of snapshots(about 60) used for the estimate of εre f
lin , a good filtering of the noise is achieved and one canafford to take a smaller span R to get more detailed local nonlinearities. Nonetheless, Figure 9shows the same reconstruction with same the color range from the linear strain coming from part3 alone. It can be seen that small spans leads to strains dominated by the noise. A span R of64 pixels, if too large, allows at least to find out where the main zones of damage appears, in such
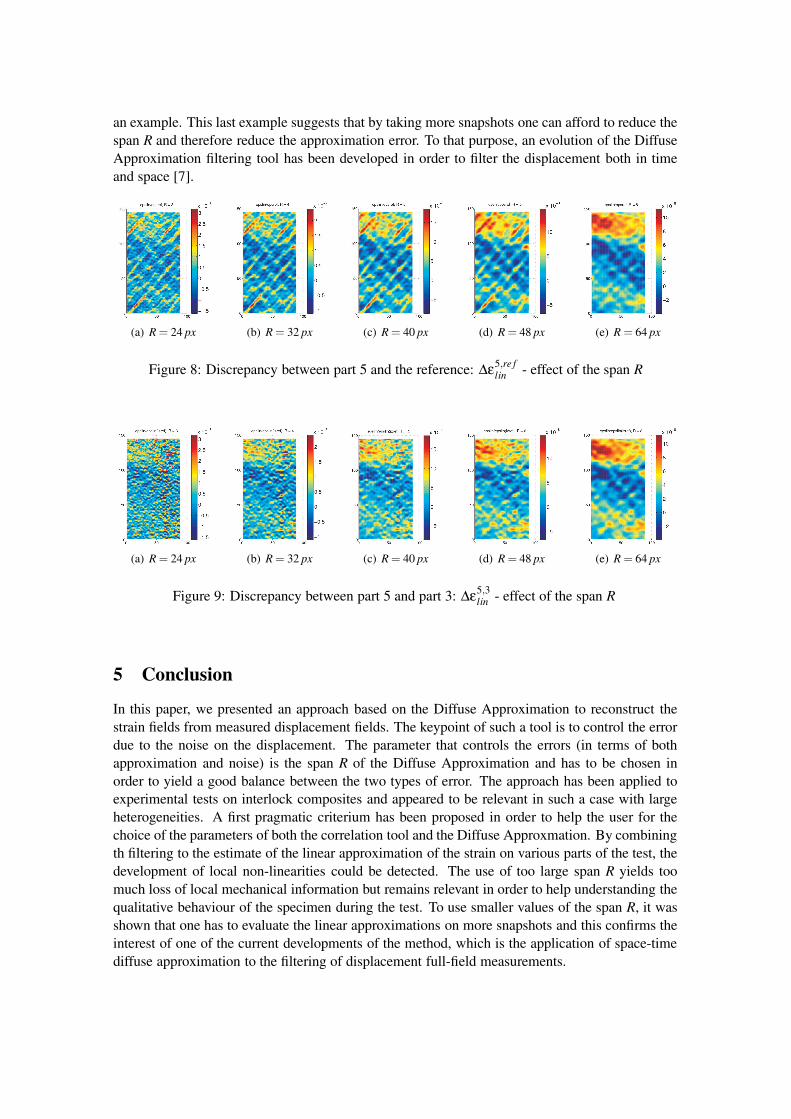
an example. This last example suggests that by taking more snapshots one can afford to reduce thespan R and therefore reduce the approximation error. To that purpose, an evolution of the DiffuseApproximation filtering tool has been developed in order to filter the displacement both in timeand space [7].
(a) R = 24 px (b) R = 32 px (c) R = 40 px (d) R = 48 px (e) R = 64 px
Figure 8: Discrepancy between part 5 and the reference: ∆ε5,re flin - effect of the span R
(a) R = 24 px (b) R = 32 px (c) R = 40 px (d) R = 48 px (e) R = 64 px
Figure 9: Discrepancy between part 5 and part 3: ∆ε5,3lin - effect of the span R
5 ConclusionIn this paper, we presented an approach based on the Diffuse Approximation to reconstruct thestrain fields from measured displacement fields. The keypoint of such a tool is to control the errordue to the noise on the displacement. The parameter that controls the errors (in terms of bothapproximation and noise) is the span R of the Diffuse Approximation and has to be chosen inorder to yield a good balance between the two types of error. The approach has been applied toexperimental tests on interlock composites and appeared to be relevant in such a case with largeheterogeneities. A first pragmatic criterium has been proposed in order to help the user for thechoice of the parameters of both the correlation tool and the Diffuse Approxmation. By combiningth filtering to the estimate of the linear approximation of the strain on various parts of the test, thedevelopment of local non-linearities could be detected. The use of too large span R yields toomuch loss of local mechanical information but remains relevant in order to help understanding thequalitative behaviour of the specimen during the test. To use smaller values of the span R, it wasshown that one has to evaluate the linear approximations on more snapshots and this confirms theinterest of one of the current developments of the method, which is the application of space-timediffuse approximation to the filtering of displacement full-field measurements.

References[1] B. Nayroles, G. Touzot, P. Villon. La méthode des éléments diffus. Comptes rendus de
l’Académie des Sciences, série 2, Mécanique, Physique, Chimie, Sciences de l’Univers, Sci-ences de la Terre, 313-2, 133–138, 1991.
[2] G. Besnard, F. Hild, S. Roux. Finite-element displacement fields analysis from digital im-ages: Application to Portevin-Le Châtelier bands. Experimental Techniques, 46, 789–803,2006.
[3] F Pierron, B. Green and M R Wisnom. Full-field assessment of the damage process of lami-nated composite open-hole tensile specimens. Part II: Experimental resultsComposites Part A: Applied Science and Manufacturing, 38-11,2321–2332 2007.
[4] F. J. Hickernell and Y. C. Hon. Radial basis function approximations as smoothing splines.Applied Mathematics and Computation, 102–1,1–24 1999.
[5] S. Avril, P. Feissel, F. Pierron, P. Villon. Estimation of strain field from full-field displacementnoisy data. Revue Européenne de Mécanique Numérique, Lavoisier, 17.5–7,857–868 2008.
[6] W.S. Cleveland, C. Loader Smoothing by local regression: principles and methods, Springer,1995.
[7] T. Roland, P. Feissel, M. Risbet, D. Brancherie and J.M. Roelandt Étude de l’amorçage d’unacier par corrélation d’images Congrès Français de Mécanique, Marseille, France, August2009, submitted