estimation of quantitative trait loci parameters for milk ... · x 631.87 ± 27.65 19.31 ± 1.07...
TRANSCRIPT

J. Dairy Sci. 88:356–367 American Dairy Science Association, 2005.
Estimation of Quantitative Trait Loci Parameters for Milk ProductionTraits in German Holstein Dairy Cattle Population
J. Szyda,1,2 Z. Liu,1 F. Reinhardt,1 and R. Reents11VIT, Heideweg 1, 27-283 Verden, Germany2Department of Animal Genetics,Wrocław Agricultural University, 51-631 Wrocław, Poland
ABSTRACT
The main objective of this study was to estimate theproportion of total genetic variance attributed to aquantitative trait locus (QTL) on Bos taurus autosome6 (BTA6) for milk production traits in the German Hol-stein dairy cattle population. The analyzed chromo-somal region on BTA6 spanned approximately 70 cM,and contained 6 microsatellite markers. Milk produc-tion data were obtained from routine genetic evaluationfor 4500 genotyped German Holstein bulls. Technicalaspects related to the estimation of model parametersfor a large data set from routine genotype recordingwere outlined. A fixed QTL model and a random QTLmodel were introduced to incorporate marker informa-tion into parameter estimation and genetic evaluation.Estimated QTL variances, expressed as the ratio ofQTL to polygenic variances, were 0.04, 0.03, and 0.07for milk yield; 0.06, 0.08, and 0.14 for fat yield; and 0.04,0.04, and 0.11 for protein yield, in the first 3 parities,respectively. The estimated QTL positions, expressedas distances from the leftmost marker DIK82, were 18,31, and 17 cM for milk yield; 25, 17, and 9 cM for fatyield; and 16, 30, and 17 cM for protein yield in the 3respective parities. Because the data for the parameterestimation well represented the current population ofactive German Holstein bulls, the QTL parameter esti-mates have been used in routine marker-assisted ge-netic evaluation for German Holsteins.(Key words: quantitative trait locus, variance compo-nent, milk production trait, chromosome 6)
Abbreviation key: AIA = average information algo-rithm, BTA6 = Bos taurus autosome 6, DYD = daughteryield deviations, EDC = effective daughter contribu-tion, IBD = identical by descent, MAS = marker-as-sisted selection, MCMC = Monte Carlo Markov Chain,RRTDM = random regression test day model, VIT =genetic evaluation center.
Received April 6, 2004.Accepted September 15, 2004.Corresponding author: Joanna Szyda; e-mail: Joanna.Szyda@
vit.de.
356
INTRODUCTION
The mixed inheritance model with random oligogenic(i.e., originating from QTL) and polygenic effects hasbeen regarded as a promising statistical description ofgenetic variation of quantitative traits (George et al.,2000; Meuwissen and Goddard, 2001; Liu et al., 2002;de Koning et al., 2003; Freyer et al., 2003). The possibil-ity of incorporating information on (co)variances be-tween individuals on average genome level (i.e., poly-genic) as well as at a specific position within genome(i.e., QTL) directly into the statistical model is espe-cially suited for data with complex multigenerationalpedigrees such as in dairy cattle, whereas statisticalmodels with fixed QTL effects are less realistic approxi-mations of the underlying modes of inheritance for out-bred populations. However, proper separation betweenvariance components corresponding to those 2 randomeffects is among the most important challenges in thestatistical analysis of data under the mixed inheritancemodel. The separation of 2 random effects is donethrough the differentiation of genetic similarity be-tween individuals into 2 parts: 1) at a site-specific level,related to the oligogenic component of genetic variancedue to similarity at a given position of the genome, andexpressed by the proportion of identity by descent (IBD)between individuals, and 2) at a genome-average level,related to the polygenic component of genetic varianceand expressed by the standard numerator relationshipmatrix (Henderson, 1963). Because the vast majorityof QTL have not yet been physically mapped on thebovine genome, indirect information coming from mo-lecular markers linked to the QTL must be used to tracetheir inheritance patterns and corresponding similarit-ies between individuals.
The mixed inheritance models with random QTL ef-fects can be used in preselection of young bulls for prog-eny testing programs, selection of young animals with-out or with little progeny information, or selection ofheifers as candidates for dams of bulls, following themarker-assisted selection (MAS) scheme. For routineapplication of MAS in dairy cattle populations, knowl-edge of parameters of polygenic and QTL components

QTL VARIANCE FOR MILK PRODUCTION TRAITS 357
of the genetic variance is the prerequisite. Such modelshave been applied to data from the US Holstein popula-tion by Zhang et al. (1998) and from a selected subsetof the German Holstein population by Freyer et al., inunivariate (2002) and multivariate (2003) frameworks.Therefore, the main objective of the current study wasto estimate genetic parameters of the mixed inheritancemodel for the German Holstein dairy population usingall available marker and phenotypic information. More-over, technical aspects related the estimation of modelparameters for a large data set from routine genotyperecording were discussed.
MATERIALS AND METHODS
The MAS System for German Holsteins
For German Holstein cattle, MAS was initiated in1995. In the first phase of the project, a genome scanof 339 markers was conducted using a granddaughterdesign, and applied to 1602 bulls from 19 grand-sirefamilies. The marker and phenotypic data were usedto localize the most significant QTL to be followed inupcoming generations. Regions on 3 chromosomes werechosen to represent QTL for milk production traits.Consequently, the second phase of MAS covered furthergenotyping of all young bulls and selected candidatesfor bull dams for 13 markers mapped to the 3 chromo-somes. Meanwhile, genotypes were updated for olderanimals to achieve higher completeness of marker infor-mation across generations. Up to February 2003, geno-type information was available for 10,152 individuals.The implementation of MAS in Germany involved (1)breeding organizations providing tissues for genotyp-ing, (2) universities conducting research, (3) labora-tories providing genotypes, and (4) a genetic evaluationcenter developing and implementing actual MAS evalu-ations. Cooperation was coordinated by the GermanCattle Breeders Federation and by the genetic evalua-tion center (VIT). A national system for managementof genotypic data, QTL mapping, and MAS was set upat VIT (for details see Szyda et al., 2002). Its maincomponents comprised the (1) management of markerdata, (2) data analysis, and (3) interchange of data andresults between genotyping laboratories, breeding orga-nizations, and VIT.
The analyzed material was a subset of bulls from theactive population of the German Holstein and reflectsthe contents of the marker database in February 2003.The data consisted of 4500 genotyped animals bornbetween 1985 and 2000. With nongenotyped parentsof the genotyped animals included, the full pedigreecontained 7841 animals.
Genotypic information. Based on the analysis ofthe genome scan data, a region representing QTL for
Journal of Dairy Science Vol. 88, No. 1, 2005
milk, fat, and protein yields was identified on chromo-some 6 (BTA6). The 6 markers mapped to this regioncovered approximately 70 cM with an average in-termarker distance of 14 cM (Thomsen et al., 2000).Table 1 gives distances between the markers and theirbasic characteristics based on all 10,152 animals.
Phenotypic information. The phenotypic records(Table 2) were daughter yield deviations (DYD) ob-tained from the official release of the May 2003 geneticevaluation, and were based on random-regression anda test-day model (RRTDM; Liu et al., 2001). The DYDof the first 3 parities for milk, protein, and fat yieldswere selected. The reliability associated with DYD wasexpressed by effective daughter contributions (EDC),approximated following Liu et al. (2004). The DYD inthe genotyped population were slightly higher than themeans of the whole population, indicating that, in gen-eral, genetically superior individuals were chosen forgenotyping in the early stage of the MAS program.
Statistical Models
A fixed QTL model (model 1). The first model ap-plied to the data included a fixed QTL effect specific toeach grandsire, expressed as a difference between aheterozygous (say, Qq) and a homozygous (say, qq) ge-notype:
y = Xβ + Zsqs + Za + e [1]
where y is a vector of DYD for bulls, expressed on a305-d lactation basis, β is a vector of fixed effects foryear of birth, qs is a vector of fixed QTL effects for allgrand-sires, a is a vector of random polygenic effectsassuming a ∼ N(0,Gaσ
2a) with Ga representing polygenic
relationships among individuals and σ2a being a compo-
nent of the total additive genetic variance attributedto polygenes, e is a vector of random errors assuminge ∼ N(0,Dσ2
e) with σ2e denoting the error variance and
matrix D containing a function of EDC (which is speci-fied later in the text) on the diagonal, and X, Zs, andZ are corresponding design matrices. The (co)variancestructure corresponding to model [1] is given by
var
ae
=
Gaσ2a 0
0 Dσ2e
.
A random QTL model (model 2). The model in-cluded a random QTL effect specific to each animal:
y = Xβ + Zqq + Za + e [2]
where q is a vector of random QTL effects; assumingq ∼ N(0,Gqσ
2q) with Gq representing relationship among
individuals at a QTL position expressed by proportions

SZYDA ET AL.358
Table 1. Marker information in the genotyped population. Map locations estimated by Thomsen et al.(2000).
Map Genotyped Heterozygouslocation No. of individuals individuals
Marker (cM) alleles (no.) PIC1 (%)
DIK82 00.0 11 8184 0.766 40.2IL97 22.1 4 4882 0.374 24.9FBN14 30.6 6 5112 0.426 22.0CSN3 38.6 4 5218 0.367 20.6BP7 49.3 9 7138 0.645 35.1BMC4203 69.8 10 6078 0.602 33.5
1PIC = Polymorphic information content.
of alleles being IBD and σ2q is the component of the total
additive genetic variance due to the QTL; X, Zq, Z arecorresponding design matrices, and the other effectsare as specified above. Covariance structure betweenthe random effects of model [2] is defined as:
var
qae
=
Gqσ2q 0 0
0 Gaσ2a 0
0 0 Dσ2e
.
Derivation of DYD. By definition, DYD of bulls areaverages of daughters’ performance adjusted for allfixed and nongenetic random effects of the daughtersand genetic effects of their dams. The DYD are de-regressed and are a more independent measure of phe-notypic performance of bull’s daughters than are EBV(VanRaden and Wiggans, 1991). The DYD were derivedfollowing Liu et al. (2004), by absorbing the geneticeffects of daughters by using their records adjusted forall other effects and for the EBV of the dams. For theRRTDM, the DYD were modeled with the same mathe-matical function as additive genetic effects and ex-pressed in regression coefficients. The vector y con-tained DYD on a 305-d lactation basis, which were com-puted by summing up individual DYD of all DIM.
Table 2. Phenotypic information in the analyzed sample.
Parity Statistic1 Milk yield Fat yield Protein yield
x 659.65 ± 18.68 20.36 ± 0.69 21.54 ± 0.561 sx 568.90 21.07 17.18
min/max (−1426.41) / 2484.82 (−45.57) / 95.96 (−45.32) / 85.71
x 671.23 ± 23.19 19.61 ± 0.88 21.70 ± 0.732 sx 625.62 23.63 19.74
min/max (−1858.44) / 3044.72 (−66.48) / 114.10 (−57.10) / 89.50
x 631.87 ± 27.65 19.31 ± 1.07 19.12 ± 0.853 sx 638.97 24.74 19.71
min/max (−1955.58) / 3079.23 (−68.78) / 118.72 (−64.08) / 96.77
1Statistics: x = average yield with 95% confidence interval, sx = standard deviation, min/max denotes bordervalues.
Journal of Dairy Science Vol. 88, No. 1, 2005
Derivation of weights on DYD. Reliability of a bulldue to daughter performance, denoted as R2
b, was ob-tained from the approximation procedure of Liu et al.(2004). The calculation of R2
b under an RRTDM ac-counted for numbers of daughters, numbers of lacta-tions per daughter, numbers of tests per lactation, andthe reliability of the EBV of the mates of the bull. Theleast squares part, denoted φb, of the left-hand side inthe mixed model equation system corresponding to thebull was derived as:
φb =R2
b
1 − R2bσ−2
a =kR2
b
1 − R2bσ−2
e = naσ−2e [3]
where na is the weight on DYD of the bull and repre-sents the diagonal element in D for the bull, and k =σ2
e/σ2a is the ratio of residual to genetic variance.
Estimation of IBD Proportion
Estimation of the IBD matrix of the QTL was basedon the reversible jump Monte Carlo Markov Chain(MCMC; Green, 1995) algorithm along the wholemarked chromosome region at a step-size of 1 cM. Be-cause no formal monitoring of the MCMC algorithm
QTL VARIANCE FOR MILK PRODUCTION TRAITS 359
convergence was performed, a long burn-in phase of1000 rounds was used to allow sampling from theproper marginal distributions. Also, a long spacing of100 rounds was chosen between scored IBD matrix real-izations to account for the fact that mixing of the param-eter values might be poor for a large multigenerationalpedigree with many closely linked markers. The modeof 91 realizations was considered as the final estimateof the IBD matrix.
Estimation of Model Parameters
The restricted maximum likelihood (REML; Pat-terson and Thompson, 1971) approach was applied forestimating parameters of models [1] and [2]. FollowingGilmour et al. (1995), average information algorithm(AIA) was used to maximize REML likelihood. The like-lihood functions of models [1] and [2] were respectivelydefined as:
ln L = −n − r2 ln(2π) − 1
2(ln|R| + ln|Gaσ2a| − ln|C|
+ y′R−1y − y′R−1Xβ − y′R−1Zsqs − yR−1Za)
and
ln L = −n − r2 ln(2π) − 1
2(ln|R| + ln|Gqσ2q|
+ ln|Gaσ2a| − ln|C| + y′R−1y − y′R−1Xβ [4]
− y′R−1Zqq − yR−1Za)
where n is the number of phenotypic records, r is therank of the design matrix for fixed effects, R = Dσ2
e isresidual (co)variance matrix, C is coefficient matrix ofthe mixed model equations of model [2]. The estimatedeffects comprised [β q a], and estimated variancesare σ2
a, σ2e for model [1] and, additionally, σ2
q for model[2]. For all the traits considered, the most probableposition of the QTL was estimated using model [1] basedon a likelihood profile constructed every 1 cM along themarked region of BTA6. Parameters of model [2] wereestimated for the most probable QTL location estimatedby model [1], except for second lactation fat yield, forwhich the parameters were estimated along the wholemarked chromosome region every 1 cM. Confidence in-tervals for QTL position, σ2
a and σ2q were obtained based
on a normal approximation of the asymptotic distribu-tion of maximum likelihood estimates:
(θ − zα/2σθ < θ < θ + zα/2σθ)
Journal of Dairy Science Vol. 88, No. 1, 2005
where θ is the estimate of QTL position, σ2a, or σ2
q,α is the probability of type I error, zα/2 is the critical
value corresponding toα2 type I error rate based on
the standard normal distribution, and σθ is the
standard deviation of θ approximated by
√ ∆2
ln L(θ − ∆) + ln L(θ + ∆) − 2 ln L(θ)with ∆ set to 1
cM for QTL position, 0.3 for σ2a, and 0.04 for σ2
q (Meyerand Hill, 1992).
Hypotheses Testing
The likelihood ratio test statistic was used as a test-ing criterion:
λ = −2 lnL(M0)L(M1)
[5]
where L(M1) and L(M0) are the maximum values oflikelihood functions underlying the unrestricted modelgiven above and a more parsimonious model withoutQTL effects. Corresponding null and alternativehypotheses were:
H1: qs ≠ 0 and H0: qs = 0 for model [1], with theasymptotic null distribution of λ being χ2
1df.H1: σ2
q > 0 and H0: σ2q = 0 for model [2]. Because σ2
q
was constrained to positive values, the asymptotic nulldistribution of λ followed a 50:50 mixture of 0 andχ2
1df [for theoretical derivation, see Self and Liang(1987); for empirical results based on livestock datastructure, see George et al. (2000)].
Implementation
The routine implementation of the estimation proce-dure involved 5 steps:
1. Checking for data consistency by database rou-tine programs.
2. Data preparation, check, and preliminary analysisby a UNIX shell script, SAS (SAS Institute, 1999),and Fortran programs.
3. Estimation of IBD matrices by the package LOKI(Heath, 1997).
4. Inverting the IBD matrices using sparse matrixroutines implemented in the FSPAK package (Mis-ztal and Perez-Enciso, 1998).
5. Estimation of model parameters by the ASREMLpackage (Gilmour et al., 1995) and prediction ofestimated polygenic and QTL effects.
SZYDA ET AL.360
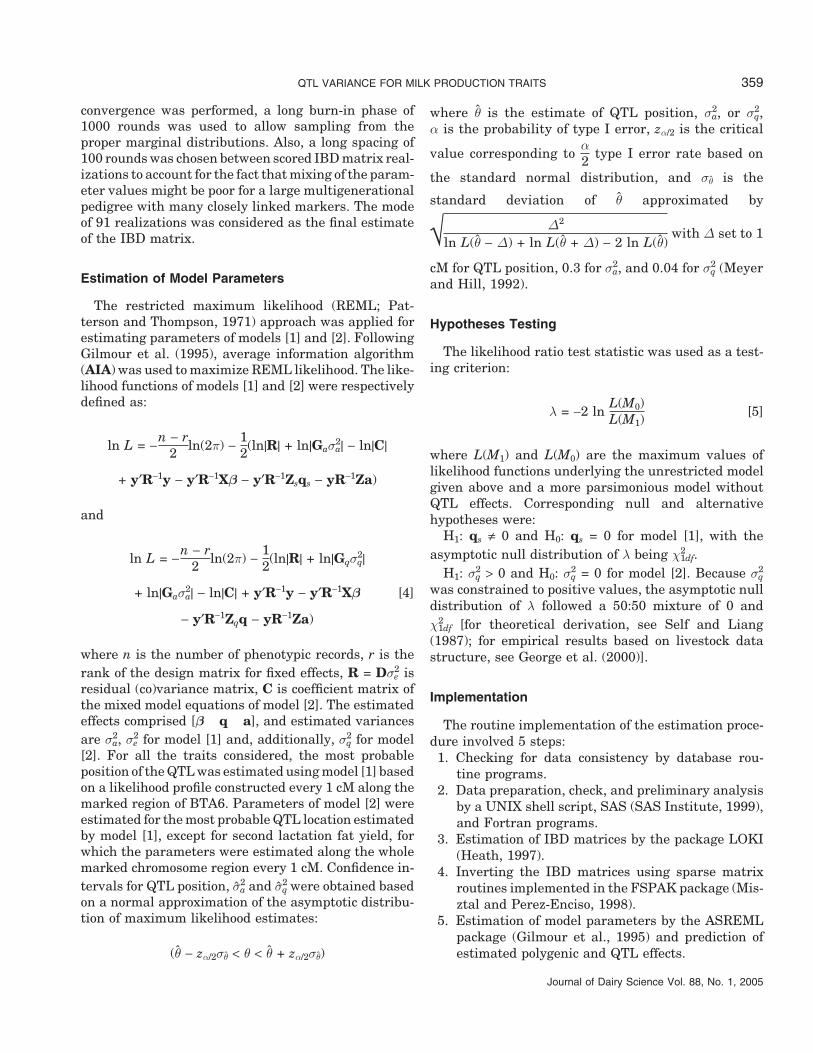
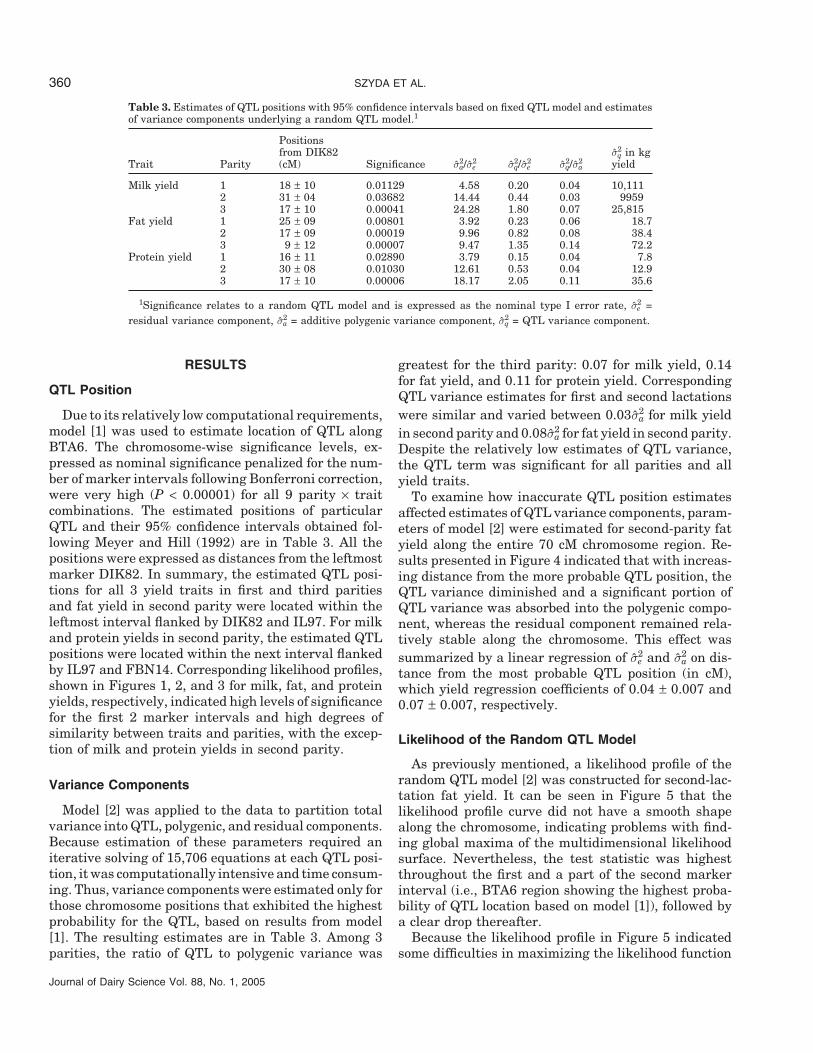
Table 3. Estimates of QTL positions with 95% confidence intervals based on fixed QTL model and estimatesof variance components underlying a random QTL model.1
Positionsfrom DIK82 σ2
q in kgTrait Parity (cM) Significance σ2
a/σ2e σ2
q/σ2e σ2
q/σ2a yield
Milk yield 1 18 ± 10 0.01129 4.58 0.20 0.04 10,1112 31 ± 04 0.03682 14.44 0.44 0.03 99593 17 ± 10 0.00041 24.28 1.80 0.07 25,815
Fat yield 1 25 ± 09 0.00801 3.92 0.23 0.06 18.72 17 ± 09 0.00019 9.96 0.82 0.08 38.43 9 ± 12 0.00007 9.47 1.35 0.14 72.2
Protein yield 1 16 ± 11 0.02890 3.79 0.15 0.04 7.82 30 ± 08 0.01030 12.61 0.53 0.04 12.93 17 ± 10 0.00006 18.17 2.05 0.11 35.6
1Significance relates to a random QTL model and is expressed as the nominal type I error rate, σ2e =
residual variance component, σ2a = additive polygenic variance component, σ2
q = QTL variance component.
RESULTS
QTL Position
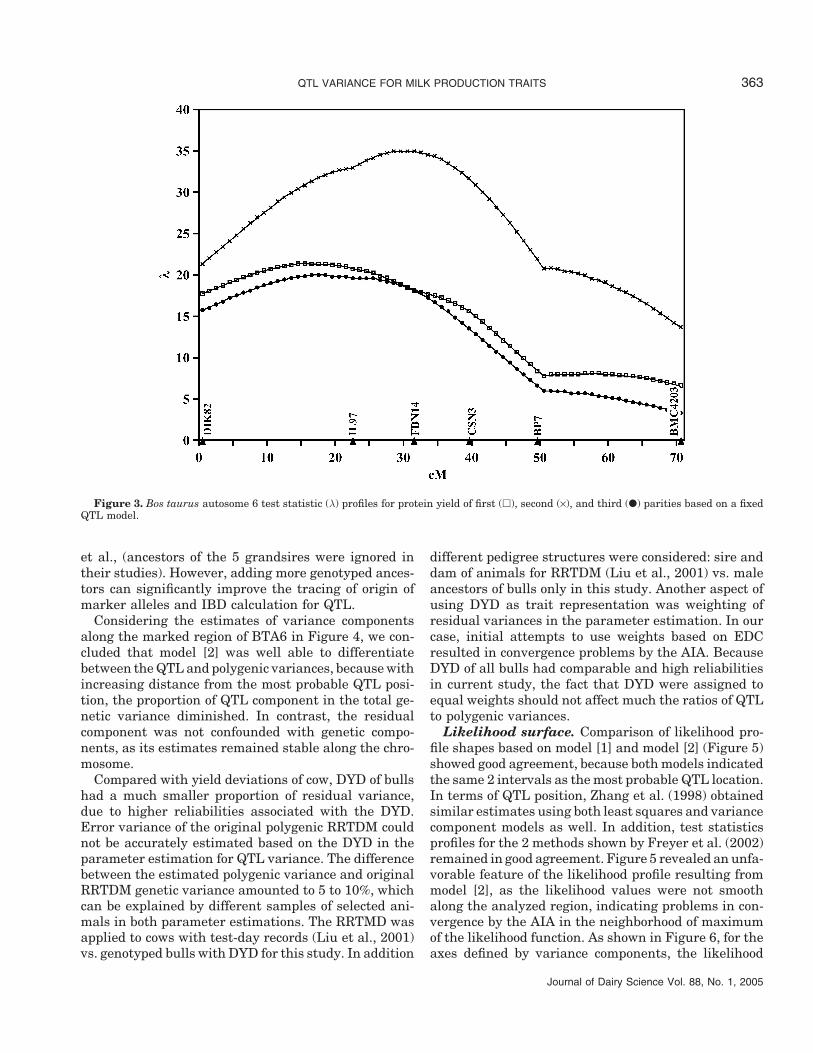
Due to its relatively low computational requirements,model [1] was used to estimate location of QTL alongBTA6. The chromosome-wise significance levels, ex-pressed as nominal significance penalized for the num-ber of marker intervals following Bonferroni correction,were very high (P < 0.00001) for all 9 parity × traitcombinations. The estimated positions of particularQTL and their 95% confidence intervals obtained fol-lowing Meyer and Hill (1992) are in Table 3. All thepositions were expressed as distances from the leftmostmarker DIK82. In summary, the estimated QTL posi-tions for all 3 yield traits in first and third paritiesand fat yield in second parity were located within theleftmost interval flanked by DIK82 and IL97. For milkand protein yields in second parity, the estimated QTLpositions were located within the next interval flankedby IL97 and FBN14. Corresponding likelihood profiles,shown in Figures 1, 2, and 3 for milk, fat, and proteinyields, respectively, indicated high levels of significancefor the first 2 marker intervals and high degrees ofsimilarity between traits and parities, with the excep-tion of milk and protein yields in second parity.
Variance Components
Model [2] was applied to the data to partition totalvariance into QTL, polygenic, and residual components.Because estimation of these parameters required aniterative solving of 15,706 equations at each QTL posi-tion, it was computationally intensive and time consum-ing. Thus, variance components were estimated only forthose chromosome positions that exhibited the highestprobability for the QTL, based on results from model[1]. The resulting estimates are in Table 3. Among 3parities, the ratio of QTL to polygenic variance was
Journal of Dairy Science Vol. 88, No. 1, 2005
greatest for the third parity: 0.07 for milk yield, 0.14for fat yield, and 0.11 for protein yield. CorrespondingQTL variance estimates for first and second lactationswere similar and varied between 0.03σ2
a for milk yieldin second parity and 0.08σ2
a for fat yield in second parity.Despite the relatively low estimates of QTL variance,the QTL term was significant for all parities and allyield traits.
To examine how inaccurate QTL position estimatesaffected estimates of QTL variance components, param-eters of model [2] were estimated for second-parity fatyield along the entire 70 cM chromosome region. Re-sults presented in Figure 4 indicated that with increas-ing distance from the more probable QTL position, theQTL variance diminished and a significant portion ofQTL variance was absorbed into the polygenic compo-nent, whereas the residual component remained rela-tively stable along the chromosome. This effect wassummarized by a linear regression of σ2
e and σ2a on dis-
tance from the most probable QTL position (in cM),which yield regression coefficients of 0.04 ± 0.007 and0.07 ± 0.007, respectively.
Likelihood of the Random QTL Model
As previously mentioned, a likelihood profile of therandom QTL model [2] was constructed for second-lac-tation fat yield. It can be seen in Figure 5 that thelikelihood profile curve did not have a smooth shapealong the chromosome, indicating problems with find-ing global maxima of the multidimensional likelihoodsurface. Nevertheless, the test statistic was highestthroughout the first and a part of the second markerinterval (i.e., BTA6 region showing the highest proba-bility of QTL location based on model [1]), followed bya clear drop thereafter.
Because the likelihood profile in Figure 5 indicatedsome difficulties in maximizing the likelihood function

QTL VARIANCE FOR MILK PRODUCTION TRAITS 361
Figure 1. Bos taurus autosome 6 test statistic (λ) profiles for milk yield of first (�), second (×), and third (●) parities based on a fixedQTL model.
underlying model [2], it was important to know howmuch information, i.e., curvature, was available for es-timating the variance components. For that purpose, a2-D surface was constructed over the grid of σ2
a andσ2
q around the σ2a and σ2
q values for second-lactation fatyield, while the other parameters of model [2] wereestimated using the AIA as implemented in the AS-REML package. As shown in Figure 6, in the proximityof the σ2
a and σ2q values, the likelihood surface remained
rather flat, and equal likelihood values were obtainedfor 34 different combinations of σ2
a and σ2q. The 95%
confidence intervals approximated for the 2 varianceestimates were (5.8 and 14.2) for σ2
a and (0.27 and 1.37)for σ2
q.
DISCUSSION
QTL for milk production traits on BTA6. Evi-dence for QTL affecting milk production traits in theneighborhood of the CN gene cluster has been reportedby many authors and found across various cattle breedsand populations including Finnish Ayrshire (Velmalaet al., 1999; de Koning et al., 2001; Viitala et al., 2003),Canadian Holstein (Nadesalingam et al., 2001), DutchHolstein (Spelman et al., 1996), German Holstein
Journal of Dairy Science Vol. 88, No. 1, 2005
(Kuhn et al., 1999; Freyer et al., 2002, 2003), IsraeliHolstein (Ron et al., 2001), US Holstein (Georges et al.1995; Zhang et al., 1998; Rodriguez-Zas et al., 2002),and Norwegian Dairy Cattle (Olsen et al., 2002). Alsoin our study, the location of QTL in the region markedby DIK82-IL97-FBN14 corresponded with QTL posi-tions estimated by other authors. Unlike many otherQTL, the chromosomal location of these QTL remainedsurprisingly consistent among various populations de-spite different materials and methods used in the analy-ses. This result suggested that the QTL on BTA6 is oneof the most important loci to be considered in MAS.Recently, Khatkar et al. (2004) performed a meta-anal-ysis of available QTL mapping results, and concludedthat 2 QTL for milk yield and a single QTL for fat orprotein yield were segregating in the CN region onBTA6.
Variance component estimates. The main goal ofour study was to estimate genetic parameters underly-ing the random QTL model used for MAS, i.e., additivepolygenic and QTL variances for the German Holsteinpopulation. Quantitative trait loci variance was alreadyestimated for by Zhang et al. (1998) for US Holsteinsand for the German Holsteins by Freyer et al. (2002,2003). However, an important advantage of the currentstudy was the large size of the data sets: (1) more than

SZYDA ET AL.362
Figure 2. Bos taurus autosome 6 test statistic (λ) profiles for fat yield of first (�), second (×), and third (●) parities based on a fixedQTL model.
2 generations of genotyped individuals were available,(2) the young genotyped bulls represented almost all ofthe young bulls tested in German Holstein population(although not all of those bulls have DYD available yet).Those features mean that the data well represent thecurrent German Holstein population. The variancecomponents for milk and fat yields estimated by Zhanget al. (1998) based on the sample of 1794 sons of 14sires remained in close agreement with our varianceestimates. In general, QTL variances explained by themarkers on BTA6 represented only a small proportion(<10%) of the additive genetic variance of milk produc-tion traits in both populations. In contrast, the studyby Freyer et al. (2002, 2003) based on data from 562sons of 5 sires gave much higher estimates of QTLvariance, especially for fat and protein yields, varyingbetween 23 and 50% of the total genetic variance de-pending on the model and trait studied. We noticedthat there was a significant change in QTL varianceestimates in the 2 investigations by Freyer et al. usingthe same data set. The QTL variance estimate for milkyield increased from 8 to 16% of variance of DYD, butsignificantly decreased from 50 to 20% for fat yield, andfrom 50 to 28% for protein yield between the 2 studies,even though the same univariate QTL model was used.The differences in QTL variance estimates between our
Journal of Dairy Science Vol. 88, No. 1, 2005
study and both studies of Freyer et al. were due to thefollowing reasons: 1) The trait used by Freyer et al. wasa yield trait on a combined lactation basis, whereaswe analyzed the yield traits in 3 lactations separately.Because the 3 lactations were highly positively corre-lated, higher QTL component can be expected for com-bined lactation than for single lactations; 2) The depen-dent variable in our study was DYD, whereas the depen-dent variable in Freyer et al. (2002) was EBV. Theynoted that DYD had higher proportion of nonQTL vari-ance and lower QTL component than did EBV. In ouropinion, DYD is an unregressed measure of daughterperformance and should be preferred to EBV, despitethe fact that the use of DYD led to a lower QTL variancecomponent; 3) The DYD and EBV used by Freyer et al.(2003) corresponded to a different genetic evaluationmodel (Reents et al., 1995) and a different DYD calcula-tion method; 4) The numbers of genotyped animals andanimals in pedigree were much higher in our studythan in the studies by Freyer et al. (2003) and the datain their studies might not have been representativeof the overall population. Sampling variances of QTLparameter estimates were significantly smaller in ourstudies than in Freyer et al. (2003); and 5) We hadmultiple generations of genotyped animals, in compari-son with only 2 generations in both studies of Freyer
QTL VARIANCE FOR MILK PRODUCTION TRAITS 363
Figure 3. Bos taurus autosome 6 test statistic (λ) profiles for protein yield of first (�), second (×), and third (●) parities based on a fixedQTL model.
et al., (ancestors of the 5 grandsires were ignored intheir studies). However, adding more genotyped ances-tors can significantly improve the tracing of origin ofmarker alleles and IBD calculation for QTL.
Considering the estimates of variance componentsalong the marked region of BTA6 in Figure 4, we con-cluded that model [2] was well able to differentiatebetween the QTL and polygenic variances, because withincreasing distance from the most probable QTL posi-tion, the proportion of QTL component in the total ge-netic variance diminished. In contrast, the residualcomponent was not confounded with genetic compo-nents, as its estimates remained stable along the chro-mosome.
Compared with yield deviations of cow, DYD of bullshad a much smaller proportion of residual variance,due to higher reliabilities associated with the DYD.Error variance of the original polygenic RRTDM couldnot be accurately estimated based on the DYD in theparameter estimation for QTL variance. The differencebetween the estimated polygenic variance and originalRRTDM genetic variance amounted to 5 to 10%, whichcan be explained by different samples of selected ani-mals in both parameter estimations. The RRTMD wasapplied to cows with test-day records (Liu et al., 2001)vs. genotyped bulls with DYD for this study. In addition
Journal of Dairy Science Vol. 88, No. 1, 2005
different pedigree structures were considered: sire anddam of animals for RRTDM (Liu et al., 2001) vs. maleancestors of bulls only in this study. Another aspect ofusing DYD as trait representation was weighting ofresidual variances in the parameter estimation. In ourcase, initial attempts to use weights based on EDCresulted in convergence problems by the AIA. BecauseDYD of all bulls had comparable and high reliabilitiesin current study, the fact that DYD were assigned toequal weights should not affect much the ratios of QTLto polygenic variances.
Likelihood surface. Comparison of likelihood pro-file shapes based on model [1] and model [2] (Figure 5)showed good agreement, because both models indicatedthe same 2 intervals as the most probable QTL location.In terms of QTL position, Zhang et al. (1998) obtainedsimilar estimates using both least squares and variancecomponent models as well. In addition, test statisticsprofiles for the 2 methods shown by Freyer et al. (2002)remained in good agreement. Figure 5 revealed an unfa-vorable feature of the likelihood profile resulting frommodel [2], as the likelihood values were not smoothalong the analyzed region, indicating problems in con-vergence by the AIA in the neighborhood of maximumof the likelihood function. As shown in Figure 6, for theaxes defined by variance components, the likelihood

SZYDA ET AL.364
Figure 4. Partitioning of the total variance for fat yield of second parity between residual (�), additive polygenic (�), and QTL (�),based on a random QTL model. H0 represents partitioning under the null hypothesis of no QTL. The QTL position estimated under a fixedQTL model is marked with an arrow.
surface was rather flat, not only at the very maximumbut also in its proximity, which most likely caused theobserved optimization problems.
Estimation of IBD proportions. As already pointedout by Grignola et al. (1996), the estimation of IBDrelationships for large, multigenerational pedigreeswas computationally very demanding. The first methodfor calculating IBD proportions for such pedigrees wasproposed by Fernando and Grossman (1989) for a singlemarker scenario. However, using one marker at a timeis not well suited for analyzing data from actual dairycattle populations with a complex pedigree structure,because there are often uninformative or missingmarker genotypes. Since the above-mentioned seminalstudy, a number of methods for calculating IBD coeffi-cients have been developed, which can be mainly classi-fied into deterministic and MCMC-based approaches,based on the estimation method, or into marker intervaland multiple-marker based approaches, according tothe use of marker information. The main advantage ofthe deterministic approach lies in its speed of computa-tion; however, no method exists at present that is able
Journal of Dairy Science Vol. 88, No. 1, 2005
to use all available marker haplotype and pedigree in-formation. Pong-Wong et al. (2001) and Liu et al. (2002)proposed methods that can account for a markerbracket. The multiple marker approach was developedby Almasy and Blangero (1998), but it was only applica-ble to special types of relationships between individu-als. Meuwissen and Goddard (2001) presented amultimarker approach capable of tracing historical re-lationships not contained in the recorded part of a pedi-gree, but available relationship information was notexplicitly used in the method. Recently, Lund et al.(2003) combined the information on historical and ob-served relationships following Meuwissen and Goddard(2001) and Wang et al. (1995), respectively for the 2components. An overview of deterministic IBD estima-tion methods was given by George et al. (2000). TheMCMC-based approaches were more flexible in termsof using marker and complex pedigree information, butthey were time consuming, which limited their applica-tion to the analysis of large data sets. Additionally,issues related to monitoring convergence and irreduc-ibility of the algorithms has not been well defined yet.

QTL VARIANCE FOR MILK PRODUCTION TRAITS 365
Figure 5. Bos taurus autosome 6 test statistic (λ) profiles for fat yield of second parity based on a fixed QTL model (�) and a randomQTL model (●).
The approach of Heath (1997) was among the first appli-cations of MCMC to the analysis of large complex pedi-grees, followed for example, by Xu and Gessler (1998)and Perez-Enciso et al. (2000). Grignola et al. (1996)proposed an intermediate approach, in which MCMCwas used for the estimation of IBD among the geno-typed part of the parental pedigree and then a deter-ministic approach to obtain IBD coefficient was usedfor nonparents.
The approach of Heath (1997) as implemented in theLOKI package, was used for the estimation of IBD pro-portions in the current study, which were then usedin the parameter estimation under model [2] via theASREML package. The simulation results by Georgeet al. (2000) demonstrated that by using the aforemen-tioned implementation, both variance components andQTL positions can be accurately estimated even in caseof missing marker data. An application of this approachto livestock data was presented by de Koning et al.(2003). The results of simulation studies carried bySørensen et al. (2002) showed that the algorithm pro-vides accurate estimates of IBD proportions.
Using genomic information. Although the originalplan in Germany was to acquire not only male but alsofemale genotypes in the development of routine geno-typing and MAS, data available for the current analysis
Journal of Dairy Science Vol. 88, No. 1, 2005
consisted of genotypes of bulls only. Because of the largenumber of genotyped bulls, genotypes of some damsand maternal grandsires could have been recon-structed. Recently, Bolard and Boichard (2002) showedhow the information on maternal grand-sire genotypesand, consequently, on QTL transmissions can be incor-porated in the QTL mapping, albeit in the fixed QTLframework. The marker information on female animalsshould be, whenever possible, incorporated in both pa-rameter estimation and routine genetic evaluation.
CONCLUSIONS
Based on a random QTL model, QTL variance formilk production traits was estimated using a largemarker and phenotypic data set for the German Hol-stein population. The estimated QTL variances ac-counted for 4 to 14% of polygenic variances for milk,fat, and protein yields. These QTL parameter estimateshave been used in routine marker-assisted genetic eval-uations of production traits in Germany, based on DYDof bulls and yield deviations of cows. Our experienceshowed that the MCMC-based algorithm for estimatingIBD proportions was able to use the most of availablepedigree and marker information. On the other hand,the MCMC-based methods seemed to be rather time

SZYDA ET AL.366
Figure 6. Likelihood surface over σ2a and σ2
q around the σ2a and σ2
q for fat yield of second parity based on a random QTL model.
consuming for routine MAS in large data sets currently.Therefore, efficient and accurate deterministic ap-proaches would be more appealing for routine MASapplication. The random QTL model with both randomQTL and polygenic effects accounted for relationshipsamong animals on the genome level as well as at aspecific genome position, which makes it applicable forroutine genetic evaluation of dairy cattle. The DYDwere used as dependent variables and associated EDCas a function for weighting factors in the marker-as-sisted genetic evaluation system. Our current MAS ge-netic evaluation system analyzes data from one lacta-tion at a time only, although routine genetic evaluationof production traits has been conducted with a multiple-lactation RRTDM (Liu et al., 2004). A logical furtherdevelopment of the random QTL model would be toextend it from the current single-lactation model to amultiple-lactation model to account for the correlationsbetween lactations.
Journal of Dairy Science Vol. 88, No. 1, 2005
REFERENCESAlmasy, L., and J. Blangero. 1998. Multipoint quantitative-trait link-
age analysis in general pedigrees. Am. J. Hum. Genet.62:1198–1211.
Bolard, M., and D. Boichard. 2002. Use of maternal information forQTL detection in a (grand)daughter design. Genet. Sel. Evol.34:335–352.
de Koning, D. J., R. Pong-Wong, L. Varona, G. J. Evans, E. Giuffra,A. Sanchez, G. Plastow, J. L. Noguera, L. Andersson, and C. S.Haley. 2003. Full pedigree quantitative trait locus analysis incommercial pigs using variance components. J. Anim. Sci.81:2155–2163.
de Koning, D. J., N. F. Schulman, K. Elo, S. Moisio, R. Kinos, J. Vilkki,and A. Maki-Tanila. 2001. Mapping of multiple quantitative traitloci by simple regression in half-sib designs. J. Anim. Sci.79:616–622.
Fernando, R. L., and M. Grossman. 1989. Marker-assisted selectionusing best linear unbiased prediction. Genet. Sel. Evol.21:467–477.
Freyer, G., C. Kuhn, R. Weikard, Q. Zhang, M. Mayer, and I.Hoeschele. 2002. Multiple QTL on chromosome six in dairy cattleaffecting yield and content traits. J. Anim. Breed. Genet.119:69–82.
Freyer, G., P. Sorensen, C. Kuhn, R. Weikard, and I. Hoeschele. 2003.Search for pleiotropic QTL on chromosome BTA6 affecting yieldtraits of milk production. J. Dairy Sci. 86:999–1008.

QTL VARIANCE FOR MILK PRODUCTION TRAITS 367
George, A. W., P. M. Visscher, and C. S. Haley. 2000. Mapping quanti-tative trait loci in complex pedigrees: A two-step variance compo-nent approach. Genetics 156:2081–2092.
Georges, M., D. Nielsen, M. Mackinnon, A. Mishra, R. Okimoto, A.T. Pasquino, L. S. Sargeant, A. Sorensen, M. R. Steele, X. Zhao,J. E. Womack, and I. Hoeschele. 1995. Mapping quantitativetrait loci controlling milk production in dairy cattle by exploitingprogeny testing. Genetics 139:907–920.
Gilmour, A. R., R. Thompson, and B. R. Cullis. 1995. AI, an efficientalgorithm for REML estimation in linear mixed models. J. DairySci. 51:1440–1450.
Green, P. J. 1995. Reversible jump Markov chain Monte Carlo compu-tation and Bayesian model determination. Biometrika 82:711–732.
Grignola, F. E., I. Hoeschele, and B. Tier. 1996. Mapping quantitativetrait loci via residual maximum likelihood. I. Methodology. Genet.Sel. Evol. 28:479–490.
Heath, S. C. 1997. Markov chain Monte Carlo segregation and linkageanalysis for oligogenic models. Am. J. Hum. Genet. 61:748–760.
Henderson, C. R. 1963. Page 141 in Statistical Genetics and PlantBreeding. W. D. Hanson and H. F. Robinson, ed. Natl. Acad. Sci.,National Research Council, Washington, DC.
Khatkar, M. S., P. C. Thomson, I. Tammen, and H. W. Raadsma.2004. Quantitative trait loci mapping in dairy cattle: Review andmeta-analysis. Genet. Sel. Evol. 36:163–190.
Kuhn, C., G. Freyer, R. Weikard, T. Goldammer, and M. Schwerin.1999. Detection of QTL for milk production traits in cattle byapplication of a specifically developed marker map of BTA6. Anim.Genet. 30:333–340.
Liu, Y., G. B. Jansen, and C. Y. Lin. 2002. The covariance betweenrelatives conditional on genetic markers. Genet. Sel. Evol.34:657–678.
Liu, Z., F. Reinhardt, A. Bunger, and R. Reents. 2004. Derivationand calculation of approximate reliabilities and daughter yielddeviations of a random regression test-day model for genetic eval-uation of dairy cattle. J. Dairy Sci. 87:1896–1907.
Liu, Z., F. Reinhardt, and R. Reents. 2001. Application of a randomregression model to genetic evaluations test-day yields and so-matic cell scores in dairy cattle. Interbull Bull. 27:159–166.
Lund, M. S., P. Sørensen, B. Guldbrandtsen, and D. A. Sorensen.2003. Multitrait fine mapping of quantitative trait loci using com-bined linkage disequilibria and linkage analysis. Genetics163:405–410.
Meuwissen, T. H. E., and M. E. Goddard. 2001. Prediction of identityby descent probabilities from marker-haplotypes. Genet. Sel.Evol. 33:605–634.
Meyer, K., and W. G. Hill. 1992. Approximation of sampling variancesand confidence intervals for maximum likelihood estimates ofvariance components. J. Anim. Breed. Genet. 109:264–280.
Misztal, I., and M. Perez-Enciso. 1998. FSPAK90 - A Fortran 90interface to sparse-matrix package FSPAK with dynamic memoryallocation and sparse matrix structure. Proc. 6th World Congr.Genet. Appl. Livest. Prod., Armidale, Australia XXVII:467–468.
Nadesalingam, J., Y. Plante, and J. P. Gibson. 2001. Detection ofQTL for milk production on chromosomes 1 and 6 of Holsteincattle. Mamm. Genome 12:27–31.
Olsen, H. G., L. Gomez-Raya, D. I. Vage, I. Olsaker, H. Klungland,M. Svendsen, T. Adnøy, A. Sabry, G. Klemetsdal, N. Schulman,W. Kramer, G. Thaller, K. Rønningen, and S. Lien. 2002. A ge-nome scan for quantitative trait loci affecting milk production inNorwegian Dairy Cattle. J. Dairy Sci. 85:3124–3130.
Patterson, H. D., and R. Thompson. 1971. Recovery of interblockinformation when block sizes are unequal. Biometrika 58:545–554.
Journal of Dairy Science Vol. 88, No. 1, 2005
Perez-Enciso, M., L. Varona, and M. F. Rothschild. 2000. Computa-tion of identity by descent probabilities conditional on DNA mark-ers via a Monte Carlo Markov Chain method. Genet. Sel. Evol.32:467–482.
Pong-Wong, R., A. W. George, J. A. Woolliams, and C. S. Haley. 2001.A simple and rapid method for calculating identity-by-descentmatrices using multiple markers. Genet. Sel. Evol. 33:453–471.
Reents, R., J. Jamrozik, L. R. Schaeffer, and J. C. M. Dekkers. 1995.Estimation of genetic parameters for test day records of somaticcell score. J. Dairy Sci. 78:2847–2857.
Rodriguez-Zas, S. L., B. R. Southey, D. W. Heyen, and H. A. Lewin.2002. Interval and composite interval mapping of somatic cellscore, yield, and components of milk in dairy cattle. J. Dairy Sci.85:2681–2691.
Ron, M., D. Klinger, E. Feldmesser, E. Seroussi, E. Ezra, and J. I.Weller. 2001. Multiple quantitative trait locus analysis of bovinechromosome 6 in the Israeli Holstein population by a daughterdesign. Genetics 159:727–735.
SAS Institute. 1999. SAS User’s Guide. Statistics, Version 8.2 ed.SAS Inst., Inc., Cary, NC.
Self, S. C., and K. Y. Liang. 1987. Asymptotic properties of maximumlikelihood estimators and likelihood ratio tests under non-stan-dard conditions. J. Am. Stat. Assoc. 82:605–610.
Sørensen, A. C., R. Pong-Wong, J. J. Windig, and J. A. Woolliams.2002. Precision of methods for calculating identity-by-descentmatrices using multiple markers. Genet. Sel. Evol. 34:557–579.
Spelman, R. J., W. Coppieters, L. Karim, J. A. van Arendonk, andH. Bovenhuis. 1996. Quantitative trait loci analysis for five milkproduction traits on chromosome six in the Dutch Holstein-Friesian population. Genetics 144:1799–1808.
Szyda, J., Z. Liu, R. Maschka, F. Reinhardt, and R. Reents. 2002.Computer system for routine QTL detection and genetic evalua-tion under a mixed inheritance model in dairy cattle. Proc. 7thWorld Congr. Genet. Appl. Livest. Prod., Montpellier, France,XXXIII:249–250.
Thomsen, H., N. Reinsch, N. Xu, C. Looft, S. Grupe, C. Kuhn, G.A. Brockmann, M. Schwerin, B. Leyhe-Horn, S. Hiendleder, G.Erhardt, I. Medjugorac, I. Russ, M. Forster, B. Brenig, F. Rein-hardt, R. Reents, J. Blumel, G. Averdunk, and E. Kalm. 2000. Amale bovine linkage map for the ADR granddaughter design. J.Anim. Breed. Genet. 117:289–360.
VanRaden, P. M., and G. R. Wiggans. 1991. Derivation, calculation,and use of national animal model information. J. Dairy Sci.74:2737–2746.
Velmala, R. J., H. J. Vilkki, K. T. Elo, D. J. de Koning, and A. V.Maki-Tanila. 1999. A search for quantitative trait loci for milkproduction traits on chromosome 6 in Finnish Ayrshire cattle.Anim. Genet. 30:136–143.
Viitala, S. M., N. F. Schulman, D. J. de Koning, K. Elo, R. Kinos, A.Virta, J. Virta, A. Maki-Tanila, and J. H. Vilkki. 2003. Quantita-tive trait loci affecting milk production traits in Finnish Ayrshiredairy cattle. J. Dairy Sci. 86:1828–1836.
Wang, T., R. H. Fernando, S. van der Beek, and J. A. M. van Arendonk.1995. Covariance between relatives for a marked quantitativetrait locus. Genet. Sel. Evol. 27:251–274.
Xu, S., and D. D. G. Gessler. 1998. Multipoint genetic mapping ofquantitative trait loci using a variable number of sibs per family.Genet. Res. 71:73–83.
Zhang, Q., D. Boichard, I. Hoeschele, C. Ernst, A. Eggen, B. Murkve,M. Pfister-Genskow, L. A. Witte, F. E. Grignola, P. Uimari, G.Thaller, and M. D. Bishop. 1998. Mapping quantitative trait locifor milk production and health of dairy cattle in a large outbredpedigree. Genetics 149:1959–1973.