estimation of international migration for vietnam, …
TRANSCRIPT

ESTIMATION OF INTERNATIONAL MIGRATION FOR VIETNAM, 1979-19891
M. Giovanna MerliCenter for Studies in Demography and Ecology
Department of SociologyUniversity of Washington
Tel. (206) 543-2072email: [email protected]
March, 11 1997

2
ESTIMATION OF INTERNATIONAL MIGRATION FOR VIETNAM, 1979-1989
This paper details the various steps adopted in the estimation of international emigration from
Vietnam by sex and age between the dates of the first two modern censuses conducted in 1979
and 1989. The measurement of Vietnamese emigration is based on existing intercensal
projection methods. The procedure is applied to Vietnamese census data to obtain preliminary
estimates of Vietnamese intercensal emigration. A separate estimate of intercensal
emigration is derived from a combination of data on the Vietnam-born population in the
censuses of the United States, Canada, and Australia, three major receiver countries of
Vietnamese emigration, and of data on refugee movements collected by the United Nations
High Commissioner for Refugees. The paper evaluates the two sets of estimates and
discusses the relative appropriateness of the data sources for the estimation of intercensal
emigration.
Since the end of the Vietnam war and the reunification of North and South Vietnam in April
1975, Vietnam experienced massive streams of outmigration. The political and economic
situation of Vietnam after 1975 drove those closely associated with the US or the South
Vietnamese government, Catholics, ethnic Chinese from both north and south Vietnam, and
other groups to flee the country. According to statistics collected by the United Nations High
Commissioner for Refugees (UNHCR), since the fall of the Saigon regime in April 1975, about

3
1.4 million people have left Vietnam.2 Of these, 60 percent have left illegally by boat to
whichever Southeast Asian country they would reach first,3 or overland through Cambodia to
Thailand.4 The remaining 40 percent have departed directly from Vietnam to resettlement
countries after applying to an UNHCR-sponsored program, known as the Orderly Departure
Program (ODP), and subscribed by several Western countries. 94 percent of those who left
Vietnam have eventually resettled in Western countries (UNHCR, 1995b).
Recently, official data on the Vietnamese population have become available through the
1979 and 1989 censuses (Vietnam General Statistical Office, 1983; Vietnam Central Census
Steering Committee, 1994). In the absence of a continuous registration system of vital events,
the usefulness of two successive census age distributions for demographic analysis is well
known, because the difference between counts of the same cohort at two different points in time,
in a closed population, is the result of mortality (United Nations, 1983). Yet, it is often
impossible to arrive to full consistency between census enumerations at two points in time only
by accounting for intercensal deaths. One major obstacle to this effort is successive census
enumerations that may be differentially complete. The second is the lack of information on
intercensal net migration on a sex and age specific basis. Data on international migration in
Vietnam are a particularly weak link in this process. UNHCR counts of refugee movements are
so far the only data that allow to gauge levels of Vietnamese emigration. But, because they only
reflect the volume of emigration from Vietnam, and do not provide any information on the age-
sex structure of emigrants, they are of limited demographic value.
This paper attempts to fill this gap, by producing estimates of Vietnam’s international

4
migration by age and sex between October 1, 1979 and April 1, 1989, the two census dates.
These estimates are derived using the residual method for estimating net migration from two
census age distributions, a procedure that involves allocating population changes not accounted
for by fertility and mortality to migration. It is first applied to data from Vietnam’s 1979 and
1989 censuses to obtain preliminary estimates of intercensal net migration. The method
requires that all errors and discrepancies be accounted for prior to defining the residual as net
migration. Differential census enumeration completeness, incomplete registration of births and
deaths, or ambiguities as to whether successive census counts include the military population
would enter directly in the estimation of net migration if no prior adjustment is made. In this
case, net migration may be confounded with the net balance of errors. The two Vietnamese
censuses were taken at the beginning and at the end of the 1980s, a period characterized by
population redistribution policies and a highly mobile population. Under these circumstances, it
may have been difficult to accurately enumerate persons away from their usual place of
residence. To reduce the risk of bias from these sources, the paper proposes another approach to
the measurement of Vietnamese intercensal emigration, one that uses a combination of
independent data sources. Vietnamese emigration can be estimated by referring to information
on Vietnamese immigration to the United States (US), Canada, and Australia, three major
receiver countries of Vietnamese refugees. Estimates of Vietnamese immigration to countries of
destination are obtained by applying the residual method to Vietnam-born persons enumerated in
pairs of successive censuses of the countries of resettlement. These results are combined with
UNHCR counts on Vietnamese refugee movements to yield estimates of intercensal emigration

5
during the period between Vietnam’s two censuses. The principal objective is the choice of a
best estimate that can be used to adjust one or the other census age distribution for the effects of
net international migration during Vietnam’s intercensal period.
PREVIOUS ESTIMATES OF VIETNAMESE EMIGRATION
Emigration from Vietnam to Countries of Resettlement of Vietnamese Refugees
In the late 1970s, UNHCR established a continuous recording system of monthly and annual
counts of arrivals of Vietnamese refugees to camps in “first asylum” countries, resettlement
departures to countries of final destination, and counts of departures directly from Vietnam
through the ODP.
Figure 1 displays annual movements of refugees, by type of movement, and departure, for
the period between 1975 and 1995.
[Figure 1 about here]
It is apparent from this figure that the outflow of refugees was marked by dramatic fluctuations.
In mid-1976, the number of Vietnamese leaving by boat consisted of a few hundreds per month,
but it increased soon thereafter, from about 23,000 in 1976-77 to 30,200 in 1978. By the end of
1978, there were about 67,000 boat people registered in Southeast Asian refugee camps.
Thereafter, the number of arrivals climbed to a peak, with more than 200,000 in 1979. This

6
translated to about 150,000 Vietnamese refugee in camps at the end of 1979, as monthly arrivals
were not countered by a comparable number of resettlement departures.5 The pressure of
growing numbers of arrivals to first asylum countries was so strong that some Southeast Asian
countries had started to turn away a large number of boats.
After a Conference on Refugees was organized in Geneva in July 1979, Western nations’
resettlement pledges resulted in large numbers of departures from the camps in the second half
of 1979 and 1980. During this period, almost 300,000 boat people departed first asylum
countries for their final destinations, with 55,000 persons still awaiting resettlement at the end of
1980, a massive reduction from the large numbers in camps prior to the Geneva conference.
Arrivals to first asylum countries leveled off to more moderate levels upon the
establishment of the ODP program, in June 1979, but they rose again from 21,500 in 1986 to
74,000 in 1989, possibly the effect of a temporary suspension of the ODP in 1986-87. In 1989,
the establishment of a screening process, set up to distinguish true refugees from economic
migrants, slowed down the number of arrivals, but also the number of resettlement departures.
After 1988, the total camp population increased again, as the majority of new arrivals were
regarded by third countries as economic migrants and denied the right to resettle there.
Figure 1 also shows that, while refugees leaving under the auspices of the ODP
represented a very small proportion of all Vietnamese refugees until about 1982, for the first time
in 1984, they outnumbered boat and land people. However, only upon definition of the new
refugee acceptance criteria in 1989 did the program come to represent the major channel of
departure from Vietnam.

7
Of Vietnamese refugees who resettled to Western countries between 1975 and 1995, 64 percent
were accepted by the US, 12 percent went to Australia and 12 percent to Canada. Among
European countries, France received the largest number, although this number only represents 3
percent of total resettlements (See Table 1).
[Table 1 about here]
Although UNHCR statistics allow to quantify the volume of Vietnamese emigration, they
are of limited demographic value, as they do not record the demographic characteristics of the
refugee population. Owing to the absence of information on the age-sex structure of the migrant
population, these counts cannot be used to adjust one or the other census age distribution for the
effects of net migration, and as such are inadequate for analytical purposes.
Emigration from Vietnam to Cambodia
One substantial portion of Vietnamese emigration during Vietnam’s intercensal period consisted
of a large number of Vietnamese settlers who crossed the land border to Cambodia following
Vietnam’s invasion on Christmas day 1978. Yet, while UNHCR statistics allow to make some
headway towards quantification of the exodus of refugees from Vietnam, the absence of data on
Vietnamese emigration to Cambodia during the decade of Vietnamese occupation from
Christmas day 1978 to September 1989 is problematic. Uncertainty surrounds both the
magnitude and the timing of the flows.

8
Ea (1990:10) gives the total number of Vietnamese in Cambodia in 1980 between
300,000 and 500,000. Kiernan (cited in Banister and Johnson, 1993:97) estimates a national
total Vietnamese population of approximately 350,000. Banister and Johnson choose a figure of
500,000 Vietnamese settlers because it is in the range of 300,000-700,000 of most estimates of
less interested observers. The figure of 500,000 was also admitted by Phnom Penh officials to
the Economist Intelligence Unit (Banister and Johnson, 1993:97). Nguyen-vo (1992:146) reports
that upon withdrawal of Vietnamese troops in September 1989, there were about 400,000-
450,000 Vietnamese settlers in Cambodia.
One component of Vietnamese migration to Cambodia was return migration of
Vietnamese citizens of Cambodia who fled the country between 1970 and 1978, expelled by the
Lon Nol government (Ea, 1987: p. 7), the other was new migration of Vietnamese settlers who
established themselves as shop owners, vendors, farmers, or fishermen. This second component
is estimated at about 400,000 (Heuveline, 1996:31). While the 200,000 Vietnamese troops were
gradually withdrawn between 1986 and the end of 1989, it is thought that the an imprecise
number of Vietnamese settlers have remained behind (Banister and Johnson, 1993).
Even if we believed Banister and Johnson’s preferred estimate of 500,000 Vietnamese
arrivals in Cambodia between the end of 1978 and 1989, of which 200,000-300,000 emigrated
before the end of 1979 (Ea, 1981:222) and may have not been counted in the 1979 census, we
would still be left with 200,000-300,000 people emigrating to Cambodia in the intercensal
decade --- and who may have been enumerated in the 1979 census, but not in the 1989 census ---
about whom we know nothing. Some may have eventually reached Thai refugee camps, and may

9
therefore be included in UNHCR counts of Vietnamese land refugee arrivals to UNHCR camps.
According to reports by Vietnamese refugees, crossing the border from Vietnam to Cambodia
was not a difficult undertaking, and once in Cambodia, Vietnamese newcomers could easily
obtain the necessary papers to Thailand upon payment of small bribes (Nguyen-vo, 1992:147).
Ea (1981:222) speculates that the majority of the 200,000-300,000 civilians who settled in
Cambodia by the end of 1979 may have indeed crossed the border over to Thailand. Yet, the
cumulative number of Vietnamese land arrivals in Thai camps between 1976 and 1995 only
amounts to about 43,000 (UNHCR, 1995b), a figure by far below Ea’s estimate of 200,000-
300,000 Vietnamese settlers in Cambodia by the end of 1979. Confirmation of the small number
of Vietnamese land people in Thai refugee camps can also be found in several studies on
Vietnamese refugees (Viviani, 1984; Hitchcox, 1990). This suggests that most Vietnamese who
settled in Cambodia did actually stay there.
To unravel the puzzle of Vietnamese emigration to Cambodia, consideration was also
given to the possibility that Vietnamese settlers may have been enumerated in the 1989 Vietnam
census. The “Special Enumeration Groups,” a category enumerated separately in the 1989
census by the Ministries of Internal Affairs, Foreign Affairs, and National Defense (Banister,
1993:73-78), is believed to include Vietnamese cadres, technicians, experts and advisers in
Cambodia who filled the spaces left empty by the massacres under Pol Pot and the exodus
triggered by the Vietnamese invasion (Banister and Johnson, 1993:77). As to the question of
whether settlers were enumerated therein, the age and sex composition of the 1.04 million people
in these special groups is disproportionately biased towards males ages 15-64, with a total ratio

10
of six males to one female, and only a few tokens of children. This leads one to discard this
hypothesis, because a large portion of Vietnamese emigration to Cambodia may have consisted
of entire family nuclei (Ea, 1981:222).
Confirmation of the failure of the 1989 census to enumerate Vietnamese settlers to
Cambodia is also found in census reports. Acknowledging the absence of information on
international migration in Vietnam 1989 census, the 1989 Census Steering Committee refers to
international migrants as “…. the net movement of persons in the intercensal period who had left
to seek residence in other countries, or who had moved into neighboring countries to farm or for
some other purposes [emphasis mine]” (Vietnam Central Census Steering Committee, 1990:40).
It is likely that this group refers to the Vietnamese settlers in Cambodia, who were counted in
the 1979 census but not in the 1989 census.
ESTIMATING VIETNAMESE EMIGRATION DURING THE 1979-1989
INTERCENSAL PERIOD
Measuring Vietnamese Emigration from Vietnam’s 1979 and 1989 Census Data
Estimates of international migration can be obtained by the application of the life table forward
and reverse survival methods to a pair of successive censuses (United Nations, 1970:26-27;
Shryock and Siegel, 1976:359-360). With this method, estimates of net migration by age groups
can be calculated allowing for the components of population change, according to the formula:

11
Ia - Ea = (P(1)a - sP(0)a-t),
where Ia - Ea represent the difference between immigrants and emigrants, a is age at the end of
the period, P(1)a , the population at this age in the second census, P(0)a-t the population t years
younger at the first census, and s the intercensal survival rate for this age group. This formula
covers all age cohorts except those born in the intercensal period. For cohorts born in the
intercensal period, the equivalent formula is:
Ia - Ea = (P(1)a - sB),
where B represents intercensal births (Shryock and Siegel, 1976:357).
The application of the life table forward and backward survival procedures to Vietnam’s
two successive census enumerations yields an estimate of intercensal net migration. With the
forward survival method, Vietnamese net migration M of persons in the cohort aged x to x+n at
time t is equal to:
nMx = nPx+a (t+a) - [ nPx(t) x (nLx+a/nLx )]
And, by reverse survival procedure, it is equal to:

12
nMx = [ nPx+a(t+a) / (nLx+a/nLx)] - nPx(t)
where
nMx = net Vietnamese migration over a years to the cohort aged x to x+n in first census
and aged x+a to x+a+n at second census
a = length of the intercensal period in years
x = age
n = cohort width
t = date of first census
t+a = date of second census
nPx = Enumerated population in cohort aged x to x+n in first census
nPx+a = Enumerated population in cohort aged x+a to x+a+n in second census
nLx+a/nLx = a year survival ratios, that is the ratios of the size of the cohort aged x+a to
x+a+n to the size of the cohort aged x to x+n in the stationary population of the intercensal life
table.
The former procedure consists of applying life table survival ratios to the population
enumerated in the first census to obtain an expected number of survivors in the following census.
Subtraction of the survivors of the first census from the population enumerated in the second
census yields an estimate of net migration M, or the number of Vietnamese who emigrated in the
intercensal period and survived to the end of the period, and is equivalent to the assumption that

13
all migration occurs just before the second census. This estimate overstates the population
exposed to the risk of death during the intercensal period and is deficient as a count of emigrants
by the number of deaths to the migrant cohorts during the intercensal period.
With the reverse survival procedure, application of reverse survival ratios to “young” the
population enumerated in the second census, and subtraction of the population at the first census
yields another estimate of net migration MΝ. This estimate combines the number of Vietnamese
persons who emigrated during the intercensal period and survived to the end of the period and
those who died during the period, and is equivalent to the assumption that emigration occurred
just after the first census (United Nations, 1970:26).
The average of the two estimates, MΟ , implies a more meaningful assumption regarding
the timing of emigration than that implicit in either forward or reverse survival procedures. This
average will include migrant deaths with the implicit assumption that deaths and migration are
evenly distributed over the intercensal period or that all migration occurs in the middle of the
period (United Nations, 1970:26).
To allow for the effect of mortality of migrants dying during the intercensal period, life
table survival ratios nLx+a/nLx are derived from Vietnam’s 1989 male and female life tables
reported by Vietnam’s General Statistical Office (1991:116).6 Because the interval between the
dates of the two censuses, October 1, 1979 and April 1, 1989 is equivalent to 9.5-year, while only
an abridged life table is available for 1989 in conventional 5-year age groups, the following steps
are adopted to compute 9.5-year survival ratios: (1) Coefficients based on the Sprague formula
(Shryock and Siegel, 1976:555) are used to interpolate the series of 5Lx’s by single year of age;

14
(2) a series of 1Lx+0.5 is constructed by taking the average of 1Lx and 1Lx+1 on the assumption
that mortality increases linearly within each pair of consecutive single years of age; (3) 9.5-year
survival ratios are calculated by regrouping the values of 1Lx+0.5 thus obtained in 5-year age
groups. To make 1989 population counts comparable with 9.5-year survival rates, the last two
steps are also applied to the 1989 census age distribution available in single year of age (Vietnam
Central Census Steering Committee, 1994).
The estimation of deaths for the age cohorts born in the 9.5-year intercensal period
requires special treatment since these groups are exposed to the risk of death in Vietnam for less
than 9.5 years. Survival rates for the population under 5 and 5-97 during the intercensal period
are computed respectively as [5θ(5L0/5*l 0)]1.25, or the probability of survival for 1.25 years for
children aged 0-4 at the 1989 census and emigrated in the intercensal decade,8 and [θ(l10/l5)], or
the probability of survival for 2.5 years for children emigrated in the intercensal decade and aged
5-9 at the 1989 census.. The forward and reverse survival procedures are then applied in the
same fashion as for the older age groups, with intercensal births providing the initial population
for the first two age groups.9
The main problem with intercensal survival procedures to estimate migration, is that
migration is estimated as a residual after all other components of change have been removed. If
the sources of error in the data are not known, and no prior adjustment is made, all errors and
discrepancies in the data enter directly into the determination of the residual, and any changes
due to errors are interpreted as net migration. According to the authors of the 1989 census report,
underenumeration in the 1989 census among males aged 15-24 is great, but its extent is not

15
known (Vietnam General Statistical Office, 1991:19). Table 2 shows estimates obtained from
the intercensal projection method for males and females (detailed calculations of these
procedures are presented in Appendix Table A1 and A2).
[Table 2 about here]
If these estimates truly represented the volume of net migration, there would have been
about 1,240,000 male emigrants between ages 15 and 29, and about 440,000 female emigrants
between ages 15 and 24, who left Vietnam between October 1, 1979 and April 1, 1989. To these,
one should add the relatively smaller numbers of exits estimated for younger and older age
groups for a grand total of 1,947,000 male emigrants and 821,000 female emigrants and
2,768,000 emigrants for the two sexes combined. These estimates are almost certainly too high
for the period under consideration and are 1,000,000 people higher than the total count of
1,790,000 refugees reported by UNHCR for the longer period from 1975 to 1995 (see footnote
2). The suspicion is that they are a mixture of net migration and the net balance of errors in the
basic data due to differential census coverage. The estimates also imply some net immigration,
as shown by the number of entries concentrated especially among middle aged females, and to a
smaller extent among middle aged males. References to return migration during the period
between the two censuses cannot be found anywhere, while repatriation of refugees by UNHCR
began only after June 1989, following the 1989 census. Differential enumeration between
censuses and misreporting of age provide a more likely explanation for these results as

16
undercounts selective of persons in certain age groups in 1979, especially of middle-aged persons
(Banister 1993), would result in fewer survivors projected from 1979 to the date of the second
census and a larger, possibly positive, residual when the projected population is subtracted from
the population enumerated in 1989. Similarly, age overstatement among males in 1979, because
men older than 60 received higher benefits and were exempt from social work (Vietnam General
Statistical Office, 1991:20), would result in evacuated age categories below age 60, hence in
fewer survivors at these ages projected to the date of the second census and larger residuals.
Positive residuals would also be produced from age overstatement among females in 1989,
because in rural areas women aged 45 and above were exempt from public service (Vietnam
General Statistical Office, 1991:18-19). A transfer of people from ages below 45 to older age
groups would inflate the numbers enumerated in 1989 at these ages relative to the number of
survivors projected from 1979. Unfortunately, the absence of more detailed information on
sources of errors in the data does not allow one to evaluate what proportion of “emigrants”
estimated from Vietnam’s two census age distributions should be allocated to actual emigration
and what proportion to differential census enumeration completeness.
Measuring Vietnamese Emigration from Immigration Data in the Censuses of the United
States, Canada and Australia
The censuses of the US, Canada and Australia, with their questions on place of birth, are unique
sources of consistent, up-to-date information on the immigrant stocks. In fact, the number of
Vietnamese-born persons enumerated in a census can be used to estimate immigration, because

17
persons born in a different place from that in which they are enumerated are clearly migrants
since they must have moved from elsewhere, presumably their place of birth, to the place of
enumeration at some time (Zlotnik, 1987:936).10
The input data for the estimation of Vietnamese immigration is provided by the censuses
conducted at dates that are closest to the two Vietnamese censuses of October 1, 1979 and April
1, 1989: for the US, the censuses of April 1, 1980 and April 1, 1990, for Canada the censuses of
June 3, 1981 and June 4, 1991 and for Australia, the censuses of June 30, 1981 and June 30 1991
(See Figure 2). In all three countries of resettlement, censuses taken prior to the 1980s do not
enumerate Vietnamese-born persons as a separate category, and are therefore inadequate for
providing information on Vietnamese emigration prior to 1980 (Barringer et al.,1993:37;
Australia Bureau of Immigration and Population Research, 1994).
[Figure 2 about here]
The forward and backward projection procedures applied earlier to Vietnam’s census
counts to estimate emigration can be similarly applied to the Vietnam-born population
enumerated in the censuses of the United States, Canada and Australia to obtain an estimate of
Vietnamese intercensal immigration to these countries.11
To allow for the effect of mortality of migrants dying during the intercensal period in the
country of resettlement, life table survival ratios nLx+a/ nLx are derived from the intercensal life
tables of the resettlement countries: for the US the 1985 life tables (National Center for Health

18
Statistics, 1988), for Canada and Australia, the 1985 life tables (Keyfitz and Flieger, 1990).
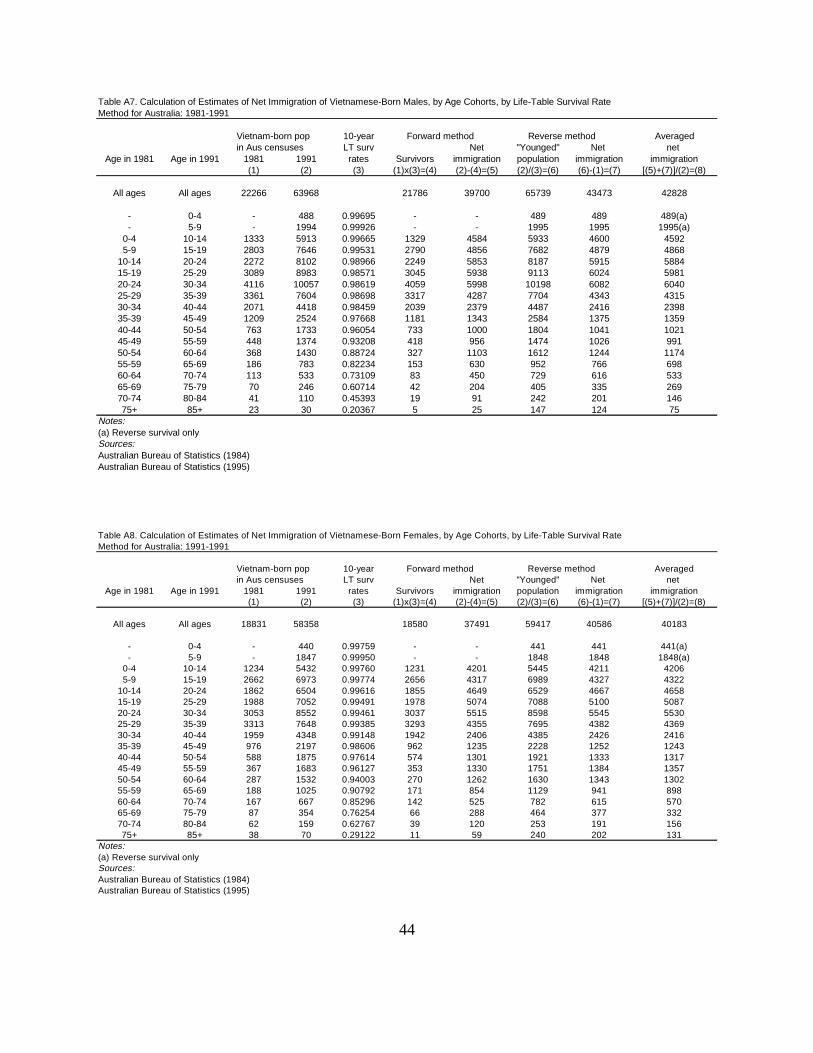
Appendix Tables A3-A8 show the detailed calculations for males and females by country
of resettlement. A total of 333,898 Vietnamese (177,459 males and 156,439 females)
immigrated to the US between the 1980 and 1990 censuses, 73,721 (36,961 males and 36,760
females) immigrated to Canada during the 1981-1991 intercensal period, and 83,011 (42,828
males and 40,183 females) immigrated to Australia in the 1981-1991 period.
The age and sex structure of Vietnam-born persons who immigrated to the US, Canada,
and Australia during the intercensal periods is shown in Table 3. It can be seen that Vietnamese
immigrants are quite young, with the majority aged between 15 and 40, and little differences
across country of resettlement. This is not surprising, since migration is usually heavily
concentrated among younger age groups (Gordon, 1989). But contrary to expectations, the sex
composition of Vietnamese-born enumerated in the 1990, and 1991 censuses of the US, Canada
and Australia is fairly balanced. Only in the United States and Australia, is the excess of males
over females more pronounced, especially between ages 15 and 34, while in Canada the sex ratio
is balanced at almost all ages, with females exceeding males above age 30.
[Table 3 about here]
Some Difficulties of Measurement of Vietnamese Emigration from Data on Immigration to
Countries of Resettlement
Estimation of Vietnamese emigration during the 1979-1989 intercensal period obtained solely
from the estimated numbers of immigrants to resettlement countries requires several ad hoc

19
procedures to make adjustments for the number of emigrants who are missed due to time lags
between the dates of the Vietnamese censuses and the dates of the censuses of the countries of
resettlement, and to unmeasured time lags between the date of departure from Vietnam and the
date of resettlement to third countries. In particular, the estimation of Vietnamese immigration to
the US in the 1980-1990 period, and to Australia and Canada in the 1981-1991 period implies an
exclusion of those who departed Vietnam between October 1, 1979, the date of the first Vietnam
census, and April 1 1980, June 3, 1981, and June 30, 1981, the dates of the US, Canadian and
Australian censuses (See Figure 2 above).
Moreover, the number of Vietnamese arrivals to the US is not an accurate representation
of the number of departures from Vietnam during the same period. While ODP applicants
typically left Vietnam directly to one of the countries participating in the program, this is not so
for boat and land people, who spent an unknown number of months in refugee camps in "first
asylum" countries, before being accepted for resettlement in third countries. While resettlement
may have been relatively fast for selected groups claiming family reunification or employment
ties to the US (Hitchcox, 1990:125), it may have been very slow for other less connected groups.
It is not uncommon among refugees in Southeast Asian camps to have spent more than two
years in first asylum countries awaiting resettlement (Hitchcox, 1990:263). Unmeasured time
lags between the time refugees departed Vietnam and the time they reached resettlement
countries complicate the estimation of Vietnam intercensal emigration in the following ways:
a) Vietnamese emigrants who left Vietnam before October 1, 1979, the date of the first
Vietnam census, but reached the US after April 1, 1980, the date of the US census will contribute

20
to the estimated Vietnamese immigration to the US in the 1980 and 1990 intercensal period, but
will have to be subtracted out because they were not enumerated in the 1979 census of Vietnam.
b) Vietnamese emigrants who left Vietnam after October 1, 1979, and reached the US
before April 1, 1980, will not be included in the estimate of new Vietnamese immigration to the
US in the 1980-1990 intercensal period because they were already enumerated in the US 1980
census. In the estimate of the volume of emigration from Vietnam, they will have to be added to
the volume of Vietnamese immigration to the US in the 1980-1990 period.
c) Vietnamese emigrants who left Vietnam before April 1989, the date of the second
Vietnamese census, but entered the US after April 1, 1990 will not be enumerated in the US 1990
census, and therefore will not contribute to the estimate of Vietnamese immigration to the US
between the two censuses of 1980 and 1990. However, because they left Vietnam before the
1989 census, they must be included in the reconstruction of Vietnam’s intercensal emigration.
d) Vietnamese emigrants who left Vietnam after April 1989 but entered the US before the
1990 census will be included in the estimate of net intercensal immigration but will have to be
subtracted out because they were in Vietnam at the time of the 1989 census.
Similar problems are presented by the estimation of intercensal Vietnamese immigration
to Canada, and Australia, only with different time lags between the dates of their respective
censuses and the dates of the Vietnamese censuses.
Figures 3 and 4 display monthly boat people movements over the periods encompassing
the 1979 and 1989 Vietnam censuses.12 These figures offer some indication of the sizes of
groups a) through d), and of the potential impact of refugee movements on the estimation of

21
Vietnam’s intercensal emigration.
From Figure 3, peak illegal emigration from Vietnam, at best represented by the number
of boat people arriving in Southeast Asian camps, preceded the date of the 1979 census, the case
of the group in (a). However, by the time of the 1980 US census, a large number of refugees
were still in camps, as the flow of arrivals to first asylum countries in 1979 was far too massive
for Western countries to be able to absorb it at a fast pace. This suggests that a substantial
fraction of those who resettled to the US after April 1980, may have left Vietnam before October
1, 1979. On the other hand, due to the slow pace of resettlement, the number of boat people who
left Vietnam after October 1, 1979, but reached the US before April 1980 in (b), is probably
comparatively small.
[Figure 3 about here]
In the late 1980s, the number of boat people arrivals to first asylum countries and
resettlement departures to third countries was far smaller than the corresponding numbers in the
late 1970-early 1980s, as the majority of those who left Vietnam during this period were ODP
applicants. Moreover, the probability of boat people being resettled in a third country was
relatively low, as Vietnamese arriving to refugee camps in Southeast Asian countries and Hong
Kong were likely to be classified as economic migrants and be denied resettlement.
[Figure 4 about here]

22
Figure 4 suggests that upon the establishment of the screening process in June 1989, the
number of residents in the camps increased and stabilized around 110,000. Some of these may
have left Vietnam prior to the 1989 census, but, may have been denied resettlement in third
countries. For all we know, they may be among the 77,000 returnees to Vietnam, or the 38,000
still in camps in March 1996 (New York Times, 1996). This indicates that the numbers of
refugees who left Vietnam before the 1989 census but resettled to the US after the US 1990
census in (c), and of those who left after the 1989 census but reached the US before April 1, 1990
in (d), may be indeed small. However, the difficulty to account for those who departed Vietnam
prior to April 1989 but never made it to the US may jeopardize the accuracy of estimation of
Vietnam’s intercensal emigration.
Given the problems of measurement of Vietnamese emigration solely from information
on immigration from pairs of census enumerations of the Vietnam-born population in the US,
Canada and Australia, an alternative approach to estimating Vietnam’s intercensal emigration is
proposed, one that combines data on the Vietnam-born population enumerated in the censuses of
resettlement countries and UNHCR data on refugee movements.
A Comparison between Data on Vietnamese Immigration in the Censuses of the Countries of
Resettlement and UNHCR Data on Resettlement Departures
To assess comparability between resettlement departures from UNHCR records on refugee
movements and immigrant entries to the US, Canada and Australia from the censuses of these

23
countries, Table 4 compares the stocks of Vietnam-born persons who immigrated to the US,
Canada and Australia estimated from the survival rate procedure based on census counts at
destination, with the number of Vietnamese resettlements to these three countries recorded by
UNHCR for the same years.
[Table 4 about here]
The difference is greatest for the United States, with the number of resettlements recorded
by UNHCR exceeding the number estimated from US census data by 17 percent for the period
between April 1 1980, and April 1, 1990. Australia, exhibits a difference of 7 percent for the
1981-1991 period, while the counts are closest for Canada, with only a 2 percent difference for
the same period.
How can the discrepancy for the US be explained? Although census data on immigration
are comprehensive with respect to all foreign-born persons in the US at the time of the census
regardless of their legal status, and include aliens and citizens, persons having permanent
residence status, and refugees (Warren and Passel, 1987:382), there are several reasons why US
censuses may underenumerate Vietnam-born persons. These include a tendency for those born
abroad to report themselves as natives or, for Vietnamese-born of Chinese descent, to report
themselves as Chinese-born, differential coverage between censuses, with better coverage of
Vietnam-born persons in the 1980 census relative to the 1990 census, and differences between
the census sample, on which data on the foreign-born population are based, and the 100 percent

24
tabulations. Similarly, UNHCR data on resettlement departures may be in turn inflated by an
unknown proportion of double counts. Refugees accepted for resettlement in the US were likely
to spend about 20 weeks in Refugee Processing Centers (RPCs) in Indonesia and the Philippines,
where they received language classes, cultural orientation and pre-employment training
(Hitchcox, 1990:130-131). This resettlement process may have produced some double counting
as some refugees were counted for the first time as resettlement departures when they left “first
asylum” camps for the RPCs, only to be counted again once they departed the RPCs for the US.
In recent years, UNHCR has devoted efforts to correct annual totals for double counting errors,
with the results that recently published series are more accurate than earlier ones (personal
communication with Ertan Corlulu, Resettlement Statistics, UNHCR, Geneva, 21 December
1995). To minimize the impact of double counting errors on the total counts of resettlement
departures between 1980 and 1990, only the most recent series were used here. Moreover,
despite the discrepancy between UNHCR counts and census counts, it is noteworthy that
UNHCR counts of resettlement departures compare well with the total number of refugee arrivals
to the US reported in Barringer et al. (1993:34) for the full 1980-1990 period (457,152
resettlement departures according to UNHCR data are only 5 percent less than 482,000 reported
in Barringer et al.). These counts represent the total number of physical arrivals of Vietnamese
refugees to the US, including both non-immigrant and immigrant arrivals, and were estimated by
these authors from unpublished records provided by the State Department, the Immigration and
Naturalization Office, the Office of Refugee Resettlement, and its predecessor, the Indochina
Refugee Program.

25
Measuring Vietnamese Emigration from UNHCR Data on Refugee Movements, 1979-1989
Because UNHCR counts show a fair degree of consistency with the number of immigrants to the
three major countries of resettlement estimated by the survival rate procedure, and, for the US,
with those recorded by the independent data sources reported in Barringer et al. (1993), UNHCR
data are regarded as a reliable source of information on the volume of emigration during
Vietnam’s intercensal period. In particular, the counts of boat and land arrivals to refugee camps
in first asylum countries and direct ODP departures to countries of resettlement can be taken to
reflect the number of departures from Vietnam minus an unknown proportion lost at sea.
Estimating the volume of Vietnamese emigration from UNHCR data on arrivals to
refugee camps and ODP departures presents several advantages over the estimation of
Vietnamese emigration from information from two successive census enumeration of Vietnam-
born persons in the US, Canada and Australia. First, it does not require any adjustment for
different time lags between the date of the Vietnam censuses and the dates of the censuses of the
three countries of resettlement, or for unmeasured time lags between the date of departure from
Vietnam and the date of resettlement in the countries of final destination. Second, the date of
departure from Vietnam coincides with the date of arrivals to first asylum camps, as the journey
time by boat generally required only three to four days (Viviani, 1984; Hitchcox, 1990). Third,
UNHCR data on arrivals to first asylum camps and ODP departures to resettlement countries
enumerate all refugees regardless of their final destination, and include refugees who left

26
Vietnam after the 1979 census and who, by the time of Vietnam 1989 census, were still awaiting
resettlement in Southeast Asian camps.
From Table 5, a total of 559,736 refugees arrived to camps in “first asylum” countries or
departed from Vietnam under the auspices of the ODP between October 10, 1979 and April 1,
1989. This figure best reflects the volume of emigration from Vietnam in the 1979-1989
intercensal period, with the only exclusion of Vietnamese settlers in Cambodia.
[Table 5 about here]
In order to estimate the number of Vietnamese emigrants during the intercensal period
who survived to the end of the period and who would have been counted in the 1989 census had
they not departed Vietnam, the volume of the survivors of departures from Vietnam during
Vietnam’s intercensal period, ought to be diminished by the proportion who died during this
period while in refugee camps or in countries of resettlement.
As shown in footnote 11 of this paper, M/MΟ is the ratio of the total number of
Vietnamese-born persons immigrating to the country of resettlement during that country=s
intercensal period and surviving to the end of the period to the combined number of Vietnamese-
born enumerated in the censuses of the country of resettlement who entered during the
intercensal period and survived to the end of the period and of those who died during the period.
This ratio is equivalent to the survival probability of Vietnamese immigrants who entered the
US, Canada and Australia during the intercensal period to the time of the census (1990 or 1991).

27
Its complement, 1 - M/MΟ , represents the probability of dying during the period, and was
calculated for the US 1980-1990 intercensal period and for Canada and Australia 1981-1991
periods for each sex. The left column of Table 6 shows the probability of dying for the US 1980-
1990 period. The right column shows the average of the probability of dying of Vietnamese
immigrants to Canada and Australia for the 1981-1991 intercensal period.
[Table 6 about here]
Because the results obtained for the three countries of resettlement are very similar, the
ratio M/MΟ for the US is employed to derive a single adjustment factor, on the assumption that
the mortality experience of Vietnamese immigrants to the US is similar to that of their
counterparts in Canada and Australia. A factor equal to 0.985243 is finally derived by taking the
weighted average of the US male and female survival probabilities M/MΟ raised to the 0.95th
power to reflect 9.5-year survival for the length of Vietnam’s intercensal period. This single
factor is applied to the grand total of 559,736 arrivals to refugee camps and ODP departures from
Table 4, to obtain the total number of emigrants who left Vietnam during the intercensal period
and survived to the end of the period. Thus, of the 559,736 persons who departed Vietnam
between October 1, 1979 and April 1, 1989, 8,260 are estimated to have died and 551,476
survived. This yields an average annual death rate of 1.55 per 1,000. Such a low rate is not
surprising, since the age structure of emigrants is quite young and death is a rare event at young
adult ages. This rate is also consistent with an average annual death rate of 1.59 per 1,000 for the

28
1980-1989 period in refugee camps, computed from UNHCR vital records published for refugee
camps in Thailand (UNHCR, 1991).
In order to adjust one of the two Vietnamese census age distributions for the effects of net
migration, it does not suffice to know the volume of emigration. Knowledge of its age-specific
intensity is also essential. For the sake of computation efficiency, a single schedule is employed
to apportion the 551,476 persons surviving to the end of Vietnam’s intercensal period to different
ages. Because about 60 percent of Vietnamese refugees resettled in the US, and their age
distribution is quite similar to the age distribution of their counterparts who emigrated to Canada
and Australia, survivors are distributed according to the age and sex structure of Vietnamese-
born enumerated in the 1990 census who immigrated to the US between 1980 and 1990, on the
assumption that those who reached the US have the same age distribution of those who arrived to
refugee camps. The estimate of the size and demographic structure of emigration from Vietnam
between the 1979 and 1989 is shown in Table 7.
[Table 7 about here]
Not surprisingly, these estimates reflect much lower levels of intercensal emigration than
those derived from Vietnamese census data in Table 2, because they only incorporate the actual
counts of refugees who left Vietnam after the 1979 census and were not there to be enumerated
in the 1989 census, and are free from errors due to differential census enumeration completeness,
and age misstatement.

29
CONCLUSIONS
The aftermath of the Vietnam war and the reunification of North and South Vietnam in 1975
opened the population of Vietnam to massive streams of outmigration. The exodus of
Vietnamese refugees started prior and immediately after the establishment of North Vietnamese
control on Saigon in April 1975 and continued well into the 1990s. About 90 percent of
Vietnamese refugees have resettled in the United States, Canada and Australia. Migratory flows
to Cambodia during the decade of Vietnamese occupation 1979-1989 are also part of the story of
Vietnamese emigration, although the cause of departure was of a different nature, since
Vietnamese settlements in Cambodia were encouraged by the Vietnamese government whose
objective was to reduce the overpopulation of the Red River delta in North Vietnam and
redistribute people displaced in the South during the war (Ea, 1981:222).
The two modern censuses of Vietnam conducted in 1979 and 1989 represent the first
official sources of data that allow the study of the Vietnamese population. Yet, the absence of
information on international migration in these data collection efforts complicates attempts
aimed at obtaining reliable demographic estimates using two successive census enumerations.
This makes the measurement of Vietnamese emigration of even greater demographic
significance.
This paper attempts to measure Vietnamese intercensal emigration from a variety of data
sources. It first applies traditional intercensal projection techniques to Vietnam’s two census

30
enumerations to estimate net migration as a residual after the other components of change, births
and deaths, are accounted for. The estimates of emigration derived in this fashion are heavily
biased upward due to the inability to distinguish net migration from the net balance of errors in
the data, most importantly differential census enumeration completeness, to which intercensal
projection techniques are particularly sensitive.
To remedy this problem and obtain more reliable estimates of the number of emigrants on
an age and sex specific basis during Vietnam’s intercensal period, an alternative approach is
illustrated. This is based on a combination of counts of refugee movements documented by
UNHCR and of data on Vietnamese immigration recorded in pairs of consecutive censuses of the
US, Canada and Australia. The former set of data provides an estimate of the volume of
Vietnamese emigration during Vietnam’s intercensal period; the latter contributes the age-sex
structure of Vietnamese persons who immigrated to the US, Canada and Australia in the period
between censuses taken at dates that encompass or are very close to the dates of the Vietnamese
censuses. Although these new estimates of Vietnamese intercensal emigration are free from
errors in the data that bias the estimates derived from the Vietnamese censuses, they are
nonetheless not fully accurate. The goal set forth in this paper is an ambitious one. The
identification of all pieces of information on Vietnamese emigration since 1975 is a difficult task,
mainly because the composition of migratory flows in the 1980s consisted of very diverse
groups, and the documentation of these movements was complicated by the political, social and
economic upheavals that took place in Vietnam in the aftermath of the Vietnam war. A case in
point is the emigration from Vietnam to Cambodia during the decade of Vietnamese occupation.

31
Despite the meticulous accounting of Vietnamese emigration to receiver countries of
Vietnamese refugees, that yielded a final estimate of 551,476 emigrants by age and sex who
would have survived to be counted in the 1989 census had they not departed Vietnam, there
remains an unknown amount of “residual” emigration from Vietnam to Cambodia -- possibly
about 200,000-300,000 persons -- who could not be accounted for by the estimation procedure.
The total absence of information on these flows makes it difficult to obtain an accurate
measurement of intercensal emigration, and weakens the accuracy of the final results.

Figure 1. Vietnamese Refugee Movements. Boat + Land People and ODP Departures. 1975-1995
0
50000
100000
150000
200000
250000
<197
7
1977
1978
1979
1980
1981
1982
1983
1984
1985
1986
1987
1988
1989
1990
1991
1992
1993
1994
1995
Year
Arrivals to 1st asylum country (B+L) Resettlement departures (B+L)
Persons in camps by year end (B+L) ODP departures

33
Figure 2. Chronological Succession of Censuses of Vietnam, the US, Australia, and Canada. 1979-1991
1979 1980 1981 1982 1983 1984 1985 1986 1987 1988 1989 1990 1991
Vietnam
US
Canada census
Canada

34
F i g u r e 3 . V i e tn a m e s e R e fu g e e M o v e m e n ts . B o a t P e o p le , J u ly 1 9 7 8 - D e c e m b e r 1 9 8 1
S o u r c e s :
U N H C R ( 1 9 7 8 , 1 9 7 9 , 1 9 8 0 , 1 9 8 1 )
0
5 0 0 0 0
1 0 0 0 0 0
1 5 0 0 0 0
2 0 0 0 0 0
2 5 0 0 0 0
Jul78 Sep Nov
Jan7
9
Mar
May Ju
l
Sep Nov
Jan8
0
Mar
May Ju
l
Sep Nov
Jan8
1
Mar
May Ju
l
Sep Nov
Num
ber
of p
erso
ns in
mon
th
In c a m p s b y m o n th e n d A r r iv a ls t o f ir s t a s y lu m c o u n t r ie s R e s e t t le m e n t d e p a r t u r e s

35
F ig ure 4 . V ie tnam e se Re fug e e M o ve m e nts . B o a t P e o p le , Ja nua ry 1 9 8 9 - D e ce m b e r 1 99 1
S ourc e: UNHCR (1989, 1990 , 1991)
0
20000
40000
60000
80000
100000
120000
140000
Jan8
9
Mar
May Ju
l
Sep Nov
Jan9
0
Mar
May Ju
l
Sep Nov
Jan9
1
Mar
May Ju
l
Sep Nov
Num
ber
of p
erso
ns p
er m
onth
Pe rs ons in c amps by monthend A r r iv a ls to f ir s t as y lum c oun tr ies Res ettlement depar tu res
V ie tnam 1989 c en . US 1990 c ens us Canada 1991 c ens usA us tra lia 1991 c ens us

Table 1. Percentage Distribution of Vietnamese Arrivals to Major Resettlement Countries by Type of Departure (1975-1995)
Country of arrival Type of departureBoat +Land ODP Total
Australia 14.70% 7.69% 11.62%Canada 13.66 9.67 11.9France 3.58 3.25 3.44United States 56.26 72.89 63.57Other (a) 11.8 6.5 9.47
Total 100.00% 100.00% 100.00%(n) (754,717) (591,845) (1,346,562)Note: (a) The category "Other" includes various European countries, Japan, and New Zealand.Source:UNHCR (1995b)
Table 2. Estimates of Vietnamese Net Migration, by Age Cohortsby Life-Table Survival Rate Method, 1979-1989
Age Male Female Total
0-5 -314,461 -28,669 -343,1305 to 10 -127,846 133,538 5,692
9.5-14.5 53,862 69,172 123,03314.5-19.5 -439,876 -237,117 -676,99319.5-24.5 -675,913 -201,349 -877,26224.5-29.5 -127,806 5,875 -121,93229.5-34.5 68,263 -33,934 34,32934.5-39.5 -91,817 -131,338 -223,15639.5-44.5 -65,559 -46,198 -111,75744.5-49.5 -50,779 -10,061 -60,84049.5-54.5 21,139 33,819 54,95854.5-59.5 -10,756 5,013 -5,74359.5-64.5 36,822 70,267 107,08964.5-69.5 6,907 -34,418 -27,51169.5-74.5 -30,262 -31,846 -62,10874.5-79.5 -2,213 -23,498 -25,71179.5-84.5 -8,019 -42,484 -50,503
84.5+ -1,773 -424 -2,197
Exits -1,947,081 -821,336 -2,768,417Entries 186,992 317,684 504,676
Total -1,760,089 -503,652 -2,263,740
Sources:

Table 3. S ex ra t ios and Cum ulat ive D is tribut ion by A ge of V ie tnam es e-bornE num erated in the Cens us es of the US , Canada and A us tralia , W ho Im m igratedto Thes e Countries D uring the In terc ens al P eriod, by Country o f Im m igrat ion
UN ITE D S TA TE S : A pril 1, 1980 - A pril 1 , 1990M ale F em ale
c um ulat ive c um ulat ive perc entage perc entageA ge in 1990 M ale F em ale S ex rat io by age by age
0-4 2,066 2,219 0.93 0.012 0.0145-9 6,274 5,437 1.15 0.047 0.049
10-14 16,278 14,614 1.11 0.139 0.14215-19 26,245 19,265 1.36 0.287 0.26620-24 22,981 17,476 1.31 0.416 0.37725-34 46,750 37,281 1.25 0.680 0.61635-44 30,014 30,688 0.98 0.849 0.81245-54 14,013 14,418 0.97 0.928 0.90455-64 6,962 7,578 0.92 0.967 0.95265-74 3,415 4,319 0.79 0.986 0.98075+ 2,460 3,144 0.78 1.000 1.000
Total 177,459 156,439 1.13
CA NA DA : June 3, 1981 - June 4, 1991M ale F em ale
c um ulat ive c um ulat ive perc entage perc entage
A ge in 1991 M ale F em ale S ex rat io by age by age
0-4 489 441 1.11 0.013 0.0125-9 1,995 1,848 1.08 0.067 0.062
10-25 14,752 12,814 1.15 0.466 0.41125-29 4,932 4,427 1.11 0.600 0.53130-34 4,366 5,025 0.87 0.718 0.66835-39 3,187 3,883 0.82 0.804 0.77440-44 2,036 2,277 0.89 0.859 0.83645-54 1,896 2,043 0.93 0.911 0.89155-64 1,786 2,258 0.79 0.959 0.95365-69 604 714 0.85 0.975 0.97270-74 465 493 0.94 0.988 0.98575+ 453 536 0.84 1.000 1.000
36,961 36,760 1.01 A U S TRA LIA : June 30, 1981 - June 30, 1991
M ale F em alec um ulat ive c um ulat ive
perc entage perc entageA ge in 1991 M ale F em ale S ex rat io by age by age
0-4 489 441 1.11 0.011 0.0115-9 1,995 1,848 1.08 0.058 0.057
10-14 4,592 4,206 1.09 0.165 0.16215-19 4,868 4,322 1.13 0.279 0.26920-24 5,884 4,658 1.26 0.416 0.38525-34 12,021 10,618 1.13 0.697 0.64935-44 6,713 6,785 0.99 0.854 0.81845-54 2,380 2,560 0.93 0.909 0.88255-64 2,165 2,659 0.81 0.960 0.94865-74 1,231 1,467 0.84 0.989 0.98575+ 491 619 0.79 1.000 1.000
Total 42,828 40,183 1.07S ourc es :

38
Table 4. Total Counts of Vietnamese Immigrants to Selected Resettlement Countries from Various Sources, 1980-1991Percentage
Source Census (1) (a) UNHCR (2) (b) difference
(1) (2) ((2-1)/1)
UNITED STATES (April 1, 1980- April 1, 1990) 333,898 390,288 16.9CANADA (June 3, 1981 - June 4, 1991) 73,721 72,552 -1.6
AUSTRALIA (June 30, 1981 - June 30, 1991) 83,011 88,565 6.7TOTAL 407,619 462,840 13.5
Notes:(1) Based on column 8 of Appendix Tables A3-A8.(2) To make UNHCR counts comparable with census counts, UNHCR total counts of resettlement departures to the US, Australia, and Canada were discounted, for the US, by the number of resettlements during January-March 1989 and April-December 1990, for Australia, by the number of resettlements during January-June 1981 and July-December 1991,and for Canada by the numer of resettlements during January-May 1981 and June-December 1991, because the survival procedures only account for those people who immigrated during the intercensal period. A monthly breakdownof UNHCR data on resettlement departures was available for most years relevant to these calculations (1980, 1981, 1990, and 1991) and for most types of resettlement departures (boat and land from refugee camps and ODP departures). Yet, for some years and types of departure, only semester counts were available. In this case, montly counts were approximated as one sixth of semester counts.
Sources:(a) Appendix Tables A3-A8(b) UNHCR (1980, 1981, 1986, 1990, 1991, 1992)
Table 5. Total Vietnamese Arrivals to Refugee Camps in "First Asylum" Countries, and Direct ODP Departures to Countries of Resettlement During Vietnam's Intercensal Period (October 1, 1979 - April 1, 1989)
Arrivals to refugee camps in first ODP asylum countries departures Total
Year or month Boat people Land people
Oct 1979 2,854 (1) 218 (2) 330 (4) 3,402Nov 1979 2,209 (1) 218 (2) 330 (4) 2,757Dec 1979 2,745 (1) 218 (2) 330 (4) 3,293
1980 71,372 (2) 4262 (2) 4,706 (4) 80,3401981 74,438 (2) 4942 (2) 9,815 (4) 89,1951982 43,505 (2) 4133 (2) 10,057 (4) 57,6951983 27,919 (2) 162 (2) 18,978 (4) 47,0591984 24,761 (2) 1789 (2) 29,154 (4) 55,7041985 22,115 (2) 91 (2) 24,940 (4) 47,1461986 19,451 (2) 1921 (2) 18,418 (4) 39,7901987 28,106 (2) 2126 (2) 12,961 (4) 43,1931988 45,562 (2) 1473 (2) 21,275 (4) 68,310
Jan 1989 3,301 (3) (a) (-) 3,483 (5) 6,784Feb 1989 3,017 (3) (a) (-) 3,483 (5) 6,500Mar 1989 5,085 (3) (a) (-) 3,483 (5) 8,568
Total 376,440 21553 161,743 559,736Notes:(a) Includes land people.
Sources: (1) UNHCR (1979)(2) UNHCR (1995b)(3) UNHCR (1990)(4) UNHCR (1990)(5) UNHCR (1989)

39
Table 6. Probability of Dying of Vietnamese Immigrants to the US, Canada and Australia for 10-year Intercensal Periods.
United States Average of Canada and Australia1980-1990 1981-1991
Male (all ages) 0.017455 0.015229Female (all ages) 0.013351 0.010183Source: Appendix Tables A3-A8
Table 7: Age Distribution of Vietnamese Emigrants Who Departed duringVietnam's Intercensal Period 1979-1989, by Sex
Male FemaleAge interval percentage percentage
in 1990 Male Female Total by age by age
0-4 3,454 3,713 7,167 1.18 1.435-9 10,519 9,117 19,636 3.60 3.52
10-14 27,261 24,485 51,745 9.32 9.4615-19 43,922 32,278 76,200 15.01 12.4720-24 38,346 29,258 67,604 13.11 11.3025-34 77,787 62,365 140,152 26.59 24.0835-44 49,805 51,232 101,037 17.03 19.7845-54 22,990 23,899 46,889 7.86 9.2355-64 11,030 12,326 23,356 3.77 4.7665-74 4,984 6,728 11,712 1.70 2.6075+ 2,426 3,551 5,977 0.83 1.37
Total 292,524 258,952 551,476 100.00 100.00Source: Table 5

40
Table A1. Calculation of Estimates of Net Migration of Vietnamese Males, by Age Cohorts, by Life-Table Survival Rate Method, 1979-1989
9.5-year Forward method Reverse method Averaged1979 1989 LT surv Net "Younged" Net net
Age in 1979 Age in 1989 population population rates Survivors migration population migration migration(1) (2) (3) (1)x(3)=(4) (2)-(4)=(5) (2)/(3)=(6) (6)-(1)=(7) [(5)+(7)]/2=(8)
All ages All ages 25580582 31629831 33366355 -1736524 33388840 -1783656 -1760090
Births, 1984-89(a) 0-5 5046137 4665461 0.98645 4977778 -312317 4729531 -316606 -314461 Births, 1979-84(b) 5 to 10 4545777 4393135 0.99447 4520627 -127492 4417576 -128201 -127846
Under 5 9.5-14.5 3946224 3895156 0.97359 3842015 53141 4000806 54582 538625-10 14.5-19.5 3928795 3425278 0.98283 3861345 -436067 3485110 -443685 -43987610-15 19.5-24.5 3632555 2895916 0.98155 3565535 -669620 2950349 -682206 -67591315-20 24.5-29.5 2954333 2762703 0.97791 2889082 -126379 2825100 -129233 -12780620-25 29.5-34.5 2281171 2296698 0.97723 2229221 67477 2350221 69050 6826325-30 34.5-39.5 1742277 1606504 0.97408 1697115 -90611 1649254 -93023 -9181730-35 39.5-44.5 1177320 1070543 0.96397 1134899 -64356 1110558 -66762 -6555935-40 44.5-49.5 966580 865004 0.94599 914373 -49370 914391 -52189 -5077940-45 49.5-54.5 919291 868409 0.92258 848121 20288 941281 21990 2113945-50 54.5-59.5 994602 884471 0.89951 894658 -10187 983277 -11325 -1075650-55 59.5-64.5 825356 740916 0.85653 706940 33976 865023 39667 3682255-60 64.5-69.5 680996 539475 0.78328 533408 6067 688742 7746 690760-65 69.5-74.5 540920 344979 0.68318 369545 -24566 504961 -35959 -3026265-70 74.5-79.5 419164 223019 0.53574 224563 -1544 416282 -2882 -221370-75 79.5-84.5 284003 104829 0.38480 109285 -4457 272422 -11581 -801975+ 84.5+ 286995 47338 0.16671 47845 -507 283955 -3040 -1773
Notes: (a) Equals three-fourths of the births in 1984 plus the births in 1985, 1986, 1987, 1988, and one-fourth of the births in 1989.(b) Equals three-fourths of the births in 1979 plus the births in 1980, 1981, 1982, 1983, and one-fourth of the births in 1984.Sources: Vietnam General Statistical Office, 1983Vietnam Central Census Steering Committee, 1994

Table A2. Calculation of Estimates of Net Migration of Vietnamese Females, by Age Cohorts, by Life-Table Survival Rate Method, 1979-1989
9.5-year Forward method Reverse method Averaged1979 1989 LT surv Net "Younged" Net net
Age in 1979 Age in 1989 population population rates Survivors migration population migration migration(1) (2) (3) (1)x(3)=(4) (2)-(4)=(5) (2)/(3)=(6) (6)-(1)=(7) [(5)+(7)]/2=(8)
All ages All ages 27161184 33944235 34424439 -480203 35683060 -527099 -503651
Births 84/4-89/3 0-5 4760507 4665461 0.98601 4693928 -28467 4731636 -28870 -28669 Births 79/4-84/3 5 to 10 4288469 4393135 0.99337 4260041 133094 4422451 133982 133538
0-4 9.5-14.5 3766472 3719157 0.96936 3651061 68095 3836720 70248 691725-9 14.5-19.5 3761523 3460285 0.98239 3695295 -235011 3522300 -239223 -237117
10-14 19.5-24.5 3406774 3155524 0.98490 3355341 -199818 3203893 -202881 -20134915-19 24.5-29.5 3060551 3017636 0.98407 3011809 5827 3066473 5922 587520-24 29.5-34.5 2601098 2526780 0.98437 2560447 -33667 2566896 -34202 -3393425-29 34.5-39.5 1975507 1812367 0.98334 1942602 -130235 1843066 -132441 -13133830-34 39.5-44.5 1314655 1240046 0.97800 1285730 -45684 1267943 -46712 -4619835-39 44.5-49.5 1104086 1059655 0.96872 1069555 -9901 1093865 -10221 -1006140-44 49.5-54.5 1084758 1069755 0.95570 1036702 33053 1119343 34585 3381945-49 54.5-59.5 1113757 1045335 0.93422 1040492 4843 1118941 5184 501350-54 59.5-64.5 902407 881716 0.90317 815024 66692 976249 73842 7026755-59 64.5-69.5 872541 722340 0.86444 754255 -31915 835621 -36920 -3441860-64 69.5-74.5 663366 499405 0.79537 527620 -28216 627891 -35475 -3184665-69 74.5-79.5 559727 362956 0.68251 382019 -19064 531795 -27932 -2349870-74 79.5-84.5 434355 203578 0.53704 233265 -29687 379075 -55280 -4248475+ 84.5+ 539607 109109 0.20247 109252 -143 538902 -705 -424
Notes: (a) Equals three-fourths of the births in 1984 plus the births in 1985, 1986, 1987, 1988, and one-fourth of the births in 1989.(b) Equals three-fourths of the births in 1979 plus the births in 1980, 1981, 1982, 1983, and one-fourth of the births in 1984.Sources: Vietnam General Statistical Office, 1983Vietnam Central Census Steering Committee, 1994

Table A3. Calculation of Estimates of Net Immigration of Vietnamese-Born Males, by Age Cohorts, by Life-Table Survival Rate Method, for the United States: 1980-1990
Vietnam-born pop 10-year Forward method Reverse method Averaged in US censuses LT surv Net "Younged" Net net
Age in 1980 Age in 1990 1980 1990 rates Survivors immigration population immigration immigration(1) (2) (3) (1)x(3)=(4) (2)-(4)=(5) (2)/(3)=(6) (6)-(1)=(7) [(5)+(7)]/(2)=(8)
All ages All ages 115554 285684 111323 166032 296099 180545 177459
- 0-4 - 2059 0.99681 - - 2066 2066 2066 (a)- 5-9 - 6270 0.99929 - - 6274 6274 6274(a)
0-4 10-14 4988 21219 0.99640 4970 16249 21296 16308 162785-9 15-19 14896 41003 0.99509 14823 26180 41205 26309 26245
10-14 20-24 15444 38134 0.98923 15278 22856 38549 23105 2298115-24 25-34 31518 77370 0.98370 31004 46366 78652 47134 4675025-34 35-44 24877 54027 0.97843 24340 29687 55218 30341 3001435-44 45-54 12104 25283 0.95669 11580 13703 26428 14324 1401345-54 55-64 6952 12793 0.89450 6219 6574 14302 7350 696255-64 65-74 3175 5414 0.76959 2443 2971 7035 3860 341565+ 75+ 1600 2112 0.41622 666 1446 5074 3474 2460
Notes:(a) Reverse survival onlySources:US Bureau of the Census (1988)US Bureau of the Census (1993)
Table A4. Calculation of Estimates of Net Immigration of Vietnamese-Born Females, by Age Cohorts, by Life-Table Survival Rate Method, for the United States: 1980-1990
Vietnam-born pop 10-year Forward method Reverse method Averaged in US censuses LT surv Net "Younged" Net net
Age in 1980 Age in 1990 1980 1990 rates Survivors immigration population immigration immigration(1) (2) (3) (1)x(3)=(4) (2)-(4)=(5) (2)/(3)=(6) (6)-(1)=(7) [(5)+(7)]/(2)=(8)
All ages All ages 106095 257578 103228 146703 264613 158518 156439
- 0-4 - 2213 0.99751 - - 2219 2219 2219 (a)- 5-9 - 5434 0.99947 - - 5437 5437 5437 (a)
0-4 10-14 4577 19159 0.99732 4565 14594 19210 14633 146145-9 15-19 13487 32692 0.99742 13452 19240 32777 19290 19265
10-14 20-24 12094 29483 0.99581 12043 17440 29607 17513 1747615-24 25-34 24125 61159 0.99423 23986 37173 61514 37389 3728125-34 35-44 27197 57468 0.99021 26931 30537 58036 30839 3068835-44 45-54 13033 26969 0.97629 12724 14245 27624 14591 1441845-54 55-64 5734 12742 0.94090 5395 7347 13542 7808 757855-64 65-74 3242 6820 0.86659 2809 4011 7870 4628 431965+ 75+ 2606 3439 0.50744 1322 2117 6777 4171 3144
Notes:(a) Reverse survival onlySources:US Bureau of the Census (1988)US Bureau of the Census (1993)

43
Table A5. Calculation of Estimates of Net Immigration of Vietnamese Born Males, by Age Cohorts, by Life-Table Survival Rate Method, for Canada: 1981-1991
Vietnam-born pop 10-year Forward method Reverse method Averagedin Canadian censuses LT surv Net "Younged" Net net
Age in 1981 Age in 1991 1981 1991 (a) rates Survivors immigration population immigration immigration(1) (2) (3) (1)x(3)=(4) (2)-(4)=(5) (2)/(3)=(6) (6)-(1)=(7) [(5)+(7)]/(2)=(8)
All ages All ages 28290 63968 27575 33911 65818 37528 36961
- 0-4 - 488 0.99762 - - 489 489 489 (b)- 5-9 - 1994 0.99934 - - 1995 1995 1995 (b)
0-14 10-25 6990 21661 0.99436 6951 14710 21784 14794 1475215-19 25-29 4135 8983 0.98729 4082 4901 9099 4964 493220-24 30-34 5795 10057 0.98695 5719 4338 10190 4395 436625-29 35-39 4500 7604 0.98643 4439 3165 7709 3209 318730-34 40-44 2440 4418 0.98319 2399 2019 4494 2054 203635-44 45-54 2475 4257 0.96689 2393 1864 4403 1928 189645-54 55-64 1210 2804 0.91062 1102 1702 3079 1869 178655-59 65-69 285 783 0.82807 236 547 946 661 60460-64 70-74 185 533 0.74079 137 396 720 535 46565+ 75+ 275 386 0.42343 116 270 912 637 453
Notes:(a) The age distribution of Vietnamese-born persons enumerated in the 1991 census was reported in very wide age categories. Itwas redistributed within 5-year age groups according to the age distribution of Vietnamese born in Australia's 1991 census.(b) Reverse survival onlySources:Statistics Canada (1984)Statistics Canada (1994)
Table A6. Calculation of Estimates of Net Immigration of Vietnamese-Born Females, by Age Cohorts, by Life-Table Survival Rate Method for Canada: 1981-1991
Vietnam-born pop 10-year Forward method Reverse method Averagedin Canadian censuses LT surv Net "Younged" Net net
Age in 1981 Age in 1991 1981 1991 (a) rates Survivors immigration population immigration immigration male(1) (2) (3) (1)x(3)=(4) (2)-(4)=(5) (2)/(3)=(6) (6)-(1)=(7) [(5)+(7)]/(2)=(8)
All ages All ages 22420 58358 21976 34095 59557 37137 36760
0-4 - 440 0.99806 - - 441 441 441 (b) 5-9 - 1847 0.99954 - - 1848 1848 1848 (b)
0-14 10-25 6130 18909 0.99720 6113 12796 18962 12832 1281415-19 25-29 2645 7052 0.99583 2634 4418 7082 4437 442720-24 30-34 3555 8552 0.99532 3538 5014 8592 5037 502525-29 35-39 3800 7648 0.99391 3777 3871 7695 3895 388330-34 40-44 2100 4348 0.99108 2081 2267 4387 2287 227735-44 45-54 2090 4072 0.98045 2049 2023 4153 2063 204345-54 55-64 1065 3215 0.95134 1013 2202 3379 2314 225855-59 65-69 380 1025 0.90895 345 680 1128 748 71460-64 70-74 245 667 0.86015 211 456 775 530 49365+ 75+ 410 583 0.52324 215 368 1114 704 536
Notes:(a) The age distribution of Vietnamese-born persons enumerated in the 1991 census was reported in very wide age categories. It was redistributed within 5-year age groups according to the age distribution of Vietnamese born in Australia's 1991 census.(b) Reverse survival onlySources:Statistics Canada (1984)Statistics Canada (1994)
44
Table A7. Calculation of Estimates of Net Immigration of Vietnamese-Born Males, by Age Cohorts, by Life-Table Survival Rate Method for Australia: 1981-1991
Vietnam-born pop 10-year Forward method Reverse method Averaged in Aus censuses LT surv Net "Younged" Net net
Age in 1981 Age in 1991 1981 1991 rates Survivors immigration population immigration immigration(1) (2) (3) (1)x(3)=(4) (2)-(4)=(5) (2)/(3)=(6) (6)-(1)=(7) [(5)+(7)]/(2)=(8)
All ages All ages 22266 63968 21786 39700 65739 43473 42828
- 0-4 - 488 0.99695 - - 489 489 489(a)- 5-9 - 1994 0.99926 - - 1995 1995 1995(a)
0-4 10-14 1333 5913 0.99665 1329 4584 5933 4600 45925-9 15-19 2803 7646 0.99531 2790 4856 7682 4879 4868
10-14 20-24 2272 8102 0.98966 2249 5853 8187 5915 588415-19 25-29 3089 8983 0.98571 3045 5938 9113 6024 598120-24 30-34 4116 10057 0.98619 4059 5998 10198 6082 604025-29 35-39 3361 7604 0.98698 3317 4287 7704 4343 431530-34 40-44 2071 4418 0.98459 2039 2379 4487 2416 239835-39 45-49 1209 2524 0.97668 1181 1343 2584 1375 135940-44 50-54 763 1733 0.96054 733 1000 1804 1041 102145-49 55-59 448 1374 0.93208 418 956 1474 1026 99150-54 60-64 368 1430 0.88724 327 1103 1612 1244 117455-59 65-69 186 783 0.82234 153 630 952 766 69860-64 70-74 113 533 0.73109 83 450 729 616 53365-69 75-79 70 246 0.60714 42 204 405 335 26970-74 80-84 41 110 0.45393 19 91 242 201 14675+ 85+ 23 30 0.20367 5 25 147 124 75
Notes:(a) Reverse survival onlySources:Australian Bureau of Statistics (1984)Australian Bureau of Statistics (1995)
Table A8. Calculation of Estimates of Net Immigration of Vietnamese-Born Females, by Age Cohorts, by Life-Table Survival Rate Method for Australia: 1991-1991
Vietnam-born pop 10-year Forward method Reverse method Averaged in Aus censuses LT surv Net "Younged" Net net
Age in 1981 Age in 1991 1981 1991 rates Survivors immigration population immigration immigration(1) (2) (3) (1)x(3)=(4) (2)-(4)=(5) (2)/(3)=(6) (6)-(1)=(7) [(5)+(7)]/(2)=(8)
All ages All ages 18831 58358 18580 37491 59417 40586 40183
- 0-4 - 440 0.99759 - - 441 441 441(a)- 5-9 - 1847 0.99950 - - 1848 1848 1848(a)
0-4 10-14 1234 5432 0.99760 1231 4201 5445 4211 42065-9 15-19 2662 6973 0.99774 2656 4317 6989 4327 4322
10-14 20-24 1862 6504 0.99616 1855 4649 6529 4667 465815-19 25-29 1988 7052 0.99491 1978 5074 7088 5100 508720-24 30-34 3053 8552 0.99461 3037 5515 8598 5545 553025-29 35-39 3313 7648 0.99385 3293 4355 7695 4382 436930-34 40-44 1959 4348 0.99148 1942 2406 4385 2426 241635-39 45-49 976 2197 0.98606 962 1235 2228 1252 124340-44 50-54 588 1875 0.97614 574 1301 1921 1333 131745-49 55-59 367 1683 0.96127 353 1330 1751 1384 135750-54 60-64 287 1532 0.94003 270 1262 1630 1343 130255-59 65-69 188 1025 0.90792 171 854 1129 941 89860-64 70-74 167 667 0.85296 142 525 782 615 57065-69 75-79 87 354 0.76254 66 288 464 377 33270-74 80-84 62 159 0.62767 39 120 253 191 15675+ 85+ 38 70 0.29122 11 59 240 202 131
Notes:(a) Reverse survival onlySources:Australian Bureau of Statistics (1984)Australian Bureau of Statistics (1995)

45
FOOTNOTES
1 This paper is a revised version of a chapter of my doctoral dissertation. I am grateful to
Samuel Preston for his suggestions on various versions of this paper, and to Irma Elo, Charles
Hirschman and Avery Guest for helpful comments.
2 This figure does not include some 130,000 Vietnamese who had been closely associated
with the US or the Thieu administration, and were evacuated by boat or by air by US military forces
in the last few days prior to the capture of Saigon by North-Vietnamese forces (Viviani, 1984;
Hitchcox, 1990). The figure also does not include about 260,000 ethnic Chinese who crossed the
border to China’s Guangxi province in 1978 (UNHCR, 1979; Alley, 1980). Adding these numbers
to the UNHCR count of refugees would yield a grand total of 1,790,000 emigrants from Vietnam
during period from 1975 to 1995.
3 This estimates relies on the number of arrivals in camps of first asylum countries, and
should be considered as a minimum estimate, as arrivals to refugee camps differ from departures
from Vietnam by an unknown proportion lost at sea. Estimates of losses reported in various
studies range from 40,000 to 150,000 (Hitchcox, 1990), and from 10 to 50 percent of arrivals
(Viviani, 1984).
4 The number of such departures was far smaller than the large numbers who took the
maritime route.

46
5 By mid 1979, the flow of arrivals of Vietnamese refugees to camps in Southeast Asian
countries and Hong Kong was inflated by Cambodian and Laotian refugees seeking a safe haven
in Thailand. The former were fleeing Vietnamese invading troops and starvation precipitated by
a shattered economy (Viviani, 1984:34). The latter, mostly Hmong and other hill-tribe groups,
were fleeing political persecution because of their resistance against the Vietnamese-backed
Laotian government (Robinson 1991:222-223).
6 These life tables are based on deaths in the household in the year prior to the census
adjusted upward for incompleteness of death reporting using the Preston-Coale method. They
have life expectancy at birth of 63 for males and 67.5 for females, with an implied level of
overall mortality similar to the 1979 census (Vietnam General Statistical Office, 1991:105).
7 For computational convenience, the number of person-years lived by those born in the
intercensal period are computed for exact ages 0-5 and 5-10 rather than 0-4.75 and 4.75-9.5.
Thus the estimates of migration for these age groups will cover full 5-year periods from April 1,
1984 to March 31, 1989, and from April 1, 1979 to March 31, 1984. Migration is more likely to
be concentrated in young adult ages than at the youngest ages, and this will not result in a
significant loss of precision of the estimates.

47
8 1.25 year reflects the fact that the population under 5 years of age in 1989 has been at
risk for only 1.25 years on the average, or 2.5x0.5 – the first factor representing the average
period of time between birth and the 1989 census, and the second factor indicating the fact that
emigration occurred during the period between birth and the 1989 census, with an assumed
average residence in the area of one-half the period (Shryock and Siegel, 1976:360).
9 The only information on fertility in the intercensal period is available from the 1989
census report. The authors of the report estimated average annual birth rates for selected periods
by reverse survival method based on the age-sex structure of the 1989 population. They derived
average crude birth rates of 33.5 per 1,000 for the period 1980-1984 and 31 per 1,000 for the
period 1985-1989 (General Statistical Office, 1991:95). To obtain an annualized count of births,
I applied these rates to the 1979 and 1989 census total populations respectively. I further assumed
that 1/12 of births in a year occur in each month. This allowed to estimates the number of births
occurring in the period between April 1, 1979 and March 31 1984 as three fourths of 1979 births
plus births in 1980, 1981, 1982, 1983 and one fourth of the births in 1984, and the number of
births occurring between April 1, 1984 and March 31, 1989 as three fourths of the births in 1984
plus the births in 1985, 1986, 1987, 1988 and one fourth of the births in 1989. I then applied the
“normal” sex ratio at birth of 106 males per 100 females to the total estimated number of births
occurring in the two periods to derive an estimate of the number of male and female births.

48
10 The term "immigration" is not an accurate description of the legal status of all
Vietnamese persons arriving to the US, Canada and Australia. It is used here for clarity of
exposition, because it suggests the final destination of the emigration flow from Vietnam.
Vietnamese may arrive to the country of final destination as refugees or immigrants, although both
categories are considered residents of these countries by census rules, and are enumerated by the
census (Warren and Passel, 1987; Samuel, White and Perrault, 1987; Australia Bureau of
Immigration and Population Research, 1994). For example, in the US, immigrants are persons
admitted with permanent residence alien status (Gordon, 1987), while refugees physically enter the
US under the Migration and Refugee Assistance Act long before they become eligible to change
their status from refugee to immigrant (Barringer, Gardner and Levin, 1993). Vietnamese spouses
and children of American citizens usually enter as immigrants. But, over the course of the 1980s,
there has been an increasing trend of Vietnamese immigration to the US, because many immigrants,
who would otherwise have been refugees, were sponsored by relatives already living in the US who
had arrived with the first refugee flow of 1975-1976 (Gordon, 1987; Hitchcox, 1990).
11 Here, forward projection allows to obtain an estimate of net immigration M, or the
number of Vietnam-born persons who immigrated to the US in the intercensal period and
survived to the end of the period. Backward projection yields an estimate of net immigration MΝ
, that combines the number of Vietnamese-born persons who immigrated during the intercensal

49
period and survived to the end of the period and those who died during the period. It also
incorporates an estimate of children age a and younger born in Vietnam and immigrated to the
country of resettlement during the intercensal period (United Nations, 1970:26). The average of
the two estimates MΟ will include the number of deaths to the migrant cohorts with the implicit
assumption that deaths and migration are evenly distributed over the intercensal period or that all
migration occurs in the middle of the period. Thus, the ratio M/MΟ represents the probability
that Vietnamese-born persons who immigrated to the country of resettlement during the
intercensal period will survive to the end of the period. Its complement 1 - M/MΟ , or the
probability of dying, will be employed in one of the next sections to construct a single factor that
discounts the volume of emigration from Vietnam by the proportion dying in the country of
resettlement.
12 Vietnamese refugees who reached Thailand by land are not included in these counts.
UNHCR data do not provide a monthly breakdown of land refugees by country of origin, namely
Vietnam, Cambodia and Laos. Separate counts by year for earlier periods have only recently
become available. Fortunately, Vietnamese “land” people represent only a small fraction of total
departures from Vietnam, with the bulk of land refugees consisting of Cambodians and Laotians.

50
REFERENCES
Alley, R.
1980 Refugees from Vietnam in China. Beijing: New World Press.
Australia Bureau of Statistics
1995 Australia 1991 Census of Population and Housing. National Matrixes. Disk 1. Release 2.
Canberra: Australian Government Publishing Service.
-----
1990 Australia. Cross-classified Characteristics of Persons and Dwellings. Catalogue
No.2498.0. Table C03. Canberra: Australian Government Publishing Service.
-----
1984 Australia 1981 Census of Population and Housing. Table 236 - Overseas Born by
Birthplace by Sex. Canberra: Australian Government Publishing Service.
Australia Bureau of Immigration and Population Research

51
1994 Community Profiles, 1991 Census, Vietnam Born. Canberra: Australian Government
Publishing Service.
Banister, J.
1993 “Vietnam: Population Dynamics and Prospects,” Indochina Research Monograph, No.6.
Berkeley, CA: Institute of East Asian Studies, University of California-Berkeley.
Banister, J., and E. P. Johnson
1993 ΑAfter the Nightmare: The Population of Cambodia.≅ In Genocide and Democracy in
Cambodia: The Khmer Rouge, the United Nations and the International Community. Ed.
B. Kiernan. Monograph Series 41, Yale University Southeast Asia Studies, New Haven.
Barringer, H. R., R.W. Gardner, M.J. Levin
1993 Asians and Pacific Islanders in the United States, New York: Russell Sage Foundation.
Ea, M.T.
1990 “Recent Population Trends in Kampuchea.” In The Cambodian Agony. Ed. D. Ablin and
M. Hood. New York: Sharpe. Pp. 3-15.

52
-----
1981 “Kampuchea: A Country Adrift,” Population and Development Review 7(2):209-228.
Gordon, L.W.
1989 “The Missing Children: Mortality and Fertility in a Southeast Asian Refugee Population,”
International Migration Review 23(2):219-237.
-----
1987 “Southeast Asian Refugees Migration to the United States.” In Pacific Bridges: The New
Immigration from Asia and the Pacific Islands. Ed. J.T. Fawcett and B.V. Carino. Staten
Island, NY: Center for Migration Studies. Pp. 153-173.
Heuveline, P.
1996 “Between One and Three Million: Toward a Demographic Reconstruction of a Decade of
Cambodian History (1970-1979).” Paper presented at the meeting of the Population
Association of America. New Orleans. May.
Hitchcox, L.
1990 Vietnamese Refugees in Southeast Asian Camps. New York: St. Martin=s Press.

53
Keyfitz, N. and W. Flieger
1990 World Population Growth and Aging. Demographic Trends in the Late Twentieth
Century. Chicago and London: The University of Chicago Press.
National Center for Health Statistics
1988 Vital Statistics of the United States, 1985. Vol. II, Sec. 6, Life Tables. DHHS Pub. No.
(PHS)/88-1104. Public Health Service, Washington, D.C.: US Government Printing
Office.
New York Times
1996 ”A Boat People Exodus: Back to Vietnam,” New York, April 18.
Nguyen-vo, T. H.
1992 Khmer-Viet Relations and the Third Indochina Conflict. Jefferson, NC: McFarland &
Company, Inc. Publishers.
Robinson, W. C.
1991 ΑLaotian Refugees in Thailand: The Thai and US Response, 1975 to 1988.” In Laos:
Beyond the Revolution. Ed. J. J. Zasloff and L. Unger. New York: St. Martin=s Press.

54
Samuel, T.J., P.M. White, and J. Perreault
1987 “National Recording Systems and the Measurement of International Migration in Canada:
An Assessment,” International Migration Review 21(4):1170-1211.
Shryock, H.S. and J.S. Siegel
1976 The Methods and Materials of Demography. New York: Academic Press.
Statistics Canada
1994 1991 Census of Canada: Immigration and Citizenship, The Nation. Catalogue 93-316.
Ottawa: Minister of Supply and Services Canada.
-----
1989 1986 Census of Canada: Ethnicity, Immigration and Citizenship, The Nation. Catalogue
93-109. Ottawa: Minister of Supply and Services Canada.
-----
1984 1981 Census of Canada: Population, Place of Birth, Citizenship, Period of Immigration.
Catalogue 92-913. Ottawa: Minister of Supply and Services Canada.

55
United Nations
1983 Manual X. Indirect Techniques for Demographic Estimation. New York: United Nations.
-----
1970 Manual VI. Methods of Measuring Internal Migration. New York: United Nations.
United Nations High Commissioner for Refugees (UNHCR)
1995a Statistics Concerning Indo-Chinese in East and South East Asia, August 1995. Geneva:
UNHCR.
-----
1995b Statistics Concerning Indo-Chinese in East and South East Asia, October 1995. Geneva:
UNHCR.
-----
1993 The State of the World=s Refugees 1993. New York: Penguin Books.
-----

56
1992 Statistics Concerning Indo-Chinese in East and South East Asia, January 1992. Geneva:
UNHCR.
-----
1991 Statistics Concerning Indo-Chinese in East and South East Asia, December 1991.
Geneva: UNHCR.
-----
1990 Statistics Concerning Indo-Chinese in East and South East Asia, December 1990.
Geneva: UNHCR.
-----
1989 Statistics Concerning Indo-Chinese in East and South East Asia, December 1989.
Geneva: UNHCR.
-----
1986 Statistics Concerning Indo-Chinese in East and South East Asia, December 1986.
Geneva: UNHCR.

57
-----
1981 Statistics Concerning Indo-Chinese in East and South East Asia, December 1981.
Geneva: UNHCR.
-----
1980 Statistics Concerning Indo-Chinese in East and South East Asia, December 1980.
Geneva: UNHCR.
-----
1979 Statistics Concerning Indo-Chinese in East and South East Asia, December 1979.
Geneva: UNHCR.
-----
1978 Statistics Concerning Indo-Chinese in East and South East Asia, December 1978.
Geneva: UNHCR.
United States Bureau of the Census
1993 Census of Population 1990. Subject Reports: The Foreign-Born Population in the United
States. Table 1. Washington, D.C.: U.S. Government Printing Office.

58
-----
1988 Census of Population 1980. Subject Reports: Asian and Pacific Islander Population in the
United States: 1980. Section 2, Table 48. Washington, D.C.: U.S. Government Printing
Office.
Vietnam Central Census Steering Committee
1994 Vietnam Population Census - 1989. Completed Census Results. Hanoi.
-----
1990 Vietnam Population Census - 1989. Sample Results. Hanoi.
Vietnam General Statistical Office
1991 Vietnam Population Census - 1989. Detailed Analysis of Sample Results. Hanoi.
-----
1983 1979 Vietnam Census Report. Hanoi.
Viviani, N.

59
1984 The Long Journey. Vietnamese Migration and Settlement in Australia. Melbourne:
Melbourne University Press.
Warren, R. and J.S. Passel
1987 “A Count of the Uncountable: Estimates of Undocumented Aliens Counted in the 1980
United States Census,” Demography, 24(3):375-393.
Zlotnik, H.
1987 “The Concept of International Migration as Reflected in Data Collection Systems,”
International Migration Review, 21(4):925-946.