estimating story points in agile - magic approach
TRANSCRIPT

Estimating Story Points
in Agile - Approach
1 3
8 5
Bollapragada. Venkata. Marraju
[email protected] https://in.linkedin.com/in/marraju

There is a debate around story point estimation techniques and growing
demand for guidelines & standardization.
Fixed Story pointing
1 Story Point = 10 Person Hours
1 Story Point = 1 Person Working Day
Expert Influence
Guestimate
Fallout:
In Accurate Estimates
No reflection of Improved Velocity. Hours based assignment of points
will not reflect the improved productivity
Current Estimation Practices
Marraju Bollapragada
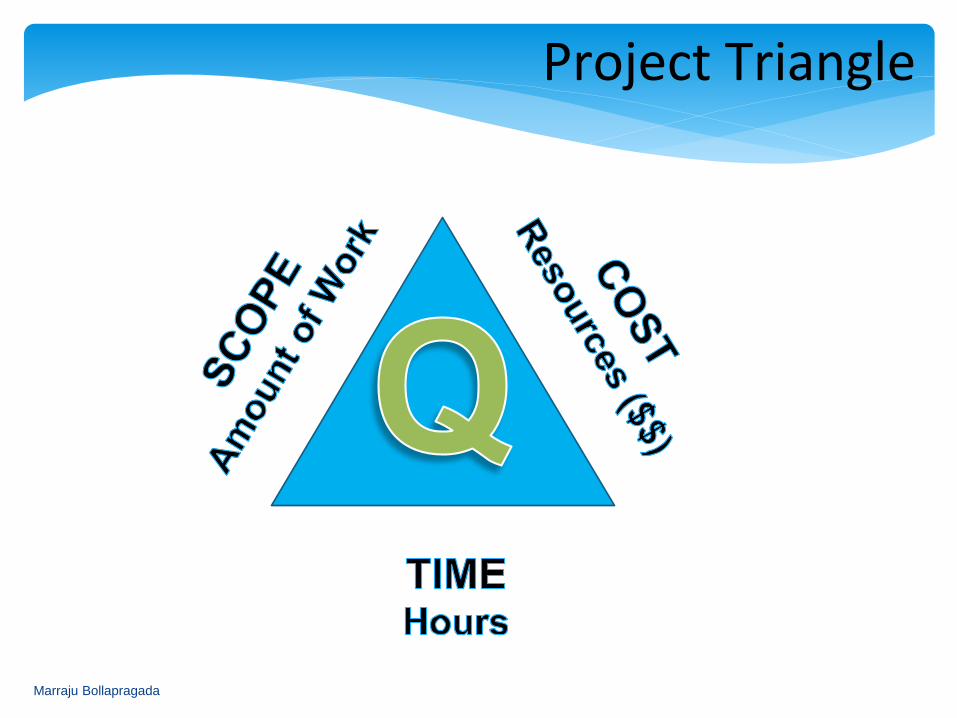
Project Triangle
Marraju Bollapragada

Velocity = Story Points (Scope) achieved per Sprint Capacity (Resources x Time)
Agile Velocity Triangle
Marraju Bollapragada

Work vs Velocity
Marraju Bollapragada
WORK VELOCITY
WORK is a defined scope irrespective of Resources & Time
‘VELOCITY’ is the rate at which the ‘RESOURCES’ completes ‘WORK’ within a given ‘TIME’ period.
Work is a measure of the business value earned or expected to earn
Velocity is the measure of a performance or productivity after execution
Work is estimated at planning stage using below techniques: • WBS (Vertical Slicing) • Relativity • Business Value
Velocity is calculated after execution based on the effort spent to complete a defined scope of work
• Work Estimation • Effort Estimation • Cost Estimation are 3 different terms & types of estimations
• Velocity is a Trend
• Burndown is a Log

Velocity = Story Points (Scope) achieved per Sprint Capacity (Resources x Time)
Agile Velocity Triangle
• Laying Slab of 1000 Sqft • Laying Road 40 ft x 5km • Producing 100 Laptops • Serving Food for 100
People • Developing an App for
Online Catalogue -???
• Laying Concrete Slab of 1000 Sqft –10$ /Sqft • Laying BT Road 40 ft x 5km – 5k$ /Km • Producing 100 Laptops- 500$ /Laptop • Serving Food for 100 People – 5$ /Plate • Delivering an App for Online Catalogue – Fixed
Cost or Earned Value basis
• Laying Concrete Slab of 1000 Sqft – 20 Days • Laying BT Road 40 ft x 5km – 25 Days • Producing 100 Laptops- 4 Days • Serving Food for 100 People – 5 Hours • Developing an App for Online Catalogue – Time Boxed/Effort based
Marraju Bollapragada
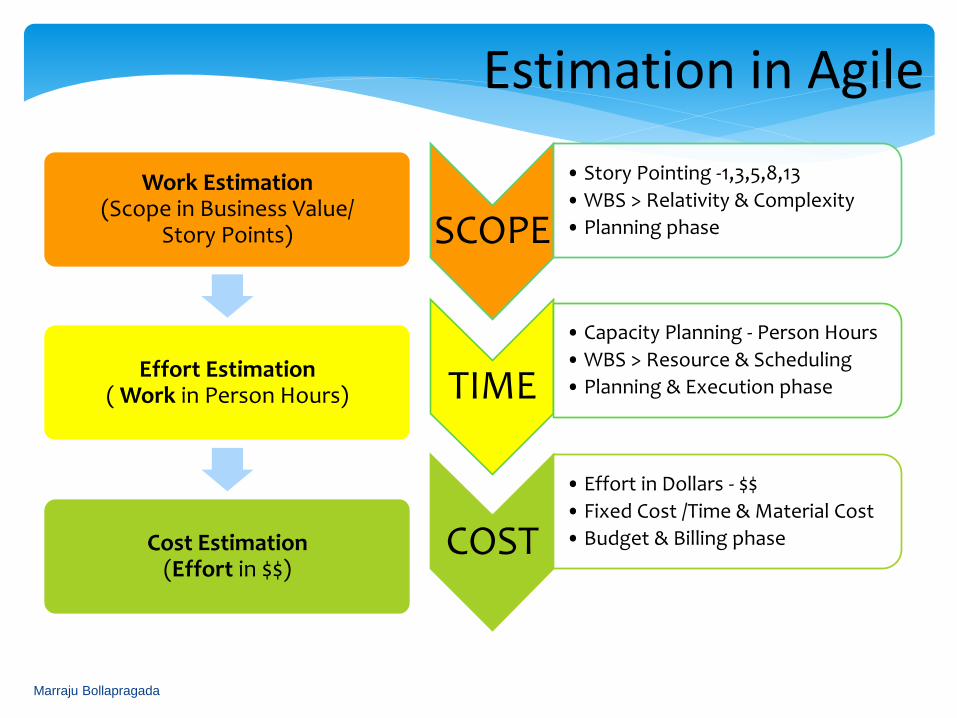
Estimation in Agile
SCOPE
• Story Pointing -1,3,5,8,13
• WBS > Relativity & Complexity
• Planning phase
TIME
• Capacity Planning - Person Hours
• WBS > Resource & Scheduling
• Planning & Execution phase
COST
• Effort in Dollars - $$
• Fixed Cost /Time & Material Cost
• Budget & Billing phase
Work Estimation (Scope in Business Value/
Story Points)
Effort Estimation ( Work in Person Hours)
Cost Estimation (Effort in $$)
Marraju Bollapragada

Estimating with MAGIC Approach – Measure, Analyze, Improve and Control without ‘Guess’ work Measure & Analyze using ‘Story Point Matrix’ based on
Functional & Technical Analysis
Improve & Control using Statistical Data Modeling based on Empirical Data extracted from agile project management tool
Proposed Solution- Approach
Marraju Bollapragada

Story Pointing - Technique
Create the Task Template for
Analysis
Design
Development
Testing
Packaging
Marraju Bollapragada
Story Point Matrix Empirical Data Model
Based on Expert Judgment Based on Empirical Data
Create Work Break Down Structure for the Scope • Epics to Sub Epics
• Sub Epics to Stories • Slicing Stories
• Stories to Tasks
Identify and analyze the • Functional Logic • Technical Implementation • Testing, Doc and Packaging requirements
Compare with relatively similar type of story executed previously
Identify the • Resources • Skill/Expertise • Technology • Tools • Complexity
• Identify the elements that are added/updated/upgrade across the layers
• Aggregate the count by functional & technical task type and assign the complexity factor
• Map the cumulative functional & technical points of the story to the Range in ‘Story Point Reference Table’ to size with appropriate Story Point
Look at the Empirical Data • Draw the Frequency Histogram (with + 3 SD) for
completed Story Points vs Actual Hours • Point the Story based on the estimated hours that
fall with in the +1SD of the mean in the Histogram
• Resources and Hours not considered
• Based on only Functional and Technical analysis
• Resources and Hours are considered
• Version Report (in Jira) which projects expected
completion date of project is based on empirical
data for the completed stories and hours spent
which is nothing but velocity.

: Story Point Matrix
Step#1 : Create ‘Story Point Reference Table’
Select the previously completed stories of different story point sizes, at least 3 stories for each
story point size
Create WBS for each of those stories by vertical slicing (as shown in next slide)
Identify the number (count) of elements/ interfaces/objects/components/TCs created/ updated/
upgraded for each of those tasks
Aggregate the count by functional & technical task types and assign the complexity factor
Take the total of cumulative functional & technical points
Repeat the above step for all the selected stories
Prepare the ‘Story Point Reference Table’ by defining the ranges for cumulative functional &
technical points by Story Points
Step#2: New Story#
Now create a similar story point matrix for new story and map the cumulative functional &
technical points of the story to the Range in ‘Story Point Reference Table’ to size with
appropriate Story Point
Marraju Bollapragada

: Story Point Matrix
Ex: Story Point Reference Table
Cum Func &
Tech Points
Range
Story
Point
0-10 1sp
10-30 2sp
30-50 3sp
50-80 5sp
80-130 8sp
>130 13sp
Story# Work Breakdown Structure (WBS)
Story#1
Functional & Technical Tasks
New Update Upgrade/
Execute Complexity Factor Cumulative
(count) (count) (count) cf Func &Tech Points
a b c 0.1/0.2/0.3/0.5/0.8/1 (D=a+b+c) x cf
User Interface
(No. of Elements)
Business Layer
(No. of Classes, Methods,
Functions, etc..,)
Database Layer
(No. of Database Objects)
Integration - API/WebServices
(No. of APIs/Services)
Environment Setup
(No. of Products Installed)
Manual Testing
(No. of Test Cases)
Automation Testing
(No. of Test Scripts)
Packaging/CM
Documentation
(No. of Topics)
Total of Cumulative
Story Points (from Reference
Table)
Marraju Bollapragada

Step#1: Create Frequency Histogram:
Extract the data from the agile project management tool for the completed stories after the completion of project
Group the stories by story point size
Prepare the frequency histograms
by Story Point (1,2,3,5,8)
by Release version (9x, 10x, etc.,)
with Hours on X- axis and Story Count (No. of Stories) on Y-axis
Take the Bin Range for Hours with +3 SD form the Average (Mean)
Mark the Mean and Hours at which the frequency peaks in the histogram
– Average No. of Hours taken to complete by
maximum Number of Stories
: Empirical Data Model
Standard Deviation
Bin/Range in Hours +3 SD
Frequency of 3 SP Stories # v10.x
-3SD -50.508989 0
-2SD -25.437739 0
-1SD -0.3664885 0
Average (Mean) 24.704762 134
+1SD 49.776012 53
+2SD 74.847263 12
0 0 0
134
53
12
-20
0
20
40
60
80
100
120
140
160
-75 -50 -25 0 25 50 75 100
No
of
Co
mp
lete
d S
tori
es
Actual Hours Spent to Complete Stories
Frequency of 3 SP Stories # v10.x
Frequency of 3 Story Point Stories…
Marraju Bollapragada

Step#2: Estimate New Story# based on Frequency Histogram:
List the Tasks of the new Story#, and Identify
the Resources and Hours required for
the delivery of the Story# as shown in the
‘Task Table’
Now map the ‘total estimated hours’ of the new
story# from the ‘Task Table’ to the matching
frequency histogram into which it falls within
the range of +1SD of the mean
Take that as a Story Point for the new Story#.
: Empirical Data Model
Task Table for Story#
Task Resources Hours
Analysis Task
Design Task
Development Task
Database Task
Testing Task
CM Task
Documentation Task
Total Estimated Hours
Story Point (from
Empirical Data in Step#1)
Marraju Bollapragada

: Empirical Data Model
Example:
Extracted the data from agile project management tool
for a solution suite based on below criteria and plotted
the ‘Frequency Histogram’:
Issue Type – Stories
Status – Completed
Release Version : 9.x & 10.x
Frequency Histogram plotted for – 1, 2, 3 & 5 Story point
stories
Marraju Bollapragada

0 0
22
119
61
10
-20
0
20
40
60
80
100
120
140
-100 -75 -50 -25 0 25 50 75 100 125
No
of
Sto
rie
s
Hours
Frequency for 2 SP # 9.x
Frequency for 2 SP # 8.1
0 0 0
177
68
15
-50
0
50
100
150
200
-75 -50 -25 0 25 50 75 100
No
. of
Sto
rie
s
Hours
Frequency for 1 SP # 9.x
Frequency for 1 SP # 8.1
0 0 0
94
36
17
-20
0
20
40
60
80
100
-20 -15 -10 -5 0 5 10 15 20 25
No
of
Sto
rie
s
Hours
Frequency for 1 SP # 10.x
Frequency for 1 SP # 9.0
0 0 0
67
34
7
-20
0
20
40
60
80
-75 -50 -25 0 25 50 75 100
No
of
Sto
rie
s
Hours
Frequency for 2 SP # 10.x
Frequency for 2 SP # 9.0
Marraju Bollapragada
Empirical Data Model - Histogram for 1 & 2 story point

0 0
30
141
69
18
-20
0
20
40
60
80
100
120
140
160
-200 -100 0 100 200 300
No
of
Sto
rie
s
Hours
Frequency for SP 5 # 9.x
Frequency for SP 5 # 8.1
0 0 0
257
103
34
-50
0
50
100
150
200
250
300
-150 -125 -100 -75 -50 -25 0 25 50 75 100 125 150 175 200
No
of
Sto
rie
s
Hours
Frequency for 3 SP # 9.x
Frequency for 3 SP # 8.1
0 0 0
134
53
12
-20
0
20
40
60
80
100
120
140
160
-75 -50 -25 0 25 50 75 100
No
of
Sto
rie
s
Hours
Frequency for 3 SP # 10.x
Frequency for 3 SP # 9.0
0 0
30
90
56
14
-50
0
50
100
-100 -50 0 50 100 150
No
of
Sto
rie
s
Hours
Frequency for SP 5 # 10.x
Frequency for SP 5 # 9.0
Marraju Bollapragada
Empirical Data Model - Histogram for 3 & 5 story point

Marraju Bollapragada
Create the Task Template for
Design
Development
Testing
Packaging
Story Point
STORY POINT MATRIX EMPIRICAL DATA MODEL
Range of Cum Func & Tech Points taken from Story Point Reference Table
Range of Actual Hours Spent to Complete the Stories taken from Empirical Data Model
1sp 0-10 10-25
2sp 10-30 25 - 50
3sp 30-50 50-75
5sp 50-80 75-100
8sp 80-130
13sp >130
Matrix - Example

Marraju Bollapragada
Create the Task Template for
Design
Development
Testing
Packaging
Technique Recommendation Suitability Story Point Matrix Estimation Empirical Data Model Estimation
New Product Yes No
New Team Yes No
New Functionality Yes No
New Technology/POC Yes No
Existing Product Yes Yes
Same Team Yes Yes
Same Code base Yes Yes
Same Technology Yes Yes
PMG/FA/BA Availability Must Depends
Definition of Ready Required Depends
Definition of Done Required Required
Finale Recommendation
Use the Story Point Matrix for regular Story Point Estimation by
measuring and analyzing the functional and technical tasks of
the story
Use the Empirical Data Model for retrospection/reviewing the team’s
performance on story sizing after the project completion and use as a
reference to improve and control

Marraju Bollapragada
Templates
Templates
https://docs.google.com/spreadsheets/d/1p5t3HH_FCNTM9dxlot
t8nZZbOxVSSrx8PY0v0D-c0PQ/edit?usp=sharing
Template for Story Point Matrix
https://docs.google.com/spreadsheets/d/1p5t3HH_FCNTM9dxlot
t8nZZbOxVSSrx8PY0v0D-c0PQ/edit#gid=1590278669
Template for Empirical Data Model
https://docs.google.com/spreadsheets/d/1p5t3HH_FCNTM9dxlot
t8nZZbOxVSSrx8PY0v0D-c0PQ/edit#gid=188166086

Marraju Bollapragada
References from Mike Cohn’s (Mountain Goat Software) Blog: Template for Story Points Are Still About Effort
http://www.mountaingoatsoftware.com/blog/story-points-are-still-about-effort
Seeing How Well a Team’s Story Points Align from One to Eight
http://www.mountaingoatsoftware.com/blog/seeing-how-well-a-teams-story-points-align-from-one-to-eight
How Do Story Points Relate to Hours?
http://www.mountaingoatsoftware.com/blog/how-do-story-points-relate-to-hours
References
