estácio: 4q14 and 2014 conference call presentation
TRANSCRIPT

2014 Results
Rogério Melzi | CEO
Virgílio Gibbon | CFO

Long Term→ Estácio 2020
Discipline to Strategy
Sector consolidation
FIES
Corporate Culture
Innovation
Quality System
Focus on the Students and their Employability
Investments in Service and Hospitality
Branding
2020 Academic Model
Adequate level of returns to ours shareholders
Corporate Governance2
Estácio: Pillars of Growth
Until 2008 2009 20102011 2012
2013
2015-2020
Disorganized Growth Turnaround Harvesting the Results Future
2014
We painted the entire Map Blue!
On-campus + DL

63%58% 59%
72%77%
2010 2011 2012 2013 2014
3
Harvesting the Results
Employee Satisfaction
56% 56%62%
65% 65%68%
73%
2008 2009 2010 2011 2012 2013 2014
58% 60%64% 64% 67% 68%
73%
2008 2009 2010 2011 2012 2013 2014
PESA – Student Satisfaction Survey (On-Campus) PESA – Student Satisfaction Survey (DL)

65,0 95,0 92,0 123,0210,0
320,0
533,0
6,6%
9,4% 9,1%10,7%
15,2%
18,5%
22,2%
2008 2009 2010 2011 2012 2013 2014
218 206 210 240
272
316
437
2008 2009 2010 2011 2012 2013 2014
4
Harvesting the Results
CAGR => 12.3%
CAGR => 42.1%
Post Secondary Student Base (excl. technical / short-term courses)
EBITDA(R$ million)
(000’ students)

Operational Performance
436,0
652,4
168,8
235,4
4Q13 4Q14
NET REVENUE - 4Q14
604.8
887.7+46.8%
+49.6%
Average Ticket (In R$) 4Q13 4Q14 Change
On-campus 525.6 580.6 10.5%
Distance Learning 179.6 189.7 5.6%
STUDENT BASE
255,0301,7
60,7
83,0
52,7
4Q13 4Q14
315.7
+38.5% 437.4
+18.3%
(000’ students)
Distance Learning
On Campus
Total Student Base
Aquisitions - 12 months
(In R$ million)
Net Revenue Deduction
Gross Revenue
Note:Total base including undergraduate and graduate students.
+36.7%
1.731,0
2.404,5
760,0
1.011,5
2013 2014
NET REVENUE - 2014
2,491.0
3,416.0+26.3%
+25.1%
(In R$ million)
Net Revenue Deduction
Gross Revenue
5

Cost and Operational Expenses
Vertical Analysis
(% of Net Operating Revenue)4Q13 4Q14 Change 2013 2014 Change
Cash Cost* -59.7% -54.1% 5.6 p.p. -57.1% -54.3% 2.8 p.p.
Personnel -36.1% -33.7% 2.4 p.p. -35.6% -34.7% 0.9 p.p.
Brazilian Social Security Institute (INSS) -8.1% -6.5% 1.6 p.p. -7.2% -6.8% 0.4 p.p.
Rentals. Condominium Fees and
Municipal Property Tax-8.3% -7.2% 1.1 p.p. -8.0% -7.3% 0.7 p.p.
Textbooks Materials -3.6% -3.5% 0.1 p.p. -2.8% -2.5% 0.3 p.p.
Others -3.6% -3.1% 0.5 p.p. -3.4% -2.9% 0.5 p.p.
Selling Expenses -10.1% -9.7% 0.4 p.p. -10.6% -9.9% 0.7 p.p.
PDA -7.5% -6.0% 1.5 p.p. -5.5% -4.3% 1.2 p.p.
Marketing -2.6% -3.7% -1.1 p.p. -5.1% -5.6% -0.5 p.p.
G&A Expenses* -15.2% -15.9% -0.7 p.p. -13.8% -13.7% 0.1 p.p.
*Cost of Services and G&A expenses excluding depreciation.6

7
EBITDA
EBITDA – 4Q14
65,8
133,1
15,1%
20,4%
4Q13 4Q14
EBITDA EBITDA Margin
EBITDA – 2014
EBITDA EBITDA Margin
(In R$ million) (In R$ million)
1EBITDA in accordance with the CVM instruction 527, does not consider Operating Financial Result
+102.2% +66.3%
320,3
532,6
18,5%
22,2%
2013 2014
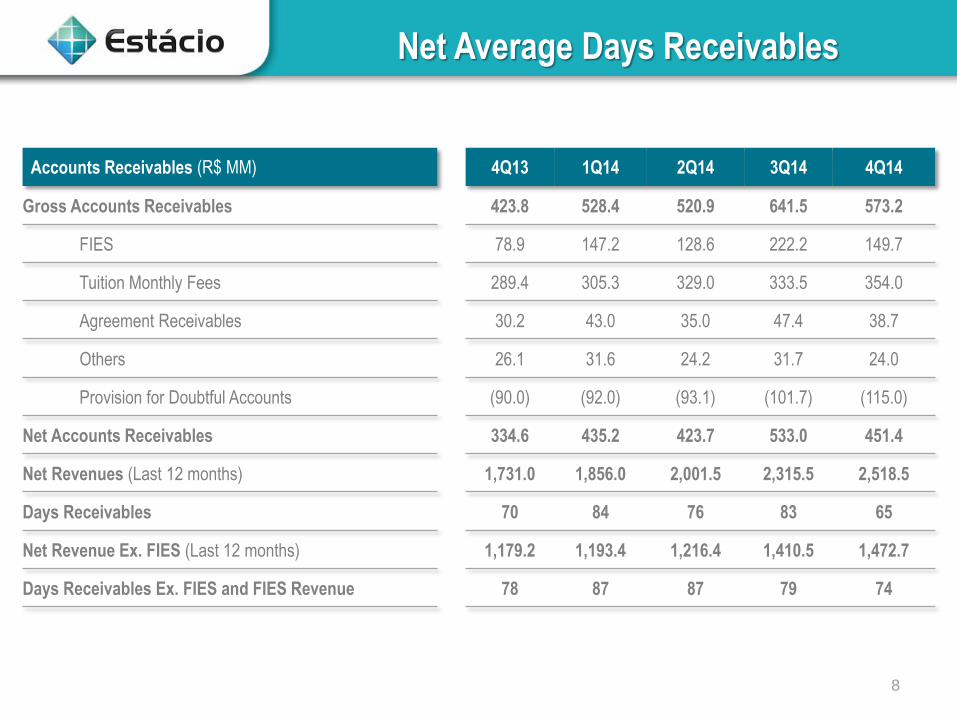
Net Average Days Receivables
Accounts Receivables (R$ MM) 4Q13 1Q14 2Q14 3Q14 4Q14
Gross Accounts Receivables 423.8 528.4 520.9 641.5 573.2
FIES 78.9 147.2 128.6 222.2 149.7
Tuition Monthly Fees 289.4 305.3 329.0 333.5 354.0
Agreement Receivables 30.2 43.0 35.0 47.4 38.7
Others 26.1 31.6 24.2 31.7 24.0
Provision for Doubtful Accounts (90.0) (92.0) (93.1) (101.7) (115.0)
Net Accounts Receivables 334.6 435.2 423.7 533.0 451.4
Net Revenues (Last 12 months) 1,731.0 1,856.0 2,001.5 2,315.5 2,518.5
Days Receivables 70 84 76 83 65
Net Revenue Ex. FIES (Last 12 months) 1,179.2 1,193.4 1,216.4 1,410.5 1,472.7
Days Receivables Ex. FIES and FIES Revenue 78 87 87 79 74
8

FIES
FIES Accounts Receivable (R$ MM) 4Q13 1Q14 2Q14 3Q14 4Q14
Opening Balance 100.2 78.9 147.2 128.6 222.2
(+) FIES Net Revenue 171.4 225.7 289.6 296.3 321.8
(-) Transfer 180.9 146.5 293.8 190.6 378.3
(-) FIES Deduction/Provision 11.1 10.8 14.5 14.8 16.0
(+) Acquisitions -0.7 - - 2.6 -
Ending Balance 78.9 147.2 128.6 222.2 149.7
FIES Carry-Forward Credits (R$ MM) 4Q13 1Q14 2Q14 3Q14 4Q14
Opening Balance 0.3 44.4 63.6 82.4 50.0
(+) Transfer 180.9 146.5 293.8 190.6 378.3
(-) Tax payment 50.7 40.5 70.8 70.2 78.9
(-) Repurchase auctions 86.2 86.8 204.3 152.8 265.9
(+) Acquisitions - - - - -1.8
Ending Balance 44.4 63.6 82.4 50.0 81.7
FIES Average Days Receivables 4Q13 1Q14 2Q14 3Q14 4Q14
FIES Days Receivables 80 115 97 108 809

10
Cash Flow
Cash Flow Statement (R$ million) 4Q13 4Q14 2013 2014
Profit before income taxes and social contribution 50.6 81.2 256.7 432.9
Adjustments to reconcile profit to net cash generated: 57.0 93.8 187.6 222.5
Result after reconciliation to net cash generated 107.6 175.0 444.3 655.4
Changes in assets and liabilities: (109.7) (50.4) (245.0) (232.7)
Net cash provided by (used in) operating activities: (2.2) 124.7 199.3 422.7
CAPEX (Ex-Acquisitions) (56.0) (61.6) (132.3) (189.1)
Operational Cash Flow: (58.2) 63.1 67.0 233.6
Other investing activities: (7.1) (70.1) (40.6) (1,016.0)
Net cash provided by (used in) investing activities (65.2) (7.0) 26.4 (782.4)
Cash flows from financing activities: (1.6) 287.2 572.3 758.3
Net cash provided by (used in) financing activities (66.9) 280.2 598.7 (24.1)
Cash and cash equivalents at the beginning of the period 806.1 434.9 140.5 739.2
Increase in cash and cash equivalents (66.9) 280.2 598.7 (24.1)
Cash and cash equivalents at the end of the period 739.2 715.1 739.2 715.1

11
UniSEB Integration
Distance-learning undergraduate intake
- 2014.3 → +165%
- 2014.4 → +20%
Migration of a portion of the student base from the
telepresence model to the 100% online model
Conclusion of the first wave of students migrating
from partner centers to Estácio’s own units
43% of the centers will be accredited to offer
distance-learning undergraduate courses under
the Estácio system
Medical course → 40 places - 41,6 candidates for
each place
More:- Standardization of visual identity
- Relationship and training actions of UniSEB’s
employees
Distance Learning Operation
CSC
Integração de Processos
Back-office integration
Standardization of financial and accounting
processes
Synergy gains
Significant improvement of 4T14 x 3T14
results, with increasing revenue and earnings
in G&A Expenses

12
UniSEB Results
Income Statement UniSEB(R$ million)
3Q14 4Q14 2H14
Gross Operating Revenue 30.7 35.3 66.1
Gross Revenue Deductions (5.8) (7.0) (12.9)
Net Operating Revenue 24.9 28.3 53.2
Cash Cost of Services (8.5) (12.1) (20.6)
Personnel (6.7) (9.8) (16.5)
Rentals / Real Estate Taxes Expenses (1.0) (1.0) (2.0)
Textbooks Materials (0.4) (0.7) (1.2)
Third-Party Services and Others (0.3) (0.6) (0.9)
Cash Gross Income 16.4 16.2 32.6
Gross Margin 65.9% 57.2% 61.2%
Selling Expenses (2.5) 1.4 (1.2)
Provisions for Doubtful Accounts (1.9) 1.6 (0.3)
Marketing (0.7) (0.2) (0.9)
General and Administrative Expenses (5.6) (1.4) (7.0)
Personnel (2.6) (0.0) (2.6)
Others (3.0) (1.4) (4.4)
EBITDA 8.2 16.1 24.3
EBITDA Margin 33.1% 56.9% 45.8%
Financial result (1.2) (1.0) (2.3)
Depreciation and amortization (1.4) (1.4) (2.8)
Social Contribution (0.3) (0.6) (1.0)
Income Tax (1.0) (1.8) (2.8)
Net Income 4.4 11.2 15.6
Net Income Margin 17.5% 39.6% 29.3%

13
New Loan
Final cost of the operation
Principal in US$ = 61.2MM
Term = 361 days
Rate in USD = 1.4625% p.y. + Income Tax
Technical Features - Loan Technical Features - Swap
Principal in US$ = 61.2MM
Principal in R$ = 200.0MM
Term = 361 days
Rate in USD = 1.9500% p.a.
Rate in R$ = CDI + 0.12% p.a.
(100.8% of CDI)

14
About FIES
Government Students
• Do not discuss matters related to the size of the FIES...
• We are putting all our efforts to respect the contracts which were previously agreed
• FIES program is important for the student’s professional development and for Brazil in general. In this
context, we will continue working for its sustainable expansion
15
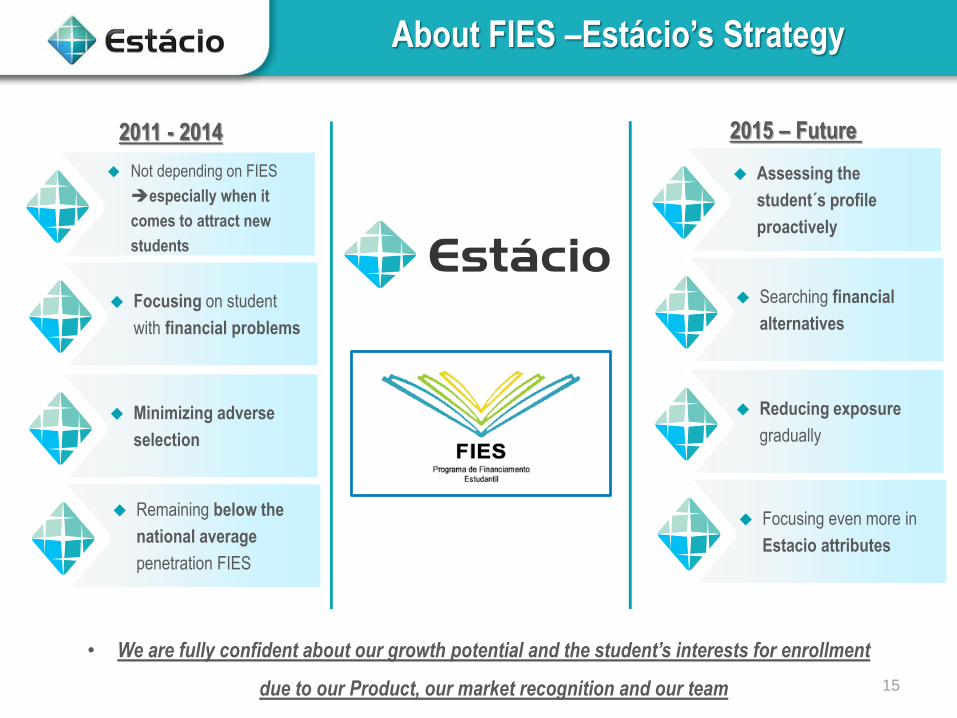
About FIES –Estácio’s Strategy
• We are fully confident about our growth potential and the student’s interests for enrollment
due to our Product, our market recognition and our team
Assessing the
student´s profile
proactively
Searching financial
alternatives
Reducing exposure
gradually
Focusing even more in
Estacio attributes
Not depending on FIES
especially when it
comes to attract new
students
Focusing on student
with financial problems
Minimizing adverse
selection
Remaining below the
national average
penetration FIES
2011 - 2014 2015 – Future
16
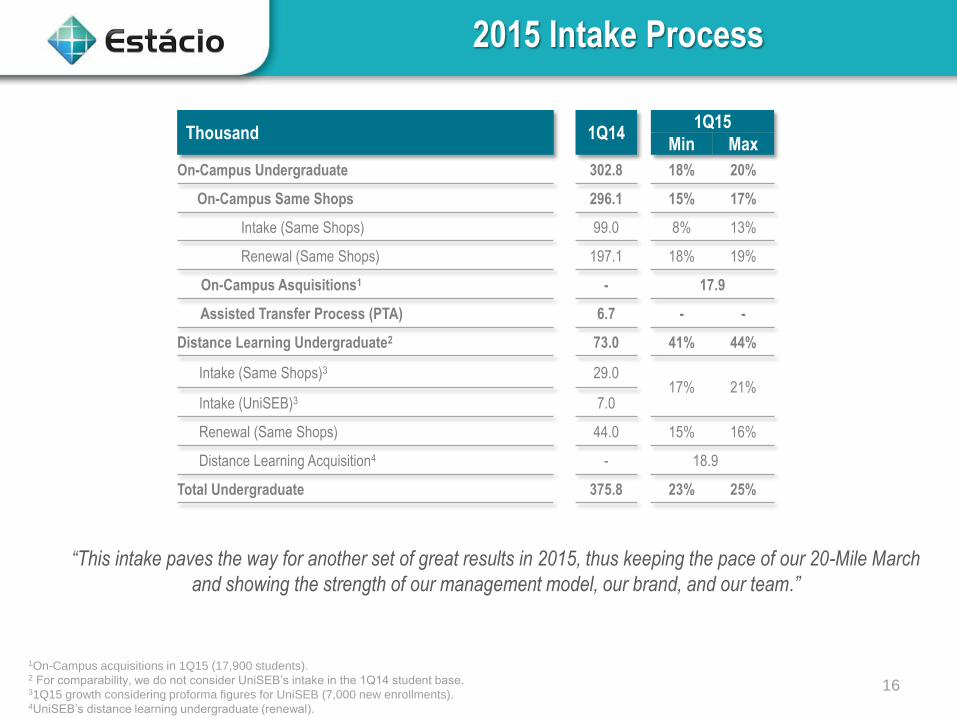
2015 Intake Process
“This intake paves the way for another set of great results in 2015, thus keeping the pace of our 20-Mile March
and showing the strength of our management model, our brand, and our team.”
Thousand 1Q141Q15
Min Max
On-Campus Undergraduate 302.8 18% 20%
On-Campus Same Shops 296.1 15% 17%
Intake (Same Shops) 99.0 8% 13%
Renewal (Same Shops) 197.1 18% 19%
On-Campus Asquisitions1 - 17.9
Assisted Transfer Process (PTA) 6.7 - -
Distance Learning Undergraduate2 73.0 41% 44%
Intake (Same Shops)3 29.017% 21%
Intake (UniSEB)3 7.0
Renewal (Same Shops) 44.0 15% 16%
Distance Learning Acquisition4 - 18.9
Total Undergraduate 375.8 23% 25%
1On-Campus acquisitions in 1Q15 (17,900 students).2 For comparability, we do not consider UniSEB’s intake in the 1Q14 student base.31Q15 growth considering proforma figures for UniSEB (7,000 new enrollments).4UniSEB’s distance learning undergraduate (renewal).
17
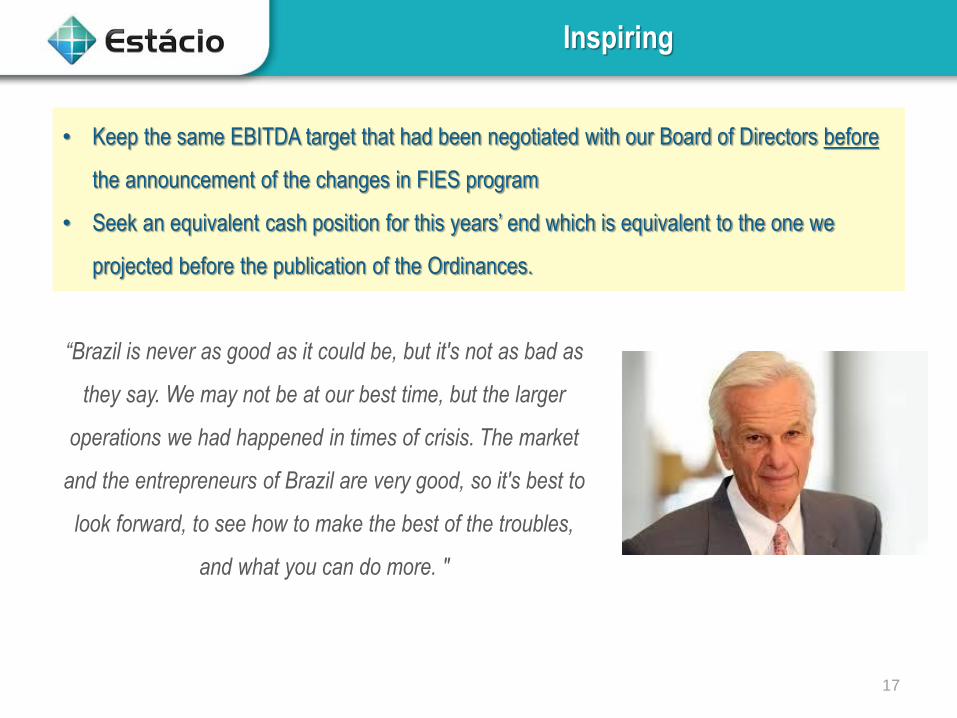
Inspiring
“Brazil is never as good as it could be, but it's not as bad as
they say. We may not be at our best time, but the larger
operations we had happened in times of crisis. The market
and the entrepreneurs of Brazil are very good, so it's best to
look forward, to see how to make the best of the troubles,
and what you can do more. "
• Keep the same EBITDA target that had been negotiated with our Board of Directors before
the announcement of the changes in FIES program
• Seek an equivalent cash position for this years’ end which is equivalent to the one we
projected before the publication of the Ordinances.

IR Contacts
This presentation may contain forward-looking statements concerning the industry’s prospects and Estácio Participações’ estimated financial and operating results;these are ere projections and. as such. are based solely on the Company management’s expectations regarding the future of the business and its continuousaccess to capital to finance Estácio Participações’ business plan. These considerations depend substantially on changes in market conditions. government rules.competitive pressures and the performance of the sector and the Brazilian economy as well as other factors and are. therefore. subject to changes withoutprevious notice. We are a holding company. and our only assets are our interests in SESES. STB. SESPA. SESCE. SESPE. SESAL. SESSE. SESAP. UNEC. SESSA andIREP. and we currently hold 99.9% of the capital stock of each of these subsidiaries. Considering that the Company was incorporated on March 31 2007. theinformation presented herein is for comparison purposes only. on a proforma unaudited basis. relative to the first three months of 2007. as if the Company hadbeen organized on January 1 2007. Additionally. information was presented on an adjusted basis. in order to reflect the payment of taxes on SESES. our largestsubsidiary. which from February 2007. after becoming a for-profit company. is subject to the applicable taxation rules applied to the remaining subsidiaries.except for the exemptions arising out of the PROUNI – University for All Program (“PROUNI”). Information presented for comparison purposes should not beconsidered as a basis for calculation of dividends. taxes or for any other corporate purposes.
Investor Relations:
Flávia de Oliveira
Arthur Assumpção
Fernanda Assis
Email: [email protected]
Phone: +55 (21) 3311-9789
Fax: +55 (21) 3311-9722
Address: Av. Embaixador Abelardo Bueno. 199 – Office Park – 6th floor
ZIP Code: 22.775-040 – Barra da Tijuca – Rio de Janeiro – RJ – Brazil
Website: www.estacioparticipacoes.com/ir