esso exploration & production chad inc. land use …...issues regarding the quality of the...
TRANSCRIPT

EMP 2010 Annual Individual Report on Vulnerability 1
Esso Exploration & Production Chad Inc. Land Use Mitigation Action Plan Annual Individual Livelihood Restoration Report 2010
June 2011

EMP 2010 Annual Individual Report on Vulnerability 2
List of Acronyms & terms used in this report
HH
HHH
HHM
Eligible
Potential Eligible
BBS
CFA
COFEMAB
CRCP
ECMG
EEPCI
EMP
EMP IS
GIS
GoC
IFC
ITRAD
KPI
LCC
LMM
LUMAP
MARP
NGO
ONDR
SSP
WARDA
WBG
Land holding status Zero
Non-viable
Marginal
Comfortable
Wealthy
At-risk
Household
Household Head (Chef de Ménage)
Household Member. Include the CdM and all it dependents, regardless their age.
Generic term to designate an individual that is eligible to the EMP Resettlement Program.
Individual that may be eligible to the EMP Resettlement Program.
Analysis must be completed.
Basic Business Skills Training
Central African Francs
Coopérative des femmes de Madjo-Béro
Chad Resettlement and Compensation Plan
External Compliance Monitoring Group
Esso Exploration and Production Chad Inc
Environmental Management Plan
EMP Information System
Geographic Information System
Government of Chad
International Finance Corporation
Institut Tchadien de Recherche Agronomique Développement
Key Performance Indicators
Local Community Contact
Land Management Manual
Land Use Mitigation Action Plan
Méthode Accélérée de Recherche Participative
Non Governmental Organization
Office National du Développement Rural
Site Specific Plan
West Africa Rice Development Association
World Bank Group
No land holdings
Less than 2/3 cordes per HHM or 0,67 corde per HHM
0.68 to 1 cordes per HHM
1 to 2.5 cordes per HHM
2.5 cordes per HHM and above
Non-viable + Marginal land holding status
Note on Data
In comparing data between tables and years, inconsistencies in numbers are due to the ever-evolving nature of
the data (more fields belonging to M. Ngar….have been measured in another village; a “dependant” who, with
further information, turns out to really belong to another HH). The overall messages delivered by the tables in
this document remain the same, despite slight increases or decreases. The tables have been calculated as of
December 31st, 2010 whereas the data keeps evolving.

EMP 2010 Annual Individual Report on Vulnerability 3
TABLE OF CONTENTS Page
Executive summary 5-8 Introduction 9
Part I: Village survey Results 10 1.0 Village level survey 11
1.1. Overview of Surveyed Villages 11 1.2. Traditional coping mechanisms in surveyed villages 13
1.2.1. Village splits 14 1.2.2. Non-agricultural productive resources 15
1.3. Gender issues in surveyed villages 17 1.4. Age distribution in surveyed villages 20 1.5. Status difference in surveyed villages 20 1.6. Land holding differences within villages 22
1.6.1. Project compensation and land acquisition as a cause of non- 22 viability or marginality
1.6.2. Project compensation and land acquisition and the creation 23 of resources haves ad have-nots.
2. Deriving Project impact on households productive resources from 26 village surveys
2.1. Effect of Project land acquisition on households productive resources 26 2.2. Changes in HH landholding status 27
3. Conclusions on village survey 29 Part 2: Household results 30 1.0 Household results 31
1.1 At risk Project-affected HH in 15 villages 31 1.2 Level of Livelihood restoration on non-viable HH through their 32
resettlement option in 15 villages 1.3 Effective actions increasing the likelihood of livelihood restoration 34
1.3.1 Basic business skills 34 1.3.2 Improved agriculture training 39 1.3.3 Training in reinforcement and specialization 41 1.3.4 Land replacement resettlement options 42
1.3.4.1 Generate new farm land from waterside lowlands 42 1.3.4.2 Establishing a rice field as a means of reclaiming a 44 drilling pad 1.3.4.3 Improving the soil quality of returned land parcels 46
1.4 Level of Livelihood Restoration among Reinforced Training Graduates 47
2.0 Households at risk 49 2.1 Integrated land use management: 51
land acquisition with livelihood protection Part 3: Conclusions on LUMAP findings 53 Conclusion on LUMAP findings 54 Annexes 56

EMP 2010 Annual Individual Report on Vulnerability 4
LIST OF TABLES Page Table 1: Key village level indicators 12 Table 2: Village with access to fishing 15 Table 3: Comparison of Vulnerability by age in 15 surveyed villages 18 Table 4: % of HH compensated because of Project land acquisition 23 Table 5: Non viable and marginal HH in less compensated villages 24 Table 6: Population change from 1993 to 2005 25 Table 7: Comparison of viability level between the initial evaluation 31
(declarative) and the reality (survey). Table 8: HH with Resettlement Options 32
Table 9: Level of livelihood income from all trained HHM 33 Table 10: Earning in thousand of FCFA by month by educational level 36 Table 11: Graduates using skills or not by education by educational level 37 Table 12: Previous education level and performance through BBS 38 Table 13: Outline of the fields of reinforcement and rate of 41
sustainability, 2009 Table 14: Non-Viable Reinforced Households' Livelihood Restoration 41 LIST OF FIGURES Figure 1: Range of landholding by gender 17 Figure 2: Distribution of Land Holdings by gender of HHH 17 Figure 3: Distribution of land among HH by size 18 Figure 4: Number of HH with land holding status by age 19 Figure 5 Distribution of eligible HH by age of HHH in surveyed villages 20 Figure 6 Number of HH with age by land holding status categories 22 Figure 7 Land taken from at-risk households in 15 surveyed villages 26 Figure 8: Distribution of land in 14 surveyed villages 26 Figure 9: Age distribution by household class 50 Figure 10: Age distribution non-viable & marginal HH size 50

EMP 2010 Annual Individual Report on Vulnerability 5
EXECUTIVE SUMMARY The purpose of the Esso Exploration & Production Chad Inc (EEPCI) (the Project) Annual
Individual Report is to provide information on the number of people currently at risk
agriculturally because of Project land take impacts. It also follows the results of livelihood
restoration activities completed, initiated or ongoing over the past year. The percent of
individuals/households whose situations have been resolved or improved by the Project
over the past year provides a measure of the efficacy of both the EEPCI Environmental
Management Plan department’s (EMP) programs and procedures regarding livelihood
restoration.
2010 EMP Livelihood Restoration Highlights Land Use Mitigation Action Plan (LUMAP) Action Areas Completed – transitioning to
ongoing Socioeconomic program and procedures
Village Land Use Surveys - Given the completion of the Village Land Use Surveys in 15
villages of the OFDA and the integration of the Synergy, Impact and Land Return team
into the overall process it is now possible to deal with vulnerable HH at the onset of the
compensation process. Insuring that data on vulnerable affected households, previously
collected through the Village Land Use Surveys, is upgraded and that the appropriate
Relocation options are offered to the eligible. With the integration of these processes
into the daily activities of the EMP Socio-economic Section, EMP is progressively
completing the transition from LUMAP as a special project to ongoing EMP
Socioeconomic Section work process and procedures.
Site Specific Plans (SSP) – SSP’s were completed for Maïkéri and Poutouguem and
posted on the www.essochad.com website.
2010 Basic Business Skills Training (BBS) Highlights - 66 resettlement eligible people
(eligibles), 68 spouses of eligibles and 120 auditors (BBS is taught in the villages in an
open format – non eligible villagers are welcome to participate) completed their training`.
Over the first two years of this program, over 591 people participated in this training and
achieved a reasonable level of proficiency in reading, writing, math and basic business
management.

EMP 2010 Annual Individual Report on Vulnerability 6
2010 Improved Agriculture Highlights – In 2010, training in improved agriculture was
started with 11 eligibles. After completing their rainy season training and receiving their
rainy season grant equipment, they were combined with 45 eligibles from the 2009 class
for the dry season training in their option of choice. Having implemented a new
procurement process for both rainy and dry season equipment, we are hopeful that
issues regarding the quality of the equipment supplied will not arise in the future.
Livelihood Restoration Monitoring – In view of the data collected through the village
land use survey it was possible to identify the truly non-viable eligibles out of all those
who had received improved agriculture training as a restoration option over the last 10
years. This process resulted in a list of 265 graduates qualified for a second round of
monitoring. The monitoring of these graduates is well underway.
The above process eliminated over 400 False Positives (farmers who had plenty of land
and did not qualify for Resettlement) from the EMP Resettlement rolls. This allows EMP
to focus on the True Positives resettlement training program graduates
Rice Pilot Project – Generating new farm land from riverine lowlands through the
establishment of rice fields as a pilot project proved to be an agricultural success.
Unfortunately, the social, cultural and institutional part of the pilot project failed.
The pilot project rice plots were built by the farmers on floodplain lands in the villages of
Madjo-Béro and Madana Nadpeur. 75 farmers (mix of eligible farmers and farmers
selected by the village chiefs) from 6 different villages built the plots and planted,
cultivated and harvested the rice. The pilot project design was developed by the Africa
Rice Center (AfricaRice – formerly known as the West Africa Rice Development
Association (WARDA)) in collaboration with EEPCI and primarily the farm extension
service agency of the Ministry of Agriculture - Office National de Développement Rural
(ONDR).
K 744 Women’s Cooperative (COFEMAB) – EEPCI built (using heavy equipment) a rice
seed bed plot to the specifications developed by AfricaRice as a means of providing a
Improved Agriculture reinforcement training project for the Madjo Bero women’s
vegetable gardener cooperative known as COFEMAB. The seed bed was built on the K
744 well pad site (K 744 was never drilled). COFEMAB was trained by AfricaRice and
ONDR and provided seed, inputs and equipment by EEPCI. Not only did this initiative

EMP 2010 Annual Individual Report on Vulnerability 7
demonstrate that it is possible to construct productive rice paddies with heavy
equipment, it also illustrated that the right social conditions are possible (agricultural and
socioeconomic success for the COFEMAB) in the OFDA. EMP will monitor the
COFEMAB rice seed and market garden vegetable plot over the next 2 agricultural
seasons. The focus of the monitoring will be to measure ongoing success of this farmer
cooperative.
The success of the COFEMAB will serve as a model if and when it is feasible for EEPCI
to offer rice seed plots as a Supplemental Community Compensation project.
Mucuna pruriens at KBP 6 (Kome Borrow Pit #6) and MBP 8 (Miandoum Borrow Pit #8) – Thirty (30) hectares of Mucuna were planted in the spring of 2010 at the two above
named borrow pits to answer village questions about the efficacy of the top soil EEPCI
imported from the Kome 5 Air Strip ends spoils for use in reclaiming these borrow pits for
agriculture in 2008.
The Bero and Ngalaba village farmers refused to plant crops in these reclaimed borrow
pits stating that the soil was poor quality.
EEPCI contracted a local contractor and nursery in Deli to grow sufficient Mucuna seeds
to plant test plots totaling 30 hectares. The local contractor plowed the fields and hired
local farmers (some of them were land users associated with these land areas) to plant,
cultivate and protect the crop from livestock and bird predations. The Mucuna grew
luxuriantly.
At the end of the season, the farmers were invited to harvest the Mucuna seed (good for
many uses) and were provided additional training on how to “green mulch” the Mucuna
and plant sorghum and peanuts the following agricultural year. Unfortunately, the farmers
chose to not harvest the Mucuna and burned the fields. It is yet to be seen if the farmers
will plant sorghum and/or peanuts in these fields in the 2011 agricultural year.
Therefore, this pilot test was determined to be an agricultural success but a
socioeconomic failure. The cost, planning and scheduling requirement and primarily the
uncertainty of the farmers taking ownership of the fields discouraged EEPCI EMP from
pursuing the “green mulch” any further

EMP 2010 Annual Individual Report on Vulnerability 8
Land Management Manual Update
The Land Management Manual was updated incorporating all of the Management of
Change (MoCs) approved since September 2008 and integrating the Synergy and Impact
work process improvements was initiated in mid 2010 and completed in early second
quarter 2011. The work process flow charts were improved and translated in both
English and French. Training on the updated procedures is ongoing.
2011 Resettlement Eligible Promotion
There are 90 eligible people enrolled in the 2011 promotion. At present they are
matriculating the BBS Training. Once they graduate in May 2011, they will begin
Improved Agriculture Training.
A significant highlight was achieved during the organizing the 2011 Promotion. It had to
do with 22 farmers that previously chose the land replacement option as their
resettlement option requesting to change their option to Improved Agriculture Training.
EEPCI EMP reviewed the land holdings of these people and determined that they did not
have sufficient land to enroll in Improved Agriculture. However, EMP offered them the
chance to acquire sufficient “permanent” land to qualify for Improved Agriculture by a
certain date. The farmers asked EMP to calculate the exact amount of land each of them
needed to qualify for Improved Agriculture. 17 of the 22 were able to acquire sufficient
land through their traditional land allocation/acquisition processes. EMP worked with
each farmer and land source provider to certify that they indeed had acquired sufficient
land with permanent use rights.
This represents a breakthrough in the so called land for land dead lock. EMP plans to
incorporate this learning and technique as the IMPACT Surveys are completed
resettlement eligible farmers identified throughout the year that do not have sufficient land
for Improved Agriculture Training.

EMP 2010 Annual Individual Report on Vulnerability 9
Community Compensation • Completed delivery of Supplemental Community Compensation projects to 13 of 15
most impacted villages in the Three Fields (Kome, Miandoum, and Bolobo). Two
villages (Dokaidilti and Bero 3) requested rice projects. Once the final report and
design basis for rice seed bed plots is provided by AfricaRice, EEPCI will bid the work
to local contractors. If the contractors return bids that fit within the EEPCI
Supplemental Community Compensation budget guidelines, the villages will be
presented with the design. If the villages decide not to accept the design (e.g. too
small a plot) then they will have to choose from the current Community Compensation
catalog offerings for project construction in 2012 (current work in the Maikeri Satellite
Oil Field Community Compensation projects has consumed the construction capacity
of the two subcontractors selected for the projects in 2011 and early 2012).
• Completed delivery of first time Community Compensation projects to the remaining
villages, cantons and sub-prefecture of the Nya and Moundouli Satellite Oil Fields. In
total, 70 projects were built for 33 villages and 3 sub-prefectures.
2011 Work Plan • Develop a process to give an overall perspective of the level of livelihood taking
into account land base agriculture, livestock production, fishing, and food
processing and non-agriculturally based economic activities.
• Continue utilization of the Synergy and Impact Teams to identify and assess
resettlement eligible people on a real time basis as land is acquired for Project
use.
• Develop processes to interpret and integrate data collected through the various
initiatives (Synergy, Impact, Livelihood Restoration monitoring)
• Conduct Land Return Usage Surveys to determine use of returned land by either
compensated individuals or other people
• Develop a work plan to assess use of fragmented fields post land take
• Continue to improve the delivery of BBS
o Train the trainer to deliver micro business training to promotion
o Train the community level management committees who selected water wells
or flour mills as a community compensation to run these projects as effective
and efficient small businesses
o Trainers living in the villages to provide additional help to the trainees

EMP 2010 Annual Individual Report on Vulnerability 10
• Continue to improve the delivery of Improved Agriculture Training:
o Course content – meaningful and useful modules
o Hands on training versus class room lectures
o Trainers living in the village to provide additional help to trainees
• Continue to improve the quality and timely delivery of grant equipment and
livestock
o Selection of provider through a more stringent bidding process
o Quality assurance and quality control with the provider of the equipment and
livestock
• Continue to improve the EMP internal procedures on data analysis, stewardship,
and planning
o Damage Claim Management
o Consultation, e.g. Grievance and Complaint management
o Determine impact thresholds for additional Supplemental Community
Compensation in the in fill drill impacted villages
• Supplemental Community Compensation to Maikeri Village (village chose a 3
Classroom School – currently under construction)
• Supplemental Community Compensation decision at Dokaidilti and Bero 3 Villages
• First Time Community Compensation to Poutouguem, Maymbaye, Bekia 2, Bekia
3, Morkete, and Bedara (Miladi Canton) villages. To date, the villages have
selected:
o Poutouguem – 3 Classroom School (currently under construction)
o Morkete – Flour Mill (currently under construction)
o Bekia 2 – Flour Mill (currently under construction)
o Maymbaye – Flour Mill
o Bekia 3 – Flour Mill
o Bedara – Flour Mill

EMP 2010 Annual Individual Report on Vulnerability 11
Introduction By the end of 2010, the Socio-Economic team through the Land Use Mitigation Action Plan
(LUMAP) and the Village Land Use Surveys have identified everyone in the 15 surveyed
villages that is non-viable and marginal (both Project Affected and not Project Affected).
Using sophisticated GIS tools and a relational database, it is now possible to combine this
information with land use patterns and other variables in order to clearly identify those most
at risk from the in fill drilling and developmental drilling programs land take. Furthermore it is
also possible to identify for each HH and HHH the appropriate mitigation method which will
best alleviate the effect of the land take which affected them.
Knowing how each piece of land was being used at the time of the survey can assist us in
projecting impact at the individual, house hold and community level. With the establishment
of each new element of infrastructure a number of processes can be triggered to update the
information available on the affected HH and HHH. Through the intervention of the Synergy
and Impact teams the data is updated in an efficient manner in order to confirm the identity of
the affected HH and HHH and the resettlement options available to them.
Combining technology and highly trained individuals it is now possible to deal with each of
these situations in real time. Through the development of new streamlined intervention
processes it will also be possible to further reduce the lag period required to bring about the
required support at the HH, HHH and community level. While this process is ongoing and
new improvements will always be sought, the impact of these changes can already be
perceived by those affected and at risk.
The following pages will give the reader an outline of the situations of HH and HHH of each
of the affected villages of the OFDA, both those affected or not affected by the Project. It
should be noted that this report is made-up of two sections;
1. Village Level Surveys
2. Households Results

EMP 2010 Annual Individual Report on Vulnerability 12
Part 1: Village Level Surveys

EMP 2010 Annual Individual Report on Vulnerability 13
1. Village Survey Results
The Dokaïdilti survey demonstrated in a measurable way that the degree of negative impact
in the heavily impacted village was much smaller than prior analysis of declarative data had
indicated. Because it was able to pinpoint at-risk households the Village Survey
methodology became the basis for future SSP. Land reclamation and return remains a very
high priority in relieving Project impact in villages and individual HH that are most at risk.
1.1 Overview of Surveyed Villages
To understand the effect that a land take may have on a community and its population one
must first have a proper understanding of a number of key drivers that define to a large
extent the specific community. The dominant key indicators are:
• Population: How many people are in the specific area affected by the Project?
• Number of households: Number of social units being affected. Smaller villages tend
to be extended family units with the patriarch being the chief; this is often a key issue
in establishing the level and type of interactions within the community.
• Population density: With increasing population density the intensity of interaction will
progressively increase and new types of relationships will develop. Access to
resources will often be directly related to population density. As land is a limited
resource and attribution processes do not always result in an even distribution, an
increase in population density could result in the development of stresses within the
community. Increasing population density and size will also bring about the
establishment of new types of relationship less related to family ties, for example:
economic relationship between buyers or suppliers of goods and services.
• Average length of possible fallow (What is the pressure on productive resources,
demand for farmland and sustainability of current farming system?).
• What differences are there within villages in terms of status, family size, and
households? Do all people share equally in Project impact?
• Are there vulnerable people? Given that traditional means of dealing with social
pressures and land shortage are still in play, do the people that resort to these
traditional measures put themselves at an economic disadvantage that Project
actions could aggravate?

EMP 2010 Annual Individual Report on Vulnerability 14
Table 1: Key village level indicators
Village Population #HH People/HaLength of fallow
Avg. HH size
Poutouguem 306 61 0.54 3.03 5.1 Danmadja 565 101 1.18 3.31 5.7 Maïkeri 720 140 0.58 3.36 5.2 Dokaïdilti 531 85 0.77 3.45 6.3 Mbanga 1496 269 0.49 4.56 5.6 Bero 3721 592 0.65 4.83 6.3 Béla 836 145 0.38 5.14 5.8 Maïnani 602 109 0.43 5.25 5.6 Kome 940 192 0.39 5.52 5 Mouarom 449 85 0.33 6.39 5.3 Naïkam 275 54 0.19 7.41 5.1 Madjo 794 129 0.37 8.19 6.2 Bégada 1237 255 0.37 8.2 4.9 Ngalaba 1309 248 0.62 8.5 5.3 Dildo 1333 272 0.71 10.51 4.9 OFDA* 15114 2737 0.56 5.9 5.5
Overall results for villages for which we have information
From the information presented in table 1, we can easily note that some of the villages have
much larger population and number of households than others. It is only when the
information is put into perspective by looking at the density of the population (people/ha) and
the average length of the fallow that we can see the villages which could potentially be the
most at risk.
As you can see from the above table, Danmadja has a high population density and
potentially insufficient rotation period; however, we will see later that Danmadja’s:
• Access to other resources mainly fisheries
• Splitting itself into two communities
• Access to land at the fringe of other communities
• Access to more lucrative markets (Atan village)
are all practices that helped this community cope with a limited territory.
The number of HH in the Project area is related to HH size: big HH mean a smaller number
of HH in the village but more intense interaction within the HH. HH size is determined in part
by biological factors (births, deaths) but in good part by social factors. The principle factors
which operate in the OFDA are:

EMP 2010 Annual Individual Report on Vulnerability 15
• Birth of children which drives establishment of an economically independent HH
• Divorce or widowhood (plus the intermediate stage in this culture of “separated”)
• Social obligations to care for people other than the nuclear family
• Old age
But another important factor driving HH size in many societies is:
• Access to productive resources
The last point is important to understand within the Project context and need for land. Are
there social distinctions that limit access to productive resources? Has the Project’s land
acquisition reduced HHs productive resources and increased HH size and HHM interaction,
which could lead to more conflict?
As said, most of the factors listed above arise through natural and cultural processes. For
example, in some societies a couple would become an economically independent entity
directly upon marriage; here males become residentially independent in their bachelor teens
and begin the steps towards economic independence. The act of marriage may or may not
lead the couple to establish a separate HH but then, with children coming along, the couple
becomes economically independent. At a later stage the wife may become economically
independent, either staying in the same homestead or moving elsewhere.
While Table 1 indicates that villages are somewhat dissimilar in terms of population density
and its subsequent pressure on farm land, as expressed by the length of the fallow, there is
no large difference in the average size of households. In fact the average size of HH in
these villages is between 5 and 6 with an average of 5.5. Project pressure on assets does
not affect “villages” and does not appear to create more intense, and possibly negative social
interactions between village households. Villages as a social unit do not appear to be at risk.
Nor does Project pressure drive HH to increase in size and interaction because more people
must exploit the fixed area of HH productive assets.
1.2 Traditional Coping Mechanisms in Surveyed Villages
Studies of the area have described the ways in which the population has traditionally dealt
with land pressure and related social tensions. We can ponder whether the mechanisms
studied in the 1970s are still at play today, and if they remain adequate enough to deal with
the additional pressure on land brought about by Project land take. The reliability of
population data available to answer this question varies, but enough information is available

EMP 2010 Annual Individual Report on Vulnerability 16
from pre-Project times (the National Census in 1993, for example) to judge whether
traditional coping mechanisms are still at work just before the Project began and if they are
still active.
If these mechanism are still in play, the question which remains is, are the HH in villages that
have resorted to traditional coping mechanisms at higher risk because they have abandoned
the assets they had been exploiting?
In the following sections we will review some of these basic mechanisms in order to ascertain
whether they are still in play.
1.2.1 Village Splits
The most common traditional mechanism of dealing with increased land pressure at the
village level is for the village to split. Initially when a HH does not get along with its neighbors
or doesn’t have sufficient land to sustain its’ growth it seeks separation and moves to the far
end of the village or out of it.
If the village is large enough for people to start building factions and gain supporters, an
individual with aspirations to influence will split off and settle on a distant part of village land
or in another area entirely, where his HH is more autonomous. Sometimes partisan HH that
have followed their leader find that the seeming opponent’s pasture is no greener. In these
cases hamlets die out. But often the hamlet becomes the nucleus of a new village exploiting
the area on which it has settled. Eventually the new village will ask for administrative
recognition of its separate status as a new village. 10 new villages are in the process of
being created and recognized. This will result in 25 villages being present in an area where
only 15 existed a few years ago.
A comparison of HH numbers, population size and access to productive resources shows
that split villages are almost all identical twins (Refer to annex 1). The only exception is Béla
II, which appears to have a slight advantage over Béla I in terms of average corde per capita.
There are no characteristics that would put one part of the village at a significant
disadvantage vis à vis Project impact. In fact, in terms of differences in land distribution
among HH, all villages demonstrate similar proportions of wealthy, comfortable, marginal and
vulnerable HH.

EMP 2010 Annual Individual Report on Vulnerability 17
The only impact the Project may have had on the structure of communities arises from the
communities belief that splitting may offer them the opportunity to obtain a higher level of
compensation should new land take occur (e.g. land speculation).
1.2.2 Non-agricultural productive resources
While fishing is another
method of reducing the effect
of land scarcity on the
population of villages, it also
offers a means of diversifying
one’s diet and sources of
income. In the OFDA access
to the resource is limited to
only five villages, other
villages of the Project area
being generally land locked. It must be noted that even when the village has access to the
riverways not all families in fishing villages
choose to engage in the practice.
Needs and preferences appear to be the two
main driving forces behind the decision to adopt
fishing. Some families or HHH choose to
become fisherman in order to compensate for
the limited land base to which they have access,
while others simply choose to become
fishermen.
Presented with a substantial fish source the
family is less dependent on other sources of
proteins and cereals. It thus becomes less
dependent on its land base to meet its daily
dietary needs. The extra income from fishing is available throughout the months that cereal
is cheaply available in the market and the adults can round out the family’s staple needs;
Table 2: Village with access to fishing Fishing villages
People/Ha Length of fallow
Danmadja 1.18 3.31 Dildo 0.71 10.51 Dokaïdilti 0.77 3.45 Madjo 0.37 8.19 Poutouguem 0.54 3.03
Inland villages
People/Ha Length of fallow
Bégada 0.37 8.2 Béla 0.38 5.14 Bero 0.65 4.83 Kome 0.39 5.52 Maïkeri 0.58 3.36 Maïnani 0.43 5.25 Mbanga 0.49 4.56 Mouarom 0.33 6.39 Naïkam 0.19 7.41 Ngalaba 0.62 8.5
Picture 1: EMP, Madjo Bero fishing activities

EMP 2010 Annual Individual Report on Vulnerability 18
most fishermen earn between 20,000 – 30,000 FCFA per month during the 6 months when
fishing is plentiful. Many families in fishing villages do not need as much land in non-fishing
village farmers to maintain an adequate standard of living. Fishing diminishes the need for
land as a productive resource.
Although Madjo-Bero and Dildo are fishing villages found in the OFDA they are anomalies.
Madjo-Bero has more than ample land because during the Project period it underwent a
definitive split, with part of the village moving across the river into another Canton/Sub-
Prefecture (Madjo-Doba). The average length of fallow in Madjo-Bero and Dildo is high
because they have important long term fallows near the river; these lands are not highlighted
for cultivation because of flooding during the rainy season. These lands could eventually be
targeted for irrigated rice production; as such they represent a substantial asset. Bela’s
situation is ambiguous; while it has plenty of land there are some inhabitants who are serious
fishermen. Accessing the river from Bela is more difficult and recreational fishing for the
family table is less common.
Following a number of interviews with members of the local community it appears that
tradition is involved in granting access to this resource. Families who have been granted
parcels along the riverbank would appear to have more access. It must be noted that as per
Chadian law watercourses and flood plains are considered to be owned by the state. While
the Mbao (tribe/community whose activity is closely associated to fishing) does appear to
have a privileged access to most of the important fisheries of the country they do not appear
to compete for access for the local fish stocks.
Other activities such as forestry, harvesting of mangos and shea nuts, food processing,
vegetable gardening and commerce could all be exploited in order to alleviate limited land
resources for agriculture. Over the next few months it is our intention to develop a
methodology that will permit us to evaluate the contribution of certain of these activities to the
needs of families. In short, do they compensate for the limited cropping area available to
certain HH? The need to deal with this issue becomes even more important if we consider
that the Project offers complementary training in some of these fields.

EMP 2010 Annual Individual Report on Vulnerability 19
1.3 Gender in surveyed villages Economically independent women with their
own productive resources can be observed
at the village level. In this culture, women
are allowed a certain level of economic
independence as the following data show.
From the interviews we have held within the
community we believe that women who
have obtained resources through their
family (inheritance or grants from family
trust) or have acquired assets with income generated from other economic activities
(commerce) are more apt to maintain their own HH in a self-sufficient manner. While women
who do not have sufficient resources to sustain a HH will tend to either remain in a form of
dependency relationship with their present spouse or attempt to remarry or join into an
existing HH if they find themselves divorced or widowed.
The village surveys show the number of women who become the heads of their own HH and
no longer have the protection of a husband and the husband’s household resources.
Analyzing this information further indicates that the successful establishment of a FHHH may
be directly related to the size of the community. In communities with less than 150 HH only
12.8 % are FHHH while in larger communities (more than 150 HH) 22.5 % are FHHH. This
difference would appear to be due to the fact that divorce is more socially acceptable in
larger communities and that there is usually more economic activity in a larger center
enhancing the ability of women to earn a living for themselves and their children.
Figure 2: Distribution of Land Holdings by Gender of HHH
0
10
20
30
40
50
60
70
80
90
100
Bégad
a Béla
Bero
Danmad
jaDild
o
Dokaïdi
lti
Kome
Madjo
Maïkeri
Maïnan
i
Mbanga
Mouarom
Naïkam
Ngalaba
Poutou
guem
% male HHH % land owned by men% female HHH % land owned by women
Figure 1: Range of landholdings by gender
0
20
40
60
80
100
120
140
0 - 0.9 10 - 10.9 20 - 20.9 30 - 30.9 40 - 40.9 50 - 50.9 60 - 60.9 70 - 70.9 81 - 81.9 91 - 91.9
Cordes per HH
Nbr
. HHH
Nbr HHH Men Nbr HHH Women

EMP 2010 Annual Individual Report on Vulnerability 20
As women become increasingly self-sufficient because of their right to productive assets they
could be increasingly at risk of being affected by the Project’s land take. Detailed data in
regards to the relative position of men and women is available in annex 3.
When a HH is deemed non-viable in terms of agricultural activities (less
than 0.67 cordes / HHM), the cultural
influence on how households are
formed leads to a seemingly large
number of Non-Viable young male
HHH. Gender thus appears to be a
mediating factor, making young men
particularly vulnerable.
However, looking at available land at the village level shows that the villages have plenty of
land. Social analysis also shows that many seemingly vulnerable young HH only appear to
be so. A young male HHH looks as though he has only a few fields for his HH members
because his HH has only started farming and has not yet reached the point where a piece of
land has been farmed long enough for it to need to be fallowed. As soon as the young male
farmer needs more land because of declining fertility he will ask the family elder for access to
some of the family trust fund. Only the unfortunate HH that are just starting out in life without
any trust fund of land to draw on are, in fact, non-viable and will probably remain so unless
traditional mechanisms are called into play.
It is the few HH characterized by these vulnerability factors tied to age and gender that are
more apt to be affected by Project impact. Later examination of individual HHs will reveal the
nature of HH vulnerability.
A further mechanism involved is that a HHH
that controls a large land base (wealthy) will
often tend to have a larger number of HHM
as he is able to attract more wives through
the dowry process.
Table 3: Comparison of Vulnerability by age in 15 surveyed villages
Age HHH % male HHH non‐viable
% female HHH non‐viable
less than 20 1 0 20 ‐ 29 80 16 30 ‐ 39 70 19 40 ‐49 24 22 50 ‐ 59 20 12 60 ‐69 3 9 more than 70 0 0
Figure 3: Distribution of land among HH by size
0,0
10,0
20,0
30,0
40,0
50,0
1 2 3 4 5 6 7 8 9 10 11 12 13 14 15 16 17 18 19 20+
HH size
Size
of l
andh
oldi
ngs

EMP 2010 Annual Individual Report on Vulnerability 21
The unfortunate male HHH without a family trust tend to be children of men who have
moved in to the village from the outside. If they have moved to join their mother then they
have access to her family’s land, but their residual rights do not have precedence over a
large number of maternal cousins. A man’s decision to move to another village (which
occurs for many reasons) has for his heirs the consequence of limiting the family trust to the
amount of land he is able to convince his host, or village chief, and land priest to give him.
For the majority of males, living in their
natal, and their father’s natal, and their
father’s natal village there is always the
family trust to draw on. The balance
between HH size and the amount of
land belonging to the HH demonstrates
this slow transfer from one generation to
the next. This is basically related to the
ability of the elders to give unto those relatives according to their increasing need for land
(figure 4). The few HH without any inheritance to call on (left hand side of graph) cannot
attain this balance in their current residence.
By comparing HH at the village level this age phenomenon becomes evident. Not all
villages HH are in trouble, lacking productive assets, in fact, only a few are. Age is also a
mediating factor in the development of vulnerable female-headed HH. Young women
separate from their natal families when they marry/have children. When a new household
is established the husband should, according to the cultural norms, be primarily
responsible for his wife and children (the wife being tied down at home by child care). The
age distribution of female HHH shows this norm is largely respected. With time the
marriage bond may change and the wife undertake more productive (rather than
reproductive) activities to complement her husband’s contribution. It is the degree of
“support” that is/should be given that is the most contentious issue in marriage, leading to
numerous traditional court cases, separations and divorces.
The increasing independence of women as they grow older is clear in the village surveys.
The fact that women become independent as they age means they must have productive
resources of their own to support the independent family. As a consequence, any factor
that affects these resources affects these women directly.
Figure 4: Number of HH with land holding status by age categories
0
50
100
150
200
250
300
350
400
11-20 21-30 31-40 41-50 51-60 61-70 71-80 81-90 91-100
Age categories
# HH
At-Risk HHMarginal HHComfortable HHWealthy HH

EMP 2010 Annual Individual Report on Vulnerability 22
Older female HHH with limited productive resources tend to be non-viable or Marginal
farmers. Most often they are women who have married outside their natal village where
they would still be able to access family land.
1.4 Age Distribution in Surveyed Villages
In all the surveyed villages the average age of the population is young, averaging 20. (see
annex 3) This means that there are many non-productive inhabitants in the village who must
be sustained by the adults in charge. Project actions affecting a few adults can result in
affecting more people indirectly.
Not only is the average age young; the preponderance of HHH in all surveyed villages is also young. From this we must conclude that this group of HHH will bear the brunt of Project impacts on productive resources simply because demographically they are the most numerous group in the population. Demographics also play a role since more women live to an older age and, as has been shown, they are often independent and have their own assets.
1.5 Status Differences in Surveyed Villages
The answer to the question whether there are differences in social status that prevent equal
access to productive resources is “NO”. It is the other way around; social status is measured
by access to productive assets, with its links to age and gender and family trust funds.
However, and herein lies the rub, it depends on how you use those assets that earns your
social status. 30 cordes in the family trust fund gets you nothing, but put some of that into
farmland and be generous with the harvest and your status rises. Status depends on your
interest and ability in farming and on your relationship with other villagers. This may, to
some extent, explain why the improved agriculture program is attracting so many auditors.
Improving their ability would improve their status and as such it becomes interesting to the
individual whom the training was not intended. In many societies knowledge and how you
put it into use is a status issue. In traditional societies it is never viewed as a good thing to
be left behind knowledge wise.
Figure 5: Distribution of eligible HH by age of HHH in surveyed villages
0
10
20
30
40
50
60
70
less than 20 20 - 29 30 - 39 40 -49 50 - 59 60 -69 more than70
Age
Nbr
. HH

EMP 2010 Annual Individual Report on Vulnerability 23
Comparing HH at the village level shows that there are indeed differences within each village
in terms of land holdings. There are a few landholders with such exceedingly large tracts of
land that all the HHM could never succeed in cultivating even half; it is these land holders
who have lands lying fallow for 30-40 years or more. They are the senior members of the
family holding the family land in trust but with too few successors that have demanded land
and whittled down the land trust (low number of births, lack of interest in farming and heirs
already farming to their maximum). Upon his or her death the heirs will receive packages of
land that are likewise large and may lie unfarmed (See figure 4).
Per capita land holdings as large as these are the exception but in the surveyed villages
most HH are land wealthy, with large farms of more than 2.5 cordes per HHM and some with
10 to 20 cordes per HHM. Another large group are comfortable land holders with 1 to 2.5
cordes per HHM. Proportionally very few HH are Marginal or Non-Viable. The presence of
HH with no land at all can be explained either by other sources of HH income, support of
children, or because the person has borrowed/rented land from someone else.
Ms. Elizabeth Dendeï, farmer, 77 years old
Born in Bégada II, Ms Déndei presently farms 6 cordes (equivalent to about 3 ha). Oldest daughter of the chief she inherited a fairly substantial land holding from her father, approximately 87 cordes. Over the last few years, she has distributed a large portion of this land to her children and other needy members of the community. She presently retains 7 cordes of which she actively farms 6. Her status in the community means that she can get access to plenty of land if need be.
Picture 2: EMP, Elizabeth Dendeï Bégada II

EMP 2010 Annual Individual Report on Vulnerability 24
1.6 Land Holding Differences within Villages It is above all this distribution of land, skewed in the same way in all the surveyed villages,
which leads to the conclusion that villages as a whole are not at risk. Instead, specific HH
lack access to productive land (see figure 6 and annex B for more detailed tables).
At this point, we must also
distinguish between the fact that HH
may be at-risk or vulnerable from a
land base agriculture point of view
but that they could be reasonably
comfortable if one adopted a more
global perspective. Inversely, some
individuals who would appear
marginal or comfortable from a land
based agriculture point of view could
in fact be at-risk if one accounted for the quality of their land base or their skills in agriculture.
What could be the causes of this disparity in access to resources? We have seen that age
gender, and village of origin play a role but that social status differences do not. What about
Project impacts?
1.6.1 Project Compensation and Land Acquisition as a Cause of Non-Viability or Marginality?
Differences in land holding status clearly exist in the surveyed villages and a similar
distribution of land is found in each of them. But perhaps the Project’s land acquisition has
affected all HH equally, whatever their prior status, and created similar numbers of Non-
Viable and Marginal HH throughout the population. The data indicates this has not occurred.
Examining this question is not straightforward because the declarative data given at land
acquisition and recorded as “baseline” is not reliable. Using declarative data to determine a
HH’s pre-Project land holding status would yield little useful information on this earlier status.
Instead the GIS-measured amount of land taken from the HH, from Project inception to date,
has been added to the GIS-measured land belonging to the HH at the time of the village
survey. While this is not a perfect means of establishing pre-Project land holding it is the
most reliable approach available at present. For calculation purposes the number of HHM
counted during the village survey has been used as the number of HHM prior to Project land
Figure 6: Number of HH with age by land holding status
0
50
100
150
200
250
300
350
400
At-Risk HH Marginal HH Comfortable HH Wealthy HH
Land holding status
# H
H
11-2021-3031-4041-5051-6061-7071-8081-90

EMP 2010 Annual Individual Report on Vulnerability 25
acquisition. This is an assumption since HH grow and shrink as the domestic cycle turns, but
it gives an objectively measured number and, for HH compensated late in the Project it is
close to today’s situation.
This gives an approximate cordes per capita (or “resettlement factor”) measure just before
the HH’s first land compensation. Data presented in annex 4 compare the number of Non-
Viable and Marginal HH, plus other HHs’ land holding status “pre-Project” and today.
Project land acquisition could not be the only source of Non-Viability or Marginal status
because HH already found themselves in these categories before Project activities began.
In spite of Project land acquisition the great majority of HH today are either large or
comfortably well off land holders.
1.6.2 Project Compensation and Land Acquisition and the Creation of Resource Haves and Have-Nots?
Comparison of those who have received compensation shows not only that the percentage
of the population that has received compensation is
similar in most of the surveyed villages but also that a
majority of HH in a village have received compensation.
In 11 of the villages 70% or more of the households have
received compensation at one time or another, some HH
several times, during the Project. In 6 surveyed villages
more than 80% have received compensation. By
contrast, the four remaining village’s (Kome, Dildo,
Naïkam and Bela) lie only partially over the oil-bearing
fields. They have thus received less compensation since
there was little connection with Project land needs. Do
these villages have fewer at risk people, demonstrating
that where the Project impact is less the HH situation is
better? The answer is a clear “NO”; land take by the
Project does not automatically lead to an increase in
Non-Viability. Many other factors must enter in order to explain that Kome and Dildo have
more Non-Viable and Dildo more Marginal HH than the average village in the survey?
Table 4 : % of HH compensated because of Project land acquisition
Village % HH receiving compensation
Bégada 73 Béla 53 Bero 78 Danmadja 87 Dildo 37 Dokaïdilti 86 Kome 20 Madjo 83 Maïkeri 79 Maïnani 75 Mbanga 78 Mouarom 85 Naïkam 44 Ngalaba 84 Poutouguem 85

EMP 2010 Annual Individual Report on Vulnerability 26
Other cultural factors make HH Non-
Viable or Marginal beside Project
land acquisition. It is not surprising,
therefore, that the society has
developed traditional coping
mechanisms.
While villagers will often complain that there is no land left for fallow, the surveys have shown
that for most villages there is plenty of land for a long period of fallowing. What their
complaints effectively reflect is the great population increase that has occurred in the recent
past, which puts more pressure on fields near the village settlement. The true nature of the
complaint would be: I have too few nearby fields to leave them in fallow for very long;
because there are more people with such a high birthrate I am going to have to turn sooner
to traditional coping mechanisms and get up and move someplace where there is unclaimed
land available for use.
In 1993 there was a national census throughout the country collecting village (and quarter)
population figures. Village chiefs on a somewhat annual basis count their populations
because they are answerable for their citizens’ poll tax payments. In late 2000 and early
2001 the main contractor for Project construction carried out a population count in nearby
villages to estimate the labor pool and possibilities for housing workers; this count is probably
more reliable than village chief counts, which may or may not have been updated for that
year. From these three sources plus the village surveys it is possible to observe the
population growth over 20 years. Between 1993 and the year of the cadastral survey the
local population underwent a major increase. In fact overall population grew by almost 150%
during this period, about 2/3 of this growth having taken place between 1993 and 2000. On
a village by village basis it must be noted that even in Madjo, where part of the population left
to form a new village across the river, the population grew by 50%.
Table 5: Non‐Viable and Marginal HH
in Less Compensated Villages
Village % non‐viable HH % marginal HH
Kome 10% 5% Dildo 12% 14% Naïkam 0% 2% Bela 8% 5% Average 15 villages 8% 7%

EMP 2010 Annual Individual Report on Vulnerability 27
Negative rates of increase are a sign that part of the population has hived off and departed
elsewhere, between 2000 and 2008/2009. The three villages where this occurred are
Mouarom, Madjo and Bero. Nonetheless, in all three cases population growth in the 90’s was
very significant, more than compensating for the ensuing population move.
If land use intensity has increased over the last few years it is in main part due to the rapid
growth of the native population by natural growth. Most of the Project staff having elected to
live in Doba and Bébédjia have had very limited if any impact on the demography of the local
villages.
Table 6: Population change from 1993 to 2009 Population density people per Hectare Change between years Village 1993 2000 2008/2009 Delta 93‐2000 Delta 2000‐2008/9
Bégada 0.18 0.29 0.38 + 0.11 + 0.09 Béla 0.15 0.27 0.47 + 0.12 + 0.20 Bero 0.25 0.92 0.40 + 0.67 ‐0.52 Danmadja 0.43 0.84 1.72 + 0.41 + 0.88 Dildo 0.39 0.70 0.79 + 0.31 + 0.09 Dokaïdilti 0.29 0.52 1.41 + 0.23 + 0.89 Madjo 0.16 0.53 0.24 + 0.37 ‐0.29 Maïkeri 0.25 0.37 0.53 + 0.12 + 0.16 Mbanga 0.18 0.44 0.49 + 0.26 + 0.05 Mouarom 0.40 0.65 0.63 + 0.25 ‐0.02 Ngalaba 0.39 0.64 0.88 + 0.25 + 0.24 Poutouguem NA 0.35 0.50 NA + 0.15

EMP 2010 Annual Individual Report on Vulnerability 28
2. Deriving Project Impact on Household Productive Resources from Village Surveys
The Village Surveys present the situation of everyone within a village, not just those who
have been compensated. Analysis of such inclusive data has provided understanding of the
nature of villages, their size, their composition and their productive resources. It also allows
inter-HH comparison of all HH within a village and between villages.
2.1. Effect of Project Land Acquisition on Household Productive Resources
Using the Compensation Database to
compare the totals of the amount of land
acquired from any single HH shows that only
rarely has the Project acquired large parcels
of land from a single HH. Most land
acquisition involves long, thin corridors of a
few meters width for flowlines, roads, power
lines and so forth. The largest take would
come when a well pad falls entirely within one
HH’s fields, more when the HH has many fields overlying a rich oil-bearing spot where a
number of well pads could be built.
When the precisely measured totals of land taken from HH (Figure 7) is compared to the
Village Survey graph of land distribution (Figure 8), it becomes evident that the small total
amount of land usually acquired from a HH is a minor part of most HHs’ land holdings. In
other words, Project land acquisition
does not have a major impact on large
or medium size land holders. It is when
small land holders (Non-Viable or
Marginal) surrender a piece of land,
even though a small piece, that the HH
feels an impact. The degree of negative
Project impact on productive resources
is related to the proportion of HH in a
village that is already at risk.
Figure 7: Land taken from At-Risk households in 15 surveyed villages
0
20
40
60
80
100
120
140
160
180
200
0 - 0
.9
1 - 1
.9
2 - 2
.9
3 - 3
.9
4 - 4
.9
5 - 5
.9
6 - 6
.9
7 - 7
.9
8 - 8
.9
9 - 9
.9
10 -
10.9
11 -
11.9
12 -
12.9
13 -
13.9
14 -
14.9
15 -
15.9
16 -
16.9
17 -
17.9
18 -
18.9
19 -
19.9
20 -
20.9
Compensated area range (cordes)
Nbr
At-R
isk
HH
Figure 8: Distribution of land in 14 surveyed villages
0
20
40
60
80
100
120
0 - 4.9 5 - 9.9 10 -14.9
15 -19.9
20 -14.9
25 -29.9
30 -34.9
35 -39.9
40 -44.9
45 -49.9
Number of Cordes
Num
ber o
f HH
Bégada Béla
DanmadjaDildo
DokaïdiltiKomeMadjo
MaïkeriMaïnani
Mbanga Mouarom
NaïkamNgalabaPoutouguem

EMP 2010 Annual Individual Report on Vulnerability 29
From the data available in the Village Surveys we know what proportion of HH is at risk (both
Non-Viable and Marginal) – 19% – and who they are. The specific HH that are Marginal and
have little land and could be made Non-Viable by additional Project land needs are also
identifiable. Finally, Non-Viable or Marginal HH that have never been affected by land
acquisition are also identifiable; in case their situation changes and the Project compensates
a piece of their land any change in status can be calculated.
2.2. Changes in HH Landholding Status Within each village land per capita tends to be distributed in clusters, each trending around a
different size land holding. Zero land holdings are rare; less than 2/3 corde and Marginal
(less than 1 corde) tend to run together, reflecting the easy slide from Marginal to Non-
Viable. Comfortable land holdings in some villages are the mode, the most commonly
encountered size land holdings. But in many villages most farmers have more than
adequate land (wealthy), though usually not enormous holdings. Then there are the few
holders of family land trusts with very little family to bequeath it to. Because the size of land
holdings tends to cluster, switching from one cluster to another requires more of a jump (in
this case more of a loss) than moving up or down one or two HH in the ranking of per capita
land holdings. Very few wealthy land holders have given up enough land to become just
“Comfortable”, much less Non-Viable or Marginal; the jump from Comfortable to Non-Viable
or Marginal occurs more frequently. And, as mentioned, the slide from Marginal to Non-
Viable is the most frequent.
The information presented in annex 5 show the extent to which Project land acquisition has
changed the land holding status of compensated HH in the 12 villages. Over the Project’s
life 177 HH have changed land holding status. In a few instances other factors have
intervened to bring about a status change, e.g. the young male HH who was non-viable until
he inherited 30 cordes after his father’s death.
When the change in status (whatever the cause -- the Project, inheritance, divorce) is
averaged across the 9 villages, 12% of HH have changed status. Of those 3% have become
non-viable and 5% marginal due to the Project or other factors. 8% of HH have become at
risk since the start of the Project, and from the time of their first compensation.

EMP 2010 Annual Individual Report on Vulnerability 30
As expressed earlier the next year may see some changes to the land holding status as
being the key indicator of viability. Presently this indicator is only accounting for the area
under agricultural production without any consideration for other factors which may affect
productivity or family income. Here are some key examples of considerations which could
have an important bearing on this evaluation and which should be considered:
• Crop: A producer who is able or opts to grow vegetables or produce irrigated rice on
his parcel of land could generate far more income on a limited parcel than a producer
using traditional methods to produce millet or sorghum. Minimum area required in
order to be viable may actually be lower than what we are assuming presently
(presently established at 0.5 cordes per HHM).
• Cropping system: A precise evaluation of the potential agronomic gain to be achieved
through the adoption of improved agricultural practices such as those being promoted
by the improved agriculture program (presently offered under the relocation program)
has not been done and should be done if we are to adequately evaluate the
admissibility requirement to enter into this education program.
• Other income from agricultural origin: While certain producers have a limited land
base they may have other agricultural activities which could generate sufficient
income in order to make the family reasonably comfortable. An example of this could
be a producer who while he has only 0.2 cordes per HHM may have a sufficiently
large heard of cattle to generate a large income. He could actually be better off than
the individual who only has 0.6 cordes per HHM and no supplementary sources of
income.
• A number of complementary agricultural and non-agricultural activities could be the
source of substantial income. We must note that although a number of them are part
of our off-season improved agricultural training program none are actually included in
the evaluation of the HH status.
While at present it is not possible to confirm whether all of these sources of income will be
incorporated in a future indicator, this is nonetheless the general direction which we must
endeavor to follow.

EMP 2010 Annual Individual Report on Vulnerability 31
3. Conclusions on Village Surveys
Village Surveys have presented a village-wide and, where neighboring villages have also
been mapped, an area-wide view of the distribution of productive assets. The Surveys have
made it clear that a geographical area taken as a whole is not undergoing major negative
impacts because of the Project. Only a small portion of village households have felt negative
impact, and this sort of impact can come from many other factors at work besides the
Project. Whether it is other factors that have put a HH at risk, or not, once the Project
acquires land from a Non-Viable HH, the HH can choose a resettlement option that should
bring it up to the level of livelihood of an agriculturally viable HH.
In addition, and critically important for the individual inhabitants and HH of the villages, the
global village surveys have provided the comprehensive data needed to:
• Identify individually all the currently at risk HH in a village
• Examine the particular characteristics of each of these at risk HH
• Search whether there are common characteristics among at risk HH
• Use these common characteristics as indicators of the HH’s current or future risks to
their productive assets
The next sections of this report cover:
• The current status of all vulnerable HH in each of the 15 villages
o Which HH have chosen a resettlement option and which need to be offered
one
o How well has the HH’s resettlement option served to restore or improve their
livelihood
o The situation of Marginal HH that might slip into Non-Viability if affected by
future land acquisition.
• The impact of livelihood restoration on HH incorrectly identified as vulnerable and that
received a resettlement option
• HH that demonstrate the common indicators of Non-Viability and Marginality that can
be used to watch out for negative impacts on their productive resources.

EMP 2010 Annual Individual Report on Vulnerability 32
Part 2: Household results

EMP 2010 Annual Individual Report on Vulnerability 33
1 Household Results HH analysis done to date concerns mainly HH productive assets as the principle factors in
vulnerability. Specific factors such as handicaps have been dealt with so far on a case by
case basis in the field, but further 2010 analysis of HH surveys will systematize this.
1.1. At Risk Project-Affected HH in 15 villages Some truly Non-Viable HH in the 15 villages have already benefited from a resettlement
option and their progress will be examined later. Others were missed, not identified as Non-
Viable during the collection of compensation information. All in all, in the 15 villages, we find
two groups on whom we wish to focus:
• 100 False Negatives, true Non-Viables
surrendering land to the Project who
escaped identification before the Village
survey was carried out.
• Of the remaining Non-Viable compensated
HH in the 15 villages, 83 were True
Positives, correctly identified as vulnerable
and benefiting from a resettlement option.
Among the remaining HH in the villages, a number appeared to be vulnerable according to
the information they gave to compensation agents and socioeconomic monitors. As a result
they have also benefited from resettlement options although in fact their circumstances did
not call for it. The number of Marginal HH who selected non agricultural training options who
have improved their livelihood is known as they have been monitored.
A monitoring survey is presently ongoing with 263 at-risk and non viable individuals who
have received improved agricultural training as their relocation option. Of these, 83 are the
true positive identified above, the rest being either at risk individuals who had nonetheless
received training (even if viable) or individuals who appear to be eligible under the
declarative information but who live outside of the 15 villages targeted by the cadastral
project.
Table 7: Comparison of viability level between the initial evaluation
(declarative) and the reality (survey) Fact
Non Viable Viable
Non Viable
True positive (83)
False positive (426)
Evalua
tion
Viable False
Negative (100)
True Negative (1 347)

EMP 2010 Annual Individual Report on Vulnerability 34
Wealthy and comfortably well off individuals were also misidentified as vulnerable (False
Positives). Those that have benefited from their options are now even better off, and those
who have been unable to or have not wished to gain from it are none the worse off.
Table 8: HH with Resettlement Options Village Comfortable Wealthy Begada 18 15 Bela 5 4 Bero 70 48 Danmadja 23 7 Dildo 22 6 Dokaidilti 24 4 Komé 0 0 Madjo Bero 33 17 Maïkeri 2 5 Maïnani 5 4 Mbanga 23 26 Mouarom 10 6 Naïkam 1 0 Ngalaba 24 24 Poutouguem 0 0 TOTAL 260 166
1.2. Level of Livelihood Restoration of Non-Viable HH through their Resettlement Option in 15 villages
How well have the HH resettlement options served to restore or improve Non-Viable HHs’
livelihoods?
• Livelihood Restoration of truly Non-Viable HH
o About 500 HH benefited from a resettlement option long enough ago to
have established a track record of performance. Their histories were
examined and they were interviewed for livelihood restoration training.
Those who had never used their training or were listless were not offered
the option of reinforcement training.

EMP 2010 Annual Individual Report on Vulnerability 35
o 211 had done well enough in reestablishing themselves that they were
offered reinforcement training in 2009 (with more specialized training for
those truly capable of specializing in skills needed by the community).
A monitoring survey is presently ongoing for all the HHM who have received improved
agriculture training and would have either been non-viable or marginal before training.
Determination to include in the monitoring survey was based on the following criteria’s:
• HHH has gone through the improved agriculture program (those having received
non-agricultural training having been monitored some years back).
• HHH is either non-viable or marginal (globally at risk category) as confirmed by
cadastral survey, when available.
• For those not in the area resurveyed through the cadastral process, determination
was based on the declarative information.
In all 265 eligibles have been identified for monitoring. This process will make it possible to
make a determination as to whether they have been able to improve their situation following
the completion of the training program. For those who graduated before 2008 this may be
the only monitoring to take place, more recent graduates will either be resurveyed at the 2
year or at the 5 year marks, if a resurvey is warranted. This process, as well as the other
data collection activities, which are ongoing (Synergy and impact surveys) are vital to the
upkeep of the database. Without such a continuous effort the existing information on the
communities we are interacting with would rapidly become outdated.
Table 9: Level of Livelihood Income from all trained HHM
% HH
less than need 19% * meet need 13% 2-5 times need 31% 5-10 times need 13% 10-20 times need 25% more than 20 times 19% * 13% just below threshold but who are also long-ago graduates who are unlikely to improve

EMP 2010 Annual Individual Report on Vulnerability 36
1.3. Effective Actions Increasing the Likelihood of Livelihood Restoration
For the earlier identified “Non-Viable” HH whose training has put them near to reaching the
threshold of viability LUMAP implemented a variety of restorative actions in 2009, all of which
appear to have been effective. These actions have been integrated into the Environmental
Management Plan’s (EMP) Land Management Manual (LMM) and are now “business as
usual” for all EMP activities.
• Basic Business Skills (Literacy and Arithmetic skills training using HH and rural
micro-enterprises as the texts)
• Training to reinforce Improved Agriculture or Off Farm Skills
• Provide specialized training and or equipment offering competitive advantages
1.3.1. Basic Business Skills Training
One of the main complaints of the institutions training Non-Viable individuals has been how
difficult it is to train illiterate or semi-literate students; they have managed to adapt their
training away from theory to teaching by doing, but it is difficult for students who cannot write
down the measurements of a cabinet or how much received for a sack of grain to manage
their livelihood restoration.
Originally students were to receive Basic Business training through the craft and farm
training service providers. This did not prove to be the good approach to deal with this issue.
During the last two years Improved Agriculture graduates received training in business
management from a separate training service provider than the craft or farm training service
providers. Ensuring that they have the skills required to fully benefit from the technical
training they will receive there after. The Basic Business Skills Training (BBS) is now a
prerequisite for all eligible’s who wish to
benefit from a resettlement training option. As
is the case with Improved Agriculture training,
the lessons are given in the village and
anyone can attend. 2010 was the second
year where BBS was offered in the new
format:
• 66 of the 73 eligible students
attended classes and graduated
• 7 eligible Non-Viable people

EMP 2010 Annual Individual Report on Vulnerability 37
refused to attend
• 68 spouses (55 women and 13 men) participated regularly to class
• 120 auditors turned up and voluntarily attended the classes, benefiting from the
training (73 women and 47 men)
• I.e. as many if not more auditors attended the training as did Non-Viable people
required to attend.
The class results were most encouraging in that all who actively participated demonstrated a
significant progression. Of the 14 eligible students who did not make the grade in BBS, 12
refused to attend, 2 participated only rarely and received low grades of 0.7 and 0.8. Some
thought will have to be given to the option of exempting individuals who have completed a
significant number of years of formal education. For example 5 of the eligibles identified for
the 2011 class had either completed or were close to completing their high school education.
Considering the objective of the program such individuals would learn little while probably
becoming a nuisance for the class.
88% of tested participants (eligible Non-Viable students only) succeeded in reading
Ngambaye, doing basic math and understanding very basic management principles. Usual
traditional problems limited the mastery of business techniques, being lack of communication
between spouses, alcoholism, etc. Opening the class to the spouses of the eligible’s has
ensured that knowledge is accessible to a larger segment of the HH and benefits the entire
HH.
“The weight of traditions and attitudes limits the ability of some
individuals to adopt and pass on this knowledge.”
Notwithstanding this situation.
“95% of women who attended have shown a determination to move
beyond their illiteracy and become functionally literate, this change
bringing about important benefits in their ability to manage their
income generating activities.“
CEDIFOP 2010 final Report
The female students performed better than the male students, e.g. 80% of the female
students passed the final examination whereas 75% of the male students passed. The

EMP 2010 Annual Individual Report on Vulnerability 38
majority of the villagers auditing the training were female. The auditors also took the final
examination. We are pleased to note that 88% of auditors had a grade above 5/10
compared to only 78% for eligible’s and spouses. The motivation of learning does in fact
appear to be stronger with the auditors, who are in general illiterate to start with.
90 % (66/73) participated in the optional Post-Training Reinforcement of the skills acquired in
BBS. This training program, which took place following the completion of the basic BBS
class, involved academic and individual reinforcement. All of whom ended up passing the
course.
This indicates a progression in the number of individuals understanding to concepts but also
a progression in the level of mastery of these concepts. To improve the teaching of basic
business management the NGO implementing the project hired a management specialist to
improve the training materials for 2010.
The BBS classes contained both people who had attended some level of school and others
who had no schooling whatsoever. They were divided into groups according to their
background. The trainers made the following comments regarding the attitude of the illiterate
pupils:
“their level of assimilation was slow but good….They take the
course and its contents very seriously. Their attitude paid off and
they finished the class having learned the material.”
CEDIFOP 2009 Final report
The information presented below refers to individuals that selected Off Farm Training (Off
Farm Training was not offered to resettlement eligible people residing in the Three Fields
post 2007). The data was derived from the Livelihood Monitoring Surveys This information
may facilitate the understanding of the dilemma surrounding education.
A conclusion which can readily be made from the information presented below is that
education affects people’s outlook on life, not always in a positive way as far as their
willingness to use the skills they learned through resettlement.
• Having done some primary school versus being illiterate does not greatly impact
average earning power. Although it appears to have a huge impact on potential
maximum income.

EMP 2010 Annual Individual Report on Vulnerability 39
• Having attended high school does make a difference to income:
o Most people with some high school education who practice their craft earn a
fairly reasonable income. If we consider that this is considered to be a
complementary income.
• But most people who have not used their skills given to them have been either
more highly educated or big landholders.
Table 10: Earning In Thousand of FCFA by Month by Educational Level
Educational
Level
Minimum CFA
earn per
month
Maximum
CFA per
month
Mode CFA per month
Illiterate 6 K 60 K 10‐20 K
Primary 1 K 105 K 10‐20 K
College 5 K 35K 10 K
Lycée 30 K 32 K 30‐32 K
University 3 K 3 K
It does to a large extent appear to be related to attitude, a high school or university graduate
who received training in tailoring may perceive it as being below him to practice his trade and
will clearly not succeed. His income may in fact be much below that of a less literate who
chose to take his trade seriously.
The impact of attitude on the willingness to practice one’s trade is made even more clearly by
the next table. People with some, limited, education view what they learn as a means to
improve their situation and tend to make use of the knowledge and skills, this is not
necessarily so for highly educated eligible’s.
Table 11: Graduates Using Skills or Not by Education level
% of Total Off Farm Grads Educational level
% of Total # grads % of Total Grads NOT Work
Illiterate 16% 3%
Primary 58% 68%
College 17% 12%

EMP 2010 Annual Individual Report on Vulnerability 40
Lycée 8% 18%
Socioeconomic Survey interview comments and demands made by those resettlement
training graduates with higher initial education levels indicate that they have very high and
perhaps overly high expectations of what they should get out of life. Similarly, the sole
person who has attended university barely makes any effort to earn some income from what
he has learned (tailoring). BBS results show us that people who earned a grade of C or
better were generally people who had lower levels of formal education. Unfortunately, the
BBS results show us that people with higher levels of formal education have higher BBS
failure rates than people with lower levels of formal education. This data would indicate that
attitude is a key element of success.
Table 12: Previous Education Level Grade No School Primary Primary Primary Middle Lower High School High School + zero 1 – 2 3 ‐ 4 4 ‐ 5 6 ‐ 7 7‐11 11‐ 12 + 1 year F 2 3 0 0 0 0 3 D 1 1 0 0 0 1 0 C 8 3 2 1 1 3 0 B 9 15 3 3 6 9 7 A 0 0 0 0 0 0 0
Understanding what is being taught during the training is easier with some education.
Mastering basic business skills/rationale also helps people manage their capital and labor.
Illiterate graduates are the most likely to be putting their skills to work. As BBS in 2009
showed, they take their training very seriously. Some high school students refuse to work;
those who do work do well.
In order to build on the success of this program a “train the trainer” initiative will be put in
place in the early part of 2011. This initiative will focus on three main issues:
• Micro-enterprise management: Bringing enhanced support to both producers and
the management committees of the community compensation projects being
established.
• Literacy: Reinforcement to the literacy agents in the new techniques developed in
this area.
• Self reliance: A speaker from Benin to give a talk of his experience in the area of
self reliance, taking ones development into ones hands.

EMP 2010 Annual Individual Report on Vulnerability 41
Bringing support and reinforcement to our NGO sub-contractors that provide the BBS and
Improved Agriculture Training in this way increases the likelihood that livelihood restoration
and community developmental projects will sustain themselves over time.
1.3.2. Improved agriculture training
The main element of the Individual Livelihood Restoration presently revolves around the
improved agricultural training program. The main goal of this program is to improve the
livelihood level of the HHH and of their HH, by giving them tools and knowledge that will
make it possible for them to enhance their farming practices and in some cases replace the
income lost through the land take by new sources of income.
This program revolves around the following activities:
◙ In field applied training of various agronomic practices for rainy season land based
agriculture. The goal here is to significantly increase their maximum yield potential per land
unit under production. Basic knowledge dealing with the interaction between soil, water,
nutrient and the plant are focused on so that producers are better able to deal with the
relative complexity of agriculture.
◙ Special demonstration activities dealing with
issues such as soil amendments (Mucuna and
Jatrophra curcas), production of organic matter
(compost and manure management), feed storage
and manage (organizing community based silage
piles)…
◙ Practical demonstration through the
establishment of demonstration parcels in the
communities (peanuts, sorghum).
◙ Constant monitoring of the practices used by the eligible in his/her own fields in order
to ensure good understanding of the proposed practices.
◙ Field trips to suppliers, distributors or fellow farmers within and outside of the OFDA
so that eligible’s better understand the ramifications of the agricultural sector in which they
operate and get a glimpse of what can be achieved if the appropriate production techniques
are adopted.
Picture 4: EMP, vegetable gardener Danmadja

EMP 2010 Annual Individual Report on Vulnerability 42
◙ A number of dry season training options dealing with subjects as varied as vegetable
production, cloth dying, food transformation and livestock husbandry.
◙ For all of the different skills he will learn
the producer receives a set of equipment
(including livestock when relevant) which will
allow him to fully benefit from the knowledge
obtained. While this aspect of the project
has been a significant challenge over the
years. The acquisition process for these
equipments and animals has been reviewed
not only to ensure that precise technical
quality standards are adhered to by the suppliers but also that they stand behind their work.
While such a process does not ensure us that there will never be a problem again it does
reduce the odds of this happening and ensures that it will be dealt with rapidly if a problem
should arise
In order to continuously learn from both our good and bad experiences we have established
an annual review process. The key element of this process is a symposium during which all
of APROFODEL staff (the subcontractor in charge of this initiative) has the opportunity to
exchange with EMP’s and ISM’s staff. This process will make it possible to continuously
upgrade the program and its’ content identifying both strengths and weaknesses. In this
way ensuring that we meet the needs of the eligible’s and the new challenges which will
present themselves to us.
In 2010 11 eligibles completed the rainy
season portion of the training. They were
associated with 45 eligibles from the 2009
class who had been unable to complete their
dry season optional training. These 56 will
complete their formal training in early April
2011. At the end of this period they will have
completed the full training cycle and they will
move on to the regular monitoring process.
Picture 5: EMP, Equipment delivery
Picture 6: EMP, Vegetable garden plot Danmadja

EMP 2010 Annual Individual Report on Vulnerability 43
1.3.3. Training in Reinforcement and Specialization In 2009, reinforcement training was arranged for 211 graduates who were earning revenue
with their skills however were viewed as having not restored their livelihood at that time. Out
of the 211 targeted for reinforcement 209 participated.. Of the 209 who received
reinforcement training and supplemental equipment or livestock grants, 198 completed the
training. Of the 198 who completed the training, 181 were assessed to be successful in
using the reinforcement to improve their livelihood.
It is important to note that as EMP conducted the Village Land Use Surveys, Impact Surveys
and Livelihood Restoration Monitoring Surveys, we learned that only 6 of the 211 graduates
were actually eligible to receive resettlement benefit in the base case.
Given the time required to develop the Village Land Use Surveys the Livelihood Restoration
Monitoring Surveys were ongoing. These Livelihood Restoration Monitoring surveys
indicated the following:
• After one and a half year of practice a review of available information indicates that
a slightly more than 75% are still active.
• Reinforcement related to animal husbandry appear to have been the most difficult
to sustain. Most cases whereby the production was abandoned relates to most if
not all of the reproducing stock dying. It must be noted that the concept of raising,
caring, feeding and housing animals is somewhat foreign to local producers. In
their eye an animal must fend for himself.

EMP 2010 Annual Individual Report on Vulnerability 44
Table 13: Outline of the fields of reinforcement and rate of sustainability, 2009
Area of training # Trained # Mastered Still in action
(31 Dec 2010)
Vegetable production 31 27 23
Hog production 17 14 10
Sheep/goats 15 14 10
Chicken 43 38 28
Agro‐forestry 11 10 9
Food processing 22 22 20
Cloth dying 11 11 11
Carpentry 11 11 10
Brick laying/roofing 9 9 7
Sowing 18 15 15
Welding 3 3 2
Fishing 7 7 7
Total 198 181 152
91.41% 76.77%
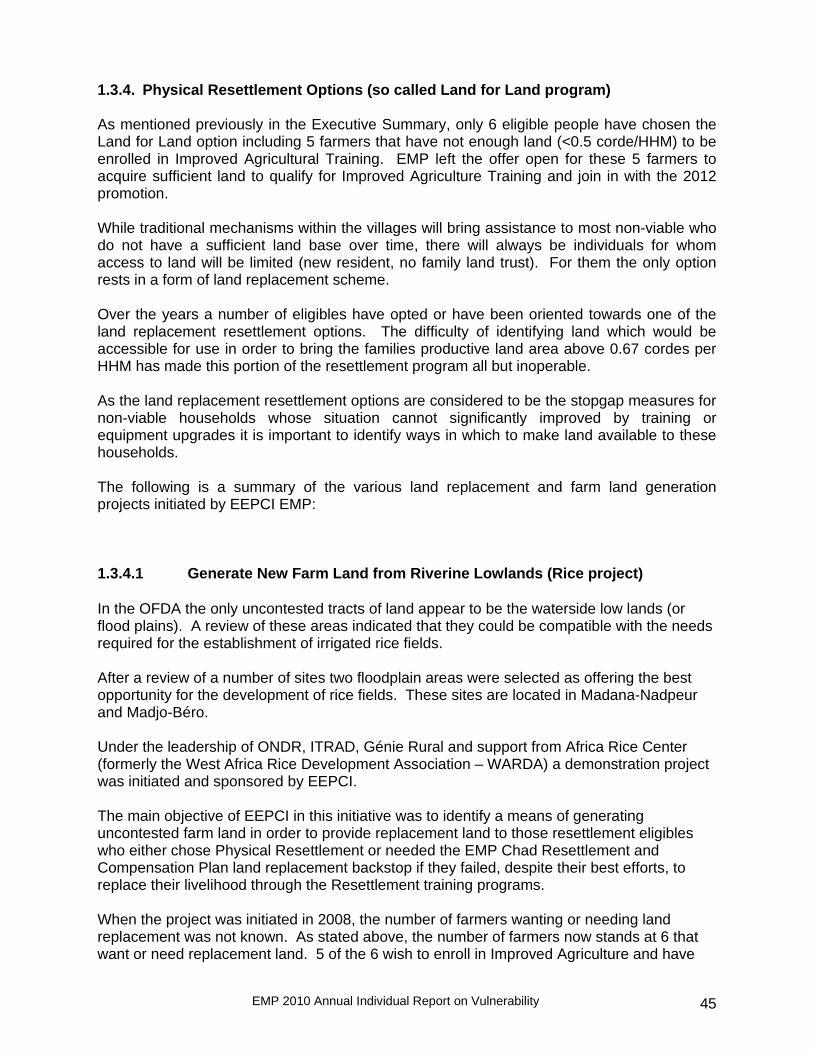
EMP 2010 Annual Individual Report on Vulnerability 45
1.3.4. Physical Resettlement Options (so called Land for Land program) As mentioned previously in the Executive Summary, only 6 eligible people have chosen the Land for Land option including 5 farmers that have not enough land (<0.5 corde/HHM) to be enrolled in Improved Agricultural Training. EMP left the offer open for these 5 farmers to acquire sufficient land to qualify for Improved Agriculture Training and join in with the 2012 promotion. While traditional mechanisms within the villages will bring assistance to most non-viable who do not have a sufficient land base over time, there will always be individuals for whom access to land will be limited (new resident, no family land trust). For them the only option rests in a form of land replacement scheme. Over the years a number of eligibles have opted or have been oriented towards one of the land replacement resettlement options. The difficulty of identifying land which would be accessible for use in order to bring the families productive land area above 0.67 cordes per HHM has made this portion of the resettlement program all but inoperable. As the land replacement resettlement options are considered to be the stopgap measures for non-viable households whose situation cannot significantly improved by training or equipment upgrades it is important to identify ways in which to make land available to these households. The following is a summary of the various land replacement and farm land generation projects initiated by EEPCI EMP: 1.3.4.1 Generate New Farm Land from Riverine Lowlands (Rice project) In the OFDA the only uncontested tracts of land appear to be the waterside low lands (or flood plains). A review of these areas indicated that they could be compatible with the needs required for the establishment of irrigated rice fields. After a review of a number of sites two floodplain areas were selected as offering the best opportunity for the development of rice fields. These sites are located in Madana-Nadpeur and Madjo-Béro. Under the leadership of ONDR, ITRAD, Génie Rural and support from Africa Rice Center (formerly the West Africa Rice Development Association – WARDA) a demonstration project was initiated and sponsored by EEPCI. The main objective of EEPCI in this initiative was to identify a means of generating uncontested farm land in order to provide replacement land to those resettlement eligibles who either chose Physical Resettlement or needed the EMP Chad Resettlement and Compensation Plan land replacement backstop if they failed, despite their best efforts, to replace their livelihood through the Resettlement training programs. When the project was initiated in 2008, the number of farmers wanting or needing land replacement was not known. As stated above, the number of farmers now stands at 6 that want or need replacement land. 5 of the 6 wish to enroll in Improved Agriculture and have

EMP 2010 Annual Individual Report on Vulnerability 46
the option to acquire the minimum land required to enroll in future classes until the training programs end at some time post the drilling program conclusion. At the onset of the pilot project, a number of key success indicators were identified and would have to be met in order to considered successful The close out meeting was held with AfricaRice and the partners in December 2010, the final report is expected in the early part of 2011. A rice seed bed for use as a Reinforcement program was built and farmed during this time and is presented in section 1.3.4.2.
◙ Rice yield and productivity of the project versus traditional yields under traditional production methods.
While yields were highly variable (depending on variety, date of planting, levels of fertilization and a host of other parameters) the two sites established averaged about 2 T per hectare. This productivity was reasonable if compared to Chadian standards which give yields of about 1.5 T per hectare using traditional varieties on irrigated sites, and around 0.5 T per hectare with rain fed sites. Although lower than AfricaRice’s target yields for most of the varieties, the discrepancy may be explained by a host of factors such as seeding date, timing of the various activities and fertilization. In general we consider that the project was a relative success in terms of productivity. ◙ The institutions responsible for the project (the owners) were state institutions (ITRAD, ONDR and Genie Rural)
ONDR, ITRAD and Genie Rural technicians were to take over all of the Extension and support tasks associated with the project under supervision of AfricaRice. They also had to demonstrate a clear determination to continue to disseminate the results, if any were to be had, through CHAD to the benefit of all concerned. While some of the partners were effective in their participation and in this way demonstrated their willingness to forge ahead with what they had learned, this was not
the case for all of them.
In general we consider that the project was a failure on this criterion.
◙ The main objective of this project was for the producers to take ownership of these new cultural practices.
From the onset the producers in these two initiatives demonstrated their lack of willingness to take ownership of the project by requiring the payment of
Picture 7: EMP, rice crop in Madjo Béro
Picture 8: EMP, rice harvest in Madana

EMP 2010 Annual Individual Report on Vulnerability 47
daily allowances to work on their own parcels. While they always ended up doing the work payment of the allowances was always an issue. Even after the completion of the project and acknowledging that it was a success from an agricultural point of view they still demanded continued financial support in order to move on. By these comments they made it clear that they were not willing to take ownership of the project or of its windfall. In general we consider the project to be a failure at this level. ◙ Sharing of these fields with surrounding communities must be respected and facilitated. So that the landless of a larger area can profit from the fruit of this infrastructure.
As the establishment of such parcels is only justified by the need to support a relatively large number of land poor producers (between 8 and 12) from many communities it is essential that they feel welcomed by the host community whatever their origin. In view of the monitoring which was done over the last year it is not clear that this was the case. Friction often arose as to the distribution of labor and of the product. Even now there remain issues as to who will be welcomed back. For these reasons we must conclude that although a relative agronomic success this project did not meet original expectations from a human stand point (Ownership, level of stewardship by state agencies and willingness of communities to work together).
The establishment of further such sites would also be made difficult by the fact that the number of eligible’s requesting replacement land options is at present fairly limited. While it is not impossible that such an initiative could be repeated in the future, the right conditions will have to be present for this to take place. 1.3.4.2. Improved Agriculture Reinforcement Program at K 744. As a complementary activity to the rice project a rice field was established at the K 744 well pad (well was never drilled). While this project received the same type of support in terms of coaching, advice and imported seed stock it differed in a number of ways. This project made it possible to test if rice fields could be engineered and thus offered as community compensation.
◙ No daily allowance was paid for the work done in the field. ◙ Land preparation was done using heavy equipment, streamlining the process
(although some thought that the compaction resulting for the use of heavy equipment would make the land unproductive).
◙ Contrary to the two other sites were most of the farmers were men, at K 744 all of the farmers were women (COFEMAB agricultural cooperative).
◙ Site established as a potential source of quality rice seeds.

EMP 2010 Annual Individual Report on Vulnerability 48
While these differences could appear negligible the results have been very different. We will review the results of this initiative on the same basis as the site specific criterion’s used for the demonstration project.
◙ Agronomic performance: Average yield was 4 T/hectare or more than twice the yield produced on the two other sites. It should be noted that one variety yielded 5.6 T/hectare. While the soil type may have given them a slight advantage most of the yield difference arose from a very rigorous adherence to the process proposed by the extension officers.
◙ Ownership: Without any compensatory allowances they endured and completed every single task when it was required. They are already planning the next campaign and have not requested any additional financial support. They have set up a cooperative to structure the future development of their business. All of this indicates a high level of ownership.
◙ Openness: They have incorporated within their ranks a small number of ladies
from surrounding communities. They have also organized a field trip going to visit another group of women in Koumra to exchange ideas as to ways of further developing their group.
Overall while the cost of building a rice field out of a drilling platform was quite substantial this project demonstrated that with the right mindset one can manage such an activity achieving both a technical and human success. This initiative confirms our basic assumption that irrigated rice production is a community based activity where many must come together to get some results. The right group of persons with the right mind set can achieve a lot if they are willing to work together. 1.3.4.3. Improving the Soil Quality at Borrow Pits Reclaimed Using Imported Top Soils One of the constraints to providing replacement agricultural land in the Project’s Oil Field Development Area (OFDA) is the poor quality of soils at borrow pit sites (prior to any laterite mining). In 2008, EEPCI reclaimed 300 hectares of temporary use land (borrow pits, well pads and air strip ends) for the affected people of many villages using topsoil stockpiled from the Project construction activities. The majority of the villages receiving these lands back actively farmed the reclaimed borrow pits with varying degrees of success (all positive).
Picture 9: Madjo-Bero womens group

EMP 2010 Annual Individual Report on Vulnerability 49
However, the farmers at the villages of Bero and Ngalaba refused to farm the Kome Borrow Pit 6 and Miandoum Borrow Pit 8 sites saying that the top soil imported from the Kome 5 Air Strip ends were of poor quality and not worth farming. In order to alleviate these fears and demonstrate that these soils can sustain a crop, and that they can be further improved through the adoption of sound cropping practices it was decided to establish large Mucuna pruriens plots on two of the reclaimed borrow pit (laterite quarry). The ability of Mucuna to fix nitrogen makes it an ideal crop for soil rehabilitation and improvement. Plowing this plant as a green manure maximizes its impact as a soil amendment. Not only does it improve the soil’s fertility in the year following plow down (increased availability of nitrogen) but the plant material incorporated improves soil structure and long term productivity. This plant has been used to this end in large parts of the American mid-west since the late 1930’s. About 10 hectares of Mucuna were planted in the spring of 2010, after having acquired sufficient volume of seeds from local suppliers. This initiative had three main objectives:
- Demonstrate the feasibility of effectively planting and growing Mucuna in the environmental and soil conditions existing in reclaimed borrow pits.
- Test the willingness of the producers to incorporate this biomass into the soil and/or to harvest the pods to perpetuate this production. It should be noted that Mucuna beans can also be eaten if adequately prepared.
- Monitor the effect of this trial on the fertility of these soils during the following cropping season.
Here are some of the highlights of this trial:
- The establishment of the parcel was very successful. A huge amount of biomass was present in the field.
- Producers were not willing to incorporate the biomass into the soil, although the advantages of doing so were explained to them at great lengths. Not only did they refuse to plow under the biomass, they also refused to harvest the beans. In fact they waited for the crop to dry out before simply burning. The basic reason for burning it being, the other options were just too much work.
As we will only be able to gain an understanding of the impact of this practice on soil fertility and the acceptability of using these reclaimed soils for agriculture during the next season our final judgment on the effectiveness of this practice will have to wait next years report. At this point in time we must nonetheless conclude that social acceptability of this practice being what it is it would take a long term effort
in terms of extension to make such an initiative into a resounding success. It should be noted that parcels at a much smaller scale have also been establish as a
Picture 10: EMP, Mucuna field on KBP6, Komé

EMP 2010 Annual Individual Report on Vulnerability 50
demonstration activity in the improved agricultural training portion of the program (refer to section 1.3.2.)
1.4. Livelihood Restoration Monitoring Among Reinforced Training Graduates
As reported in last years report most of the individuals who received some form of reinforcement saw their level of livelihood restored to some extent. To the best of our knowledge most of them would in fact still be active as of en of 2010 (refer to section 1.3.3.) Integrating the data on the 198 individuals having received reinforcement training into the LUMAP data base we can derive the following conclusion. ◙ Out of 198 individuals trained the reinforcement program only 143 can be identified in the database. The 55 individuals who cannot be retraced at present were either never impacted by the Project or because of name substitution they cannot be correlated with the official list of those compensated which we presently have (basically the person who may have received the training was not the head of the HH which was impacted). ◙ Out of the 143 who remain as compensated individuals, 121 were false positives as defined in part 2 section 1.1 (page 31). Basically individuals who were not entitled to be trained. ◙ The 22 that remain either reside outside of the 15 villages covered by the cadastral survey or were not identified in the cadastral survey, probably meaning they are not actively farming in these 15 villages at present, if they were ever truly active. ◙ That leaves us with 6 reinforced individuals for whom we can confirm that they were truly eligible.
As part of the monitoring process which is ongoing with the individuals trained in agriculture some of these 28 (reinforced individuals) will be monitored allowing us to gain a better perspective as to their present status. The development of a process to estimate the value of the product of non-agricultural
activities is underway. This process will:
◙ Establish the value of the agricultural production from one corde using only traditional
practices, or using some or all of the improved practices offered during the improved
agriculture class.
◙ Convert the income or product value arising from activities not related to agricultural
(fishing, sowing, brick laying, roofing, trade) or to non-land based agriculture (Cattle
breeding, small ruminants, fowls and pigs) to a one corde equivalent using the value of
these commodities/services as an indicator.
◙ Establish the potential adjustment required for a more intensive system which has the
potential to generate a much higher value per corde (production of wetland rice, vegetable
production).
omé

EMP 2010 Annual Individual Report on Vulnerability 51
Overall the development of such a tool will allow us to explain and quantify the possibility for
some eligible’s to compensate for some of the loss of land either by substitution or
intensification of productive activities.

EMP 2010 Annual Individual Report on Vulnerability 52
2. HOUSEHOLDS AT RISK As village surveys have been completed and the data on Non-Viable HH has become
available, those HH have either been added to the classes of 2008-9 or 2009-10; their
situations have been discussed above. These classes are as follows:
• 2009-10 73
• 2010-11 21
o 17 men; 4 women
o Located in 7 of the surveyed villages
• 2011-12 98
The Non-Viable HH identified by the most recent surveys will be included in the class of
2012-13. In addition, a Management of Change addendum was approved in 2009 making
vulnerable Marginal compensated HH eligible for resettlement as a pro-active measure to
improve their circumstances. The definition of vulnerable involves the following criteria:
• HHH age 25-39
• HHM = 4 or more
• Handicap
• Residence in non-natal village
• Encounters difficulty in getting through the August through October time period, the so
called “hungry season”
The situation of these Non-Viable and Marginal HH not yet offered an option is examined in
the table below. The distribution among Marginal HH is representative of the distribution
among HH. But the NV HH numbers are given for information only and do not represent any
distribution; too many NV HH have already been offered resettlement options. The numbers
below may change as remaining villages are analyzed.
The following figures indicate that numerous marginal HH have many members using limited
common resources.

EMP 2010 Annual Individual Report on Vulnerability 53
Figure 9: Age distribution household Class 2010
0
5
10
15
20
25
< 20 20 - 29 30 - 39 40 - 49 50+
Age categories
# HH
Non-viable HH Marginal HH
By the age distribution of Marginal HH, we again see that the HH that truly have very limited
land holdings become evident in their late 20s and their 30s.
Figure 10: Distribution non-viable & marignal HH size
0
5
10
15
20
25
30
35
40
45
50
1 2 3 4 5 6 7 8 9 10 11 12 13 14 15 16 17 18 19
# HHM
# H
H HH Non-ViableHH Marginal
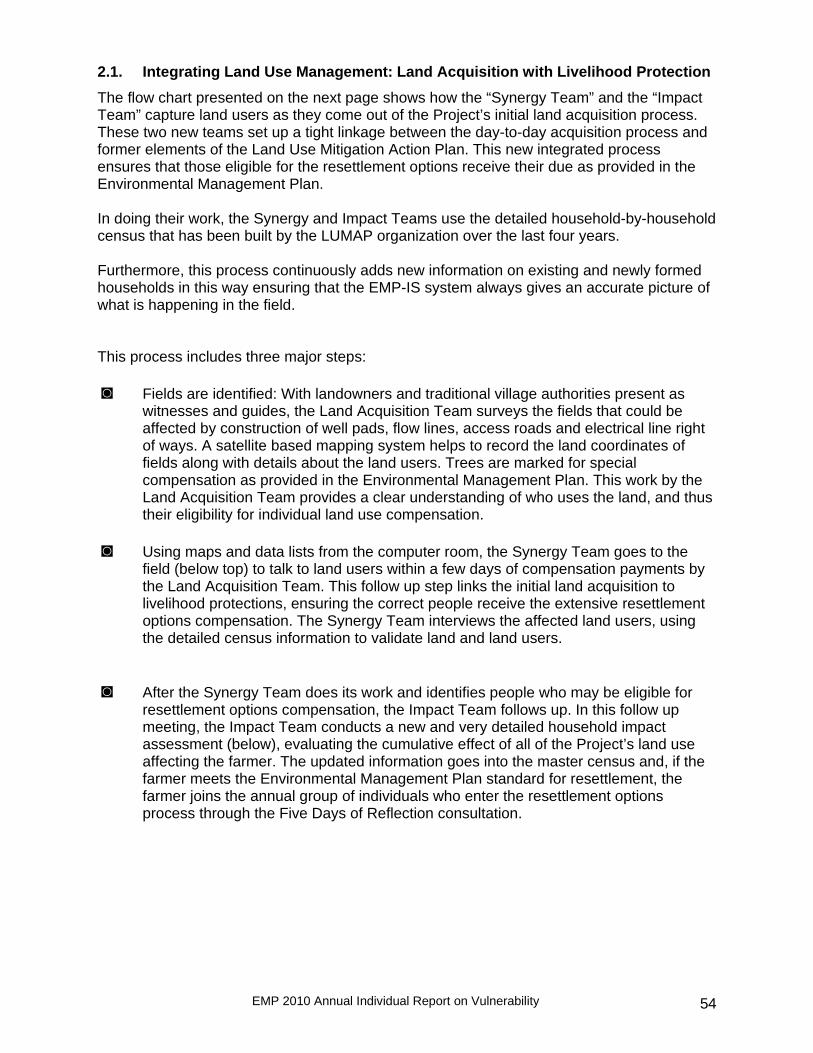
EMP 2010 Annual Individual Report on Vulnerability 54
2.1. Integrating Land Use Management: Land Acquisition with Livelihood Protection The flow chart presented on the next page shows how the “Synergy Team” and the “Impact Team” capture land users as they come out of the Project’s initial land acquisition process. These two new teams set up a tight linkage between the day-to-day acquisition process and former elements of the Land Use Mitigation Action Plan. This new integrated process ensures that those eligible for the resettlement options receive their due as provided in the Environmental Management Plan. In doing their work, the Synergy and Impact Teams use the detailed household-by-household census that has been built by the LUMAP organization over the last four years. Furthermore, this process continuously adds new information on existing and newly formed households in this way ensuring that the EMP-IS system always gives an accurate picture of what is happening in the field. This process includes three major steps: ◙ Fields are identified: With landowners and traditional village authorities present as
witnesses and guides, the Land Acquisition Team surveys the fields that could be affected by construction of well pads, flow lines, access roads and electrical line right of ways. A satellite based mapping system helps to record the land coordinates of fields along with details about the land users. Trees are marked for special compensation as provided in the Environmental Management Plan. This work by the Land Acquisition Team provides a clear understanding of who uses the land, and thus their eligibility for individual land use compensation.
◙ Using maps and data lists from the computer room, the Synergy Team goes to the
field (below top) to talk to land users within a few days of compensation payments by the Land Acquisition Team. This follow up step links the initial land acquisition to livelihood protections, ensuring the correct people receive the extensive resettlement options compensation. The Synergy Team interviews the affected land users, using the detailed census information to validate land and land users.
◙ After the Synergy Team does its work and identifies people who may be eligible for
resettlement options compensation, the Impact Team follows up. In this follow up meeting, the Impact Team conducts a new and very detailed household impact assessment (below), evaluating the cumulative effect of all of the Project’s land use affecting the farmer. The updated information goes into the master census and, if the farmer meets the Environmental Management Plan standard for resettlement, the farmer joins the annual group of individuals who enter the resettlement options process through the Five Days of Reflection consultation.

EMP 2010 Annual Individual Report on Vulnerability 55

EMP 2010 Annual Individual Report on Vulnerability 56
Part 3: Conclusions on LUMAP Findings

EMP 2010 Annual Individual Report on Vulnerability 57
CONCLUSIONS ON LUMAP FINDINGS
Through the village survey work accomplished between mid-2007 and end 2010 the
following points are clear:
• LUMAP tools drew and continue to provide a detailed picture of land use and village
and household impact before and during the Project period;
• Impact of Project land acquisition has acted on individual households within the village
rather than on the village as a whole;
• A common distribution of productive resources is found throughout the villages, with
about 20% faced with below-normal or marginal livelihoods, 30% possessing enough
productive resources to earn an adequate living, and 50% of households with enough
resources to maintain the household and its offshoots well into the future;
• The Project’s land acquisition has in the main led to the decline of marginally viable
households into agricultural non-viability; it has also worsened the situation of those
already non-viable with whom it interacted;
• But the skewed distribution of productive resources reflects the working of traditional
social mechanisms for resolving social tensions: moving to another (non-kin) village,
setting up an independent household in a non-natal village, both of which can mean
abandoning the productive assets previously used and the families land trust when
there is one;
• These social mechanisms along with village survey results on landholdings allow the
pre-identification of households that are most probably at risk;
• The greatest impact on productive resources in the last 20 years has been the
population explosion since the end of the civil war in the early 1990’s (predates any
Project activities);
• Even before this sharp increase in inhabitants, the culture for many years has used
social and geographical measures to deal with too much population using too few
resources; these measures remain active up to the present day;
• The resettlement options providing households with alternative methods of increasing
income and production have been largely successful; the addition of Basic Business
Skills, improved training options have been contributory;
• The Land Use Mitigation Action Plan has succeeded in identifying affected
households that had been missed earlier. They have been or will soon be included in
exercising a resettlement option. By the end of 2010 the problem of non-viable
households is clearly at a manageable level.

EMP 2010 Annual Individual Report on Vulnerability 58
• The introduction of both the Synergy and Impact program make it possible to deal with
vulnerable HH at the onset of the compensation process. Insuring that data on
vulnerable affected households is upgraded and that the appropriate Relocation
options are offered to the eligible.

EMP 2010 Annual Individual Report on Vulnerability 59
Annexes

EMP 2010 Annual Individual Report on Vulnerability 60
Annex 1:
Comparison of Population and Land Availability between Former Quartiers of Split Villages
Bégada I Bégada II Béla I Béla II Dildo Bayande Dokaïdilti BanelaouPopulation district 669 624 474 374 638 716 398 138 % population district 52% 49% 56% 44% 47% 53% 74% 26% Population density (person/corde)
0.22 0.23 0.25 0.27 0.49 0.39 NA NA
Population density (corde/person)
4.49 3.87 4.06 3.65 2.03 2.55 NA NA
# HH in district 151 109 79 65 127 148 59 26 % HH in district 58% 42% 55% 45% 46% 54% 69% 31% Avg. corde/HH 20 22 24 21 10 12 11 12
Avg. corde/capita 6 6 4 7 2 3 2 3
Danmadja I Danmadja II Ngalaba I Ngalaba II Wolo Bero I Bero II Bero III Bero IV Population district 369 210 512 694 118 769 1645 375 932
% population district
64% 36% 39% 52% 9% 21% 44% 10% 25%
Population density (person/corde)
1.75 2.07 0.48 0.37 0.55
Population density (corde/person)
0.57 0.48 2.09 2.71 1.83
# HH in district 61 41 102 129 19 121 257 64 150 % HH in district 60% 40% 41% 52% 8% 20% 43% 11% 25% Avg. corde/HH 11 11 10 15 11
Avg. corde/capita 2 2 2 3 2

EMP 2010 Annual Individual Report on Vulnerability 61
Annex 2
Distribution of Individual HH per Village by Per Capita Land Holdings
Village All/Compensated <2/3 <1 <2.5 2.5+
All 12 11 56 176 Bégada
Compensated 9 9 42 126
All 11 8 32 94 Béla
Compensated 5 1 18 69
All 95 62 213 222 Bero
Compensated 61 44 172 185
All 13 15 49 24 Danmadja
Compensated 12 12 44 20
All 33 39 111 89 Dildo
Compensated 9 19 51 36
All 10 12 37 26 Dokaïdilti
Compensated 9 11 32 21
All 16 11 55 46 Madjo
Compensated 13 9 50 40
All 23 10 55 62 Maïkeri
Compensated 11 4 44 52
All 17 17 82 153 Mbanga
Compensated 11 13 65 129
All 3 3 35 44 Mouarom
Compensated 2 3 29 38
All 21 19 103 105 Ngalaba
Compensated 18 15 86 93
All 10 12 25 14 Poutouguem
Compensated 8 11 22 11
All 264 219 853 1055 TOTAL
Compensated 168 151 655 820

EMP 2010 Annual Individual Report on Vulnerability 59
Capita Land Distribution (Cordes per Capita)
Land category
Bégada Béla Bero Danmadja Dildo Dokaïdilti Madjo Maïkeri Mbanga Mouarom Ngalaba Poutouguem Average
<2/3 6% 8% 17% 16% 13% 12% 14% 10% 6% 8% 8% 1% 10% <1 5% 5% 10% 21% 15% 15% 9% 7% 6% 3% 8% 20% 10% <2.5 22% 22% 36% 39% 40% 42% 43% 39% 30% 36% 41% 42% 36% 2.5+ 68% 65% 37% 25% 32% 31% 34% 44% 57% 53% 42% 23% 43%
Village Impact Classification According to Number of HH Land Holding Status
% Non‐Viable HH / All HH % Non‐Viable Compensated HH
/ All Compensated HH Bégada 4.7% 4.8% Béla 7.6% 5.4% Bero 16.0% 13.2% Danmadja 12.9% 13.6% Dildo 12.1% 7.8% Dokaïdilti 11.8% 12.3% Madjo 12.5% 11.6% Maïkeri 15.3% 9.9% Mbanga 6.3% 5.0% Mouarom 3.5% 2.8% Ngalaba 8.5% 8.5% Poutouguem 16.4% 15.4% TOTAL 11.0% 9.4%
High 15.0%Approach High 10.0%Moderate 5.0%Low 0.0%

EMP 2010 Annual Individual Report on Vulnerability 60
Annex: 3
Gender and their relative position as HHH
Village #HH #
Males #
Females MHHH FHHH %
FHHH Bégada 255 608 679 187 72 28% Béla 145 428 402 126 18 13% Bero 592 1924 1945 527 84 27% Danmadja 101 284 286 87 14 14% Dildo 272 649 677 213 55 21% Dokaïdilti 85 243 290 75 10 12% Kome 192 476 464 157 35 22% Madjo 129 412 427 112 19 15% Maïkeri 140 382 338 115 25 22% Maïnani 109 323 279 103 6 6% Mbanga 269 717 780 205 64 24% Mouarom 85 213 231 72 12 14% Naïkam 54 138 137 49 5 10% Ngalaba 248 664 654 173 76 31% Poutouguem 61 155 151 51 10 20%

EMP 2010 Annual Individual Report on Vulnerability 61
Age distribution by village
Age and Gender of land holders over 30 cordes Per Capita
Male land holder Age
Female land holder Age
Bégada 1 50 3 73; 75; 77 Béla 2 52; 65 0 Béro 0 1 64 Dildo 0 1 78 Komé 2 53; 56 1 33 Mbanga 0 1 67 Naïkam 1 25 0 Ngalaba 0 1 61
Village Avg Age Males
Avg Age Females
Avg Age Population
Bégada 18.5 20.5 19.5
Béla 18.3 20.1 19.2
Bero 17.3 18.8 18.1
Danmadja 19.8 19.5 19.6
Dildo 19.8 22.2 21.1
Dokaïdilti 19.8 21.0 20.4
Kome 20.3 20.8 20.5
Madjo 16.6 19.4 18.0
Maïkeri 20.6 21.0 20.8
Maïnani 19.1 21.3 20.1
Mbanga 17.4 21.2 19.3
Mouarom 19.8 20.4 20.1
Naïkam 20.3 19.7 20.0
Ngalaba 18.9 22.2 20.5
Poutouguem 20.0 19.4 19.7

EMP 2010 Annual Individual Report on Vulnerability 62
Annex 4: Summary of resettlement factor by village
# All Begada HH at Resettlement factor Male HHH Female HHH
206 63 HH viability
factor Total # current HH
before now Before Now Zero 0 0 0 0 0 <2/3 17 5 8 8 9 <1 16 8 12 5 4 <2.5 82 59 65 15 17 2.5+ 154 134 121 35 33
# All Bela HH at Resettlement factor Male HHH Female HHH
127 17 HH viability
factor Total # current
HH before now Before Now
Zero 0 0 0 0 0 <2/3 12 6 9 3 3 <1 7 8 6 1 1 <2.5 32 27 28 3 4 2.5+ 93 86 84 10 9
# All Bero HH at Resettlement factor Male HHH Female HHH
521 84 HH viability
factor Total # current HH
before now Before Now Zero 11 3 5 3 6 <2/3 90 49 70 18 20 <1 68 33 55 10 13 <2.5 215 167 194 28 21 2.5+ 221 197 197 24 24
# All Danmadjia HH at Resettlement factor Male HHH Female HHH
87 15 HH viability
factor Total # current
HH before now Before Now
Zero 1 0 0 0 1 <2/3 15 10 13 2 2 <1 21 7 16 2 5 <2.5 40 41 35 8 5 2.5+ 25 30 23 2 2

EMP 2010 Annual Individual Report on Vulnerability 63
# All Dildo HH at Resettlement factor Male HHH Female HHH
216 58 HH viability
factor Total # current
HH before now Before Now
Zero 5 4 4 0 1 <2/3 31 16 20 11 11 <1 40 27 32 8 7 <2.5 111 101 95 16 16 2.5+ 88 69 65 23 23
# All Dokaïdilti HH at Resettlement factor Male HHH Female HHH
72 10 HH viability
factor Total # current HH
before now Before Now Zero 0 0 0 0 0 <2/3 10 4 7 3 3 <1 13 6 11 2 2 <2.5 36 41 31 2 2 2.5+ 26 24 23 3 3
# All Madjo HH at Resettlement factor Male HHH Female HHH
120 13 HH viability
factor Total # current HH
before now Before Now Zero 3 1 3 0 0 <2/3 16 11 13 3 3 <1 12 11 11 0 1 <2.5 57 46 52 6 5 2.5+ 45 50 41 5 4
# All Maïkeri HH at Resettlement factor Male HHH Female HHH
115 25 HH viability
factor Total # current
HH before now Before Now
Zero 11 1 8 1 3 <2/3 2 7 2 1 0 <1 10 8 10 0 0 <2.5 55 48 47 8 8 2.5+ 62 51 48 15 14
# All Mbanga HH at Resettlement factor Male HHH Female HHH
206 63 HH viability
factor Total # current
HH before now before Now
Zero 0 0 0 0 0 <2/3 17 5 8 8 9 <1 16 8 12 5 4 <2.5 82 59 65 15 17 2.5+ 154 134 121 35 33

EMP 2010 Annual Individual Report on Vulnerability 64
# All Mouarom HH at Resettlement factor Male HHH Female HHH
75 11 HH viability
factor Total # current HH
before now before now Zero 3 0 2 1 1 <2/3 4 5 4 0 0 <1 3 0 2 0 0 <2.5 31 22 25 7 6 2.5+ 46 48 42 4 4
# All Ngalaba HH at Resettlement factor Male HHH Female HHH
173 77 HH viability
factor Total # current
HH before now before now
Zero 2 0 0 2 2 <2/3 19 8 12 6 7 <1 20 13 14 4 6 <2.5 103 63 73 21 30 2.5+ 106 90 74 36 32
# All Poutouguem HH at Resettlement factor Male HHH Female HHH
51 10 HH viability
factor Total # current HH
before now before now Zero 0 0 0 0 0 <2/3 9 3 7 1 2 <1 12 4 10 2 2 <2.5 26 27 23 4 3 2.5+ 14 17 11 0 3

EMP 2010 Annual Individual Report on Vulnerability 65
Annex 5: Change in HH landholding status
Change in status
Bégada Béla Bero Danmadja Dildo Dokaïdilti Madjo Maïkeri Mbanga Mouarom Ngalaba Poutouguem TOTAL
Non‐viable to zero
2 0 5 1 1 0 2 9 0 2 0 0 22
Marginal to zero
0 0 0 0 0 0 0 0 0 0 0 0 0
Marginal to Non‐Viable
2 2 17 3 4 2 3 0 3 0 4 4 44
Comfortable to Non‐Viable
3 1 8 1 1 1 1 0 1 1 1 0 19
Wealthy to Non‐Viable
0 0 1 0 1 0 0 0 0 0 0 0 2
Comfortable to Marginal
6 0 28 15 8 7 4 3 6 3 7 8 95
Wealthy to Marginal
0 0 0 0 0 0 0 0 0 0 0 0 0
Wealthy to Comfortable
14 3 31 7 3 1 10 4 15 6 19 6 119
Overall social impact of Project
27 6 90 27 18 11 20 16 25 12 31 18 301

EMP 2010 Annual Individual Report on Vulnerability 66
Annex 6
Comparison of viability level between the initial evaluation (declarative) and the reality (survey). By
village
False
NegativeFalse
PositiveTrue
PositiveTrue
Negative Bégada 9 33 1 145 Béla 1 7 4 81 Béro 46 114 16 287
Danmadja 9 26 3 50 Dildo 5 23 4 83
Dokaïdilti 1 28 8 36 Komé 2 0 0 47 Madjo 9 50 3 49 Maïkéri 8 7 3 93 Maïnani 2 8 0 72 Mbanga 10 50 1 160 Mouarom 0 15 2 55 Naïkam 0 1 0 23 Ngalaba 16 48 2 146
Poutouguem 8 0 0 44 Total 126 410 47 1,372

EMP 2010 Annual Individual Report on Vulnerability 67
Annex 7: KPI Population Statistics
Presented below you will find statistics regarding the population in general and in particular
on households and their head. Then it tracks HHH (Household Head) who are vulnerable,
considering that young HHH males (under 25) are more likely to become vulnerable. They
are identified as youth bear. The results presented in the table show several household
characteristics by age bracket:
Age #
HH Sex(M) Sex(F) Size HH Land HH Factor HH # Vulnerable HH % Vulnerable HH
< 20 29 27 2 2.6 6.73 2.61 3 1020 ‐ 23 175 165 10 3.4 9.78 2.95 24 1424 ‐ 30 722 688 34 5 13.16 2.91 90 1231 ‐ 44 917 774 143 7 17.55 2.88 108 1245 ‐ 59 603 419 184 6 20.07 4.05 58 1060 ‐ 69 179 99 80 3.6 17.64 6.08 12 770 + 94 46 48 2.7 18.05 8.82 0 0 Age Age bracket # HH # of households per age bracket Sex (M) # of household led by a male Sex (F) # of household led by a female Size HH Average size of household (# of dependents) Land HH Average size of land holds (field area) Factor HH Average of vulnerability factor # Vulnerable HH # of households who are vulnerable (vulnerability factor < 0.667) % Vulnerable HH Proportion of vulnerable households among an age bracket

EMP 2010 Annual Individual Report on Vulnerability 68
Distribution of HHH by age
0
100
200
300
400
500
600
700
800
900
1000
< 20 20 - 23 24 - 30 31 - 44 45 - 59 60 - 69 70 +
Age
# HH
Sex(M)
Sex(F)
Distribution of HHH by age
0
5
10
15
20
25
< 20 20 - 23 24 - 30 31 - 44 45 - 59 60 - 69 70 +
Age
SizeHH
LandHH
FactorHH
% Vulnerable HH

EMP 2010 Annual Individual Report on Vulnerability 69
Degree youth bear with heavy charge
# HHH young males
# Young males % HHH youth bear
192 6726 2.9
Degree youth bear with heavy charge by village (surveyed)
Village # HHH young
males # Young males % HHH youth bear
Bégada 16 464 3.4 Béla 10 322 3.1 Béro 55 1519 3.6
Danmadja 4 204 2 Dildo 11 473 2.3
Dokaïdilti 4 174 2.3 Komé 12 350 3.4 Madjo 12 332 3.6 Maïkéri 8 268 3 Maïnani 4 152 2.6 Mbanga 25 624 4 Mouarom 11 169 6.5 Naïkam 6 101 5.9 Ngalaba 6 500 1.2
Poutouguem 8 109 7.3 Village Village name # HHH young males # of young males (under 25) who are households head # Young males # of young males % HHH youth bear Proportion of young males who have to bear charge of leading a household This table shows the proportion of young males who have to bear charge of leading a
household. Only villages that were surveyed are listed in the table.

EMP 2010 Annual Individual Report on Vulnerability 70
Population growth (between village survey and KPI survey campaigns)
Births Weddings Deceases Leavings Adds Pop
Surveyed Pop
Growth % Growth
66 15 35 22 57 715 66 9.2 Population growth (between village survey and KPI survey campaigns) per village
Village Births Weddings Deceases Leavings Adds Pop Surveyed
Pop Growth % Growth
Bégada 8 2 5 3 4 65 4 6.2
Béla 0 0 2 0 2 43 0 0
Béro 16 2 7 5 10 235 14 6
Danmadja 2 1 0 1 4 21 5 23.8
Dildo 7 3 6 2 11 50 10 20
Dokaïdilti 4 1 4 0 2 35 2 5.7
Madjo 6 0 1 1 6 54 10 18.5
Mbanga 9 2 5 1 6 101 9 8.9
Mouarom 3 1 1 0 5 24 7 29.2
Ngalaba 11 3 4 9 7 87 5 5.7
Village Village name Births # of births that occurred in the household since the last village survey Weddings # of weddings that occurred in the household since the last village survey Deceases # of deceases that occurred in the household since the last village survey Leavings # of leavings that occurred in the household since the last village survey Adds # of adds that occurred in the household since the last village survey Pop Surveyed Population (# of HHH and dependents) among the 106 household that was
surveyed at the last village survey Pop Growth Population increase or decrease in the village between village survey and KPI
survey = Births + Adds ‐ (Deceases + Leavings) % Growth = (Pop Growth / Pop surveyed) x 100
EMP 2010 Annual Individual Report on Vulnerability 71
We took in consideration changes that occurred in the households selected for KPI surveys.
Date represents changes among the household individuals (HHH, dependents) between the
last village survey and the last KPI survey (2 KPI surveys were done for each household:
Food & Investment, Health & Education). Changes considered include birth, death,
departure, immigration. Wedding information is not used.

EMP 2010 Annual Individual Report on Vulnerability 72
Annex 8 – KPI Statistics about financial capacity, employment
Most of data come from village survey campaigns. KPI surveys were used to get more recent
information about tontine and to analyze soudure data. Indeed the soudure field is populated
in the database as a text field. So we had to classify the soudures by financial situation for
the household.
Problem of soudure by village
Situation
Village Critical Less
Critical No
Problem Comfortable
Very comfortable
Total
Bégada 2 6 1 4 13 Béla 5 1 1 7 Béro 5 10 11 6 1 33 Danmadja 1 2 1 1 5 Dildo 1 3 4 4 12 Dokaïdilti 2 1 1 4 Madjo 1 2 1 2 6 Mbanga 4 3 3 1 2 13 Mouarom 1 2 1 4 Ngalaba 5 2 4 1 12 Total 26 29 24 23 7 109
This table classifies households by financial situation regarding their ability to provide for
one's family. Criteria are the soudure collected during KPI survey.
Problem of soudure by village
0
5
10
15
20
25
30
35
Bég
ada
Bél
a
Bér
o
Dan
mad
ja
Dild
o
Dok
aïdi
lti
Mad
jo
Mba
nga
Mou
arom
Nga
laba
Very confortableConfortableNo ProblemLess CriticalCritical

EMP 2010 Annual Individual Report on Vulnerability 73
Average amount invested in Tontine Per year by sex of Household Head
Sex of HHH Average investment per
Year Female 30123 Male 79246
Average investment per Year Average amount of household annual investment, by sex of the
household head Sex of HHH Sex of the household head This table shows the average amount invested by households in a Tontine per year.
This average amount is compared between households led by females and households led
by males.
Amount invested per year by households (Tontine + Saving)
Range Investment # HH Min Range (K CFA)
0 ‐ 39999 198 0 40000 ‐ 79999 501 40 80000 ‐ 119999 255 80 120000 ‐ 159999 121 120 160000 ‐ 199999 13 160 200000 ‐ 299999 67 200 300000 ‐ 399999 17 300 400000 ‐ 499999 5 400 500000 ‐ 599999 10 500 600000 ‐ 699999 3 600 700000 ‐ 799999 2 700 800000 ‐ 899999 1 800 900000 ‐ 999999 1 900
1000000 ‐ 1099999 5 1000 1200000 ‐ 1299999 2 1200 1300000 ‐ 1399999 2 1300 1500000 ‐ 1599999 3 1500 2000000 ‐ 2999999 11 2000 3000000 ‐ 3999999 3 3000 4000000 ‐ 4999999 1 4000 5000000 ‐ 5999999 1 5000 6000000 ‐ 6999999 1 6000 10000000 ‐ 10999999 1 10000
Range Investment Range of investment done per year by a household # HH # of households who are in the respective range of annual
investment

EMP 2010 Annual Individual Report on Vulnerability 74
Min Range (K CFA) Minimum value of the range in K CFA (Kilo CFA)
This table displays the # of HH per range of amount of investment per year in K CFA
(Thousand CFA). Steps of ranges changes according to a bracket of minimum values of
range:
Min Range <= 200 000 CFA: ranges of 40 000 CFA
Min Range <= 2 000 000 CFA: ranges of 100 000 CFA
Min Range > 2 000 000 CFA: ranges of 1 000 000 CFA
Amount invested per year by households (Tontine + Saving)
0
100
200
300
400
500
600
0 40 80 120
160
200
300
400
500
600
700
800
900
1000
1200
1300
1500
2000
3000
4000
5000
6000
1000
0
Amount of investment (K CFA) / year

EMP 2010 Annual Individual Report on Vulnerability 75
Young males unemployed (seek employment) Among dependents young males (age 15-24)
# Young Male Dep Unemployed
# Young Males Dep Unemployment rate
46 950 4.8 # Young Male Dep Unemployed # of young males who are dependent in a household and seek
employment # Young Males Dep Total # of young males who are dependent in a household Unemployment rate Unemployment rate among young males:
[# Young Male Dep Unemployed]/ [# Young Males Dep])*100
This table shows the unemployment rate among young males. Only young males with age
15-24 and who are dependent of household (no HHH) are considered, assuming HHH have
incomes or activities to bear the household. Moreover a dependent is considered
unemployed only if he seeks employment.

EMP 2010 Annual Individual Report on Vulnerability 76
Annex 9 – KPI Education Statistics
Particularly, it focuses on school attendance, education level and the capacity to face school
fees.
School attendance among children in age for school
Age for School
Attend School
Age for School (M)
Age for School (F)
Attend School (M)
Attend School (F)
% Attend School (M)
% Attend School (F)
Bégada 27 25 16 11 15 10 93.8 90.9 Béla 22 21 15 7 14 7 93.3 100 Béro 75 70 40 35 36 34 90 97.1
Danmadja 9 7 5 4 4 3 80 75 Dildo 30 28 22 8 21 7 95.5 87.5
Dokaïdilti 13 11 10 3 8 3 80 100 Madjo 29 28 21 8 20 8 95.2 100 Mbanga 58 57 36 22 35 22 97.2 100 Mouarom 16 16 10 6 10 6 100 100 Ngalaba 47 40 30 17 27 13 90 76.5 TOTAL 326 303 205 121 190 113 92.7 93.4
Age for School # of children in age for school Attend School # of children who attend school Age for School (M) # of male children in age for school Age for School (F) # of female children in age for school Attend School (M) # of male children who attend school Attend School (F) # of female children who attend school % Attend School (M) Rate of school attendance among male children in age for school % Attend School (F) Rate of school attendance among female children in age for school This table shows the proportion of children of school age who are currently attending school.
A comparison is done between males and females. Data were collected during KPI survey.

EMP 2010 Annual Individual Report on Vulnerability 77
School attendance among children in age for school by gender
0
20
40
60
80
100
120
Bégad
aBéla Béro
Danmad
jaDild
o
Dokaïdi
lti
Madjo
Mbanga
Mouarom
Ngalaba
Total
Rate Males
Females
Education level per gender
Education Level Male Female No education 849 2092 Too young to study 2124 2009 Primary school 3528 3028 Koranic school 2 2 College 761 224 Technical education 8 0 High school 197 38 University 11 0 N/A 102 300
Male # of males who reached the respective education levels Female # of females who reached the respective education levels
This table shows # of individuals per education level. A comparison is done between males
and females.

EMP 2010 Annual Individual Report on Vulnerability 78
Literacy rate per gender
Male Literate male
Female Literate female
Rate for male
Rate for female
7582 979 7693 264 12.9 3.4 Male Total # of males surveyed Literate male # of males who are literate Female Total # of females surveyed Literate female # of females who are literate Rate for male Rate of literate males among the surveyed population Rate for female Rate of literate females among the surveyed population
This table displays the rate of literate individuals among the population of villages that were
surveyed. A person is considered literate when he/she has completed the primary school.
However the only information available from the survey is the education level a person has
reached. And there is no way to determine if the person has completed or not this level. So
here we assume literate individuals are those who have at least reached a secondary school
level.

EMP 2010 Annual Individual Report on Vulnerability 79
Annex 10 – KPI Health Statistics
Proportion of children under 5 sleeping under bed nets
# Bed Nets # HH
0 1259 1 696 2 458 3 194 4 92 5 37 6 21 7 11 8 7 9 4 10 2 11 1 28 1
54.8% of households have bed nets. The purpose of this table is to show the proportion of
children under 5 sleeping under bed nets. But surveys only tell how many bed nets a
household is using. So we assume that if a HH has bed nets then children are sleeping
under them since young children sleep with their mother.
Households that can face health care expenses
Can face expenses
Total HH % HH can
face expenses
2383 2783 85.6%
During the village surveys campaign, HHH were asked if they could face health care
expenses for themselves and their dependents. (see table next page)

EMP 2010 Annual Individual Report on Vulnerability 80
Medicine practices
Disease categories
Nurse Village
ClinicCare Center
Public Hospital
Private Hospital
Traditional PharmacyDr Djim / Tchoukou
Traditionalmedicine
Modernmedicine
Malaria 7 3 92 8 4 5 9 18 30 116 Respiratory disorders
1 2 32 0 2 2 8 6 9 44
Parasites 3 0 35 2 2 1 1 5 9 40 Gastric disorders
0 2 27 1 0 1 1 4 5 31
Hygiene 1 0 10 3 1 5 0 5 11 14 Flu 0 0 7 1 0 0 0 4 4 8
Yellow‐fever 0 0 3 0 0 2 3 0 2 6 Anemia 0 0 4 3 1 0 0 0 0 8
Meningitis 0 0 1 0 0 0 0 0 0 1 Others 3 4 41 3 5 27 5 11 41 58

EMP 2010 Annual Individual Report on Vulnerability 81
0%
10%
20%
30%
40%
50%
60%
70%
80%
90%
100%
Malaria
Respira
tory dis
orders
Parasit
es
Gastric
diso
rders
Hygien Flu
Yellow
-feve
r
Anaem
ia
Mening
itis
Others
Dr Djim TchoukouPharmacyTraditionalPrivate HospitalPublic HospitalCare CenterClinicNurse Village
0%
10%
20%
30%
40%
50%
60%
70%
80%
90%
100%
Malaria
Respira
tory dis
orders
Parasit
es
Gastric
diso
rders
Hygien Flu
Yellow
-feve
r
Anaem
ia
Mening
itis
Others
ModernmedicineTraditionalmedicine

EMP 2010 Annual Individual Report on Vulnerability 82
This information was collected during the KPI surveys campaign. Diseases are classified in
categories (10 categories identified).
The first chart represents the medical practice people select to deal with their ailment. During
the KPI survey, they had choice between 8 medicine practices to answer the poll.
The second chart has gathered medicine practices in 2 categories:
- Modern medicine: Clinic, Care center, Hospital, Pharmacy
- Traditional medicine: Nurse Village, Traditional, Dr Djim / Tchoukou
Medicine effectiveness
Individual Traditional medicine
Modernmedicine
Cured Traditional medicine cured
Modern medicine cured
Traditional medicine not cured
Modern medicine
not cured
Malaria 131 28 110 123 23 104 5 6 Respiratory disorders
46 8 40 41 8 35 0 5
Parasites 42 7 37 37 5 33 2 4 Gastric disorders
28 5 24 23 5 19 0 5
Hygiene 16 8 9 11 5 7 3 2 Flu 13 4 8 10 3 7 1 1
Yellow‐fever 7 2 6 7 2 6 0 0 Anemia 6 0 6 6 0 6 0 0
Meningitis 1 0 1 1 0 1 0 0 Others 70 28 48 55 17 41 11 7
Category Disease categories Individual # of individuals who caught the disease Traditional medicine # of individuals who used traditional medicine for treatment Modern medicine # of individuals who used modern medicine for treatment Cured # of individuals who were cured from the disease Traditional medicine cured # of individuals who used traditional medicine for treatment and were cured Modern medicine cured # of individuals who used modern medicine for treatment and were cured Traditional medicine not cured # of individuals who used traditional medicine for treatment but were not cured Modern medicine not cured # of individuals who used modern medicine for treatment but were not cured

EMP 2010 Annual Individual Report on Vulnerability 83
Traditional medicine Effectiveness
0
5
10
15
20
25
30
Malaria
Respira
tory dis
orders
Parasit
es
Gastric
diso
rders
Hygien Flu
Yellow
-feve
r
Anaem
ia
Mening
itis
Others
Not CuredCured
Modern medicine Effectiveness
0
20
40
60
80
100
120
Malaria
Respira
tory dis
orders
Parasit
es
Gastric
diso
rders
Hygien Flu
Yellow
-feve
r
Anaem
ia
Mening
itis
Others
Not CuredCured
This information was collected during the KPI surveys campaign. The table displays the
number of individuals who were cured or not for modern versus traditional medicine.
Annex 11 – KPI Food Statistics

EMP 2010 Annual Individual Report on Vulnerability 84
Fish/Meat indicator
Village # HH Eat fish Eat poultry Eat meat Eat game meat
Bégada 13 13 3 10 1 Béla 7 6 3 3 0 Béro 33 30 8 22 2 Danmadja 5 5 1 4 0 Dildo 12 10 4 9 0 Dokaïdilti 4 4 0 2 1 Madjo 6 6 3 4 0 Mbanga 13 13 2 11 0 Mouarom 4 4 4 4 0 Ngalaba 12 8 3 8 0
# HH # HH surveyed in the village (KPI survey) Eat fish # HH that eat fish at least once a week Eat poultry # HH that eat poultry at least once a week Eat meat # HH that eat meat at least once a week Eat game meat # HH that eat game meat at least once a week
This table identifies the # of households that eat fish or meat at least once a week.
# HH eating fish / meat during week
0
5
10
15
20
25
30
35
Bégad
aBéla Béro
Danmad
jaDild
o
Dokaïdi
lti
Madjo
Mbanga
Mouarom
Ngalaba
Total HHFishPoultryMeatGame meat

EMP 2010 Annual Individual Report on Vulnerability 85
Frequency of eating (Fish, Poultry, Meat, Game meat)
Village Avg fish per week
Avg poultry per week
Avg meat per week
Avg game meat
per week Bégada 2.2 0.2 1.8 0.1 Béla 2.3 0.6 1.7 0 Béro 2 0.2 1.4 0.1 Danmadja 3.2 0.2 1.2 0 Dildo 2.3 0.3 1.3 0 Dokaïdilti 5.2 0 0.8 0.5 Madjo 2.2 0.5 1.8 0 Mbanga 2.2 0.2 1.4 0 Mouarom 2.5 1.2 2.8 0 Ngalaba 1.3 0.2 1.2 0
Avg fish per week Average of frequency the households living in the village eat fish per week Avg poultry per week Average of frequency the households living in the village eat poultry per week Avg meat per week Average of frequency the households living in the village eat meat per week Avg game meat per week Average of frequency the households living in the village eat game meat per week
This table identifies the average frequency households eat fish or meat per week.
Note: We have to determine the significant # fish/meat per week that represents the
minimum dietary energy consumption.

EMP 2010 Annual Individual Report on Vulnerability 86
Frequency of eating (Fish, Poultry, Meat, Game meat)
0
1
2
3
4
5
6
Bégad
aBéla Béro
Danmad
jaDild
o
Dokaïdi
lti
Madjo
Mbanga
Mouarom
Ngalaba
Ave
rage
per
wee
k
FishPoultryMeatGame meat
Cereal bags excess between # bags used last seasonand # bags in stock for the next season
for HHs surveyed
-25
-20
-15
-10
-5
0
5
10
# B
ags
Bags excess
This food indicator identifies the number of households that have entered the rainy season
(i.e. hungry season) with sufficient stock to last until the first harvesting begins.

EMP 2010 Annual Individual Report on Vulnerability 87
This chart was made from the following data: how many bags were used during the last rainy
season and how many bags are in stock before the next rainy season. A calculate field gave
us how many bags will supposedly be in excess (or missing if < 0) at the end of the next
rainy season. Then the chart represents the distribution of this surplus or deficit among
households.