esso exploration & production chad inc. village...
TRANSCRIPT
Page 1 of 22
Esso Exploration & Production Chad Inc.
Village Impact Quarterly Report
Land Use Mitigation Action Plan
First Quarter 2012
Prepared by the EMP Department April 2012
Page 2 of 22
Table of Contents
Page Executive Summary 4 1.0. Village Classification 6
1.1. Land Use Criteria and Trends 7 1.2. Compensated and Returned Land by Land Use Type 9 1.3. Socio-Economic Criteria 10
2.0. Socio-Economic Monitoring 12 2.1. Surveys: Status Update 12
2.2. Impact survey: Analysis of Ngalaba trends over time 13 2.3. Real time management of data and eligibles 14
3.0. Milestones of Q1-2012 3.1. Improved agriculture training: A producer meets the
challenge heads on. 15 3.2. Literacy training: the 2012 class moves forward 16 3.3. The return of flow lines: killing two birds with one stone 17
Conclusion 18 Annex 1: OFDA Village Map Annex 2: Village Classification Criteria’s

Page 3 of 22
List of Acronyms & Terms Used in this Report BBS CRCP CdM EEPCI Eligible EMP EMP-IS ECMG HH HHH HHM IAT IFC LCC MARP NGO Potential Eligible Project Footprint True Eligible VLUS WBG EFC V Process
Basic Business Skills Training Chad Resettlement and Compensation Plan Household Chief (Chef de Ménage) Esso Exploration & Production Chad Inc (the Project) Generic term to designate an individual that may be eligible to the EMP Resettlement Program. Environmental Management Plan EMP Information System: manages Land Acquisition, Socioeconomic and Land return data. External Compliance Monitoring Group Household Head of Household Household Member. Include the CdM and all it dependents, regardless their age. International Finance Corporation Improved Agriculture Training Local Community Contact Participatory Rural Assessment process Non-Governmental Organization Individual that may be eligible to the EMP Resettlement Program. Analysis must be completed. Total area occupied by the project at a given time (e.g. Compensated but not returned land) Individual eligible to the EMP Resettlement Program. Village Land Use Survey previously called Cadastral survey. Refer to the measurement of every field, fallow & house of households. World Bank Group Eligibility Factor Class V Process refers to the monitoring of each interaction with an individual. Under this acronym the VX refers to the version of the survey for the specific individual. For example the V2 would refer to the data relating to the second survey for the individual. As a new survey takes place with each interaction/land transaction between individuals and EEPCI we thus have the basis of a continuous monitoring process.
Page 4 of 22
Executive Summary The Quarterly Village Report provides information to Esso Exploration & Production Chad Inc (EEPCI) management and the International Finance Corporation (IFC) on the progress made in calculating, analyzing and reducing the EEPCI Oil Project (Project) land use impact on villages and households. Tracking and analysis of land use impact is the purpose of Village Impact Classification and the “Watch List”. The classification follows the movement of a village from one category to another in order to judge the effectiveness of Environmental Management Plan (EMP) Chad Resettlement and Compensation Plan’s (CRCP) implementing procedures (e.g. the Land Management Manual) and the system improvements made through the Land Use Mitigation Action Plan (LUMAP) or to signal when ongoing Project land take requires the Project to review the situation and adjust plans as per the Environmental Management Plan (EMP) principles. The village impact classification (high, approaching high, medium and low) is also used to:
• Improve the targeting of mitigation activities by more clearly defining an OFDA village’s specific problems.
• Determine eligibility (actual versus estimated land acquisition) for Supplemental Community Compensation.
The First Quarter 2012 (1Q12) Village Impact summary:
• 3 High impact villages (Poutouguem, Danmadja and Missimadji) • 6 approaching high villages • 5 moderate impact villages • 15 low impact villages
The reduced footprint of the Project in Bero, reduction of 8.3 ha, resulted in a change of the impact classification from high to approaching high for this community. In addition to Bero the villages of Bela and Begada saw a significant reduction in the Projects footprint of respectively 12.1 ha and 7.6 ha. Only 5 villages saw an increase in the Project’s footprint (table 1). The village which saw the biggest increase was Miandoum with an increase of 3.0 ha. It must be noted that in total the increase in the Project’s footprint in these five villages was of 5.2 ha. The primary accomplishments of 1Q12 are: EMP-IS
• Continued work of the development, in partnership with EMP-Construction, of a strategy to accelerate the return of flow-lines, OHL and Borrow Pits through a bundling process addressing in this way our will to accelerate the reduction of our footprint while addressing to a large extent the fragmentation issue.
• Start cadastral survey for Miandoum NW (Ndoheuri and Dogoi). • Continue follow up of households impacted by the project, using improved impact survey process.
Resettlement Program
• Start preparation of the Annual Individual Restoration Report for 2011. • Organize a workshop in order to review the performance of the Five Steps of Reflection held in
November and December 2011. • Organize a workshop in order to review the performance of the Improved Agriculture Training
Program in 2011. • 29 eligibles were identified as being admissible for the Resettlement program and were informed of
this fact. • Organized and held 5 Steps of Reflection (as per the reviewed process developed in the previous
quarter) with the 29 new eligibles, accompanying them in the selection of their resettlement option. All of them have opted for improved agriculture training.
Page 5 of 22
• Material and process for the Five Steps of Reflection Process reviewed as per the EMP and the Land Management Manual, in preparation for launching the process in November 2011. Completed the post training phase of the IAT training program for the eligibles of both the 2009 and 2010 classes.
• All 90 members of the 2011 class have completed the dry season portion of the Improved Agriculture Training Program (optional program).
• Distribution of equipment and livestock complement associated with optional dry season program was completed.
• Implementation of the new design for livestock housing, forage storage and grain bins has been associated with a communication campaign which should alleviate most of the concerns that could arise from such a change.
• The contractor providing the Livelihood Restoration Monitoring survey program, ISM Consult, developed and tested an interview process in order to identify the reinforcement process most appropriate for the previously trained eligibles who are deemed to be at risk.
Community Compensation and Supplemental Community Compensation Program • Finalize and publish the Site Specific Plan for Missimadji. • Completed the development of a training program in micro business management taking into account
the needs of the Management Comities of the flour mills established in 2011. • Start development of a training program in micro business management was started by the
contractor providing the Livelihood Restoration Monitoring survey program, ISM Consult, in association with the Cedifop.
• In partnership with Cedifop develop the terms of reference of the Basic Business Skills Training Program (BBS) to be held in the early part of 2012.
Work Plan for Second Quarter 2012(2Q12) • Complete Cadastral survey for Miandoum NW (Ndoheuri and Dogoi). • Develop a strategy to deliver both Community Compensation and resettlement to project affected
communities and individuals of Nya Moundouli. • Implement Mini-MARP process for the village of Missimadji, should result in the selection of their
Supplemental Compensation Asset. • Finalize the Annual Individual Restoration Report for 2011. • Publish 4th Quarter 2011 Village Impact Report.
• Preparation and publish 1st Quarter 2012 Village Impact Report • Hold a workshop in order to review the performance of the Five Steps of Reflection held in November
and December 2011.
• Hold a workshop in order to review the performance of the Improved Agriculture Training Program in 2011.
• Develop the terms of reference for the post training phase of the IAT training program for the eligibles registered in the 2011 IAT class.
• Implement strategy to accelerate the return of flow-lines through a bundling process. • Resume the land return survey process for land returned between June 2011 and May 2012, process
to be completed during third quarter.

Page 6 of 22
1.0 Village Classification The village classification is calculated using land use (area of temporary and permanent take) and two socioeconomic criteria (see annex 2 for details). Each criterion classifies a village into one of four categories: High, Approaching High, Moderate and Low. It should be noted that the socio-economic criterion made possible by investigation using the Village Land Use Survey (VLUS) methodology provides a more direct measure of impact, and that this information is continuously upgraded using the data collected through the Impact and Land return Surveys. This process measures land holdings per capita and the number of currently non-viable individuals among the total population of the village. For villages where the survey is not completed or is not being implemented, we have had to rely on declarative data collected during land compensation in past years; therefore the criterion becomes individuals made non-viable by Project compared to the population of the village.
Table 1 : Village Classification Last Quarter
Categories Villages - 1Q12 Villages – 4Q11
High • Poutouguem • Danmadja • Missimadji
• Poutouguem • Danmadja • Missimadji • Bero
Approaching High (Watch List)
• Bero • Dokaïdilti • Maïkéri • Ngalaba • Dildo-Bayande • Bela
• Dokaïdilti • Maïkéri • Ngalaba • Dildo-Bayande • Bela
Moderate
• Madjo • Mbanga • Maïnani • Madana Nadpeur • Begada
• Madjo • Mbanga • Maïnani • Madana Nadpeur • Begada
Low
• Ndoheuri • Kaïrati • Bendo • Mouarom • Meurmeouel • Kome • Ndolobe • Miandoum • Morkete • Naïkam • Maïmbaye • Koutou Nya
• Ndoheuri • Kaïrati • Bendo • Mouarom • Meurmeouel • Kome • Ndolobe • Miandoum • Morkete • Naïkam • Maïmbaye • Koutou Nya
Low (Declared low through other processes)*
• Bedara* • Bekia 2 • Bekia 3
• Bedara* • Bekia 2 • Bekia 3
Villages in bold have a Site Specific Plan (SSP). * Villages added to the list may have received Community Compensation but may not have lost land to the Project. When the resident of a village is impacted by the Project even if impacted field is located in another village the village of residence is automatically classified as being in the low impact category and receives the corresponding Community Compensation.
It must be noted that a reduction of the project’s footprint in Bero resulted in the village moving from the high to the approaching high category. The decision to reduce the project’s impact level category at this time is also based on the fact that very significant tracks of land should be returned

Page 7 of 22
to this community over the next quarter possibly resulting in further downward trend of the Project’s potential impact.
As per the LUMAP, Site Specific Plans (SSP) were developed for the most impacted villages (12 villages). Villages for which an SSP was prepared are presented in bold in Table 1 (page 6). In all villages where SSPs were completed and fully implemented (10 villages), only low residual impacts remain. It should be noted that no village has changed position or category over this quarter. With the completion of the construction of the schools in Maikeri Village and Poutouguem only two (2) SSP’s are still in the process of implementation. For the last two villages concerned with this process (Dokaïdilti and Bero 3). At the present time the Project is in discussions to finalize their choice of Supplemental Community Compensation project. It should be noted that an SSP has been prepared for the village of Missimadji, the Mini-MARP process will be launched shortly. 1.1 Land Use Criteria and Trends From a land use perspective the criterion is the area of the village affected by the project, note that some villages can pass from High to Moderate or Moderate to Low as temporary land is returned, or move up as land is acquired. As shown in figure 1, the footprint of permanently and still temporarily occupied acquired land (in the three original fields) was reduced by slightly more than 40 ha during the 1Q12. Generally speaking the Project’s footprint has maintained a downward trend over the last year and a half in spite of the establishment of new facilities. The land returned is not the only factor that counterbalances the new land take. The second factor is due to the fact that many of the new facilities being established are in areas previously occupied by the project. An area already compensated for an initial facility is simply reused for the new well, if it has not yet been returned, without requiring much additional land acquisition. Using the fault block approach in reclaiming land i.e. postponing reclamation until the work in the fault block has been completed, reduces the risk of wasting top soil by re-acquiring newly reclaimed land. Top soil in the OFDA and elsewhere in southern Chad is a scarce resource. The calculation of additional land acquired is not straightforward as new facilities are now overlapping old facilities. Simple addition or subtraction would compute the same area twice to determine how much land has been acquired or returned (delta column) compared to the previous quarter. When we consider the information presented in Table 2 we can easily note that the actual reduction in the area occupied by the Project is not only limited to the case of villages located in the three original fields (Kome, Bolobo and Miandoum) but it also reflects the situation of villages located in the newer development areas of the OFDA (Maikeri, Timbre and Nya oil fields). During the first quarter 2012, 7 villages saw an actual reduction in the Project’s footprint on their territory, 13 saw no change and 5 villages were affected by an increase of the Project’s footprint. Of

Page 8 of 22
these villages, Miandoum saw the largest increase in the project’s footprint (3 ha). We must nonetheless note that the area occupied by the project at present is lower than the peak land use in this village (presently 59.6 against a maximum of 62 ha). The fact that the Project’s impact during this quarter was mainly focused on few villages does reflect the reality associated with the in filling process. Similarly land return mainly took place in Béla, Béro and Bégada three villages targeted in the two last quarters of 2011 for infill drilling. Table 2: Land Use by Village in OFDA.
As the Impact and Land-Return Survey processes became fully operational, identification of the impacted land users can be calculated when or shortly after the impact has taken place (real time). Since January 2012, the Impact Survey (both land take and land return) data has been fully integrated into the system, the Project is thus able to make full use of this information at present. Sections 2.2 highlight the impact of this updated information on the situation of the villagers of Ngalaba. If we consider the maximum land use of the Project, each of the 25 villages, on which such data is presented in the table 2, has known a reduction of its footprint in relation to its land use peak. It should be noted that although 5 villages have seen the project’s footprint increase, during the last quarter, the Project has returned more land over the last few years than it is presently taking. As the integration of impact survey data was completed, all impacted individuals who are deemed to have been made non-viable by the Project or who were already non-viable before being impacted by
Delta
% (ha) % (ha) (ha)Danmadja 480 63.6 12.6% 60.4 12.6% 60.7 0.3Ngalaba 2120 330 12.0% 253.7 12.0% 254.8 1.1Missimadji 181 60 11.4% 20.7 11.4% 20.7 0Béro 5713 664.6 11.0% 629.4 10.9% 621.1 -8.3Dokaïdilti 689 157 10.9% 75.4 10.9% 72.3 0Mouarom 1350 159 10.7% 144.7 10.7% 153.7 0Dildo-Bayande 1890 203 10.0% 188.4 10.0% 188.4 0Bégada 3272 348 9.7% 318 9.5% 310.4 -7.6Maïkéri 1245 112.8 8.9% 111.2 9.0% 111.7 0.5Poutouguem 562 62 8.9% 49.8 8.3% 46.8 -3Béla 2200 225 8.7% 190.6 8.1% 178.5 -12.1Mbanga 3044 253 6.9% 210.8 6.8% 207.5 -3.3Madjo 2138 148.8 6.3% 133.8 6.1% 129.5 -4.3Maïnani 1386 86.3 5.9% 81.2 5.9% 81.5 0.3Madana Nadpeur 295 17 5.7% 16.7 5.7% 16.7 0Kaïrati 187 6 2.9% 5.4 2.9% 5.4 0Ndoheuri 708 31 3.2% 22.6 2.6% 18.4 -4.2Meurmeouel 1128 22 1.9% 21.4 1.9% 21.4 0Miandoum 4061 62 1.4% 56.6 1.5% 59.6 3Naïkam 1445 28 1.1% 16.4 1.1% 16.4 0Komé Ndolobe 2441 81 1.0% 25.2 1.0% 25.2 0Bendo 761 17 0.9% 6.9 0.9% 6.9 0Koutou Nya 1818 8.9 0.5% 8.9 0.5% 8.9 0Mainbaye 420 1.3 0.3% 1.3 0.3% 1.3 0Morkété 440 7 0.1% 0.5 0.1% 0.5 0Total 39974 6.6% 2650 6.6% 2618.3 -37.6* Land use = permanent + temporary not returned OFDA = Concessions of Kome, Timbre, Bolobo, Miandoum, Maïkeri and Nya
Village Total area (ha)Maximum
land use (ha)
Land useQ1 2012
Land useQ4 2011

Page 9 of 22
the Project, before November 1st 2012, have been integrated into the roster of the 2012 Resettlement Promotion, presently undergoing literacy. As we forge ahead to complete the integration of the tools and processes developed under the LUMAP into the daily routine of the EMP’s Socioeconomics, we have also completed a thorough review of the processes leading to and including the Five Steps of Reflection. This revised process was used in the later portion of 2011. It resulted in a further integration of all of the EMP team members involved in the process such as the Local Community Contacts (LCC), the Socio-economic Monitors, EMP IS System Administrators and Database Specialists, the survey teams (Synergy, Impact, Fragmentation and Land Return), Socioeconomic Advisor, and EMP Socioeconomics Supervisors, LUMAP Project Managers and the resettlement and community compensation contractor management firm (ISM Consult). In doing so our goal was to further enhance the interconnection between the various players and ultimately improve relations with the communities and eligible individuals to seamlessly deliver the Five Steps of Reflection Process sustainably over time. 1.2 Compensated and Returned Land by Land Use Type This section presents the compensated and returned areas. Table 3 shows the current portion of each Land Use Type out of the total Compensated Land. The “Returned” column shows the number of hectares returned (on the left) and the percentage of returned area out of the total compensated area (on the right), for each land use type. It should be noted that this data covers all of the land requirements in Kome, Bolobo, Miandoum, Maikeri, Nya and Timbre oil fields. As was presented in Table 2 (page 8) the data presented below (Table 3 on page 11) confirms that land returned more than compensated for new land take with a net footprint decrease over the quarter. During the last quarter only 31.1 ha of land was compensated for, by the Project, while 71.6 ha were returned to the communities. Overall, this resulted in 40.5 ha of net land return during this period. Contrary to what occurred in previous quarters, most of the land compensated during this period was for permanent use. In fact, land required for permanent use represented 52% of the quarter’s land take versus only 35% for the last quarter. It must be noted that land returned in the temporary category (71 ha) exceeded new temporary land take (15.0), by a significant margin. The Project actually had a net reduction in its temporary land use of 56 ha during the quarter. A number of initiatives are being developed in order to accelerate the return of land associated with underground facilities (mainly flow lines) and overhead lines (OHL, referring to power lines). As 926.1 ha are still to be returned in these two categories, returning but a portion of this area would have a significant impact on the project’s footprint.

Page 10 of 22
Table 3: Compensated and Returned Land by Land Use and Facility Type
• The column “total areas in hectares: compensated” shows the total area compensated since the project started up to the end of the quarter covered in this report. • “Total areas in hectares: returned” shows the total area returned since the project started up to the end of the quarter covered in this report. • “1Q2011: Compensated” shows the total hectares compensated during the quarter covered in this report. • “1Q2011: Returned” shows the total hectares returned during the quarter covered in this report. • 6 fields = Kome, Bolobo, Miandoum, Maïkeri, Nya and Timbre • Negative numbers indicate corrections to the data.
1.3 Socio-economic Criteria Village level impact depends both on absolute amounts of land taken or returned and the way in which land resources are allocated within the village. In some villages, people depend mainly on farming for their livelihood. In others, a portion of the inhabitants depend on fishing as well as farming; fishing families in these villages often have (and need) less farmland than in inland villages and may already be below the general threshold of agricultural viability (2/3 cordes per HHM). Others are recently established households who will progressively gain access to land from their family land trust. These households may appear to be non-viable or marginal while in reality they are simply in a transitional phase. Attributing all non-viable household to Project land acquisition in these villages would overstate the Project’s impact. To distinguish between these two types of situations, the social criteria using compensation database information were initially set according to 1) the number of people already non-viable before they were impacted by the project and 2) those that were made non-viable when they lost land to the project. Completed village land surveys have demonstrated that the declarative data used to calculate non-viability often overstated the number of people dependent on the household’s land and understated the amount of land available. Therefore the number of non-viable households found through a village survey presents a more accurate picture of Project impact.
Total area (hectares) 1Q12 (hectares)
Land us type Compensated Returned Compensated Returned
Sub-Total - Permanent with public access-
706.0 38.4 5 % 5.9 0.9
Sub-Total – Permanent with no Public access
993.9 101.1 10 % 10.2 -0.3
Sub-Total Permanent 1699.9 139.5 8 % 16.1 0.6
Borrow Pit 533.9 425.7 80% 3.3 13.0
Others 25.9 17.4 67% 1.2 -0.4
Sub-Total – Temporary returned without restriction
559.7 443.2 79% 4.4 12.7
Underground facility 992.3 370.0 37% 3.8 60.8
OHL 329.4 80.7 24% -1.3 0.0
Well Pad 535.7 474.1 89% 8.2 0.7
Sub-Total – Temporary returned with restriction
1857.4 924.8 52% 10.6 58.3
Sub-Total Temporary 2417.1 1368.0 59% 15.0 71.0
Grand Total 4117.0 1507.5 38% 31.1 71.6
Page 11 of 22
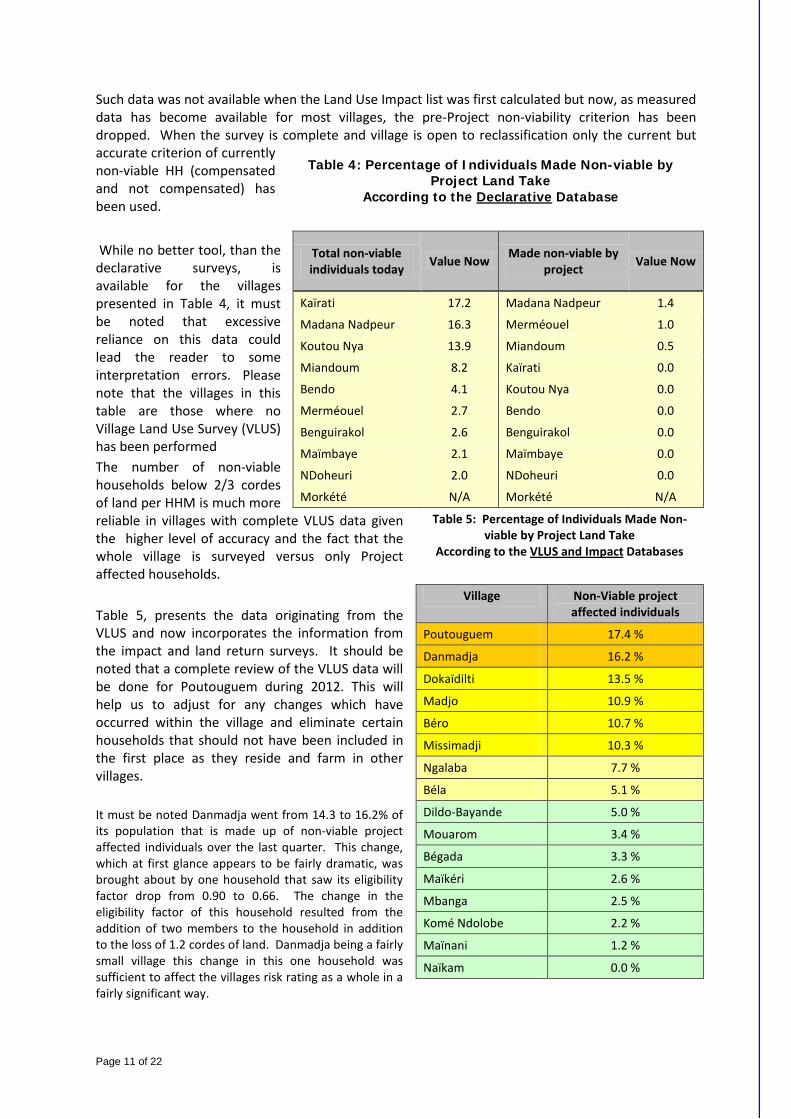
Such data was not available when the Land Use Impact list was first calculated but now, as measured data has become available for most villages, the pre-Project non-viability criterion has been dropped. When the survey is complete and village is open to reclassification only the current but accurate criterion of currently non-viable HH (compensated and not compensated) has been used. While no better tool, than the declarative surveys, is available for the villages presented in Table 4, it must be noted that excessive reliance on this data could lead the reader to some interpretation errors. Please note that the villages in this table are those where no Village Land Use Survey (VLUS) has been performed The number of non-viable households below 2/3 cordes of land per HHM is much more reliable in villages with complete VLUS data given the higher level of accuracy and the fact that the whole village is surveyed versus only Project affected households. Table 5, presents the data originating from the VLUS and now incorporates the information from the impact and land return surveys. It should be noted that a complete review of the VLUS data will be done for Poutouguem during 2012. This will help us to adjust for any changes which have occurred within the village and eliminate certain households that should not have been included in the first place as they reside and farm in other villages. It must be noted Danmadja went from 14.3 to 16.2% of its population that is made up of non-viable project affected individuals over the last quarter. This change, which at first glance appears to be fairly dramatic, was brought about by one household that saw its eligibility factor drop from 0.90 to 0.66. The change in the eligibility factor of this household resulted from the addition of two members to the household in addition to the loss of 1.2 cordes of land. Danmadja being a fairly small village this change in this one household was sufficient to affect the villages risk rating as a whole in a fairly significant way.
Total non-viable individuals today Value Now Made non-viable by
project Value Now
Kaïrati 17.2 Madana Nadpeur 1.4
Madana Nadpeur 16.3 Merméouel 1.0
Koutou Nya 13.9 Miandoum 0.5
Miandoum 8.2 Kaïrati 0.0
Bendo 4.1 Koutou Nya 0.0
Merméouel 2.7 Bendo 0.0
Benguirakol 2.6 Benguirakol 0.0
Maïmbaye 2.1 Maïmbaye 0.0
NDoheuri 2.0 NDoheuri 0.0
Morkété N/A Morkété N/A
Table 5: Percentage of Individuals Made Non-viable by Project Land Take
According to the VLUS and Impact Databases
Village Non-Viable project
affected individuals
Poutouguem 17.4 %
Danmadja 16.2 %
Dokaïdilti 13.5 %
Madjo 10.9 %
Béro 10.7 %
Missimadji 10.3 %
Ngalaba 7.7 %
Béla 5.1 %
Dildo-Bayande 5.0 %
Mouarom 3.4 %
Bégada 3.3 %
Maïkéri 2.6 %
Mbanga 2.5 %
Komé Ndolobe 2.2 %
Maïnani 1.2 %
Naïkam 0.0 %
Table 4: Percentage of Individuals Made Non-viable by Project Land Take
According to the Declarative Database

Page 12 of 22
2. Socioeconomic monitoring
2.1. Village Surveys Table 6: Total Number of HH Survey by Village
Village Cadastral survey
completed
Impact Survey completed
Land return survey completed
Monitoring Surveys completed
total
Total HH Survey
completed Q1-2012 Total Q1-2012 Total
Bégada 263 4 176 12 138 9 586
Béla 145 3 77 8 28 4 254
Bero 602 10 197 14 86 44 929
Danmadja 102 18 57 8 40 21 220
Dildo-Bayande 276 0 34 0 7 18 335
Dokaïdilti 85 0 9 0 0 11 105
Komé 200 1 2 0 0 0 202
Madjo 131 2 73 13 58 20 282
Maikeri 141 14 54 2 18 3 216
Maïnani 112 5 20 0 3 3 138
Mbanga 270 5 192 1 26 14 502
Missimadji 24 2 3 0 1 4 32
Mouaroum 85 4 10 0 23 2 120
Naïkam 54 0 0 0 0 0 54
Ngalaba 251 22 140 5 47 20 458
Poutouguem 61 1 31 0 25 0 117
Other villages 11 0 17 1 1 88 117
Total 2813 91 1092 64 501 261 4667
The objective is to use the data generated by these various surveys and investigations to track each community and household over time. Ensuring that the specific impact, whether they be a land take or a land return, are accounted for and that the Resettlement option selected achieved its livelihood restoration goal. Integrating all of this information will allow tracking the communities over time ensuring that each community and individual HHH receives the kind of support which is best suited to his/her situation as well as process and performance indicators regarding the effectiveness of the Chad Resettlement and Compensation Plan (CRCP) implementing procedures. Impact surveys: The Project is now surveying impacted HHs and integrating this information into the EMP IS on a real time basis. 91 new surveys were completed and integrated during this quarter. Most of these surveys were related to the villages of Ngalaba, Maikeri, Danmadja and Bero. Land Return: As is the case for the impact surveys the land surveys are presently being done in real time. 64 Land Return surveys were completed during the quarter. Most of the surveys were related to land return activities in the villages of Begada, Bero, Madjo and Bela. The fact that 20% of these surveys took place in Madjo is related to the reduction in the project’s footprint and the ensuing improvement of the village impact classification. Livelihood Restoration Monitoring: The first stage of the monitoring process is now completed. Section 2.3 outlines a brief description of the reinforcement process that is presently being implemented. The monitoring process for 2012 has been launched. During the current year 79 individuals will be surveyed. Of this number, the 29 that make up the 2012 class will be surveyed in an effort to create a baseline or reference point from which we will be able to measure our progression in the future.
Page 13 of 22
2.2 Impact Survey: Analysis of Ngalaba village trends over time.
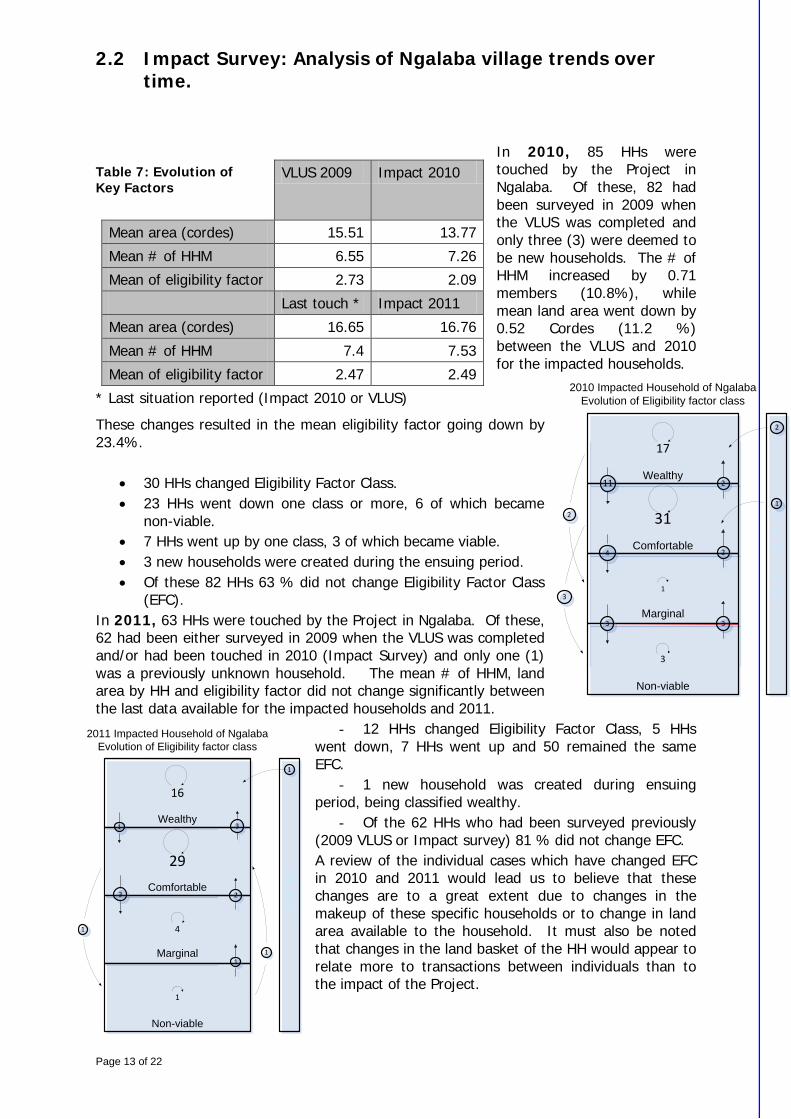
In 2010, 85 HHs were touched by the Project in Ngalaba. Of these, 82 had been surveyed in 2009 when the VLUS was completed and only three (3) were deemed to be new households. The # of HHM increased by 0.71 members (10.8%), while mean land area went down by 0.52 Cordes (11.2 %) between the VLUS and 2010 for the impacted households.
These changes resulted in the mean eligibility factor going down by 23.4%.
• 30 HHs changed Eligibility Factor Class. • 23 HHs went down one class or more, 6 of which became
non-viable. • 7 HHs went up by one class, 3 of which became viable. • 3 new households were created during the ensuing period. • Of these 82 HHs 63 % did not change Eligibility Factor Class
(EFC). In 2011, 63 HHs were touched by the Project in Ngalaba. Of these, 62 had been either surveyed in 2009 when the VLUS was completed and/or had been touched in 2010 (Impact Survey) and only one (1) was a previously unknown household. The mean # of HHM, land area by HH and eligibility factor did not change significantly between the last data available for the impacted households and 2011.
- 12 HHs changed Eligibility Factor Class, 5 HHs went down, 7 HHs went up and 50 remained the same EFC.
- 1 new household was created during ensuing period, being classified wealthy.
- Of the 62 HHs who had been surveyed previously (2009 VLUS or Impact survey) 81 % did not change EFC. A review of the individual cases which have changed EFC in 2010 and 2011 would lead us to believe that these changes are to a great extent due to changes in the makeup of these specific households or to change in land area available to the household. It must also be noted that changes in the land basket of the HH would appear to relate more to transactions between individuals than to the impact of the Project.
Table 7: Evolution of Key Factors
VLUS 2009 Impact 2010
Mean area (cordes) 15.51 13.77
Mean # of HHM 6.55 7.26
Mean of eligibility factor 2.73 2.09
Last touch * Impact 2011
Mean area (cordes) 16.65 16.76
Mean # of HHM 7.4 7.53
Mean of eligibility factor 2.47 2.49
* Last situation reported (Impact 2010 or VLUS)
17
31
1
3
11
2010 Impacted Household of NgalabaEvolution of Eligibility factor class
Wealthy
Comfortable
Marginal
Non-viable
4 2
New
HH
12
2
3
3 3
2
16
29
4
1
NEW
2
2011 Impacted Household of NgalabaEvolution of Eligibility factor class
Wealthy
Comfortable
Marginal
Non-viable
3
1
1
1
3
1
1
Page 14 of 22
2.3 Monitoring and reinforcement of eligibles a path for the future
Over the first three quarters of 2011, 268 previously trained resettlement eligible candidates were surveyed. The objective of this process was to determine the extent to which the resettlement training option they chose was successful in helping them restore their livelihood to pre-impact level. The evaluation of their level of restoration was based on their economic situation (value of the buildings and assets owned by the HH used as a proxy), the efficiency of the training and a number of key failure factors. In general we can conclude from this work that:
- 76 HH (29%) appear to be in a more difficult position as they have not been able to accumulate a significant amount of wealth in the form of buildings and assets. Training was generally effective in that most graduates use learned knowledge and skills. Only 56 (24%) of the eligibles have not found the training to be effective in their case.
- 60 (23%) triggered two or three indicators indicating that they are facing a real challenge. A further review of this information made it possible to identify 68 households that still struggled in recovering at a satisfactory level. A decision was made to target these household for reinforcement, in order to support them in their recovery effort. In order to be effective, such an effort must be unrestricted and address the needs of the eligible in his traditional activity. The Project thus opted for an individualized or case-by-case approach.
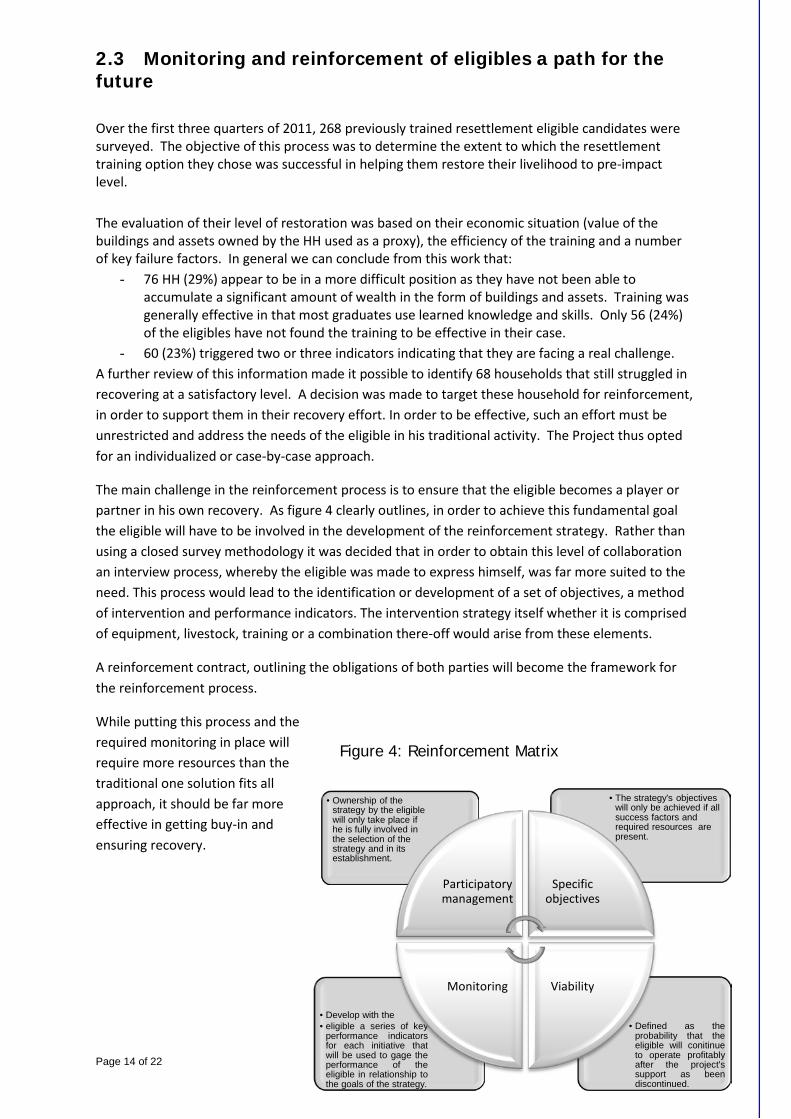
The main challenge in the reinforcement process is to ensure that the eligible becomes a player or partner in his own recovery. As figure 4 clearly outlines, in order to achieve this fundamental goal the eligible will have to be involved in the development of the reinforcement strategy. Rather than using a closed survey methodology it was decided that in order to obtain this level of collaboration an interview process, whereby the eligible was made to express himself, was far more suited to the need. This process would lead to the identification or development of a set of objectives, a method of intervention and performance indicators. The intervention strategy itself whether it is comprised of equipment, livestock, training or a combination there-off would arise from these elements.
A reinforcement contract, outlining the obligations of both parties will become the framework for the reinforcement process.
While putting this process and the required monitoring in place will require more resources than the traditional one solution fits all approach, it should be far more effective in getting buy-in and ensuring recovery.
• Defined as the
probability that the eligible will conitinue to operate profitably after the project's support as been discontinued.
• Develop with the • eligible a series of key
performance indicators for each initiative that will be used to gage the performance of the eligible in relationship to the goals of the strategy.
• The strategy's objectives will only be achieved if all success factors and required resources are present.
• Ownership of the strategy by the eligible will only take place if he is fully involved in the selection of the strategy and in its establishment.
Participatory management
Specific objectives
Viability Monitoring
Figure 4: Reinforcement Matrix
Page 15 of 22
3.0 Milestones of Q1-2012
3.1. Improved agriculture training: A producer meets the challenge heads on.
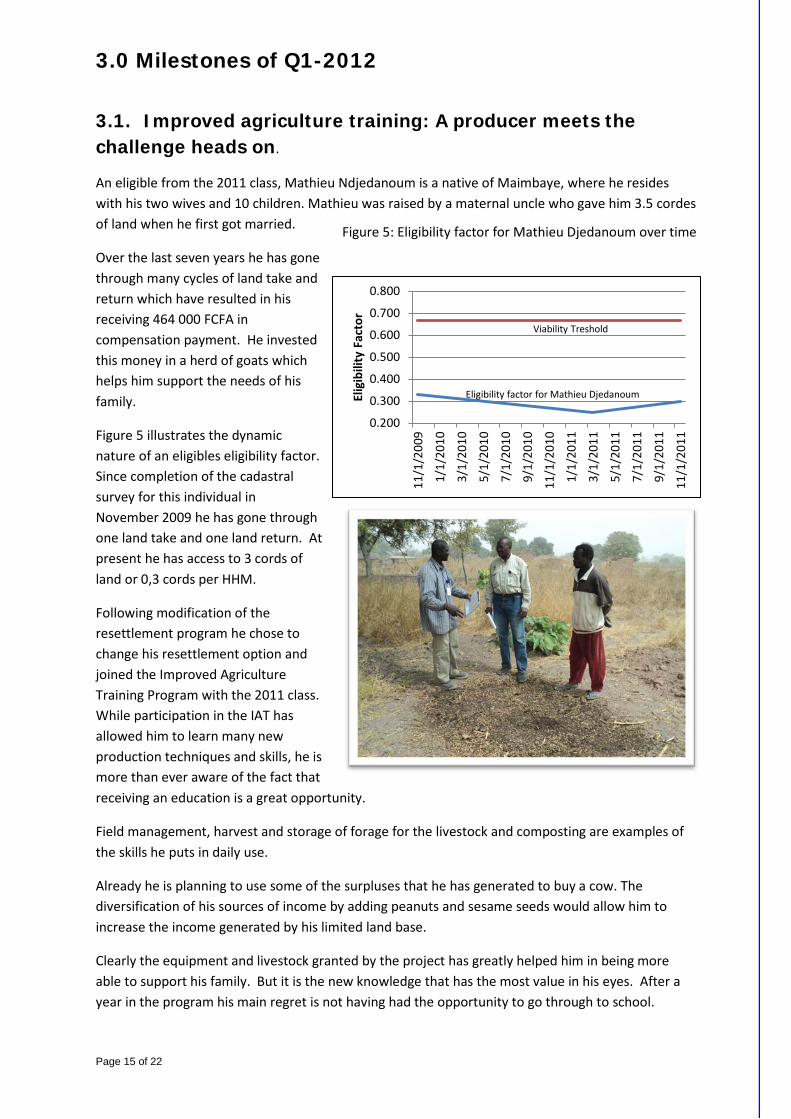
An eligible from the 2011 class, Mathieu Ndjedanoum is a native of Maimbaye, where he resides with his two wives and 10 children. Mathieu was raised by a maternal uncle who gave him 3.5 cordes of land when he first got married.
Over the last seven years he has gone through many cycles of land take and return which have resulted in his receiving 464 000 FCFA in compensation payment. He invested this money in a herd of goats which helps him support the needs of his family.
Figure 5 illustrates the dynamic nature of an eligibles eligibility factor. Since completion of the cadastral survey for this individual in November 2009 he has gone through one land take and one land return. At present he has access to 3 cords of land or 0,3 cords per HHM.
Following modification of the resettlement program he chose to change his resettlement option and joined the Improved Agriculture Training Program with the 2011 class. While participation in the IAT has allowed him to learn many new production techniques and skills, he is more than ever aware of the fact that receiving an education is a great opportunity.
Field management, harvest and storage of forage for the livestock and composting are examples of the skills he puts in daily use.
Already he is planning to use some of the surpluses that he has generated to buy a cow. The diversification of his sources of income by adding peanuts and sesame seeds would allow him to increase the income generated by his limited land base.
Clearly the equipment and livestock granted by the project has greatly helped him in being more able to support his family. But it is the new knowledge that has the most value in his eyes. After a year in the program his main regret is not having had the opportunity to go through to school.
0.200
0.300
0.400
0.500
0.600
0.700
0.800
11/1
/200
9
1/1/
2010
3/1/
2010
5/1/
2010
7/1/
2010
9/1/
2010
11/1
/201
0
1/1/
2011
3/1/
2011
5/1/
2011
7/1/
2011
9/1/
2011
11/1
/201
1
Elig
ibili
ty F
acto
r
Eligibility factor for Mathieu Djedanoum
Viability Treshold
Figure 5: Eligibility factor for Mathieu Djedanoum over time

Page 16 of 22
3.2 Literacy training: the 2012 class moves forward In January 2012 the 29 impacted individuals who had been deemed eligible started their literacy training class. As was the case in 2011, all eligibles selected Improved Agriculture Training (IAT) as their resettlement option. Literacy training or the Basic Business School (BBS) being a requirement to gain entry into the IAT or the other off farm training programs available through the resettlement program these eligibles joined 22 of their spouses and 164 auditors distributed in 8 training centers. Over the first Quarter of 2012 all participants completed an intensive training program which covered a host of topics dealing with basic reading and writing skills in Ngambay, management, home economics, hygiene and basic health. In order to check on the performance and skill level of participants, individualized tests covering the various topics offered in the program where completed. In general results were good and all eligibles received a passing grade. Eligibles and the auditors who wish to will now enter the second phase of the BBS program, during which they will receive additional training in the subjects mentioned before to support their place of residence. The objective of this phase is to ensure that they integrate these skills into their daily lives. After having been an auditor for three years Augustine Dandé was selected as an eligible and incorporated into the 2012 class with her 28 other class mates. Wife of the local medical practitioner she is quite aware of the value of a basic education. Every time she goes through the BBS program she learns new skills which help her improve her life and that of her 6 children. While she will complete the requirements for entry into the Improved Agriculture Training Program she has already confirmed that she will be back next year “God Willing”.
While Josephine Lonodjigoto a single mother, decided to enrol in the BBS in order to meet the entry requirements of the IAT She has since discovered the joy of learning and the importance of the basic skills she is learning and passing on to her children. Whether it is learning to read or write, or notions of hygiene, these skills make it possible to better care for her children and herself. As was the case for Augistine, Josephine confirms that she will be back next year.
One of the auditors present at the Begada training centre, Genevieve Deneralarhas has been taking part in the BBS training program, for the last three years. Her husband has supported her involvement in this program from the start. They both feel that the time spent away from home and their 6 children is more than compensated by the skills she has learnt. Learning about inventory management has allowed her to better plan the use of their grain crop and ensure the dietary needs of the family through the dry season. Although she, as is the case for many other participants, is often ridicule by certain members of the community who simply do not understand the advantages associated with learning new things, She feels that what she learns is a precious gift that she must share with her husband and children. She, as many others, will be back next year.
Page 17 of 22
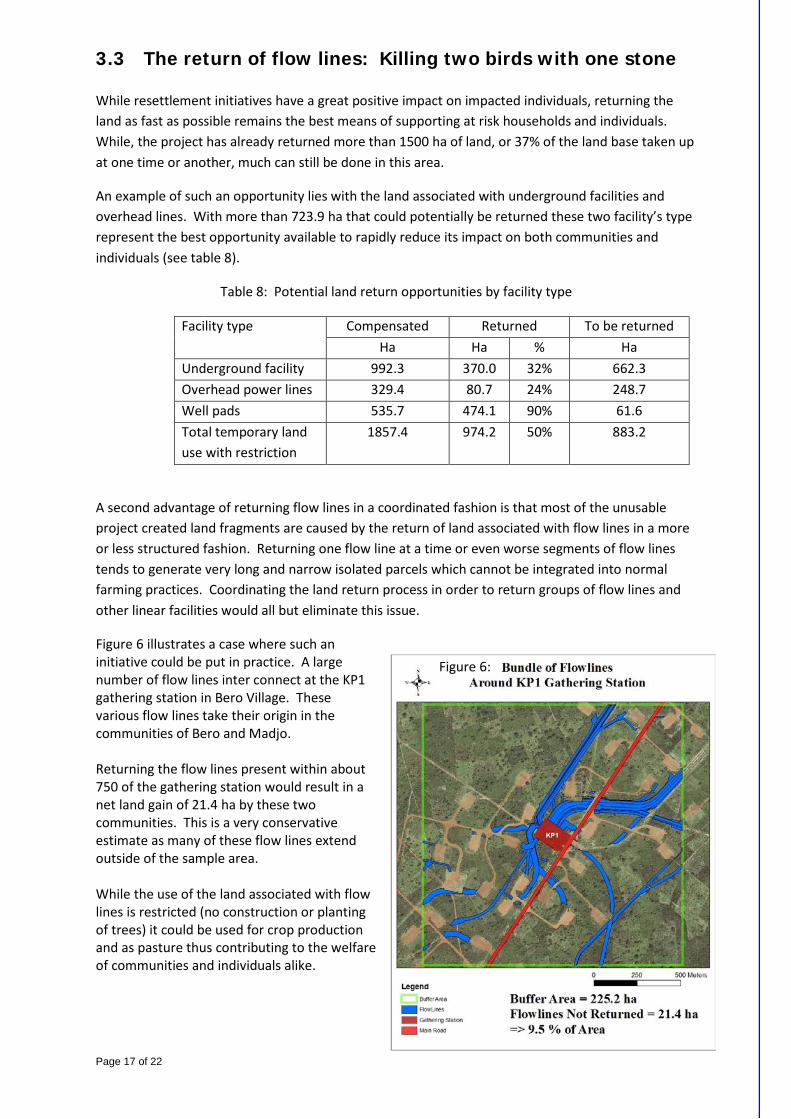
3.3 The return of flow lines: Killing two birds with one stone While resettlement initiatives have a great positive impact on impacted individuals, returning the land as fast as possible remains the best means of supporting at risk households and individuals. While, the project has already returned more than 1500 ha of land, or 37% of the land base taken up at one time or another, much can still be done in this area.
An example of such an opportunity lies with the land associated with underground facilities and overhead lines. With more than 723.9 ha that could potentially be returned these two facility’s type represent the best opportunity available to rapidly reduce its impact on both communities and individuals (see table 8).
Table 8: Potential land return opportunities by facility type
Facility type Compensated Returned To be returned Ha Ha % Ha
Underground facility 992.3 370.0 32% 662.3 Overhead power lines 329.4 80.7 24% 248.7 Well pads 535.7 474.1 90% 61.6 Total temporary land use with restriction
1857.4 974.2 50% 883.2
A second advantage of returning flow lines in a coordinated fashion is that most of the unusable project created land fragments are caused by the return of land associated with flow lines in a more or less structured fashion. Returning one flow line at a time or even worse segments of flow lines tends to generate very long and narrow isolated parcels which cannot be integrated into normal farming practices. Coordinating the land return process in order to return groups of flow lines and other linear facilities would all but eliminate this issue.
Figure 6 illustrates a case where such an initiative could be put in practice. A large number of flow lines inter connect at the KP1 gathering station in Bero Village. These various flow lines take their origin in the communities of Bero and Madjo. Returning the flow lines present within about 750 of the gathering station would result in a net land gain of 21.4 ha by these two communities. This is a very conservative estimate as many of these flow lines extend outside of the sample area. While the use of the land associated with flow lines is restricted (no construction or planting of trees) it could be used for crop production and as pasture thus contributing to the welfare of communities and individuals alike.
Figure 6:
Page 18 of 22
Conclusion A major milestone was reached in 2012, the project is now operating in real time in terms of the integration of both Impact and land return survey data. We have thus become more able to respond to the needs of impacted communities and individuals alike. While the VLUS data has allowed us to gain a very good understanding of the processes taking place in the field, the efficient incorporation of the data from these sources will give us a much more dynamic tool to monitor the impact of the Project. From this report we can make the following conclusions:
1. Land reclaimed and returned has exceeded the Project land take net reduction of 40.4 ha in the projects footprint.
2. Site Specific Plan for the village of Missimadji was completed. It should lead to the establishment of supplemental community compensation.
3. The village of Bero saw its “Village Impact Classification” change from high to approaching high following a reduction in the projects footprint in this community.
4. The project continues to have important positive effects on communities and many individuals whether they are Project affected and eligible for resettlement or not.
5. 215 villagers, of which 29 eligibles, completed the basic literacy program which ended in late March.
6. Developed a support program for Community Compensation Management Comities in order to improve their capacity in managing community based projects. This support will, in a first stage, be offered to the flour mills established in 2011. This type of projects facing the biggest challenge in terms of cash, inventory and human resource management.
7. Following completion of the monitoring process and individualized interviews, 68 eligibles that appear to still struggle will receive individualized reinforcement in term of equipment, livestock and/or training over the next few months.
8. A new initiative will be launched in the second quarter of 2012 in order to accelerate the return of land associated with flow lines and other underground facilities.

Annex 1
OFDA Village Impact Map

Annex 2: Village Classification Criteria’s
Land Use Criteria The criteria concerning Land Use impact represents the percentage of village area used by the project within each village. The boundaries of the village used to set the village area are not official and are computed based on a global survey of the village limits. The thresholds between levels of impact represent “natural breaks” or large numerical gaps in between villages. Calculation of Land Use Impact The final percentage used to classify the village’s level of impact is computed by adding the “temporary” land not yet returned land to the land permanently used by the project:
Thresholds High ≥11% Approaching High 7% - 10.9% Moderate 3% - 6.9% Low 0% - 2.9%
Initial Classification with Compensation Data Criterion 1: % all non-viable individuals/all individuals in the village
Description: Percentage of all project-affected individuals in the village currently below the resettlement factor of 2/3.
Rule:
Σ (All individuals below 2/3 cordes after land take)
Village Population
Σ Permanent Not Returned + Temporary Not Returned
Σ Village Area

Threshold: Threshold Criteria 1
Min Max High 50.1% 100% Approaching High 30.1% 50% Moderate 20.1% 30% Low 0% 20%
This criterion includes people who were already non-viable before the Project. Criterion 2: % individuals in the village made non-viable by project land take/all individuals in village Description: Percentage of the number of individuals that were economically viable before surrendering land/feeling any project impact (the resettlement factor > 2/3) but who became agriculturally non-viable upon surrendering land/ after project impact (the resettlement factor < 2/3 cordes). Rule:
Σ (All individuals that were not eligible before land take & are eligible after Land take)
Village Population Threshold:
Threshold Criteria 2 High 20.1% 100.00% Approaching High 15.1% 20.00% Moderate 9.1% 15.00% Low 0% 9%
This criterion cannot be calculated with village land survey results and is no longer applied when a change in village impact classification is calculated.
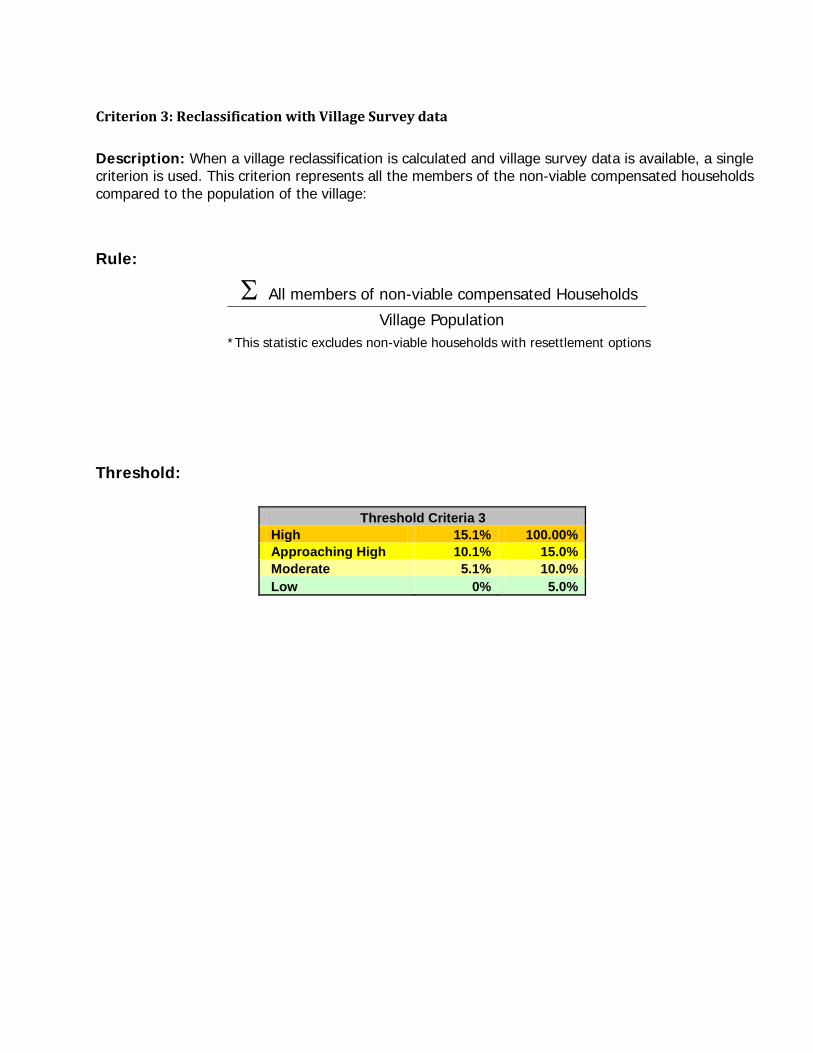
Criterion 3: Reclassification with Village Survey data
Description: When a village reclassification is calculated and village survey data is available, a single criterion is used. This criterion represents all the members of the non-viable compensated households compared to the population of the village:
Rule:
Σ All members of non-viable compensated Households
Village Population *This statistic excludes non-viable households with resettlement options
Threshold:
Threshold Criteria 3 High 15.1% 100.00% Approaching High 10.1% 15.0% Moderate 5.1% 10.0% Low 0% 5.0%